corruption, governance and public spending in nigeria: … · 2016-07-26 · the paper examines the...
TRANSCRIPT

____________________________________________________________________________________________ *Corresponding author: Email: [email protected];
British Journal of Economics, Management & Trade 4(11): 1679-1699, 2014
SCIENCEDOMAIN international
www.sciencedomain.org
Corruption, Governance and Public Spending in Nigeria: Implications for Economic Growth
Okey O. Ovat 1* and Eduno Ededet Bassey 2
1Department of Economics, University of Calabar, Calabar, Nigeria.
2Department of Economics, Akwa Ibom State University, Nigeria.
Authors’ contributions
This whole work was carried out in collaboration between both authors. Both authors read and approved the final manuscript.
Received 31 st March 2014 Accepted 19 th May 2014
Published 27 th June 2014
ABSTRACT
The paper examines the nexus between corruption, governance and public spending and their aggregate effects on economic growth in Nigeria. It maintains that corruption is one scourge and social malaise that militates against good governance, using public spending as one of its conduits to slow down the pace of economic growth in Nigeria. It further traces the root-causes of corruption as well as its dimensions and contends that corruption which is an age–long phenomenon is ubiquitous, permeating the very fabrics of every society irrespective of whether it is a developed or developing nation and not taking cognizance of the economic system in practice, whether planned or market economy. The paper raises and attempts to answer the following research questions: Is there more corruption in Nigeria now than in the past? Is there any correlation between corruption, governance, public spending and economic growth? Does corruption impede governance and hence economic growth and development in Nigeria? To provide panacea to the aforementioned questions and to serve as a basis for sustainable policy action, the paper adopts a descriptive methodology based on analysis of stylized facts on corruption perception indexes, governance, public spending and some social and macroeconomic aggregates. The results indicate that corruption was endemic in Nigeria between 1996 and 2005 but witnessed a slight reduction between 2006 and 2012.The slight reduction notwithstanding, Nigeria is far from being perceived clean. This is due to the fact that between 2006 and 2011 Nigeria has CPI scores of less than 3 out of 10 and 27 out of 100 in 2012 which is far below 50 and ranks 139 out of 176 in 2012. Given this result, Nigeria cannot be perceived clean. The results show a clear correlation between
Original Research Article

British Journal of Economics, Management & Trade, 4(11): 1679-1699, 2014
1680
corruption, governance, public spending and economic growth with adverse aggregate effects on economic growth and development in Nigeria. Which in concrete terms manifest in un-inclusive growth, as evidenced by rising incidence of poverty, unemployment rate, discomfort index, low capacity utilization, low level of investment among others. Since good economic performance is desirable by every nation, the paper made some recommendations aimed at engendering inclusive growth and development in Nigeria.
Keywords: Corruption; good governance; public spending; economic growth; Nigeria. JEL CLASSIFICATION CODES : H50, H53, H57, O10, and O11 1. INTRODUCTION Nigeria is one of the most blessed nations on earth, bestowed with vast human and natural resources. These resources, if properly harnessed, would have made Nigeria to be ranked among the top most developed nations of the world. Paradoxically, despite these abundant resources, the nation is still categorized among the comity of nations tagged underdeveloped. Hunger and poverty are common features in most Nigerian homes. In the words of [1], cited by [2], the common man in Nigeria is “alienated from himself as he lacks the where withal to afford the basic necessities of life such as education, medical facilities etc”. Expectedly, life expectancy is low compared with that obtainable in the developed nations of the world. This sorry state of the Nigerian nation has been blamed on a number of factors by many analysts; chiefly among them include bad governance, mismanagement of funds, misplacement of priority and above all, corruption. Corruption has been singled out as one scourge and social malaise that militates against good governance, using public spending as one of its conduits to slowdown the pace of economic development. Of recent, the phenomenon code-named corruption has attracted a great deal of attention. However, corruption is not a recent phenomenon. It is as old as mankind. For example, as observed by [3], “two thousand years ago kautilya, the prime minister of an Indian kingdom had already written a book, Arthashastra, discussing corruption. It is also worthy of note to observe that Shakespeare gave corruption a prominent role in some of his plays. For example in Julius Caesar, Brutus accused Casius of having an “itching palm” (i.e. being corrupt). Corruption is ubiquitous. It permeates the very fabrics of every society, irrespective of whether it is developed or developing, large or small, planned or market economy. For instance, there had been reports of alarming rate of corruption among top government functionaries in France, where several of them had criminal charges hanging on them, and in Mexico a seventy year corrupt regime of the ruling revolutionary party was booted out of office by the people through democratic means and installed president Vincente of blessed memory [2]. In Africa, Nigeria and Democratic Republic of Congo were quoted as two nations severely hit by corruption, losing close to $ 5billion each in a couple of years before the signing of the anti-corruption treaty worldwide [4]. Again, in Nigeria incidences of corruption such as the pensions fund scam and oil subsidy scam have made news headlines in the print and electronic media. As earlier stated, corruption has no dated history. But the degree of attention now paid to it raises a number of questions. Is there more corruption in Nigeria now than in the past? Is there any correlation between corruption, governance and public spending? Does corruption impede good governance and hence economic development? These are the questions this

British Journal of Economics, Management & Trade, 4(11): 1679-1699, 2014
1681
paper will attempt to answer and therefore constitute the point of departure of the paper. Accordingly, the paper is structured as follows: Section I has been the introduction. Section 2 explores conceptual issues and literature review. Section 3 discusses the causes and dimensions of corruption. In section 4, stylized facts on corruption governance, public spending and some social and macroeconomic aggregates are presented and analyzed to assess the aggregate impact of these variables on economic performance in Nigeria. Finally, section 5 proffers some recommendations and concludes the paper. 2. CONCEPTUAL ISSUES AND LITERATURE REVIEW 2.1 Corruption corruption is a concept that is coined from the latin word, “Corrumpo”, which literally translates to mean “to rot”, to decompose”, to disintegrate” or “to decay.” It is a concept that is often discussed but seldom understood. While it may be difficult to describe, corruption is generally very easy to recognize when observed. A corrupt behavior can easily be identified by different observers as an act of corruption. However an act of corruption cannot be easily observed because in most cases corruption takes place in secret. It is not very easy to define corruption in précised terms. Many authors and analyst have attempted to define the phenomenon in various ways, for example, [5] defines corruption as “an act of being dishonest with a given responsibility or duty for selfish end. It is the use of a position of trust for dishonest and selfish gain. According to [6], corruption is seen as “all actions that temper with or compromise justice and fairness”. [7] conceptualizes corruption as a behavior which involves the violation of established rules for personal gains or profits. [8] views the phenomenon of corruption as an act in which the power of public office is used for personal gain in the manner that contravenes the rules of the game. According to [9], corruption can be viewed as a behaviour of public officials which deviates from accepted norms in order to serve private ends. In a broad sense, the most common definition of corruption is that it entails the use of public office for private gain. This definition does not however mean that corruption does not take place in the private sector. All sectors are plagued by this social malaise. Until recently, when there appears to be a consensus on the negative impact of corruption on governance and hence economic development, in the past the views on corruption were divergent. Some economists argued in support of the view that corruption might promote growth. Countries often mentioned as experiencing high growth rates despite perceived high level of corruption are Indonesia, Thailand and other Southeast Asia countries [3]. Studies in favour of this view are [9,10,11]. According to these studies, corruption “oils the mechanism” or “greases the wheel” of economic growth by removing government imposed rigidities that impede investment and interfere with other economic decisions favourable to growth. Again [12] argues that corruption can save time and allows economic decision taken more quickly. Time to him, has different values for different people depending on their level of income and “opportunity cost of their time”. Thus those for whom time is most valuable will offer bribes to public officials to be allowed to “economize” on time by “jumping in front of the line”. In this case corruption brings about efficiency by saving time for those whom time has the greatest value. [3] is also of the view that corruption accelerates growth. According to him, corruption can be useful political glue by allowing politicians to get funds that can be used to hold a country together which of course is a necessary condition for growth.

British Journal of Economics, Management & Trade, 4(11): 1679-1699, 2014
1682
In recent times however, economists and other analysts are unanimous in their perception of corruption vis-à-vis growth. Corruption is seen as a phenomenon that retards growth and development. For example, [5] opines that the problem of underdevelopment of the Nigerian nation is attributed to the Canker worm called corruption. All facets of life are adversely affected. There is complete failure in our judicial system, public power supply is epileptic, and other infrastructural facilities like roads etc. are in a sorry state. Accordingly [13] in his inaugural speech on anti-corruption bill, 2000 remarks that “Corruption is a Canker worm that has eaten deep into the fabric of our society at every level. It has caused decay and dereliction within the infrastructure of government and the society in physical, social and human terms”. Corruption has caused gross underdevelopment of the Nigerian nation. The various institutions such as schools, hospitals, public corporations, government offices etc. are dilapidated. Money or funds allocated to such projects are in most cases diverted and embezzled. [14] develops a corruption inter-net model to show how sectors in an economy are interlinked in corruption with adverse consequences on the economy at large. [15] maintains that, former Secretary General of United Nations (UN), Kofi Annan, submitted that corruption causes enormous harm to development by impoverishing national economies. [16,17] identify corruption as one scourge that hinders a nation’s growth and development. The literature is by no means exhaustive. 2.2 Governance The term governance like corruption is a broad concept that could be subjected to varied and diversified interpretations and beliefs. Like corruption, it is also very difficult to measure. To this end a one sentence definition of the concept is grossly inadequate [18]. Governance, according to the [19] can be viewed as the manner in which power is exercised in the management of a country’s economic and social resources for development. [20] defines governance as “the good government of a society which guides the country along a course leading to desired goal”. The desired goal here broadly implies the concepts of equity, freedom of expression, transparency, accountability institutional pluralism, social justice and effective exercise of human nights. Governance can also be seen as the exercise of power or authority- political, economic, administrative or otherwise to manage a country’s resources and affairs. It encompasses the mechanisms processes and institutions, through which citizens and groups articulate their interest, exercise their legal rights, meet their obligations and mediate their differences [21]. To [22], governance is the exercise of authority through formal and informal traditions and institutions, for the common good. It entails the nature and functioning of state’s institutional and structural arrangements, decision making process, policy formulation, the implementation capacity, the information flows, effectiveness of leadership and relationship between government officials and the public [23]. According to [24] a measure of good governance is “the degree of responsiveness to the people’s legitimate demand and expectation”. It also involves the adoption of good policies by the absence of government failures. Good governance can therefore be summarized as a government with sound economic management brought about by a good political regime that has ability to exercise authority and the capacity to formulate and implement people oriented policies. Besides the conceptualization of governance, the next important issue is how to establish a link between governance, corruption and public expenditure and their combined effects on economic development. It is a truism that governance is not an end in itself, but a means to

British Journal of Economics, Management & Trade, 4(11): 1679-1699, 2014
1683
an end; the end being greater economic performance. Of recent, a growing body of literature has emerged on the impact of governance on economic development. For example, [25] observe that the impact of governance on growth is very pervasive. Good governance is always associated with greater efficiency. Bad governance on the other hand reduces the accumulation of factors of production and also results in a waste in the utilization of existing resources and retards growth and development [26,27]. Again, [28] is of the view that corruption limits the performance of governance as it cuts down investment hence the accumulation of capital with adverse consequences on growth and development. Good governance is expected to be responsive to the yearnings of the people by pursuing people-oriented projects or programmes such as social security, unemployment reduction, infrastructural provision, poverty reduction, rising of standard of living etc. But the siphoning effect of corruption on public funds meant to provide all these, will unarguably distant governance from the people, with the end result being increase in poverty, unemployment, hunger, low life expectancy and general underdevelopment. 2.3 Public Spending In a bid for government to carry out its statuary functions of defense, maintenance of law and order, provision of public utility services, maintenance of efficient administrative system and provision of economic development, government at all levels, incurs expenditure. To this end, according to [29], public spending involves all expenses which the government incurs for its own maintenance, provision of public goods and services, external bodies and outright transfer of funds to the private sector or individuals. [30] view it as all expenditures of government on goods and services, transfers and capital expenditure. [31] simply conceptualizes it as “the expenditure incurred by the public authority”. In recent times, public spending has increased tremendously in Nigeria just like in other countries. Public spending, if correctly and judiciously carried out, gives credibility to governance which in turn enhances economic development. In the words of [31], a sound public expenditure policy produces good effects both on production and distribution. It corrects the mal adjustment in the personal distribution of wealth. However, in Nigeria, evidences abound that suggest a deviation of public spending from the acceptable norms of providing public goods that lubricate the wheel of economic development. Rather, as pointed out by [32], public spending in Nigeria is a breeding ground for corruption as it creates room for inflation of contract fees and other means of siphoning public funds with adverse consequences on economic growth and development. It is indeed obvious that public spending in Nigeria is aimed at satisfying personal goals of politicians and bureaucrats as it is used as a conduit to perpetrate corruption, manifesting in form of unnecessary bureaucracies, contract fee inflation, Kickbacks and embezzlement which more often than not inhibits the provision of growth supporting public goods. 2.4 Economic Development Economic development is an all encompassing concept. It refers to the process of growth accompanied by structural changes in the economy. Accordingly, business dictionary conceptualizes it as the adoption of new technologies, transition from agriculture-based to industry-based economy, and general improvement in living standards. In like manner, [33]

British Journal of Economics, Management & Trade, 4(11): 1679-1699, 2014
1684
maintains that economic development is an increase in living standards, improvement in self-esteem needs and freedom from oppression as well as greater choice. Again, Wikipedia, the free encyclopedia refers to economic development as the sustained, concerted actions of policy makers and communities that promote the standard of living and economic health of a specific area. Such actions may be centered on various areas of human endeavors such as, development of human capital, critical infrastructure, regional competitiveness, social inclusion health safety, literacy etc. Thus economic development can be viewed in terms of quantitative and qualitative changes in the economy. Economic development must incorporate the concept of sustainability. This implies that it must meet the current needs of the people without compromising their future needs. To David Dodson, as cited by [34], economic development is conceptualized as “the process by which a community creates, retains and reinvests wealth and improves the quality of life”. In summary, economic development emphasizes improvement in the quality of life of the people in a community, State or nation and not only mere increase in the nation’s GDP. From the conceptualization and the literature survey thus carried out, corruption seems to pervade governance, public spending and economic development, indicating a strong linkage between corruption and these variables in question. To this end, more serious examination of the causes and dimensions of corruption in Nigeria are germane. This is what follows in the next section. 3. CAUSES AND DIMENSIONS OF CORRUPTION IN NIGERIA 3.1 Causes of Corruption in Nigeria Several factors are responsible for the growth of corruption in Nigeria. Even though corruption is an age long phenomenon, in recent times, it has grown in intensity in Nigeria. These factors are summarized as follows: 3.1.1 Public spending Public spending in Nigeria breeds corruption in a variety of ways. First the state, in its bid to maximize the welfare of its citizenry engages in public investment projects. These public investment projects are in most cases not justifiable on the basis of objective investment criteria such as cost benefit analysis. But as a medium to create opportunity for those in authority to get “commission” from those whose contracts for the execution of such projects are awarded. This often leads to contract fee inflation. Second, public spending-induced corruption manifests in form of public procurement of goods and services by the government. Public officials charged with the responsibility of such procurement, arbitrarily increase the cost of purchasing such goods and services even though they were procured at much less costs. To mitigate this ugly trend, government at all levels has established the department of “due process” and bureau of public procurement with the passage of public procurement act of 2007. This notwithstanding, corruption is still increasing by leaps and bounds in Nigeria. Third, extra budgetary accounts which are common features in many countries are created to among others, “reduce the political and administrative controls that are more likely to accompany spending that goes through the

British Journal of Economics, Management & Trade, 4(11): 1679-1699, 2014
1685
budget”. The creation of such extra budgetary accounts fuels acts of corruption. A case in point in Nigeria is the excess crude account. 3.1.2 Poor wages/Salaries to workers Civil/public servants as well as workers in the private sector are poorly remunerated in Nigeria. With an exception of a few categories of workers like oil companies workers, elected and political appointees, the average Nigerian worker is poorly paid. For example, the N18, 000 minimum wage, in Nigeria is grossly inadequate considering the high cost of living in the country. Nigerian workers faced with such poor and low wages are likely prone to corrupt practices to make ends meet. 3.1.3 Regulations and authorization of the state It is widely argued that there is a nexus between corruption and the activities of the state as the state possesses both monopoly and discretionary powers, to this end, as asserted by [35], cited by [3], “if we abolish the state, we abolish corruption”. However, [35] may not be totally right because apart from the state, corruption also exists in the private sector. Again, in the modern society, the existence of the state is quite inevitable. The Nigerian state like other developing countries employs the use of several regulations and authorizations in performing the act of governance. These regulations and authorization may be vested on some government officials who must enforce, issue licenses, permits and indeed give authorization before certain activities are performed in the economy. These tend to give monopoly power to such government officials who may use it to exploit and extort bribes from individuals who need their services. Failure to comply with them would tantamount to refusal to give such services or they would “simply sit on a decision for months or even years”. In Nigeria, these sharp practices are prevalent in places like pension offices, motor vehicle license offices, the police force etc. 3.1.4 The penalty systems and the effectiveness of institutions The penalty system put in place for corrupt practices in a country to a large extent determines the level of corruption in that country. If there are increases in the penalties on those caught in acts of corruption there could be reduction in corruption. However, other analysts argue that imposing stiffer penalties on corruption would rather make corrupt people to demand for higher bribes. Related to the penalty system is the effectiveness of the anti-graft agencies established to fight corruption. The more effective are these agencies in arresting, prosecuting and punishing corrupt officials caught, the lesser will be the level of corruption in a country and vice-versa. In Nigeria, the anti-graft agencies, the Independent Corrupt Practices and other related Offences Commission (ICPC), the Economic and Financial Crimes Commission (EFCC) as well as the police and the State Security Services (SSS) are barking more than they bite. These institutions are deliberately weakened by the people in authority due largely to poor funding and/or corrupt tendencies of the officials charged with the responsibility of enforcing the provisions of these institutions [36]. 3.1.5 Commercialization of religion In the contemporary Nigerian society, there has been a proliferation of churches. Some of these churches are established by fake pastors and evangelists who use the Bible and name of Jesus to perpetrate acts of corruption. These churches are miracle centres purportedly established to perform all sort of wonders with the sole intention of cheating and

British Journal of Economics, Management & Trade, 4(11): 1679-1699, 2014
1686
defrauding their converts. As pointed out by [5], in these churches, miracles are promised widely on air in order to attract converts for money making and not in the true sense of worship. 3.1.6 Oil importation and subsidy regime Nigeria is an oil producing nation but she imports refined oil more than the non-oil producing nations. The beneficiaries of the oil importation and subsidy regime have deliberately made it impossible for the refineries in Nigeria to produce at full installed capacity. The under capacity utilization of the Nigerian refineries necessitates the importation of refined oil to make up for the short fall in the domestic consumption of refined oil. The good intension of government by introducing the oil subsidy regime is however sabotaged by corruption. As observed by the report of the British All-Party parliamentary group, “a lot of sharp practices take place in the oil sector in Nigeria” [37]. Again, going by the revelations of the 2012 House of Representatives Ad hoc committee’s probe of fuel subsidy regime in Nigeria, the subsidy regime is characterized by colossal fraud and monumental corruption. 3.1.7 The value system of the Nigerian society The Nigerian societal values have tremendous attachment to money. Once a man acquires wealth, he is the society’s right hand man irrespective of the sources of his wealth. In Nigeria, there is little or no attachment to the values of honesty, integrity and selfishness. Money is more or less worshiped. It is seen not only as a means to an end but an end in itself. The Nigerian societal values that see money as the beginning and the end of everything is the catalyst for corrupt practices [2,36]. 3.2 Dimensions of corruption in Nigeria From the foregoing assessment of the various causes of corruption in Nigeria, it can be surmised that corruption exists in all walks of life with varying dimensions and taxonomy. However, while it is a truism that corruption exists both in the public and private sectors more attention is focused on the public sector and more often than not constitutes the basis for the compilation of corruption perception indexes and ranking of nations by Transparency International on the perceived level of corruption in countries [14]. Accordingly, [38,39,1,40,2] have clearly itemized the different dimensions and manifestations of corruption in Nigeria, which can be synthesized into the following forms of corruption: misappropriation/Mismanagement of public funds, embezzlement or the theft of public property, the falsification of electoral or population figures, and the false declaration of assets and age. Generally, these different dimension and manifestations of corruption can be broadly categorized under the following headings.
(a) Bureaucratic corruption (b) Political corruption (c) Electoral corruption and (d) Nepotism
(a) Bureaucratic corruption: this can in other words be termed administrative
corruption. It is mostly prevalent in bureaucratic organizations and institutions such as government ministries and parastatals, the police establishments, schools, internal revenue services, customs offices, immigration, public hospitals, etc.

British Journal of Economics, Management & Trade, 4(11): 1679-1699, 2014
1687
(b) Political corruption: As the name implies, this is a dimension of corruption practiced by politicians. It involves the enactment of legislations, formulation and implementation of political decisions to favour corrupt politicians. A good example in Nigeria is the immunity clause which prevents an incumbent political office holder like the governor of a state to be tried and prosecuted by any court of law while in office.
(c) Electoral corruption: This involves the manipulation and basterdization of the electoral process to the perpetrator’s or his client’s advantage. It is characterized by buying of votes with money or promises of political office appointments, intimidation of the opposition, hostage taking of the opposition or his relatives and falsification of election results among others [41,14].
(d) Nepotism: Another alarming dimension of corruption which is becoming very rampant in the Nigerian public sector is nepotism. This involves undue favoritism extended by a public office holder to his own kinsmen. It is a kind of corrupt practice, which confers underserved favour and advantages based on primordial, ethnic or family grounds [2].
4. PRESENTATION AND ANALYSIS OF STYLIZES FACTS The relationship between corruption, governance and public spending, and their aggregate effects on socio-economic development in Nigeria can be better understood by examining and analyzing some stylized facts on them as well as on some social and macroeconomic aggregates. While it is difficult for corruption to be directly, objectively and quantitatively measured due to its diverse dimensions, an indirect measure of corruption that uses corruption perceptions index (CPI) is relied upon in this paper. The corruption perceptions index ranks countries and territories based on how corrupt their public sector is perceived to be. A country or territory’s score indicates the perceived level of public sector corruption on a scale of 0-100 or 0-10, where 0 means that the country is perceived as highly corrupt and 100 or 10 means it is perceived as very clean [42]. Table 1 presents the corruption perception index for Nigeria between 1996 and 2012. It will not tantamount to an exaggeration in saying that corruption has eaten deep into the very fabrics of the Nigerian nation. The public sector has been bedeviled by this social malady tagged corruption. It has been virtually institutionalized in the public sector, especially in the heyday of military rule of the regimes of erstwhile Gen. Ibrahim Babangida and the late Gen. Sani Abacha. Today in Nigeria, honesty, integrity and selflessness are no longer virtues but vices. Public/political office holders who serve their father land with honesty, selflessness and integrity without embezzling public funds are now ridiculed and branded with all sort of degrading names simply because they are not corrupt. No wonder Nigeria is ranked the most corrupt country among the number of countries included in the Transparency International survey of corruption perception index in 1996, 1997and 2000 respectively, and the second most corrupt country in 1999, 2001, 2002, 2003 and 2004 (Table 1). Above all, the corruption perception index (CPI) scores for Nigeria for the period under review are among the lowest making Nigeria to be ranked among the bottom ten countries of highly corrupt countries of the world between 1996 and 2005. However, beginning from 2006 up to 2012 there was slight improvement in the CPI scores removing Nigeria out of the bottom ten countries of highly corrupt countries of the World. This perhaps may be attributed to the level of democratization currently in place in Nigeria and the establishment of anti-graft agencies like the Independent Corrupt Practices and other related Offences Commission (ICPC) and

British Journal of Economics, Management & Trade, 4(11): 1679-1699, 2014
1688
the Economic and Financial Crimes Commission (EFCC). Recent researches have shown that the level of democratization of a country influences corruption perception index among other factors. The more democracy grows, the more a country is perceived clean and vice versa. Given this scenario, the slight improvement in the CPI scores should be interpreted with caution since corruption perception index reflects perceived corruption rather than actual corruption. Perception may not necessarily match reality. Again, the fact that Nigeria that parades itself as the giant of Africa but has CPI scores of less than 3 out of 10 between 2006 and 2011 and 27 out of 100 which is far below 50 and ranks 139 out of 176 countries included in the survey in 2012, Nigeria is far from being perceived clean.
Table 1. Corruption perception index for Nigeria 19 96-2012 Years CPI score Nigeria’s rank No. of countries 1996 0.69 54 54 1997 1.76 52 52 1998 1.9 81 85 1999 1.6 98 99 2000 1.2 90 90 2001 1.0 90 91 2002 1.6 101 102 2003 1.4 132 133 2004 1.6 144 145 2005 1.9 152 158 2006 2.2 142 163 2007 2.2 147 179 2008 2.7 121 180 2009 2.5 130 180 2010 2.4 134 178 2011 2.4 143 182 2012 27 139 176
Notes (i) CPI Score ranges from 0 (highly corrupt) to 10 (highly clean) for 1996-2011),(ii) The CPI score for 2012 is based on a scale ranging from 0 (highly corrupt) to 100 (highly clean), Source: Transparency international.
Going by Table 1, it is obvious that corruption has been endemic in Nigeria especially during the military regimes up to the period of the nascent democracy but witnessed a marginal reduction as democracy grows, which by no means could make Nigeria be perceived as clean. Given this scenario, how then would governance which exercises power or authority in the management of a country’s economic and social resources for development purposes is adjudged in a country like Nigeria that is not perceived to be clean? Of course it is obvious that governance would be poor. Table 2 shows six dimensions of governance for Nigeria between 1996 and 2011, namely,
(a) Voice and accountability (b) Political stability and absence of violence (c) Government effectiveness (d) Regulatory quality (e) Rule of law and (f) Control of corruption.
The estimate of these dimensions of governance ranges from -2.5 (weak) to 2.5 (strong) governance performance. This implies that the higher the value, the better governance is

British Journal of Economics, Management & Trade, 4(11): 1679-1699, 2014
1689
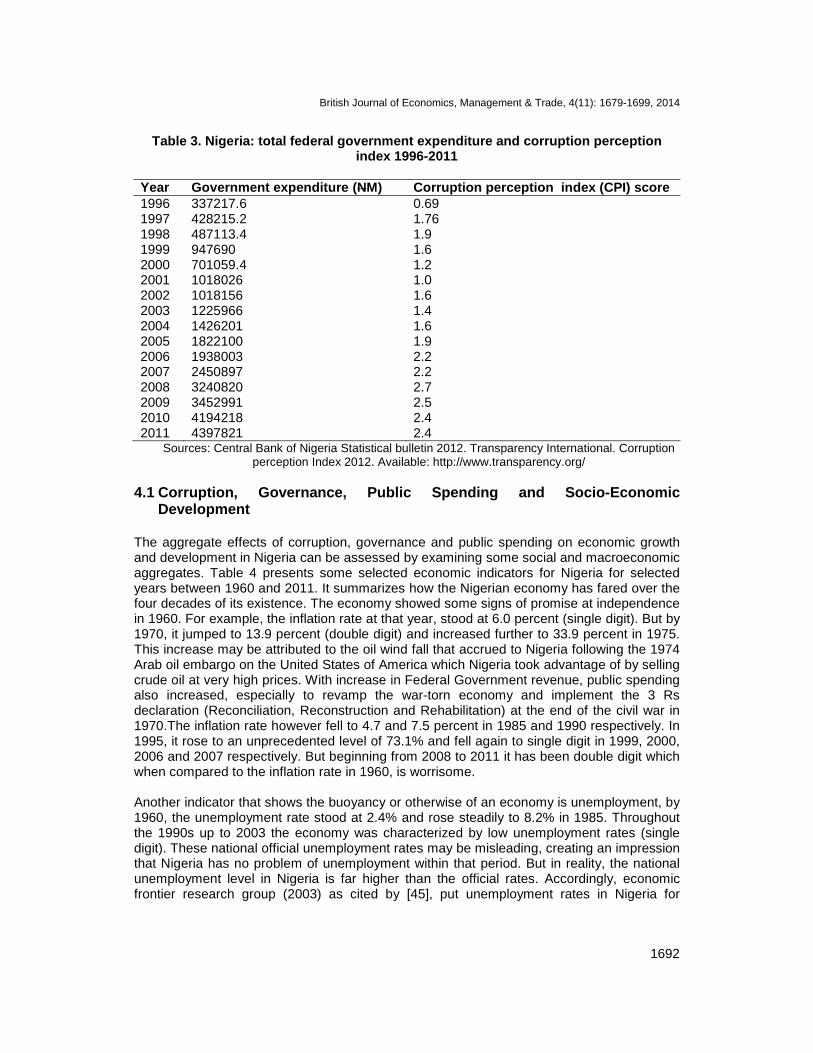
adjudged and vice versa. It is however appalling to note that within the period under review no dimension of governance turns out with a positive estimate. This is a clear indication that governance in Nigeria has been generally poor. Again the control of corruption indicator of governance did not also fare any better despite the establishment of anti-graft agencies in the country (Table 2).This scenario shows a clear correlation between corruption and governance. As corruption deepens, governance weakens. Table 2 clearly reveals that corruption impedes good governance in Nigeria. The percentile rank (P-RANK) which ranges from 0 (Lowest) to 100 (highest) also ranks governance in Nigeria very low among all the countries included in the ranking. No single indicator of governance in Nigeria was able to rank up to 40%. It is only voice and accountability which shows some marginal improvement and ranks up to 30.29% in the year 2000. In clear terms, Table 2 indicates abysmal governance performance in Nigeria. Generally, in the exercise of power or authority in managing the resources of the society and the provision of public goods, governance involves public spending. But in most cases the quest to satisfy personal goals at the expense of the society breeds unnecessary bureaucracies and corruption where public expenditure is diverted away from the provision of growth supporting public goods to private use by public officials. Given this scenario, increase in public expenditure may not translate to positive economic growth. This makes the public expenditure unproductive as in the Nigerian case. Table 3 shows total Federal Government expenditure and corruption perceptions index for Nigeria between 1996 and 2011. Throughout the period the CPI scores remain very low as government expenditure increases. Given a CPI Scale that ranges from 0 (highly corrupt) to 10 (highly clean) and couple with the fact that there is tremendous evidence of infrastructural decay, under capacity utilization in the industrial sector, increase in incidence of poverty and a general decline in the standard of living in Nigeria, the increase in government expenditure over the years becomes unproductive as it fuels greater corruption while growth supporting infrastructure suffer a setback. For instance, within the period under review, the highest CPI score of 2.7 out of 10 was recorded in 2008 while government expenditure for that year stood at N3240820 million. In 2009 government expenditure increased to N3452991 million and CPI score dropped to 2.5. Moreover, a further increase in government expenditure in 2010 to N4194218 million, induced CPI score to decrease from 2.5 in 2009 to 2.4 (Table 3).It is therefore crystal clear that there is a proportional relationship between government expenditure and the perceived level of corruption in Nigeria. As government expenditure increases, the perceived level of corruption also increases.

British Journal of Economics, Management & Trade, 4(11): 1679-1699, 2014
1690
Table 2. Nigeria’s governance indicators 1996-2011 Indicator 1996 1998 2000
EST. S.E. N. P-rank EST. S.E N. P-rank EST. S.E N. P-rank Voice and Accountability -1.67 0.22 5.00 4.81 -1.22 0.23 5.00 12.50 -0.59 0.21 7.00 30.29 Political Stability and absence of violence
-1.17 0.36 4 13 -0.70 0.34 4 24 -1.52 0.33 4 9
Government effectiveness
-0.98 0.25 3 15 -.12 0.20 5 10 -0.96 0.19 6 15
Regulatory Quality -0.82 0.32 4 23 -0.93 0.27 6 17 -0.74 0.22 7 21 Rule of Law -1.26 0.21 5 10 -1.27 0.21 7.00 9.57 -1.11 0.16 9.00 14.83 Control of corruption -1.15 0.30 3 9 -1.07 0.20 5 10 -1.13 0.22 6 6
Indicator 2002 2003 2004
EST. S.E N P-rank EST. S.E. N. P-rank EST. S.E N. P-rank Voice and Accountability
-0.71 0.16 10.00 27.40 -0.64 0.15 11.00 28.85 -0.77 0.15 12.00 25.48
Political Stability and absence of violence
-1.69 0.30 5 6 -1.64 0.29 5 6 -172 0.29 6 5
Government effectiveness
-1.06 0.17 8 12 -0.96 0.17 8 16 -0.91 0.17 9 15
Regulatory Quality -1.23 0.20 8 12 -1.24 0.18 8 10 -1.32 0.17 9 8 Rule of Law -1.48 0.17 11.00 4.31 -1.52 0.17 12.00 5.74 -1.43 0.16 13.00 6.70 Control of corruption
-1.33 0.18 7 1 -1.32 0.19 9 4 -1.31 0.17 11 6

British Journal of Economics, Management & Trade, 4(11): 1679-1699, 2014
1691
Table 2 Continued ……. Indicator 2005 2006 2007
EST. S.E N P-rank EST. S.E N. P-rank EST S.E N. P-rank Voice and Accountability
-0.83 0.14 14.00 24.52 -0.60 0.11 17.00 29.81 -0.75 0.11 17.00 26.92
Political Stability and absence of violence
-1.65 0.28 6 6 -1.99 0.24 7 3 -1.97 0.24 7 4
Government effectiveness
-0.88 0.17 9 20 -0.96 0.17 11 18 -1.03 0.18 11 15
Regulatory Quality -0.77 0.17 9 24 -0.89 0.17 10 19 -0.87 0.17 10 19 Rule of Law -1.36 0.15 13.00 8.13 -1.11 0.14 16.00 12.92 -1.10 0.14 16.00 12.44 Control of corruption -1.15 0.17 11 11 -1.06 0.15 14 12 -0.98 0.15 14 14
Indicator 2008 2009 2010
EST S.E N P-rank EST. S.E N. P-rank EST S.E N. P-rank Voice and Accountability
-0.73 0.11 17.00 27.40 -0.86 0.11 17.00 24.64 -0.79 0.11 17.00 27.49
Political Stability and absence of violence
-1.81 0.24 7 7 -1.85 0.24 7 5 -2.08 0.24 7 4
Government effectiveness
-0.95 0.18 11 17 -1.22 0.18 11 8 -1.18 0.18 11 11
Regulatory Quality -0.78 0.17 10 22 0.73 0.16 10 25 -0.72 0.16 10 26 Rule of Law -1.10 0.14 16.00 12.50 -1.20 0.14 16.00 11.37 -1.21 0.13 16.00 10.43 Control of corruption
-0.81 0.51 14 21 -1.00 0.16 14 17 -1.00 0.16 14 15
Indicator 2011
EST S.E N P-rank Voice and Accountability -0.76 0.11 17.00 26.76 Political Stability and absence of violence -1.94 0.24 7 4 Government effectiveness -1.12 0.18 11 13 Regulatory Quality -0.69 0.16 10 27 Rule of Law -1.25 0.13 16.00 9.86 Control of corruption -1.14 0.15 14 9
Note: EST=estimate of governance. It ranges from-2.5 (weak) to 2.5 (strong) governance performances, S.E=Standard error which reflects variability around the point estimate of governance, N.=Number of data sources on which estimate is based, P-rank=Percentile rank, among all
countries (ranges from 0 lowest to 100 (highest) rank, Source: World Bank. worldwide Governance Indicators 2012. Available: http://www.info.worldbank.org/governance/wgi/:
British Journal of Economics, Management & Trade, 4(11): 1679-1699, 2014
1692
Table 3. Nigeria: total federal government expendit ure and corruption perception index 1996-2011
Year Government expenditure (NM) Corruption perception index (CPI) score 1996 337217.6 0.69 1997 428215.2 1.76 1998 487113.4 1.9 1999 947690 1.6 2000 701059.4 1.2 2001 1018026 1.0 2002 1018156 1.6 2003 1225966 1.4 2004 1426201 1.6 2005 1822100 1.9 2006 1938003 2.2 2007 2450897 2.2 2008 3240820 2.7 2009 3452991 2.5 2010 4194218 2.4 2011 4397821 2.4
Sources: Central Bank of Nigeria Statistical bulletin 2012. Transparency International. Corruption perception Index 2012. Available: http://www.transparency.org/
4.1 Corruption, Governance, Public Spending and Soc io-Economic
Development The aggregate effects of corruption, governance and public spending on economic growth and development in Nigeria can be assessed by examining some social and macroeconomic aggregates. Table 4 presents some selected economic indicators for Nigeria for selected years between 1960 and 2011. It summarizes how the Nigerian economy has fared over the four decades of its existence. The economy showed some signs of promise at independence in 1960. For example, the inflation rate at that year, stood at 6.0 percent (single digit). But by 1970, it jumped to 13.9 percent (double digit) and increased further to 33.9 percent in 1975. This increase may be attributed to the oil wind fall that accrued to Nigeria following the 1974 Arab oil embargo on the United States of America which Nigeria took advantage of by selling crude oil at very high prices. With increase in Federal Government revenue, public spending also increased, especially to revamp the war-torn economy and implement the 3 Rs declaration (Reconciliation, Reconstruction and Rehabilitation) at the end of the civil war in 1970.The inflation rate however fell to 4.7 and 7.5 percent in 1985 and 1990 respectively. In 1995, it rose to an unprecedented level of 73.1% and fell again to single digit in 1999, 2000, 2006 and 2007 respectively. But beginning from 2008 to 2011 it has been double digit which when compared to the inflation rate in 1960, is worrisome. Another indicator that shows the buoyancy or otherwise of an economy is unemployment, by 1960, the unemployment rate stood at 2.4% and rose steadily to 8.2% in 1985. Throughout the 1990s up to 2003 the economy was characterized by low unemployment rates (single digit). These national official unemployment rates may be misleading, creating an impression that Nigeria has no problem of unemployment within that period. But in reality, the national unemployment level in Nigeria is far higher than the official rates. Accordingly, economic frontier research group (2003) as cited by [45], put unemployment rates in Nigeria for

British Journal of Economics, Management & Trade, 4(11): 1679-1699, 2014
1693
graduates from tertiary institutions for 1990, 1995 and 2002 as 31, 36 and 45 percent respectively. This, to my mind reflects the true unemployment situation in Nigeria. Going also by the official unemployment rates as presented in Table 4, the unemployment figure of 23.9 percent in 2011 when compared with the figure of 1960 (i.e. 2.4%), is disturbing. Consequently, the discomfort index (DI) in the economy rose from 8.4 percent in 1960 to a high of 34.8 percent in 2011.
Table 4. Nigeria’s selected economic indicators for selected years (%) Year (1) Inf (2) Une (3) Yg (4) DI (5) CAP (6) INV/GDP (7) 1960 6.0 2.4 4.8 8.4 - 5.0 1970 13.9 4.8 5.7 18.7 - 5.4 1975 33.9 4.8 6.0 38.7 76.6 15.2 1980 10.0 7.8 -0.8 17.8 70.1 11.2 1985 4.7 8.2 9.5 12.9 38.3 7.1 1990 7.5 6.8 13.0 14.3 40.3 14.2 1991 12.9 4.1 -0.8 17.0 42.0 11.1 1992 44.5 3.2 2.3 47.7 38.1 4.1 1993 57.3 5.4 1.3 62.7 37.2 3.8 1994 57.0 2.2 0.2 59.2 30.4 4.2 1995 73.1 1.8 2.2 74.9 29.3 5.1 1996 29.1 3.8 4.4 32.9 32.5 5.2 1997 8.5 3.6 2.8 12.1 30.4 5.4 1998 10.0 3.2 2.9 13.2 32.4 5.3 1999 6.6 3.0 0.4 9.6 34.6 4.9 2000 6.9 3.6 5.4 10.5 36.1 5.4 2001 18.9 3.5 4.6 22.4 42.7 6.3 2002 12.9 3.8 3.5 16.7 54.9 6.8 2003 11.3 3.7 10.2 15.0 56.5 6.9 2004 10.01 13.4 7.8 23.41 55.7 18.0 2005 11.57 11.9 6.5 23.5 54.8 21.3 2006 8.57 14.6 6.0 23.2 53.3 26.4 2007 5.4 12.7 6.5 18.1 53.4 23.7 2008 11.5 14.9 6.0 26.4 53.84 21.7 2009 12.6 19.7 7.0 32.3 55.14 9.7 2010 13.8 21.1 7.9 35.2 56.2 11.6 2011 10.9 23.9 7.4 34.8 56.9 13.8 Notes: Inf = Inflation rate, Une=National Unemployment rate, Yg=growth rate of GDP, DI=Discomfort
index (calculated as inf+Une), CAP=Average manufacturing capacity Utilization rate Inv/GDP=Investment-GDP ratio, Sources: CBN Annual Report and Statement of Accounts (Various
issues), CBN Statistical Bulletin (various issues). Index Mundi 2011. Available: http://www.indexmundi.com/g/g.aspx?
Table 4 also provides information about the state of the Nigerian economy as it relates to real GDP growth rate (Yg). Real GDP is another major macroeconomic indicator. Table 4 shows that from the first decade up to 1975 real GDP growth rates were Impressive. But by1980, the economy started having some problems as real GDP growth rate was negative (i.e. -0.8). It improved again between 1985 and 1990. But beginning from the negative value it recorded in 1991 up to 2002, the economy was very unhealthy as it was characterized by very low growth rates. By 2003 the economy witnessed the highest growth of 10.2 percent

British Journal of Economics, Management & Trade, 4(11): 1679-1699, 2014
1694
and in 2004 it dropped to 7.8%. From 2003 up to 2011 real GDP growth rates have been very impressive, an indication that the economy is doing well. This perhaps may be due to increase in oil production as a result of the amnesty granted to the former militants in the Niger Delta which paved the way for uninterrupted oil production by the oil companies. However, this result should be interpreted with caution, especially taking cognizance of the performance of other macroeconomic indicators like manufacturing capacity utilization (CAP) and investment-GDP ratio (INV/GDP). Between 1975 and 1980, the industrial sector was producing at over 70 percent of installed capacity. But beginning from 1985 to 2011, the capacity utilization rate witnessed a declining trend. The average capacity utilization rate of about 57 percent recorded in 2011 is far below the rate of 77 percent recorded in 1975, indicating poor performance of the economy. Furthermore, the level of investment in the economy relative to GDP is not very impressive for most of the years between 1960 and 2011. This is because according to [46], the precondition for take-off stage is the point a country has invested for a steady number of years, at least 15 percent of the country’s GDP. From Table 4, apart from 1975 and between 2004 and 2008, all the values of investment-GDP ratio for the rest of the years were less than 15 percent. With such low level of investment, capital formation would be constrained there would be low level of productivity, low capacity utilization, prevalence of unemployment and high rate of inflation. These are all the traits of the Nigerian economy. The implication of this is that the impressive growth rate the economy has witnessed is not an inclusive one. In terms of social indicators Table 5 presents a picture that is not very cheering about Nigeria. For example, infant mortality which stood at 217 per 1000 live births in 1980 only declined marginally to 124 per 1000 births in 2011. Also, life expectancy as at 2011 was 52 years compared to 39 years in 1980 (Table 5). One may think there is an improvement in this social indicator. But by international standard, it is nothing to be cheerful about. The fertility rate which stood at 6.8 in 1980 declined slightly to 5.5 in 2011 while population witnessed a constant growth rate of about 3 percent per annum. More worrisome, is the issue of poverty. In Table 6A, trend in poverty incidence in Nigeria is shown. The table indicates that the percentage of Nigerians living in absolute poverty rose astronomically from 27.2 percent in 1980 to 60.9 percent in 2010. In concrete terms the population in poverty which stood at about 17.1million out of a total population of 73.7 million in 1980 increased with a lightning speed to 112.47 million out of a total population of about 159.71 million in 2010 (Table 6A). This increase in the poverty level in Nigeria is indeed alarming. This is a clear indication that the growth rate in real GDP is not inclusive. Increase in real GDP is expected to reduce poverty but the contrary is the case in Nigeria. Again, Table 6B presents Nigeria’s poverty profile in absolute, relative and dollar per day terms between 2004 and 2011. The estimated measures stood at 61.9 percent, 71.5 percent and 62.8 percent respectively in 2011. In all the three measures, Table 6B shows that Nigeria’s poverty level worsened in 2011 compared with their levels in 2010.

British Journal of Economics, Management & Trade, 4(11): 1679-1699, 2014
1695
Table 5 . Nigeria’s selected social indicators 1980-2011 (Sel ected years). Year Infant mor tality Fertility rate Population
growth rate (%) Life expectancy
1980 217 6.8 2.9 39 1985 210 6.6 2.6 46 1990 214 6.4 2.6 46 1995 211 6.1 2.5 45 2000 188 5.9 2.5 46 2001 181 5.8 2.5 47 2002 175 5.8 2.5 47 2003 168 5.8 2.6 48 2004 164 5.7 2.6 48 2005 156 5.7 2.6 4.9 2006 150 5.7 2.7 50 2007 145 5.6 2.7 50 2008 139 5.6 2.7 50 2009 134 5.6 2.7 51 2010 129 5.5 2.8 51 2011 124 5.5 2.8 52
Notes: Infant mortality=under–5 (Per 1000 life births), Fertility rate=total (births per woman) Life expectancy=Life expectancy at birth, total (years), Source: World Bank. World Development
indicator 2011.Available: http://www.worldbank.org/indicator/
Table 6A. Trend in poverty incidence in Nigeria, 19 80-2010 Year (1) Poverty incidence (%)
(2) Total Population (Million) (3)
Population in Poverty (Million) (4)
1980 27.2 73,698,099 17.1 1985 46.3 8.901,572 34.7 1992 42.7 100,592,242 39.2 1996 65.6 111,166,210 67.1 2004 54.7 135,999,250 68.7 2010 60.9 159,707,780 112.47
Sources: (1) World Bank Group 2013 for column 3, (ii) Nigeria’s National Bureau of Statistics for column 2 and 4.
Table 6B. Nigeria’s poverty profile 2004-2011
Year 2004 2010 2011 Estimated Population (Million) 126.3 163 168 Absolute Poverty (%) 54.7 60.9 61.9 Relative Poverty (%) 54.4 69 71.5 Dollar Per day (%) 62.8 61.2 62.8 Note: 2011 figures are estimates, Source: National Bureau of statistics (2010) Nigeria Poverty Profile.
Going by Table 6A and B, the BBC news report of February 3, 2012 that poverty has risen in Nigeria with almost 100 million people living on less than 1 US Dollar ($1) a day despite economic growth cannot be faulted. It could be recalled that real GDP witnessed an impressive growth rate between 2003 and 2011 (Table 4) but this did not translate into poverty reduction in Nigeria. In the words of the Statistician General of the Federation, Dr.

British Journal of Economics, Management & Trade, 4(11): 1679-1699, 2014
1696
Yemi Kale as cited by [32], “it remains a paradox that despite the fact that the Nigerian economy is growing, the proportion of Nigerian living in poverty is increasing every year”. It is crystal clear from the empirical analysis of Table 4 to 6 that the state of the Nigerian economy within the period under consideration leaves much to be desired. This is blamed on the aggregate effects of corruption, bad governance and unproductive public spending. 5. CONCLUDING REMARKS The paper has attempted to examine the nexus between corruption governance and public spending and their aggregate effects on economic growth and development in Nigeria. It finds out that corruption, governance and public spending in Nigeria are closely inter-linked. Corruption contaminates good governance and makes public spending unproductive as it promotes public revenue loss and national capital flight. The damaging effects of corruption on governance and public spending create a simultaneous devastating multiplier effect on the state of the economy within the period under consideration which manifests in un-inclusive economic growth and development in Nigeria. To achieve meaningful economic growth and development in Nigeria, the paper makes the following recommendations: first, corruption which impacts negatively on governance and adversely affects economic growth and development should be drastically reduced in Nigeria if not totally eliminated by embarking on a general self re-orientation of the citizenry, both the leadership and the followership on the essence of honesty, transparency, selflessness and discipline. Second, the leadership should be visionary and exhibits zero tolerance for corruption. Public office should not be used as an avenue to perpetrate corruption. To this end, the code of conduct Bureau should show more commitment and make it mandatory for public office holders to religiously and sincerely declare their assets before and after assuming the office and appropriate mechanism should be put in place to monitor them for at least ten years after leaving office. Any erring officer should be severely punished and the corruptly amassed wealth confiscated by the government. Third, wages in both the public and private sectors should be increased to cushion the effects of rising cost of living and make citizens resist corrupt practices. Fourth, the corruption fighting institutions should be strengthened and made to operate effectively by funding them adequately and giving them maximum jurisdictional powers. In fact the Nigerian judicial system should be truly “blind” devoid of any detection of sacred cows. Fifth, public expenditure should be tailored towards growth supporting areas of needs and should be done with strict financial prudence. Sixth, the country’s democracy should be strengthened and encouraged to grow so that the slight reduction in the perceived level of corruption in Nigeria attributed to the country’s level of democratization would be improved upon. Finally, governance should be more committed to improve the socio-economic welfare of the people by being more responsive to the needs, aspirations and yearnings of the governed. Its policies should be people-oriented and people-centered. COMPETING INTERESTS Authors have declared that no competing interests exist.

British Journal of Economics, Management & Trade, 4(11): 1679-1699, 2014
1697
REFERENCES 1. Olu-olu O. Corruption by example: legalizing the illegal as a means of survival in
modern Nigeria. Bangladesh e-Journal of Sociology. 2008;5(1). 2. Duru EJ, Nigeria’s anti-graft agencies: The journey so far. In Mohammed H, Aluaigba
MT, Kabir A, editors. Corruption, Governance and Development in Nigeria: Perspectives and Remedies. Kano: Aminu Kano Centre for Democratic Research and Training. 2012;472–484.
3. Tanzi V. Corruption Around the World: Cures, consequences, Scope, and Curses, IMF Staff papers. 1998;45(4):559-594.
4. Anthonio C. U.N. countries reveal cost of corruption; 2003. Accessed March 10, 2012. Available: http://www.globalpolicy.org/nations.
5. Mamadu TT. Corruption in the Leadership Structure of Nigerian Polity, Lagos: Theomadex Venture; 2006.
6. Okere T. Philosophy, Culture and Society in Africa, Nsukka: Afro Orbis Publication; 2005.
7. Sen A. Development as freedom. New York: Anchor Books; 1999. 8. Jain AK. Corruption: A Review. Journal of Economic Surveys. 2001;15(1):71-121. 9. Huntington SP. Political order in changing societies. New Haven, Connecticut: Yale
University Press; 1968. 10. Beck PJ, Maher MW. A comparison of bribery and bidding in thin markets. Economic
Letters. 1986;20(1):1-5. 11. Lien DH. A note on competitive bribery games. Economic Letters.1986;22(4):337-341. 12. Lui FT. An equilibrium queuing model of bribery. Journal of Political Economy.
1985;93:760-781. 13. Obasanjo O. Inaugural Speech: Anti-corruption Law of the Federal Republic of
Nigeria, Lagos: Time Press Ltd; 2000. 14. Essien EB. Corruption and economic development in Nigeria: a materialistic
observation. Journal of Economics and Sustainable Development. 2012;3(14):34-48. 15. Webb P. The United Nations convention against corruption: Global achievement or
missed opportunity” Journal of International Economic Law; 2005:8(1). 16. Ogus A. Tackling corruption realistically; 2003; Accessed March 10, 2012. Available:
http://www./globalpolicy.org/nations/launder/general/2003/12real.htm. 17. Crossette B. Corruption’s threat to democracy; 2004. Accessed March 10, 2012.
Available: http://www.globalpolicy.org/nations/launder/general/2004/0412conv.htm 18. Kwame F, Jacques G. Corruption, Democracy and Good Governance Essays on
Accountability and Ethical behavior. Light books; 1999. 19. World Bank. Sub-Saharan Africa: From Crisis to Sustainable Growth: A Long-Term
Perspective Study. Washington D.C; 1989. 20. Boeninger. Governance and development: issues and constraints. Proceeding of the
World Bank Annual Conference on Development Economics. Washington DC.1991;267-287.
21. Downer A. Good Governance: Guiding Principles for implementation, Australian Agency for international Development, Canberra; 2000.
22. Kaufinan D, kraay A, Zoido-Lobaton. Govrnance and Growth: Causality which way? Evidence for the World in Brief, Global Issues on Governance mechanisms. World Bank, Washington Dc; 2003.
23. Landell–Mills P, Serageldin I. Governance and the external factor. Proceedings of the World Bank Annual Conference on Development Economics. The World Bank.1991;303-320.

British Journal of Economics, Management & Trade, 4(11): 1679-1699, 2014
1698
24. Adedeji A. Democracy, Growth and Development: Lessons of Experience. Public Lecture Series No. 1 Nigerian Economic Society, Ibadan; 1998.
25. Knack S, Keefer P. Institutions and economic performance: cross-country test using alternative institutional measures. Economics and Politics. 1995;7:207-227.
26. Rodrik D, Subramanian A, Trebbi F. Institutions rule: the primacy of institutions over integration and geography in economic development International Monetary Fund (IMF) Working Paper no.02/189, IMF, Washington DC. 2002.
27. Kaufmann D, Kraay A, Mastruzzi M. Governance matters vii: aggregate and institutional governance Indicators for 1996-2008. World Bank Policy Research working paper. 2005, 3315, World Bank, Washington, DC.
28. Mauro P. Corruption and growth. Quarterly Journal of Economics. 1995;110(3):681-712.
29. Anyanwu JC, Oaikhenan HE.. Modern Macroeconomic Theory and Applications in Nigeria. Onitsha: Joanee Educational Publishers Ltd; 1995.
30. Onah FE, Edame E. Public Finance, Fiscal Policy and Public Financial Management in Nigeria. Calabar: University of Calabar press; 2008.
31. Kalra KB. Dictionary of Economics. New Delhi: Academic (INDIA) publishers. 2006. 32. Subair K. Resource endowment, public Spending and corruption in Nigeria: a
multivariate analysis. In Mohammed H, Aluaigba M, Kabir A. editors. Corruption, Governance and Development in Nigeria: Perspective and Remedies, Kano: Aminu Kano Centre for Democratic Research and training. 2012;55-76.
33. Todaro MP. Economic Development for a 3rd World Countries. London: Longman Publishers; 1982.
34. Summers JA. Economic Development Broadly Defined. 2011; Accessed 15 May 2013. Available: http://www.ecdi.wordpress.com
35. Becker GS. “Crime and punishment: an economic approach”. Journal of Political Economy. 1968;76:169-217.
36. Salui HA. Democratic governance, corruption and underdevelopment in Nigeria, 1999-2011. In Mohammed H, Aluaigba MT, Kabir A. editors, Corruption, Governance and Development in Nigeria: Perspectives and Remedies. Kano: Aminu Kano centre for democratic Research and Training; 2012.
37. Dare O. Again the phantom subsidy. The Nation; 2011. 38. Adams JA. Political corruption and national economic decline: an assessment of the
impact of political corruption on the Nigerian economy Calabar Journal of Politics and Administration. 2001;1(2):105-119.
39. Agbu O. New Anti-corruption Governments: The challenge of Delivery/Nigeria, a case study paper commissioned for Kenya meeting on new government co-organized by the government of Kenya, TI-Kenya and Transparency International, held in Nairobi, Kenya; 2004.
40. Salawu B. Toward Solving the problem of corruption in Nigeria: the ICPC under search light. European Journal of Social Sciences. 2007;5(1):83-92.
41. Dike V. Corruption in Nigeria: a new paradigm for effective control; 2004. Accessed 25 June 2012.
Available:http://www.africaneconomicanalysis.org/article/gen/corruptiondikeht 42. Transparency International Corruption perception Index; 2012. Accessed June 23,
2013. Available: http://www.transparency.org/ 43. World Bank worldwide Governance Indicators; 2012. Accessed 20 June 2013.
Available : http://www.info.worldbank.org/governance/wgi/ 44. Central Bank of Nigeria Statistical bulletin. 2012.

British Journal of Economics, Management & Trade, 4(11): 1679-1699, 2014
1699
45. Ndebbio JE. The Structural Economic Dimensions of Underdevelopment Associated vicissitudes and imperatives: Agenda for positive change. 33rd University of Calabar Inaugural Lecture Calabar: Saesprint (Nig) co; 2006.
46. Index Mundi; 2011. Accessed 15 June 2013. Available: http://www.indexmundi.com/g/g.aspx?
47. World Bank world Development indicators; 2011. Accessed June 12, 2013. Available: http://www.worldbank.org/indicators/
48. National Bureau of statistics. Nigeria Poverty Profile Report; 2010. _________________________________________________________________________ © 2014 Ovat and Bassey ; This is an Open Access article distributed under the terms of the Creative Commons Attribution License (http://creativecommons.org/licenses/by/3.0), which permits unrestricted use, distribution, and reproduction in any medium, provided the original work is properly cited.
Peer-review history: The peer review history for this paper can be accessed here:
http://www.sciencedomain.org/review-history.php?iid=568&id=20&aid=5109