corrosion behavior of hot-dip galvanized advanced high ... · corrosion behavior of hot-dip...
TRANSCRIPT
Int. J. Electrochem. Sci., 14 (2019) 1488 – 1499, doi: 10.20964/2019.02.13
International Journal of
ELECTROCHEMICAL SCIENCE
www.electrochemsci.org
Corrosion Behavior of Hot-dip Galvanized Advanced High
Strength Steel Sheet in a Simulated Marine Atmospheric
Environment
Kai Zhang1, Renbo Song1,*, Yi Gao2
1 School of Materials Science and Engineering, University of Science and Technology Beijing,
Beijing 100083, China 2 TKAS (Chongqing) Auto Steel Company Limited, Chongqing 400000, China *E-mail: [email protected]
Received: 11 August 2018 / Accepted: 16 October 2018 / Published: 5 January 2019
This paper describes a study of the corrosion behavior and mechanism of 1000MPa grade hot-dip
galvanized steel in a simulated marine atmospheric environment with neutral salt spray tests at different
times. Subsequent weight loss measurements, electrochemical measurements, confocal scanning laser
microscopy (CSLM), scanning electron microscopy (SEM) coupled with energy dispersive spectroscopy
(EDS) and X-ray diffraction (XRD) were used. The results demonstrated that with neutral salt spray
(NSS) time elapsing, the corrosion appearance evolved from pitting corrosion to severe uniform
corrosion. At the initial time, flocculent corrosion products were predominant and were mainly made up
of Zn(OH)2 and ZnO. Then, the corrosion products became compact, and at this period, the corrosion
rate was at a lower level, indicating that the compact products prevented the diffusion of reactive ions
and were protective for the matrix. Cl- could combine with the zinc oxides and accelerate the dissolution
of the protective products; ZnCl2 and Zn5(OH)8Cl2· H2O were the main corrosion products.
Zn5(CO3)2(OH)6 develops after an extensive period of salt spray. Eventually, the compact corrosion
products diminished, and the matrix was exposed and corroded.
Keywords: galvanized steel; zinc coating; salt spray; corrosion
1. INTRODUCTION
The corrosion behavior of steel in a marine-atmospheric environment has been a popular research
topic since the wide use of steel in harsh environments with high moisture and high salinity [1-3].
Corrosion resistance can be enhanced significantly by means of galvanization, by which a zinc coating
can isolate the matrix from corrosive media and act as a sacrificial anode once damaged [2,4-9].
Galvanizing technology is mainly classified into electrogalvanizing and hot-dip galvanizing [10]; hot-

Int. J. Electrochem. Sci., Vol. 14, 2019
1489
dip galvanizing is more commonly used in many fields on account of lower cost, simpler manufacturing
processes, thicker coatings and excellent weldability conditions [7,11].
A large number of researchers have been devoted to the study of microstructure and corrosion
behavior of hot-dip galvanized steel. The better corrosion behavior of galvanized steel depends on the
sacrificial zinc layer [12,13], and it is known that failure consists of three stages [14-17]: first, solid zinc
corrodes; second, the corrosion products of the zinc layer grow until failing to protect the matrix; and
finally, the steel corrodes. For the prevention of corrosion failures during service, it is essential to assess
corrosion resistance and explore the internal corrosion mechanism, usually with indoor accelerated tests
and field experiments, which have received considerable attention. Indoor accelerated tests have been
developed and are now widespread, such as immersion [18], salt spray [19], and alternating wet-dry tests
[20]. Liu [6] studied the effects of pH and Cl− concentration on the corrosion behavior of galvanized
steel immersed in a simulated rust layer solution, and the results showed that galvanized steel is
susceptible to pitting corrosion in all concentrations of chloride solution, ranging from 0.1 to 0.6 M.
Vázquez-Rodríguez C. A. [19] conducted salt spray tests on galvanized steel and characterized the
corrosion products with SEM and EDS. Corrosion begins in the zinc-steel interface and then advances
through a porous layer of ZnCl24Zn(OH)2; ZnO and Zn(OH)2 are also generated on the porous layer;
finally, iron starts to dissolve, forming Fe2O3 and FeOOH. Electrochemical methods combined with
indoor accelerated tests can provide information on the reactions and mechanisms of electrochemical
deterioration. Schachinger [4] studied blister formation on coated galvanized steel in oxidizing alkaline
solutions through EIS and suggested that sodium percarbonate accelerates blister growth. B. M.
Fernández-Pérez [21] studied corrosion reaction at cut-edges of galvanized steel with immersion and
SECM. The anodic activity initiated at the Aluzinc layer coated with the thinner organic coating, whereas
alkalization of the steel related to cathodic activity was limited by the buffering ability of the soluble
metal ions. In this way, precipitation of corrosion products might block the cathodic site. Field
experiments are time-consuming and region-dependent and are often utilized in combination with indoor
accelerated tests. Fujita [22] studied the effect of zinc and zinc-alloyed-coated sheets on perforation
corrosion with field experiments in North America, specifically, with laboratory salt spray and
immersion tests, finding that the main factor affecting corrosion behavior in the crevices of lapped panels
was the coating weights of the zinc and zinc alloys.
Many researchers have succeeded in improving the corrosion resistance of galvanized steel by
adding some alloy elements and surface treatments. E. Diler [2] characterized the corrosion products of
Zn and Zn–Mg–Al (ZMA)-coated steel during a 6-month exposure in a marine environment and found
that for ZMA, the addition of Al and Mg effectively improved the corrosion resistance of the zinc coating.
Yadav [23] showed that the corrosion product of a 55 wt. % Al-1.6 wt. % Si-Zn-alloyed layer was more
effective against oxygen transport compared with a zinc layer. An [24] treated galvanized steel with
phosphating and postsealing and characterized the corrosion resistance through NSS, SEM and EIS
measurement. The results showed that after treatment, porous phosphate crystals and a complete layer
of silicate film formed, improving the corrosion resistance markedly. J. M. Ferreira Jr [25] prepared a
new mixed organic/inorganic coating containing Ce on galvanized steel and showed superior corrosion
resistance. To date, comprehensive studies on the corrosion behavior of galvanized steels have been
developed. However, little effort has been focused on the corrosion behavior of galvanized steel with

Int. J. Electrochem. Sci., Vol. 14, 2019
1490
ultrahigh strength and is needed for the development of steel materials and the higher performance of
galvanized steel. Therefore, it is important to carry out research on 1000MPa grade hot-dip galvanized
steel in a simulated marine atmosphere.
This paper describes a study of the corrosion behavior and the mechanism of 1000MPa grade
hot-galvanized steel in 3.5% NaCl solution. A neutral salt spray experiment was carried out to form an
indoor accelerated corrosion condition; confocal scanning laser microscopy, scanning electron
microscopy coupled with energy dispersive spectroscopy and X-ray diffraction (XRD) were applied to
characterize corrosion morphology and corrosion products after NSS; electrochemical measurements
after salt spray and after various times were conducted to determine the variation in electrochemical
properties as a function of time.
2. EXPERIMENTAL
2.1 Material and solution
Specimens in this paper were cut from a 1000MPa grade hot-dip galvanized steel sheet, of which
the tensile strength reached 1029MPa. The steel matrix was dual-phased, 1.27mm thick, and coated by
double side zinc layers with a thickness of 140g·m-2. The chemical composition of the matrix and the
zinc coating are shown in Table 1 and Table 2, respectively. The dimensions of the specimens used only
in NSS tests were 150mm×70mm×1.6mm, while those used in the electrochemical measurements were
10mm×10mm×1.6mm. Prior to tests, specimens used in the electrochemical measurements were welded
to a copper wire and coated with epoxy, leaving a working area of 10mm×10mm. In specimens used
only in the NSS test, the cut edges without zinc coating were coated with epoxy. Then, all the specimens
were cleaned with deionized water and ethanol, followed by blow-drying.
Table 1. Chemical composition (wt.%) of the matrix
C Si Mn V Ti
0.16 0.67 1.72 0.072 0.015
Table 2. Chemical composition (wt.%) of the zinc coating
Zn Al Fe Pb
99.8 0.205 0.00638 0.0031
The NSS test was conducted in 5% NaCl solution with a pH of 7.0, and the electrochemical
measurements were carried out in 3.5% NaCl solution with a pH of 8.20, which is the approximate pH
of seawater. All the test solutions were prepared with analytic grade reagents and deionized water.

Int. J. Electrochem. Sci., Vol. 14, 2019
1491
2.2 NSS test
The NSS test was conducted with a salt spray corrosion test chamber for 120h. Continuous spray
was employed; the temperature was 35±2°C. The placement of the specimens was at an angle of 20±5°
with respect to the vertical direction. After salt spray for various periods of time (0h, 6h, 24h, 30h, 48h,
72h, 96h and 120h), the specimens used only in the NSS test were taken out, and the corrosion
morphology was examined with a digital camera and SEM. The composition of the corrosion products
was analyzed with XRD on a Bruker D8 Advance X-ray diffractometer with a Cu target, a working
voltage of 40kV, a current of 40mA, a scanning step of 0.04̊, a scanning rate of 6̊/min, and the 2θ ranging
from 10̊ to 90̊. Rust was removed with a descaling liquid (prepared with 200g CrO3+1000mL deionized
water), after which the specimens were cleaned with deionized water and ethanol and blow-dried. After
rust removal, CSLM was applied to examine the corrosion morphology. An electronic balance was used
to measure their weight, and then, the corrosion rate was calculated according to the following formula:
0 tw wv
S t
(1)
where t represents the time of salt spray, w0 and wt are the weight before and after salt spray and
followed by rust removal, and S is the exposed area of the specimen.
2.3 Electrochemical measurements
After salt spray for various periods of time (0h, 6h, 24h, 30h, 48h, 72h, 96h and 120h), the
specimens to be used for electrochemical measurements were removed. The electrochemical
measurements were conducted with a Princeton VersaSTAT Multichannel electrochemical workstation.
A conventional three-electrode system was used, in which the specimen acted as the working electrode,
a platinum gauge acted as the counter electrode, and a saturated calomel electrode (SCE) acted as the
reference electrode.
At the beginning of the tests, the specimens were immersed in the test solution until the open
circuit potential (OCP) reached stability. Later, electrochemical impedance spectroscopy (EIS) was
measured with an AC perturbation of 10mV (vs. OCP) at the measuring frequency of 0.01-100000Hz.
The results were fitted with ZsimpWin software. All the electrochemical tests were performed at ambient
temperature (22°C) and repeated three times to guarantee reliability and repeatability of the data.
3. RESULTS AND DISCUSSION
3.1 Corrosion morphology of the galvanized steel after the NSS tests
Fig. 1 shows the macro-corrosion morphology of the specimens after NSS and after various
times. Before salt spray, the surface of the specimen is intact and bright. After 6h of NSS, the zinc coating
is slightly corroded; some white spots develop, and the metallic luster disappears. With time passing, the
degree of corrosion becomes increasingly more severe. Particularly, white corrosion products cover
almost the whole surface at 48h and 72h, demonstrating uniform corrosion of the zinc coating. Red rust

Int. J. Electrochem. Sci., Vol. 14, 2019
1492
can be observed at 96h, where zinc failed to protect the matrix from corrosion. At 120h, the entire matrix
is exposed and heavily corroded.
Figure 1. Macro-corrosion morphology of the specimens after NSS and after various times (a) 0h; (b)
6h; (c) 24h; (d) 30h; (e) 48h; (f) 72h; (g) 96h; (h) 120h.
Figure 2. Corrosion rate of the specimens during NSS after various times.
Fig. 2 illustrates the corrosion rate of the specimens during NSS after various times, showing
first an increase and then a decrease. Combined with the corrosion morphology, at the first 30h, zinc is
corroded at a high corrosion rate due to the direct contact between the zinc coatings and the corrosive
medium, and as time passes, the degree of corrosion of the zinc coating becomes increasingly greater.
This stage is called the initial corrosion stage of galvanized steel reported in the literature [26]. At 48h,
compact and protective corrosion products form, in which the corrosion rate is the lowest; at 72h, there
is a minor increase in the corrosion rate, which may be attributed to the consumption of the protective
corrosion products. Then, the matrix begins to be exposed, the corrosion rate of which is lower and may
account for the subsequent descending curve. The variation in the corrosion rate is considered to be

Int. J. Electrochem. Sci., Vol. 14, 2019
1493
related to the types of corrosion products, especially the compactness and adhesive property [27], which
is discussed further in 3.3.
For assessing the corrosion form, the specimens for NSS tests after rust removal were
observed with CSLM (Fig. 3), which illustrates the initiation and development of corrosion with
NSS time passing. In the initial period, the zinc coating is corroded, and the corrosion appearance
is mainly pitting corrosion with the pit diameter ranging from 1.5μm to 2.5μm. With the passage
of time, the pits multiply rapidly and grow in depth instead of in the radial direction, and this
outcome is in agreement with results reported in the literature [27]; the pits gradually become
confluent and eventually transform to present severe uniform corrosion.
Figure 3. Corrosion morphology of galvanized steel after rust removal (a) 6h; (b) 24h; (c) 72h.
3.2 Electrochemical behavior of galvanized steel during NSS
Figure 4. OCP of galvanized steel after the NSS test and after various times.

Int. J. Electrochem. Sci., Vol. 14, 2019
1494
Fig. 4 shows the OCP of galvanized steel after NSS testing over a range of various times. The
results show that after salt spray, the OCP shifted positively and significantly; this outcome is attributed
to the damage of the zinc coating and thus the galvanic corrosion between zinc and the steel matrix. In
addition, the OCP varies slightly (approximately -1.05V) in the first 96h and then exerts an obvious
positive shift to approximately -0.6V after 120h NSS, reaching the corrosion potential of steel materials
in 3.5% NaCl solution. Therefore, it can be inferred that most of the zinc coating is totally destroyed,
and the exposed steel matrix suffers from severe chloride-induced corrosion, which corresponds well
with the corrosion morphology observation and can be verified with the XRD results.
As is known, the EIS technique has been extensively used to characterize surface coatings in a
semiquantitative way [4,28]. The EIS diagrams of galvanized steel are displayed in Fig. 5. It can be seen
that the EIS diagram demonstrates characteristics of two time constants. It can be inferred that a
complicated mass transport mechanism participates in the corrosion process [7]. In the EIS diagram, the
high-frequency part is related to charge transfer, associated with the effect of an electric double-layer,
while the low-frequency part characterizes a finite thickness diffusion process, mainly depending on the
properties of the corrosion products. After the first 30h, the corrosion process was controlled by the
active dissolution of zinc, while at 48-72h, the emergence of the diffusive tail at low frequency indicates
the mixed control of diffusion and active dissolution. Finally, at 96-120h, the corrosion process is
controlled by the active dissolution of the matrix. Combined with the macro-corrosion morphology in
3.1, it can be inferred that at 48-72h, the intact corrosion products of zinc prevented the diffusion of
reactive ions; while at 96-120h, the matrix was exposed and corroded. Similar results also appear in
Liu’s work [28], demonstrating that with the passage of immersion time, the low-frequency arc in the
Nyquist diagram shrinks; this shrinkage results from the complete blockage of the pores in the outer
coarse layer by the accumulation of the corrosion products. Further, as immersion time increases, the
maximum phase angle at high frequency increases, indicating that the corrosion products become more
compact.
Figure 5. EIS diagram of galvanized steel after the NSS test after various times: (a) Bode; (b) Nyquist.

Int. J. Electrochem. Sci., Vol. 14, 2019
1495
The software of ZSimpWin was used to fit the EIS plots, and two models of Rs(Qf(Rf(QdlRct)))
and Rs(Qf(Rf(Qdl(RctW)))) were applied to analyze the variation in corrosion progress, as shown in Fig.
6. The fitted values are shown in Table 3.
Figure 6. Equivalent circuit diagram: (a) Rs(Qf(Rf(QdlRct))) model; (b) Rs(Qf(Rf(Qdl(RctW)))) model.
Rs is the solution resistance from the reference electrode to the working electrode; Rct and Qdl are
the constant phase elements (CPE) of the charge transfer resistance and the angle element of the electric
double-layer capacitor between the solution and the matrix; Rf and Qf stand for the resistance and CPE
between the solution and the zinc coatings. A Warburg impedance, W, was used to fit the plateau of the
phase angle at low frequency. In general, the capacitor of the electric double layer cannot be considered
as the ideal capacitive element because of the roughness of the electrode surface, the impedance of which
is always concerned with the angular frequency of the pumping signals and conveyed in the following
form:
ndljY
Z)(
1
0 (2)
where Y0 is a proportional factor, ω is the angular frequency, j is the symbol for the imaginary unit, and
n represents the index of the constant phase angle element.
Table 3. Fitted values of the equivalent circuit of the EIS diagram.
Time, h Rs, Ω·cm2 Qf,
n Rf, Ω·cm2
Qdl,
n
Rct,
Ω·cm2
W,
Ω·cm2 s1/2 Ω-1cm-2 sn Ω-1cm-2 sn
0 4.318 7.897×10⁻⁵ 0.73 406.5 5.786×10⁻³ 0.79 634.9 -
6 6.289 2.823×10⁻³ 0.56 8.962 1.009×10⁻³ 0.89 646.1 -
24 1.089 1.829×10⁻³ 0.39 2.307 1.031×10⁻³ 0.63 706.2 -
30 6.689 3.314×10⁻³ 0.77 2.260 1.187×10⁻³ 1.00 455.33 -
48 7.671 4.088×10⁻³ 0.48 1.203 2.341×10⁻³ 0.79 388.9 272.81
72 2.594 6.958×10⁻³ 0.17 2.249 6.804×10⁻⁴ 0.79 2.475 83.29
96 7.687 3.766×10⁻³ 0.73 373.2 2.713×10⁻¹ 1.00 120.2
120 7.613 2.219×10⁻³ 0.50 135.6 6.827×10⁻³ 0.52 1686

Int. J. Electrochem. Sci., Vol. 14, 2019
1496
3.3 Corrosion products of the galvanized steel after the NSS tests.
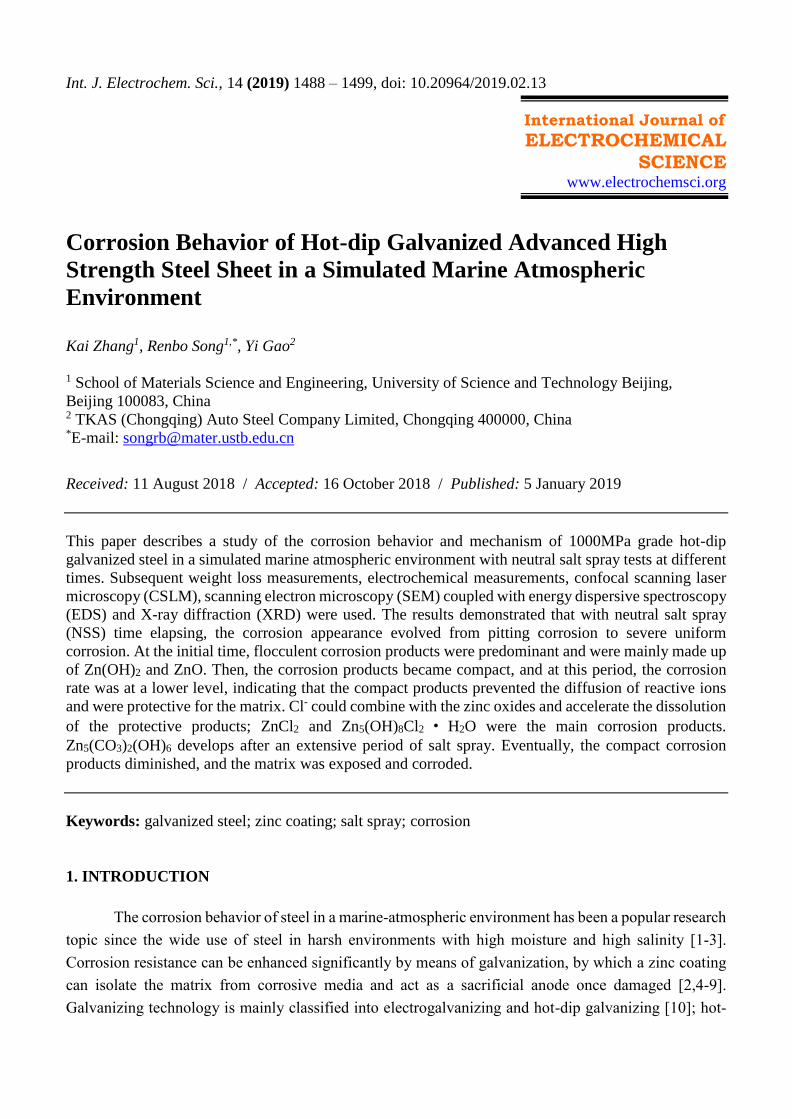
Fig. 7 shows the morphology and element distribution of the corrosion products of galvanized
steel after NSS. Before NSS, the surface is intact, with few coating defects and no corrosion products;
Zn is evenly distributed. After 6h NSS, flocculent and loose corrosion products are created and are
verified to be zinc oxides by EDS mapping. When the NSS time reaches 24h, masses of corrosion
products appear, where Cl is enriched and O is depleted. According to Ohtsuka [29], the destructive
effect of Cl- on zinc oxides causes less severe flocculent corrosion products. In the first 30h, the corrosion
products are loose and not protective, accounting for the increase in corrosion rate in Fig. 2. At 48h,
compact corrosion products such as plate strips form and are adherent to clusters on the surface or within
the crevice; O and Zn are distributed uniformly, and no Fe is detected. The compact corrosion products
prevent the attack of corrosive media and lead to the plateau of the corrosion rate. With the time elapsing,
the zinc coating is continuously destroyed, clusters gradually diminish, and the plate strips are pitted
with cracks and subsidence holes. Especially at 96h, clusters are rare; the remaining corrosion products
are further corroded and exert a gap-shape, in which a large amount of Cl is detected. It can be inferred
that the damage of the plate strips is related to Cl-. At 120h, the existence of Fe demonstrates the
comprehensive damage of the zinc coating and the corrosion of the matrix. The transformation of the
corrosion products corresponds with the variation in macro morphology (Fig. 1), corrosion rate (Fig. 2)
and electrochemical curves.
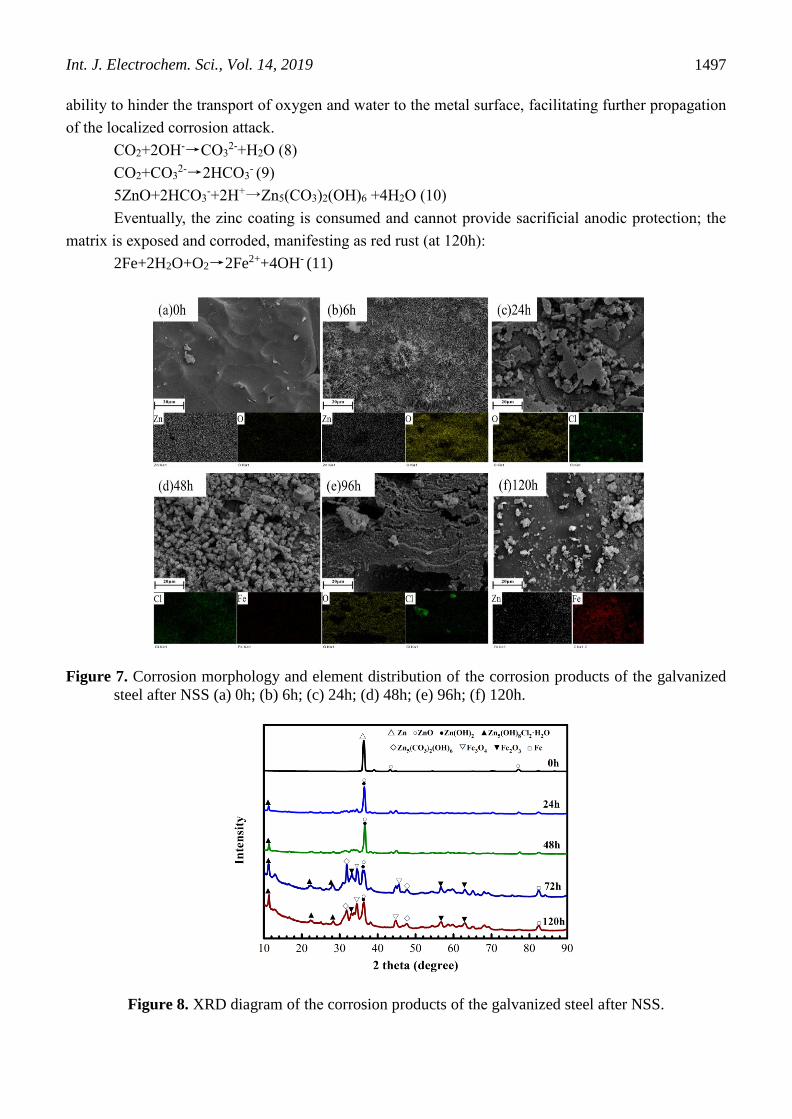
For understanding the chemical composition of corrosion products, XRD analysis was conducted.
From Fig. 8, at the initial NSS time, amorphous Zn(OH)2 appears, transforms to β-Zn(OH)2 and then
changes into ZnO rapidly from dehydration. At 48h, Zn5(OH)8Cl2·H2O comes into being as a result of
the combination of Cl- and zinc oxides; furthermore, Zn5(CO3)2(OH)6 is observed. When NSS time
reaches 120h, a substantial amount of Fe2O3 is detected.
On the basis of Santos’s work [10], the corrosion mechanism during NSS can be summarized in
Fig. 9, and the chemical reactions are shown as follows:
At the initial period (0-6h):
Zn→Zn2++2e- (3)
O2+2H2O+4e-→4OH- (4)
Zn2++2OH-→Zn(OH)2 (5)
Zn(OH)2→ZnO+H2O (6)
Afterwards, Cl- migrates and destroys zinc oxides in the following formula at 24h, and
Zn5(OH)8Cl2·H2O begins to appear:
5ZnO+2Cl-+6H2O→Zn5(OH)8Cl2·H2O+2OH- (7)
At 48h and 72h, an increasing amount of Zn5(OH)8Cl2·H2O forms and accumulates in the
bottom part of the pits, and it is considered to be able to repel aggressive ions and mitigate further
corrosion processes [30].
Zinc hydroxide carbonate was detected after 72h immersion and was generally considered to be
present in the outer layer of the corrosion products [31]. The formation of the carbonate was considered
to depend on the absorption of atmospheric carbon dioxide into the surface electrolyte and the formation
of carbonate and bicarbonate, as (8)~(10) shows [28]. The carbonate was quite porous and had a low
Int. J. Electrochem. Sci., Vol. 14, 2019
1497
ability to hinder the transport of oxygen and water to the metal surface, facilitating further propagation
of the localized corrosion attack.
CO2+2OH-→CO32-+H2O (8)
CO2+CO32-→2HCO3
- (9)
5ZnO+2HCO3-+2H+→Zn5(CO3)2(OH)6 +4H2O (10)
Eventually, the zinc coating is consumed and cannot provide sacrificial anodic protection; the
matrix is exposed and corroded, manifesting as red rust (at 120h):
2Fe+2H2O+O2→2Fe2++4OH- (11)
Figure 7. Corrosion morphology and element distribution of the corrosion products of the galvanized
steel after NSS (a) 0h; (b) 6h; (c) 24h; (d) 48h; (e) 96h; (f) 120h.
Figure 8. XRD diagram of the corrosion products of the galvanized steel after NSS.

Int. J. Electrochem. Sci., Vol. 14, 2019
1498
Figure 9. Schematic diagram of the corrosion mechanism of the specimens during NSS.
4. CONCLUSIONS
The main conclusions from this study are summarized below:
With NSS time elapsing, the corrosion appearance evolves from pitting corrosion to severe
uniform corrosion. At an initial time, flocculent corrosion products are predominant and are mainly made
up of Zn(OH)2 and ZnO. Then, the corrosion products become compact, and during this period, the
corrosion rate is at a lower level, while the corrosion current density is the lowest. This outcome indicates
that the compact products prevent the diffusion of reactive ions and are protective for the matrix. The
combination of Cl- and zinc oxides accelerates the dissolution of the protective products, and ZnCl2 and
Zn5(OH)8Cl2·H2O are the main products. After 72h NSS, Zn5(CO3)2(OH)6 is created; gradually, the
compact corrosion products diminish, and the matrix is exposed and corroded.
References
1. H. Ma, Z. Liu, C. Du, X. Li, Z. Cui, Mater. Sci. Eng. A, 650 (2016) 93.
2. E. Diler, B. Rouvellou, S. Rioual, B. Lescop, G. Nguyen Vien, D. Thierry, Corros. Sci., 87 (2014)
111.
3. G. R. Meira, C. Andrade, E. O. Vilar, K. D. Nery, Constr. Build. Mater., 55 (2014) 289.
4. E. D. Schachinger, R. Braidtb, B. Strau, A. W. Hassel, Corros. Sci., 96 (2015) 6.
5. M. Reichinger, W. Bremser, M. Dornbusch, Electrochim. Acta, 231 (2017) 135.
6. S. Liu, H. Sun, L. Sun, H. Fan, Corros. Sci., 65 (2012) 520.
7. E. A. Alvarenga, V. F. Lins, Surf. Coat. Tech., 306 (2016) 428.
8. I. Aslam, B. Li, R. L. Martens, J. R. Goodwin, H. J. Rhee, F. Goodwin, Mater. Charact., 120
(2016) 63.
9. Y. Miyoshi, J. Oka, S. Maeda, Transactions ISIJ, 23 (1983) 974.
10. A. P. Santos, S. M. Manhabosco, J. S. Rodrigues, L. F. Dick, Surf. Coat. Tech., 279 (2015) 150.
11. P. R. Seré, C. Deyá, C. I. Elsner, A. R. D. Sarli, Procedia Mater. Sci., 8 (2015) 1.
12. A. P. Yadav, A. Nishikata, T. Tsuru, Corros. Sci., 46 (2004) 169.
13. A. P. Yadav, A. Nishikata, T. Tsuru, Corros. Sci., 46 (2004) 361.
14. G. A. Mahdy, A. Nishikata, T. Tsuru, Corros. Sci., 42 (2000) 183.
15. F. Thebault, B. Vuillemin, R. Oltra, K. Ogle, C. Allely, Electrochim. Acta, 53 (2008) 5226.
16. F. Thebault, B. Vuillemin, R. Oltra, C. Allely, K. Ogle, Electrochim. Acta, 56 (2011) 8347.
Int. J. Electrochem. Sci., Vol. 14, 2019
1499
17. S. J. Pantazopoulou, K. D. Papoulia, Eng. Mech., 127 (2001) 342.
18. N. S. Azmat, K. D. Ralston, B. C. Muddle, I. S. Cole, Corros. Sci., 53 (2011) 1604.
19. C. A. Vázquez-Rodríguez, D. L. Garza-Garza, C. G. Tiburcio, B. E. Maldonado, M. A. Baltazar-
Zamora, C. R. Garza, R. O. García, N. F. Garza-Montes-de-Oca, R. J. Ramirez, F. Almeraya-
Calderón, Int. J. Electrochem. Sci., 10 (2015) 4654.
20. O. E. Barcia, O. R. Mattos, N. Pebere B. Tribollet, J. Electrochem. Soc., 140 (1993) 2825.
21. B. M. Fernández-Pérez, J. Izquierdo, J. J. Santana, S. González, R. M. Souto, Int. J. Electrochem.
Sci., 10 (2015) 10145.
22. S. Fujita, D. Mizuno, Corros. Sci., 49 (2007) 211.
23. A. P. Yadav, A. Nishikata, T. Tsuru, ISIJ Int., 44 (2004) 1727.
24. K. An, C. An, C. Yan, Y. Qing, Y. Shang, C. Liu, Int. J. Electrochem. Sci., 12 (2017) 2102.
25. J. M. Ferreira Jr., J. L. Rossi, M. A. Baker, S. J. Hinder, I. Costa, Int. J. Electrochem. Sci., 9 (2014)
1827.
26. Z. Q. Tan, C. M. Hansson, Corros. Sci., 50 (2008) 2512.
27. X. Zhang, Br. Corros. J., 32 (1997) 28.
28. Y. Liu, H. Y. Li, Z. G. Li, Int. J. Electrochem. Sci., 8 (2013) 7753.
29. T. Ohtsuka, M. Matsuda, Corros., 59 (2003) 407.
30. H. B. Zeng, J. G. Dai, W. H. Li, C. S. Poon, Constr. Build. Mater., 166 (2018) 572.
31. D. Persson, D. Thierry, O. Karlsson, Corros Sci., 126 (2017) 152.
© 2019 The Authors. Published by ESG (www.electrochemsci.org). This article is an open access
article distributed under the terms and conditions of the Creative Commons Attribution license
(http://creativecommons.org/licenses/by/4.0/).