corresponding author, faculty of economics and business ... fileb faculty of economics and business,...
TRANSCRIPT

52
The Effect of Industrial and Geographic Diversifications on the Earnings
Management of the Manufacturing Companies in Indonesia
Hasan BASRIa Dahlia BUCHARIb
a Corresponding Author, Faculty of Economics and Business, Syiah Kuala University, Banda Aceh,
Indonesia, [email protected]
b Faculty of Economics and Business, Syiah Kuala University, Banda Aceh, Indonesia
Keywords
Industrial
Diversification,
Geographic
Diversification,
Earnings Management.
Jel Classification
M40, M49, L10
Abstract
This research was conducted to address the prevalent
issues regarding the effect of industrial diversification and
geographic diversification either partially or
simultaneously on the practice of earnings management.
By utilizing purposive sampling techniques on the
secondary data, the total of 80 sample studies were drawn
from manufacturing companies listed on Indonesian Stock
Exchange for the period of 2011-2014. Multiple linear
regression analysis provided by SPSS 21.0 was also
employed to test the hypotheses constructed within this
research.
The result of the multiple linear regression analysis
presents evidence that industrial diversification and
geographic diversification simultaneously have a
significant effect on the practice of earnings management.
Alongside, it also affirms that partially, industrial
diversification and geographic diversification have a
significance effect on the practice of earnings
management. These findings provide scholarly evidence
on the implication of diversification strategies on the
practice of earnings management to help financial
statement users (investors, creditors, stakeholders, etc.),
accounting standard setters, and regulators to assess the
pervasiveness of earnings management within the
company.

Journal of Accounting, Finance and Auditing Studies 3/1 (2017) 52-63
53
1.Introduction
Globalvolatilityofeconomicconditionthatoftentriggerseconomiccrisesindeedshakes
up the existence (stability) of particular businesses in a country, either directly or
indirectly. The 1998 and 2008 economic crises, for instance, substantially exhibit an
adverseimpactofbusinessclimateinIndonesia,paralyzingmostofeconomicactivities
due to a large number of companies that eventually went to bankruptcy (were gone
bankrupt)(Kartono,2010).Undoubtedly,thisimpacthasdrawntheattentionofmanagers
to think of sustainability strategies to continuously develop and thrive amidst the
unpredictedeconomic conditionaswell asemergingbusiness competition.Oneof the
prevalentstrategieschosenisdiversification,eitherindustriallyorgeographically,asthey
arebothbelievedtoreducetherisksofthecompany’sbusiness(Harto,2005).
Rash of literatures demonstrate that diversification strategies can improve the
performance of companies’ profitability (Farooqi, 2014; Satoto, 2007). However, this
diversification, despite its ability to createmulti-sources of revenue by expanding the
business line, segment, andmarket share, demands a higher degree of organizational
complexitywhichmaycreateanotherunfavorablecondition(ElMehdiandSebuoi,2011).
Agencyconflicthypothesisarguesthatthecompany’sdegreeoforganizationalcomplexity
influencestheabilityofmanagerstoalterandmodifyinformationaswellasmanipulate
theearnings.Admittedly,thisargumentisreinforcedbyunveilingearningsmanagement
casesbyindustriallyandgeographicallydiversifiedcompanies,suchworldclasscompany
asEnronandIndonesiancompanyPTKimiaFarma(Arfan,2006).Thus,onemightask,
doesdiversificationcreateafavorableconditionfortheearningsmanagement?
Consideringtheprospectiveunfavorableconsequencesofdiversificationstrategies,this
paper insists on seeking empirical evidence related to the effect of industrial
diversificationandgeographicdiversificationon thepracticeof earningsmanagement.
Thefindingsofthisstudyarehopedtoprovidescholarlyevidenceontheimplicationof
diversification strategies on the practice of earningsmanagement. As such, this study
contributes to help financial statement users (investors, creditors, stakeholders, etc.),
accounting standard setters, and regulators to assess the pervasiveness of earnings
managementwithinthecompany.
Theremainderofthispaperisorganizedasfollows.Section2providesreviewofrelevant
literature.Section3presentsmethodologicalapproachonwhichtheanalysesofthestudy
arebased.Section4discussestheempirical findingsandtheir implicationsandfinally,

Journal of Accounting, Finance and Auditing Studies 3/1 (2017) 52-63
54
section5providestheclosingremarksofthispaper.
2.ReviewofSelectedLiterature
According to the agency conflict hypothesis, the ability of managers to distort information
and manipulate earnings depends on the company’s degree of organizational complexity.
Empirical research shows that diversified company is generally larger in more complex
organizational structures, their operations are less transparent and that their analyses
poses difficulties to investors and analyst alike (Chang and Yu, 2004; Kim and Pantzalis,
2003; Liu and Qi, 2007). Therefore, a company that is industrially and geographically
diversified is supposed to have complex organizational structure as it deals with many
business segments and divisions. With this regard, the detailed operation of each segment
then is only known by the management and is hardly depicted to shareholders.
There have been several studies conducted to examine the effects of industrial and
geographical diversification on the practice of earnings management. Rodriguez and
Hemmen (2010), who conducted a study in Europe, find that for less diversified
companies, discretionary accruals is less pronounced, whereas in relatively more
diversified companies, discretionary accruals appears to be more pronounced. Lim et al.
(2007), conducted a research in seasoned equity offering setting, also suggest that
diversified companies are more aggressive in managing earnings than non-diversified
companies. Farooqi et al. (2014) also confirm this view in their research on American
companies.
Merits of literatures also suggest that there is a significant effect of geographic
diversification to the practice of earnings management. In this regard, El Mehdi and Sebuoi
(2011) who conducted a research on U.S. companies find that earnings management
increases with the level of geographic diversification. They provide evidence that for
multinational companies, regardless of whether they operate in one or more business
segments, they find income-increasing accruals. This finding is consistent with the view
that the costs of geographic diversification outweigh the benefit. They also suggest that
the aggressive manipulation in global diversified companies is motivated by high
operating cash-flow volatility, high information asymmetry, and amplified operating risk.
Other similar research is conducted by Chin et al. (2009) on Taiwanese company. They
also agree that greater corporate internationalization is associated with a higher level of
earnings management by way of greater asymmetry information and transparency
decrement. On the other hand, a number of studies provide different findings which are

Journal of Accounting, Finance and Auditing Studies 3/1 (2017) 52-63
55
inconsistentwiththeabovementioned.TheworkofJirapornetal.(2008),forexample,
providesempiricalevidence thatgeographicaldiversificationalonedoesnotappear to
impact earnings management. Some other researchers even reveal that geographic
diversificationcanhelpinmitigatingthepracticeofearningsmanagement(Farooqietal.,
2014).
Taking the literature review and previous findings as the point of departure, the
researcherhypothesizes:
Ha1: Industrialdiversificationandgeographicdiversificationsimultaneouslyinfluencethe
practiceofearningsmanagement.
Ha2: Industrialdiversificationpositivelyinfluencesthepracticeofearningsmanagement.
Ha3: Geographic diversification positively influences the practice of earnings
management.
3.ResearchMethod
3.1Data
Thisstudyemployedquantitativeapproachandwasaimedat investigatingwhetheror
nottherewasaneffectofindustrialdiversificationandgeographicdiversificationonthe
practiceofearningsmanagement.ThedataweredrawnfromIDXwebsite,encompasses
alllistedmanufacturingcompaniescoveringthe2011-2014period.
In this study, the earningsmanagement is treated as thedependentvariable,which is
measured by discretionary accrual (DA) which is derived from the difference of total
accrual(TA)andnon-discretionaryaccrual(NDA).Tomeasurediscretionaryaccrual,the
modified jonesmodel is used. The reasonwhy the researcher uses thismodel is that
because this model is assumed to be the best model to investigate the earnings
managementandalsogiveastrongresult(Dechowetal.,1995).Further,thismodelhas
also been widely accepted in accounting literature to measure earnings management
(Arfan,2006).
Industrialdiversificationandgeographicdiversificationaretreatedas the independent
variables. Industrial diversification (IHERF) is translated to the number of industrial
segmentsorbusinesssegmentownedandreportedbycompanyinthefinancialstatement
andspecificallyshowninthenotestothecompany’sfinancialstatement.Weusethesales-
basedHerfindahlindexasanalternativeproxyforindustrialdiversification(Farooqiet.al,
2014).TheHerfindahlindexfortheithcompanyinyear t iscomputedas:

Journal of Accounting, Finance and Auditing Studies 3/1 (2017) 52-63
56
IHERFi, t = �I_SALESFSALES��
where I_SALES denotes the industrial segment sales for i company in yeart and FSALES
denotes the company’s total sales across all reported industrial segments in that year.
Geographical diversification (GHEFR) is translated to the number of geographical
segments owned and reported by the company in financial statements that are specifically
shown in the notes to the company's financial statements. We also use the sales-based
Herfindahl index as an alternative proxy for geographic diversification (Farooqi et al.,
2014). The Herfindahl index for the ith company in year t is computed as:
GHERFi, t = �G_SALESFSALES ��
where G_SALES denotes the respective geographical sales for the company in year t and
FSALES is the company’s total sales across all reported geographical segments in that year.
3.2ModelSpecification
To investigate the impacts of industrial diversification and geographic
diversification on earnings management, this study employs multiple regression models
of the panel data, as follows:
DA=a+b1IHERF+b2GHERF+ɛ
where DA is earnings management, a is constant term, b1 and b2 are the estimated
parametersforindustrialdiversification(X1),geographicdiversification(X2),andɛistheerrorterm.
4. Findings and Discussions
4.1DescriptiveStatistics
Descriptivestatisticsistheanalysisofdatathatprovideaconcisedescriptionofagiven
dataset.Theanalysisincludesthemaximumandminimumvalues,meansandstandard
deviations.The following tablepresents theresultsofdescriptivestatisticsof thedata
studied.
Journal of Accounting, Finance and Auditing Studies 3/1 (2017) 52-63
57
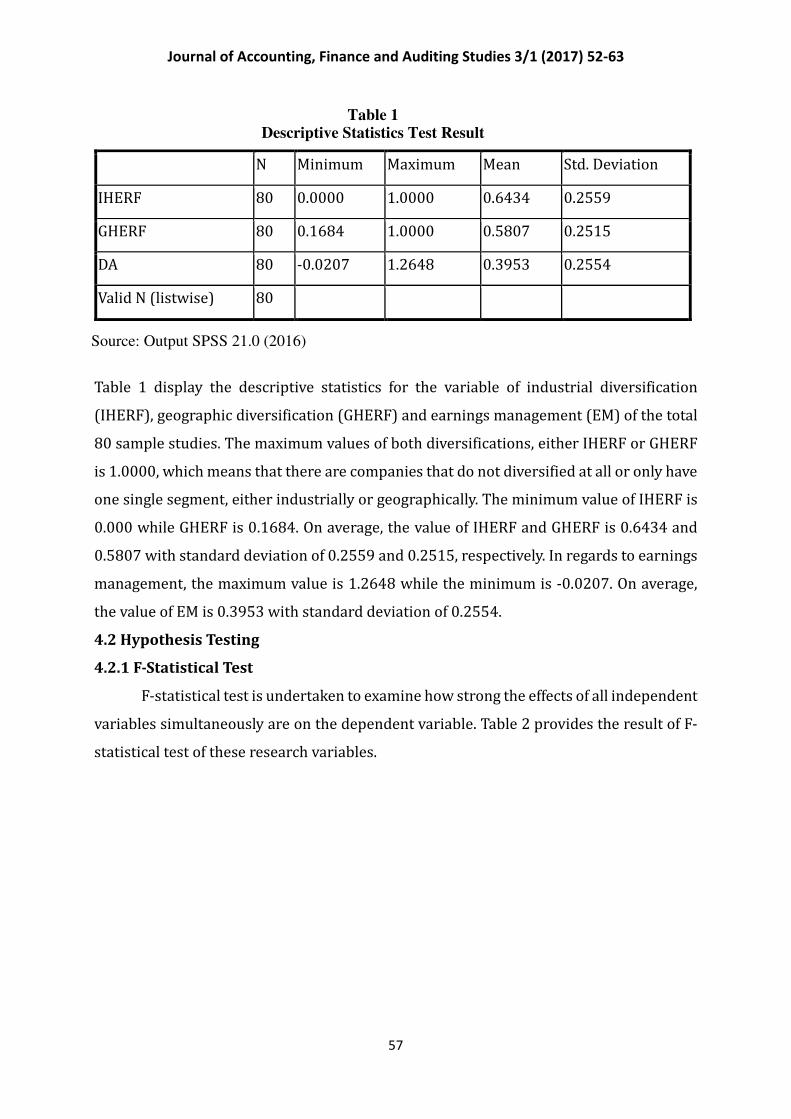
N Minimum Maximum Mean Std. Deviation
IHERF 80 0.0000 1.0000 0.6434 0.2559
GHERF 80 0.1684 1.0000 0.5807 0.2515
DA 80 -0.0207 1.2648 0.3953 0.2554
Valid N (listwise) 80
Table 1 display the descriptive statistics for the variable of industrial diversification
(IHERF), geographic diversification (GHERF) and earnings management (EM) of the total
80 sample studies. The maximum values of both diversifications, either IHERF or GHERF
is 1.0000, which means that there are companies that do not diversified at all or only have
one single segment, either industrially or geographically. The minimum value of IHERF is
0.000 while GHERF is 0.1684. On average, the value of IHERF and GHERF is 0.6434 and
0.5807 with standard deviation of 0.2559 and 0.2515, respectively. In regards to earnings
management, the maximum value is 1.2648 while the minimum is -0.0207. On average,
the value of EM is 0.3953 with standard deviation of 0.2554.
4.2HypothesisTesting
4.2.1F-StatisticalTest
F-statistical test is undertaken to examine how strong the effects of all independent
variables simultaneously are on the dependent variable. Table 2 provides the result of F-
statistical test of these research variables.
Source: Output SPSS 21.0 (2016)
Table 1
Descriptive Statistics Test Result

Journal of Accounting, Finance and Auditing Studies 3/1 (2017) 52-63
58
Table 2 above reveals that the level of significance is 0.000 which is obviously less than
0.05 (5%). It suggests that all the independent variables affect the dependent variable
simultaneously. Thus, it can be concluded that the first hypothesis (Ha1) stated that
industrial diversification and geographic diversification simultaneously affect the practice
of earnings management is not rejected.
4.2.3T-StatisticalTest
T-statistical test is performed to see how strong the partial effect of each of
independent variable on the dependent variable (Ghozali, 2013:98). Table 3 reports the
results of t-statistical test of these research variables:
Model
Unstandardized Coefficients Standardized Coefficients
T Sig. B Std. Error Beta
1 (Constant) -0.01 0.086 -0.117 -0.907
IHERF 0.203 0.097 0.204 2.091 0.040
GHERF 0.474 0.099 0.466 4.786 0.000
Based on table 3, industrial diversification variable (X1) has a significance level of 0.040.
As the level of significance is less than 0.05, and the regression coefficient is positive, i.e.
Model Sum of
Squares
Df Mean
Square
F Sig.
1 Regression 1.400 2 0.700 14.367 .000a
Residual 3.751 77 0.049
Total 5.151 79
Table 2
Table 3
Source: Output SPSS 21.0 (2016)
T-Statistical Test
F-Statistical Test
Source: Output SPSS 21.0 (2016)
b. Dependent Variable: DA
Coefficientsa
a. Predictors: (Constant), IHERF, GHERF
ANOVAb

Journal of Accounting, Finance and Auditing Studies 3/1 (2017) 52-63
59
0.203, thus it infers that (X1) has a positive significance influence on the dependent
variable. Therefore, it can be concluded that the second hypothesis (Ha2) stated that
industrial diversification has a positive significance influence on the earnings
managementisnotrejected.
Geographicdiversificationvariable(X2)hasasignificancelevelof0.000.Asthelevelof
significance is less than 0.05 and the regression coefficient is positive, i.e. 0.474, so it
meansthat(X2)hasapositivesignificanceinfluenceonthedependentvariable.Hence,it
canbeconcludedthatthethirdhypothesis(Ha3)statedthatgeographicdiversificationhas
apositivesignificanceinfluenceonearningsmanagementisnotrejected.
4.2.4 Coefficient of Determination Test
Coefficient of determination test is used to examine how substantial the
independent variable is at explaining the dependent variable. The coefficient of
determinationcanbeseenfromthevalueofRSquareintable4below:
Model R RSquare AdjustedRSquare Std.ErroroftheEstimate
1 .601a .272 .253 0.2207
Table4displaystheresultofRSquare,i.e.0.253.Itmeansthat25.3%ofthevarianceof
earnings management can be explained by the independent variables of industrial
diversificationandgeographicdiversification.However,therest(100%-25.3%=74.7%)
isexplainedbyanothervariableswhicharenotincludedwithinthisresearch.
4.3 Discussion
BasedontheresultsofF-testintable2,thederivedsignificancevalueis0.000,whichis
smallerthan0.05(5%).Thismeansthatalltheindependentvariablewithinthisresearch
(industrial diversification and geographic diversification) simultaneously influence the
dependentvariable(earningsmanagement).ThevalueofRsquare,0.253,intable4shows
a.Predictors:(Constant):IHERF,GHERF
Model Summaryb
Source: Output SPSS 21.0 (2016)
Coefficient of Determination Test
b. Dependent Variable: DA
Table4

Journal of Accounting, Finance and Auditing Studies 3/1 (2017) 52-63
60
thattheindependentvariablesinthemodelcanexplain25.3%ofthedependentvariable.
Thus,tosumup,thefirsthypothesis(Ha1),whichstatedthatindustrialdiversificationand
geographicdiversificationsimultaneouslyaffectthepracticeofearningsmanagementis
notrejectedwhileH01isrejected.
Thelevelofsignificanceofindustrialdiversificationvariable(X1)is0.04anditsregression
coefficientis0.203asshownintable3.Asthelevelofsignificanceislessthan0.05(5%),
andtheregressioncoefficientispositive,itindicatesthatindustrialdiversificationhasa
positive significant influenceon thedependentvariableof earningsmanagement.This
resultcontradictstheworkofLupitasariandMarsono(2014)whichstatedthatindustrial
diversificationdoesnothaveasignificanteffectonthepracticeofearningsmanagement.
This contradictionmightbe causedbydifferent objects andproxiesused in the study.
LupitasariandMarsono(2014)conductedastudyonminingandbankingcompaniesand
measuredthe industrialsegmentbyhowmanysegmentsthecompanyreported,while
this current research is focusedon themanufacturing companies andusesHerfindahl
indextomeasuretheindustrialdiversification.
Ontheotherhand,theresultofthisresearchissupportedbytheworkofRodriguezand
Hemmen(2010),Limetal.(2007)andFarooqietal.(2014).Theyallfoundthatforless
diversifiedcompanies,discretionaryaccrualsarelesspronounced,whereasinrelatively
morediversifiedcompanies,discretionaryaccrualsappeartobemorepronounced.
Finally, the result of this research also confirms the agency conflict hypothesiswhich
stated that the ability of managers to distort information and manipulate earnings
dependsonthecompany’sdegreeoforganizationalcomplexityascausedby industrial
diversification(ChangandYu,2004;KimandPantzalis,2003;LiuandQi,2007).Thus,the
higherthelevelofindustrialdiversificationiscarriedbythecompany,themorelikelythe
companytoexperienceearningsmanagementproblem.
Tosumup,multipleregressionanalysisofthisstudyrevealsthatindustrialdiversification
hasapositivesignificantinfluenceonearningsmanagement.Withinthisregards,itmeans
thatHa2isnotrejectedwhileH02isrejected.
Geographicdiversificationvariable(X2)hasregressioncoefficientvalueof0.474at the
significancelevelof0.000asshowninTable3.Asthelevelofsignificanceislessthan0.05
(5%),andtheregressioncoefficientispositive,itinfersthatgeographicdiversificationhas
apositivesignificanceinfluenceonthedependentvariableofearningsmanagement.This
result is conflicted with the study conducted by Jiraporn et al. (2008) who provides

Journal of Accounting, Finance and Auditing Studies 3/1 (2017) 52-63
61
empirical evidence that geographical diversification alone does not appear to impact
earningsmanagement practices. This conflicted resultmight be raised because of the
differenceofsamplestudiesandyearofobservationbetweenthetwo.Jiraponetal.(2008)
conductedastudyonAmericancompaniesfortheperiodof1994-1998,whilethiscurrent
researchwasconductedoncompanieslistedonIndonesianStockExchangefortheperiod
of2011-2014.
Ontheotherhand,theoutputofthisresearchislinewiththeresearchconductedbyEl
MehdiandSebuoi(2011)whofindsthatearningsmanagementincreaseswiththelevelof
geographic diversification. This finding is also consistentwith thework of Chin et al.
(2009)whichstatesthatgreatercorporateinternationalizationisassociatedwithahigher
levelofearningsmanagement.
Thus, it is inferred that again this current research agrees to accept the information
asymmetry problem under agency conflict hypothesis proposed. Deployment of
company’sassetandoperationsacrossdifferentgeographicalregionincreasesthelevel
oforganizationalcomplexity.Thisorganizationalcomplexitywillinturnincreasethelevel
ofinformationasymmetrybetweenthemanagersandtheshareholders(Lupitasariand
Marsono,2014)andatthesametimethisalsoleadstotransparencydecrement(Chinet.
al,2009)whichopensthedoortothepracticeofearningsmanagement.
There is, therefore, multiple regressions analysis of this study agrees that geographic
diversificationhasapositivesignificantinfluenceonearningsmanagement.Withinthis
contention,itmeansthatH3isnotrejectedwhileH03isrejected.
5.Conclusion
This study is aimed at seeking the empirical evidence of the effect of industrial
diversificationandgeographicdiversificationonthepracticeofearningsmanagementin
manufacturingcompaniesinIndonesia.Theresultssuggestthatindustrialdiversification
and geographic diversification simultaneously and partially have a significant positive
effectonthepracticeofearningsmanagementonmanufacturingcompaniesinIndonesia.
This evidence provides a new insight for the financial statement users, such as
stockholders, potential investors and creditors for the sake of their decision-making
process.Indeterminingtheperformanceofthecompany,theyshouldtakeintoaccount
the more risk of earnings management practice that bears from an industrially and
geographicallydiversifiedcompanies.
However,oneshallalsonote that theassosiationbetweendiversificationandearnings

Journal of Accounting, Finance and Auditing Studies 3/1 (2017) 52-63
62
managementmaynotholdinothersectorsandcountries.Differentbehaviorsindifferent
sectors and countries may reflect different pressure towards the practice of earnings
management.Inthisregards,thereisaneedtoconductmoreexaminationofthiseffects
toothersectorsorcountries.
References
Arfan, Muhammad. 2006. Pengaruh Arus Kas Bebas, Set Kesempatan Investasi, dan
FinancialLeverageterhadapManajemenLaba.UnpublishedDisertation.Bandung:
DoctoralDegreeofPadjajaranUniversity.
Chin,C.L,Y.J.Chen,&T.J.Hsieh.2009.InternationalDiversification,OwnershipStructure,
LegalOriginandEarningManagement:EvidencefromTaiwan.JournalofAccounting,
AuditingAndFinance,24:223-362.
Chang, C. and Yu, X. 2004. Investment Opportunities, Liquidity Premium and
ConglomerateMergers,JournalofBusiness,77,1:45-75.
Dechow, P. M., R. G. Sloan, A.P Sweeney. 1995. Detecting Earnings Management, The
AccountingReview,70,2,193-225.
ElMehdi, I.M.& S. Sebuoi. 2011. CorporateDiversification andEarningsManagement.
ReviewOfAccountingAndFinance,10,2:176-196.
Farooqi, J., O. Harris, & T. Ngo. 2014. Corporate Diversification, Real Activities
Manipulation,andFirmValue. JournalofMultinationalFinancialManagement,27:
130-151.
Ghozali, Imam. 2013. Aplikasi Analisis Multivariate dengan Program SPSS. Semarang:
BadanPenerbitUniversitasDiponegoro.
Harto,Puji.2005.KebijakanDiversifikasiPerusahaandanPengaruhnyaterhadapKinerja:
StudiEmpirisPadaPerusahaanPublikdiIndonesia.SimposiumNasionalAkuntansi
(SNA)VIII.Solo.
Jiraporn, P., Y.S Kim, & I. Marthur. 2008. Does Corporate Diversification exacerbate or
Mitigate Earnings Management? An Empirical Analysis. International Review of
FinancialAnalysis.17,5:1087-1109.
Kartono,Salim.2010.CrisisToWin.JakartaSelatan:Transmedia.
Kim, C. & C. Pantzalis. 2003. Global/Industrial Diversification and Analyst Herding,
FinancialAnalystsJournal,59,2:69-79.
Liu,Q.andR.Qi.2007.StockTradingandDiversificationDiscount,EconomicsLetters,98,
1:35-40.
Journal of Accounting, Finance and Auditing Studies 3/1 (2017) 52-63
63
Lim,C.Y.,DavidK.D,&TiongY.T.2008.FirmDiversificationandEarningsManagement:
Evidence from Seasoned Equity Offerings. Review of Quantitative Finance and
Accounting,30,1:69-92.
Lupitasari, D & Marsono. 2014. Diversifikasi Perusahaan dan Management Laba.
DiponegoroJournalofAccounting,1,1:1-12.
Rodriguez P, Gonzalo & S.V. Hemmen. 2010. Debt, Diversification, and Earning
Management.JournalofAccountingandPublicPolicy.29:138-159.
Satoto,HeruS.,2007.StrategiDiversifikasiterhadapkinerjaPerusahaan.JurnalKeuangan
danPerbankan,13,2:280-287.