correlations between clinical measures and symptoms
TRANSCRIPT

Journal of Optometry (2020) 13, 171---184
www.journalofoptometry.org
ORIGINAL ARTICLE
Correlations between clinical measures and symptoms:
Report 1: Stereoacuity with accommodative, vergence
measures, and symptoms
Samuel Otabor Wajuihian
Discipline of Optometry, School of Health Sciences, University of KwaZulu-Natal, Private Bag X54001, Durban 4000, South Africa
Received 30 May 2019; accepted 24 February 2020
Available online 29 May 2020
KEYWORDSRandot stereoacuitytest;Accommodation andvergence measures;Symptoms
Abstract
Aim: The aim of this study was to explore associations between reduced stereoacuity and
clinical measures of accommodation, vergences, and symptoms which could facilitate the
development of quick and reliable screening tools.
Methods: Using a multi-stage random cluster sampling, 1211 high school students (481 males
and 730 females) between 13 and 18 years of age, were selected and examined. Visual acuity,
stereoacuity and suppression, refractive errors, near point of convergence, heterophoria and
fusional vergences, as well as, amplitude of accommodation, accommodative response, facility
and relative accommodation were evaluated. Correlations among variables and the validity
of Randot stereoacuity to distinguish between children with and without defective clinical
measures as well as symptomatic versus asymptomatic children were characterized by the
sensitivity and specificity of the tests.
Results: The overall mean stereoacuity was 43.9 ± 25.23 s arc, and 18.9% [95% Confidence Inter-
val, 16.6−21.4%)] of the participants had reduced stereoacuity (defined as ≥60). Stereoacuity
values and symptoms scores were worse in children with defective clinical measures. The
Receiver Operation Curve showed that maximum sensitivity and specificity was obtained with
near point of convergence break (≥10 cm) of (0.70 95% confidence interval: 0.63---0.77) with
Randot stereoacuity test (defined as ≥60 s arc). The correlations between reduced stereoacu-
ity and symptoms scores was moderately strong and statistically significant (Pearson’s, r = 0.507,
p = 0.01). The Receiver Operation Curve showed that maximum sensitivity and specificity
obtained with the Convergence Insufficiency Symptoms Survey was 0.57 (95% Confidence
interval = 0.53---0.62, p = 0.001), sensitivity of 90.26%, and specificity 15.26% with the Randot
stereoacuity test.
E-mail addresses: [email protected],
https://doi.org/10.1016/j.optom.2020.02.002
1888-4296/© 2020 Spanish General Council of Optometry. Published by Elsevier Espana, S.L.U. This is an open access article under the CC
BY-NC-ND license (http://creativecommons.org/licenses/by-nc-nd/4.0/).

172 S.O. Wajuihian
Conclusion: Reduced stereoacuity, defective clinical measures and symptoms of asthenopia
were prevalent among sample of school children studied. Randot stereoacuity test could fairly
distinguish between defective and normal clinical measures; though the accuracy to differen-
tiate between symptomatic and asymptomatic school children is poor. These findings highlight
the need for validation of a simple and fast screening tool in school settings. Further studies to
confirm above findings will be needed.
© 2020 Spanish General Council of Optometry. Published by Elsevier Espana, S.L.U. This is an
open access article under the CC BY-NC-ND license (http://creativecommons.org/licenses/by-
nc-nd/4.0/).
PALABRAS CLAVEPrueba deestereoagudeza derandot;Medidas deacomodación yvergencia;Síntomas
Correlaciones entre medidas clínicas y síntomas: Informe1: estereoagudeza con
medidas de acomodación, vergencia, y síntomas
Resumen
Objetivo: El objetivo de este estudio fue explorar las asociaciones entre la reducción de
estereoagudeza y las medidas clínicas de acomodación, vergencias y síntomas que pudieran
facilitar el desarrollo de herramientas de cribado rápidas y fiables.
Métodos: Utilizando un muestro de clúster aleatorio de etapas múltiples, se seleccionó y exam-
inó a 1.211 estudiantes de secundaria (481 varones y 730 mujeres) de edades comprendidas
entre 13 y 18 anos de edad. Se evaluó agudeza visual, estereoagudeza y supresión, errores
refractivos, punto próximo de convergencia, heteroforia y vergencias fusionales, así como
amplitud de acomodación, respuesta acomodativa, y acomodación de facilidad y relativa. Las
correlaciones entre las variables y la validez de la prueba de estereoagudeza de Randot para
distinguir entre los ninos con y sin medidas clínicas defectuosas, así como los ninos sintomáticos
versus asintomáticos se caracterizaron mediante la sensibilidad y especificidad de las pruebas.
Resultados: El valor de estereoagudeza media global fue de 43,9 ± 25,23 seg arc, y el 18,9% [95%
de intervalo de confianza, 16,6−21,4%)] de los participantes tenía estereoagudeza reducida
(definida como ≥60). Los valores de estereoagudeza y las puntuaciones de los síntomas fueron
peores en ninos con medidas clínicas defectuosas. La curva de operación del receptor reflejó que
la sensibilidad y especificidad máximas se obtenían con rotura del punto próximo de convergen-
cia (≥ 10 cm) (0,70 95% de intervalo de confianza: 0,63---0,77) con la prueba de estereoagudeza
de Randot (definida como ≥ 60 seg arc). Las correlaciones entre estereoagudeza reducida y las
puntuaciones de los síntomas fueron moderadamente fuertes y estadísticamente significativas
(r de Pearson = 0,507, p = 0,01). La curva de operación del receptor reflejó que el valor de sen-
sibilidad y especificidad máximas obtenidas con los síntomas de insuficiencia de convergencia
era de 0,57 (95% de intervalo de confianza = 0,53---0,62, p = 0,001, sensibilidad del 90,26%, y
especificidad del 15,26% con la prueba de estereoagudeza de Randot.
Conclusión: La reducción de la estereoagudeza, las medidas clínicas defectuosas y los sín-
tomas de astenopia fueron prevalentes entre la muestra de estudiantes analizada. La prueba de
estereoagudeza de Randot podría distinguir bastante bien entre medidas clínicas defectuosas
y normales, aunque la precisión para distinguir entre estudiantes sintomáticos y asintomáticos
es bastante débil. Estos hallazgos subrayan la necesidad de validar una herramienta de cribado
simple y rápida en centros escolares. Se necesitan estudios futuros para confirmar los hallazgos
anteriores.
© 2020 Spanish General Council of Optometry. Publicado por Elsevier Espana, S.L.U. Este es un
artıculo Open Access bajo la licencia CC BY-NC-ND (http://creativecommons.org/licenses/by-
nc-nd/4.0/).
Introduction
Stereopsis is defined as binocular visual depth perceptionbased on retinal rivalry and involves a complex neural inter-action between motor and sensory processes.1---3 Stereopsisis one of the parameters used to evaluate the interactions ofthe accommodative and vergence systems.1---3 Stereoacuityis the smallest amount of horizontal retinal image disparity
that gives rise to a sensation of relative depth.1,2 Saladin3
described stereoacuity as a ‘‘barometer of vision’’ and goodstereoacuity is a measure of the presence of good binocu-larity. In some case, however, defects in clinical measuresof accommodation and vergence become more clinicallyimportant when individuals become symptomatic and visualperformance are affected.4 Evaluating patients’ symptomsplay a fundamental role in vision care practice as most

Correlations between clinical measures and symptoms 173
patients consult the eye care practitioners because theirsymptoms bother them.
Another variable of interest is vision screening----whichhas been a strategic way to identify persons who havevision anomalies. This is relevant especially for under-privileged children who may be unable to afford anindependent optometrist. Given the settings of most screen-ings, researchers require simple, fast and reliable screeningtools and protocols which will enable them to minimize falsepositive referrals. A simple tool such as the stereoacuity testwhich has been reported to be a good screening tool amonguniversity students5 will be useful. However, studies onthe association between stereoacuity and accommodativeand vergence anomalies which could enhance validation ofstereoacuity as a screening tool are scarce. A good startingpoint to such studies is exploring the possible correlationsamong stereoacuity and accommodative and vergence mea-sures.
A few studies in the 1950s investigated aspects ofthe relation of vergence measures and stereoacuity usinglaboratory experiments. Findings from these studies areinconsistent.6---11 Poggio and Poggio noted that given theimportance of eye movements in stereopsis, it is surpris-ing that so little is known about its role in stereopsis.12
Besides placing targets of interest on the horopter for fusion,vergence eye movements also bring them into the rangeof maximum stereoacuity.1,12 Therefore, defects in oculo-motor systems may influence stereocuity. The only relatedstudy was reported by Garzia and Nicholson.13 They inves-tigated stereopsis, accommodative and vergence facility in43 university baseball players and found that only 6% of stu-dents with poor accommodative facility failed stereoacuitytest.13 Furthermore, only two available studies reported onstereoacuity and symptoms5,14 Ponsonby et al.14 studied chil-dren aged 7---14 years in Tasmania while Momeni-Moghadamet al.5 studied binocular anomalies and symptoms in auniversity population (mean age 20.89 ± 1.3 years). Bothstudies5,14 Ponsonby et al.14 found that participants withreduced stereoacuity had higher symptoms scores using theCISS.
In general studies on the associations of reducedstereoacuity and clinical measures and symptoms especiallyin a high school population are scares. Therefore, the aimof the present study was to explore associations betweenstereoacuity and clinical measures of accommodation andvergences, and symptoms. The hypotheses proposed wasthat significant association between reduced stereocuitiesand defects in clinical measures, and with symptoms willsuggest that reduced stereoacuity could predict participantswith deficient clinical measures and those who may be symp-tomatic.
Methods
Study design
This cross sectional study was designed to quantify nearvision anomalies (refractive and accommodative-vergence)and their association with symptoms in order to developstrategies on how to identify and treat them. Therefore, thefocus of this report is on near vision variables. The study
protocol was approved by the Biomedical Research EthicsCommittee (ethical clearance reference number BE 177/12)of the University of KwaZulu-Natal, South Africa. Writteninformed consents for access to the schools were obtainedfrom the KwaZulu-Natal’s Department of Education and theschool principals.
Sampling
The target population was Black high school students inthe uMhlathuze Municipality of northern Kwazulu-NatalProvince, South Africa. The study participants comprised1211 children (481 males and 730 females) with age rangesof between 13---18 years who were selected from 13 outof a sample frame of 60 high schools in the municipality.The sample size was derived from the original study---part ofwhich has been published elsewhere.15,16 The conduct of thisstudy complied with the Declaration of Helsinki regardingresearch on human subjects. For the entire study, studentswere excluded if they had suppression on the Worth-4-dot,strabismus, ocular diseases, nystagmus, motility problems,and any systemic conditions or were on any systemic medi-cation that might affect near vision function.
Study settings, materials and procedure
The school principals provided rooms at the school venueswhere the vision examinations were conducted. The pur-pose and procedure for every technique were carefullyexplained to each participant before starting the eye exam-ination procedures. Validated optometric instruments wereused and techniques were applied as described. As much aspossible, the same conditions including test distances andstandard room illumination were applied for all sessions andat all testing sites. All vision testing was performed between08h30 and 13h30 over a period of one year and eye exami-nations were not performed when students were preparingfor examinations or during examination days.
Symptoms survey
The case history comprised information on the historyof ocular and systemic conditions, as well as the historyrelated to near tasks, which was based on the ConvergenceInsufficiency Symptom Survey (CISS)17 (Part1) (Appendix A,Supplementary material). The CISS is a validated reliablesymptoms survey developed to study the frequency andseverity of symptoms and to distinguish between symp-tomatic and asymptomatic convergence insufficiency (CI)children.17,18 It uses a Likert-type scale with responses from15 questions regarding the symptoms participants expe-rienced when reading or doing close work.17,18 The CISSallows a recording for whether the symptom is present andhow often. The 15 items are summed to obtain an overallCISS score, with symptom severity ranging from 0 (asymp-tomatic) to 60 (most symptomatic).17,18 To administer theCISS, the examiner reads each of the 15 questions aloudwhile the participant views a card listing the five possibleresponses (never, infrequently, sometimes, fairly often, oralways) which are assigned corresponding scores of 0, 1, 2,

174 S.O. Wajuihian
3, and 4.17,18 Although the CISS was validated for CI, theinventors17 suggested that it could be applied to investigatesymptoms of other anomalies and as reported in Gallawayand Mitchell,18 only one available study had done so whileother studies have applied the CISS to evaluate symptoms fornon-CI clinical measures.5.14 Because the CISS did not coverall symptoms items that may be associated with accom-modative and vergence defects, a second questionnaire(Appendix B, Supplementary material) was compiled fromsources detailed elsewhere.16
Data collection procedures
Preliminary tests
As an approach to avoid bias, the research assistant instation one worked independently of the optometrist whocollected data in station two. The tests in the second stationwere performed by one certified optometrist who was expe-rienced in performing the techniques therefore addressingthe concern of inter-examiner variability. The techniquesperformed in the second station included the preliminaryand the main tests.
The preliminary tests were performed with participantswearing no optical correction and included ocular healthstatus evaluation using the direct ophthalmoscope, sup-pression was evaluated at near using the Worth-4-Dot test(Bernell Corporation, Mishawaka Inc, USA).15,16 Other testsincluded evaluation of refractive errors objectively using anautorefractor (MRK/3100; Huvitz, Seoul, South Korea) andsubjectively.15,16 Cycloplegia was not applied as the entirestudy was on investigating near vision anomalies and cyclo-plegia could affect near vision functions. In addition, theintention was to evaluate students’ binocular vision statusin their habitual state. Cycloplegia could not be applied asthe focus of the study was on near function which will bedisrupted by cycloplegia and school authorities declined per-mission to use cyclopegia. All cases were treated as new toensure that maximal refractive compensation was utilisedalthough most students did not wear glasses. As cycloplegiawas not applied a +2.00 D lens was used to screen for latenthyperopia.4
Stereoacuity
Stereoacuity tests measure the smallest amount of recogniz-able retinal disparity in seconds of arc and this was assessedusing the Randot stereo test (RST) (Vision Assessment Corpo-ration, New York, USA) which measures global and contour(local) stereopsis.19,20 The RST measures fine stereopsis (per-ception obtained from small retinal disparities that canbe fused for single vision)20 and has been reported to bethe most sensitive of the clinical test for stereoacuity andthe reports on presence or absence of monocular cue isinconsistent.21---23 The test booklet comprise symbols (house,square, apple and big circle) (measures from 400 to 100 s arcand smaller circles on test page19,20 (Fig. 1).
The test comprises 12 sets (of three circles with fourrows) and the vectographic method is used to presentdisparity.9,22 The circles measure fine local stereopsis (400down to 12.5 s arc)19 and were used for this test. The testwas done at 40 cm in normal room illumination with partic-ipant sitting and wearing vectographic spectacles without
Figure 1 Randot Stereoacuity test booklet. The bottom last
plate scores up to 12.5 s arc.
refractive correction in line with some objectives of themain study. Participants‘attention was then directed to thetop 4 panels on the right-hand side of the open test booklabelled A, B, C, and D. Given a time limit of 5 per linefor response, participant was asked to identify the 3 pan-els which contain either a shape or figure.19 Regardless ofwhether or not all figures were correctly identified and tomeasure fine stereoscopic threshold, the participant wasasked to look at the 12 boxes each containing 3 circles andto indicate which circle (left, middle, or right) appeared tobe floating (or ‘‘pop out’’) slightly above the other circlesand that is the only circle that has crossed disparity.19,23 Theprocedure was repeated for boxes 2---12 and the number offigures identified correctly was recorded. The first consis-tent incorrect response on the circles was considered thelimit of disparity except when the patient identified twoconsecutive finer stimuli correctly.19,23
Accommodative and vergence tests
The accommodative and vergence tests are routine opto-metric techniques and have been described in detail inan earlier publication15,16 All near tests were performedat 40 cm with the best refractive distance corrections inplace. The tests were performed three times and an aver-age reading taken for analysis. For vergence test, the studyis delimited to the report of only break values for NPC,negative fusional (BI) and positive fusional vergences (BO)respectively as the blur points of most participants appearedinconsistent. The near point of convergence (NPC) was mea-sured using the Royal Air Force (RAF) rule with a verticalline target, the unilateral cover test was first performedto rule out strabismus while distance and near heteropho-ria were evaluated using the von Graefe technique in aspecially-designed phoropter tripod.15,16 Fusional vergences(positive and negative) were measured using a horizontalprism bar (Gulden B-16 horizontal prism bars-Gulden Oph-

Correlations between clinical measures and symptoms 175
thalmics, Elkins Park, PA). Negative fusional vergence wasmeasured first before positive fusional vergences.16,21
Accommodation tests performed included the amplitudeof accommodation (AA) which was assessed using the Don-der’s push-up method with the RAF near point rule,15,16
accommodation response (AR) was measured using themonocular estimated method (MEM) dynamic retinoscopytechnique15,16 and accommodative facility (AF) was assessedusing the plus/minus 2.00 D flipper lens. Relative accom-modation tests were performed on the phoropter, negativerelative accommodation (NRA) was measured first followedby positive relative accommodation (PRA).15,16
Data analysis
All data were entered on Microsoft Excel, checked by theauthor and analyzed by a statistician using the Statisti-cal Package for Social Sciences (SPSS for Windows, Version21.0, IBM-SPSS, Chicago, IL, USA). Descriptive statisticswere presented as means, standard deviation and median.The Kolmogorov-Smirnov (K---S) was used to test for nor-mality of data and given that most data were borderlinebetween normal and non-normal distribution, both para-metric and non-parametric statistical tests were applied toanalyse most data. Specifically, both the Mann-Whitney test,Kruskal-Wallis and the t-tests were used to compare meansand medians of defective clinical measures for stereoacuityand symptoms. Similarly, the Pearson correlation tests wereused to compare the correlations between stereoacuity andclinical measures, as well as, with symptoms while Spear-man’s rho test was used to examine correlations betweenclinical measures and symptoms. A p value of ≤ 0.05 wasconsidered statistically significant. The descriptive statisticsare presented using tables, while the frequency distributionsof stereoscopic threshold are presented using the histogram.The criteria applied to define the clinical measures (Table 1)were derived from a recent study on normative data fromthe sample using at least the mean ± 1 SD.15,16
A simple, fast and valid screening tool is required to min-imize over referrals and validation of screening tools wereachieved through sensitivity, specificity and the ReceiverOperation Curve (ROC) analysis. The ability of the test toolto distinguish between children with and without defects inthe present study was characterized using the sensitivity andspecificity of the tests.18 The sensitivity of the test is calcu-lated as the percentage of children with defects in clinicalmeasures who were correctly identified by the test tool. Tobe considered useful to identify vision defects, a high sensi-tivity (or low rate of false-negative results) is required whilea high specificity (or low rate of false-positive results) is nec-essary to conclude that the test is a useful tool for confirmingdeficiencies in clinical measures.18
Results
Sample characteristics
A total of 1211 returned their consent and assent formsbut 10 students were excluded, (seven had amblyopia, onewas diabetic, another was diagnosed with glaucoma and theother had corneal scars due to trauma) leaving 1201. A fur-
Table 1 Criteria applied to define deficient clinical
measured.
Clinical measures Cut-off
criteria (Fail)
Stereoacuity
Reduced stereoacuity (sec arc) ≥ 60
Vergence
Near point of convergence (NPC) (cm) ≥ 10
Near exophoria (pd) ≥ 6
Near esophoria (pd) ≥ 2
Right near hyperphoria (pd) ≥ 0.5
Fusional vergences (FV) (pd)
Negative fusional vergence break (pd) ≤ 12
Positive fusional vergence break (pd) ≤ 16
Sheard’s criterion = FV ≥ 2 X phoria (pd)
Accommodation
Amplitude of accommodation (AA)
(binocular) D
≤ 12
Accommodative facility (AF) ± 2
(binocular) (cpm)
≤ 5
Accommodative response (AR) DS ≥ 0.75
Negative relative accommodation DS ≥ + 2.50
Positive relative accommodation DS ≥ −3.00
ther 145 children aged 19 and older were excluded from thisreport as it is intended to report only on participants of offi-cial high school age range of 13---18 years in South Africa.Thus, data was analyzed for 1056 participants (a responserate of 87%) with mean age 15.8 ± 1.58 years and a medianage 16 years. There were 403 (38%) males and 653 (62%)females. The sample comprised 781 (73.9%) students fromgrades 8---10 (lower grade level) and 275 (26.0%) from grades11---12 (higher grade level).There was a high correlationbetween left and right eyes spherical equivalent refractions(r = 0.645, p = 0.01), therefore, only data for right eye arereported. The prevalence of refractive errors in this sam-ple was: myopia: 6%, astigmatism 2.3%, anisometropia 1.3%and hyperopia 6.8%. The descriptive statistics for refrac-tive, accommodative and vergence measures are shown inTable 2. All results reported are for near accommodative andvergence measures.
Frequency distribution of stereoscopic thresholds
The stereo threshold of 40 arc sec was the most frequent(Fig. 2).
Prevalence and distribution of reducedstereoacuity
The main criteria used to define reduced stereoacuity were≥60 s arc and this was used for analysis and associationswith symptoms. The prevalence of reduced stereoacuitywas 199 (18.9%) (95% CI = 16.6---21.4). Other distributionsincluded ≥40 which was 699 (66.5%) (95% CI = 63.5---69.3%)while ≥ 80 was 58 (5.5%) (95% CI = 4.2---7.1%). Gen-der did not influence the distribution of stereoacuity(males, mean = 43.3 ± 29.3), (females, mean = 44.4 ± 22.4)(t = 0.495, p = 0.68) although participants in the older age-

176 S.O. Wajuihian
Table 2 Descriptive statistics for accommodative and vergence measures and symptoms.
Clinical measures N Mean, SD Skew
Symptoms scores 1052 27.38 ± 11.04 −0.120
Refraction
Right eye sphere (DS) 1056 −0.01 ± 0.36 −6.22
Right eye cylinder power (DC) 1056 −0.07 ± 0.25 −8.24
Stereoacuity (sec arc) 1055 43.9 ± 25.23 4.41
Vergence
Near point of convergences (NPC) (cm)
Near point of convergences break (cm) 1056 6.88 ± 2.88 6.15
Near point of convergences recovery (cm) 1056 9.48 ± 3.47 5.25
Heterophoria (near) (pd)
Lateral (pd) 1056 −1.78 ± 4.24 0.26
Vertical (pd) 1056 0.03 ± 0.36 14.91
Near fusional vergences (pd)
Negative fusional vergence break (pd) 1055 17.37 ± 5.45 0.66
Negative fusional vergence recovery (pd) 1055 12.52 ± 4.23 0.07
Positive fusional vergence break (pd) 1055 25.38 ± 9.16 −0.41
Positive fusional vergence recovery (pd) 1055 17.49 ± 6.77 0.35
Accommodation (D)
Amplitude of accommodation (bin) (D) 1056 15.6 ± 3.19 −0.58
Accommodative facility binocular ± 2 (cpm) 996 8.75 ± 3.46 −0.68
Accommodative response (lag)(D) 1051 0.55 ± 0.21 0.06
Negative relative accommodation (D) 1055 2.17 ± 0.48 −2.76
Positive relative accommodation (D) 1055 −2.44 ± 0 .71 1.43
30
25
20
15
10
5
0
10 12.5 16 20 25 32 35 40 50 53 63 80 100 125 160 200 400
Stereo-threshold (sec arc)
0.38
3.24
5.52 5.04
8.47
10.75
26.45
21.03
13.42
4.47
0.1 0.1 0.29 0.48 0.10.10.1
Fre
quency (
%)
Figure 2 Frequency of stereoacuity values.
group (16---18 years) had a significantly higher (worse)mean stereoacuity (mean = 45.9 ± 28.0 years) than thosein the younger age group (13---15 years) mean stereoacu-ity = 40.96 ± 20.04 years (t = 3.14, p = 0.002).
Associations between stereoacuity and clinicalmeasures
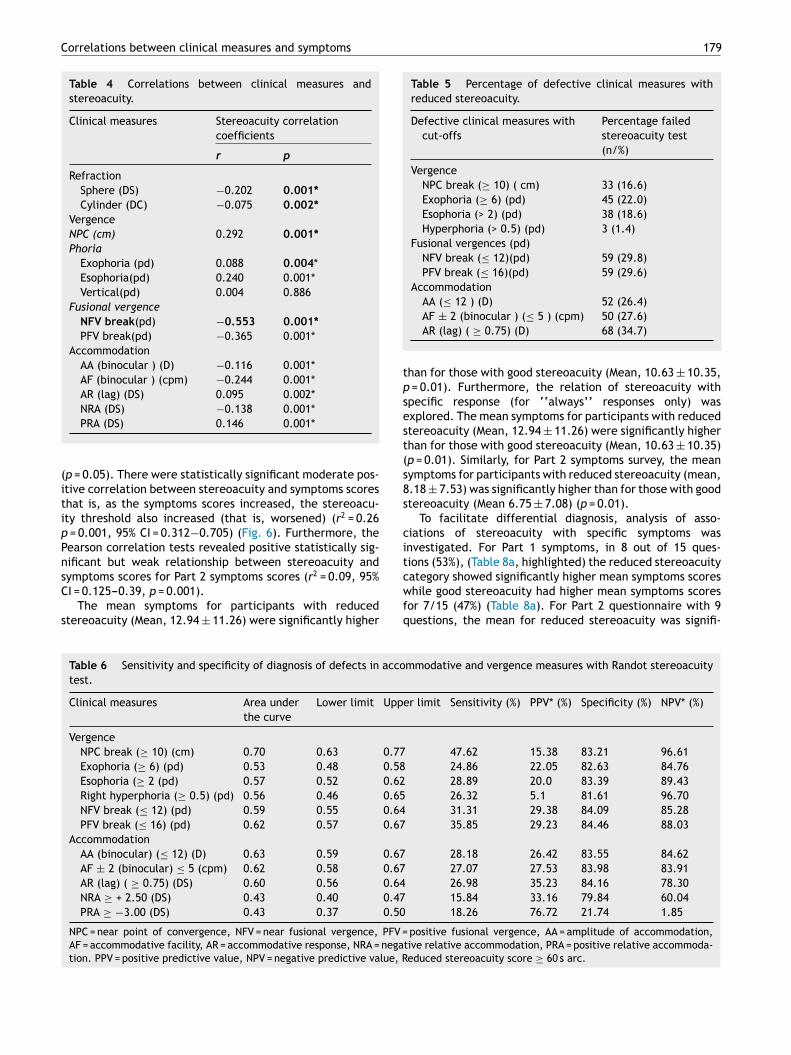
Given that the data for stereoacuity was skewed, theMann-Whitney test non-parametric test was used to anal-yse associations between clinical measures and stereoacuity.The median stereoacuities for defective clinical mea-sures were significantly higher (worse) than for normalranges for most clinical measures except near hyperphoriaand positive relative accommodation (Table 3). Further-more, the Pearson’s correlation test showed significantand moderate correlations between clinical measures and
stereoacuity except for vertical phoria (Table 4). The medianstereoacuities for convergence measures are higher thanaccommodative measures indicating that convergence mea-sures have worse stereoacuities with stronger associations.
Prevalence of defective clinical measures withreduced stereoacuity
A high percentage of participants who had defective clinicalmeasures also had reduced stereoacuity (Table 5) and parti-cipants with accommodation lag had the highest frequencyof fails of the stereoacuity test while hyperphoria had theleast frequency of failure of stereoacuity
To explore the accuracy of the Randot stereoacuity testto distinguish between normal and defective clinical mea-sures, the sensitivity and specificity estimates (Table 6), theROC curves characteristics (Fig. 3A---K) as well as, the oddsratios (Table 7) were analyzed. A stereoacuity test (withcut-off of ≥60 s arc) was more likely to be accompaniedwith reduced NPC break, PFV, reduced AA, AF and lag ofaccommodation (Table 6). The reverse nature of the plotsfor relative accommodation shows that Randot stereoacuitytest cannot identify defective relative accommodation.
The ROC for the accommodative and vergence were rep-resented by the Fig. 3 (A---K): near point of convergencebreak, B: exophoria C: esophoria, D: right hyperphoria, E:negative fusional vergence, F: positive fusional vergence, G:amplitude of accommodation, H: accommodative facility, I:accommodative lag, J: negative relative accommodation, K:positive relative accommodation.

Correlations between clinical measures and symptoms 177
Figure 3 XXX.
3531.5
28.7
26.3
21 20.5 20 19.818.7
16.515.5 15
13.411.6
9.3 8.9
30
25
20
15
10
5
0
Re-
read
Feel sleep
y
Rea
d slow
ly
Eyes hu
rt
Hea
dach
es
Trou
ble
rem
embe
ring
Eyes fe
el tire
d
Eyes so
re
lose
con
cent
ratio
n
unco
mfo
rtable
Lose
place
Pullin
g
Wor
ds b
lurring
Dou
ble
vision
Wor
ds ju
mp,
swim
,
Fre
quency (
%)
Figure 4 Frequency of CISS (Part 1) symptoms.

178 S.O. Wajuihian
Table 3 Associations between stereoacuity and clinical measures.
Clinical measures/cut-offs Median stereoacuity
(sec arc)
Mann-Whitney test
values (p-)
n
Vergence
NPC ( ≥ 10 cm) 66 58 36.69 (0.001)*
NPC (< 10 cm) 984 40
Heterophoria
Exophoria (≥ 6) (pd) 172 40 2.47 (0.116)
Exophoria( < 6) (pd) 874 40
Esophoria ( ≥ 2) (pd) 135 40 8.31 (0.004)*
Esophoria (< 2) (pd) 908 40
Hyper phoria (≥ 0.5) (pd) 38 40 1.71 (0.191)
Hyper phoria ( < 0.5) (pd) 1006 40
Fusional vergences
NFV (≤ 12) (pd) 184 50 19.60 (0.001)*
NFV (> 12) (pd) 863 40
PFV (≤ 16) (pd) 161 50 27.41 (0.001)*
PFV ( > 16 ) (pd) 890 40
Accommodation
AA (binocular) (D)
AA (≤ 12) (D) 183 50 33.04 (0.001)*
AA (> 12) (D) 866 40
AF (binocular)
AF ± 2 ( ≤ 5) (cpm) 182 50 30.47 (0.001)
AF ± 2 ((> 5) (cpm) 807 40
Accommodative response
AR (lag) (≥ 0.75) (DS) 252 50 26.20 (0.001)*
AR (lag) ( < 0.75) (DS) 792 40
Relative accommodation
NRA ( ≥ +2.50) (DS) 404 40 12.90 (0.001)*
NRA ( < 2.50) (DS) 640 40
Positive relative accommodation
PRA ( ≥ −3)(DS) 69 40 3.05 (0.081)
PRA ( < −3) (DS) 975 40
Variables with significant associations. NPC = near point of convergence, NFV = near fusional vergence, PFV = positive fusional vergence,
AA = amplitude of accommodation, AF = accommodative facility, AR = accommodative response, NRA = negative relative accommodation,
PRA = positive relative accommodation.
Stereoacuity and symptoms
Frequency of CISS symptoms scores
Using the CISS survey, for Part 1 questionnaire, a highpercentage 903 (86%) of participants were symptomatic(defined as ≥16) [41.29% were mildly symptomatic, 32%moderately and 27% severely symptomatic when comparedto 149 (14%) who were asymptomatic. For Part 2, 562 (53%)were symptomatic whereas 490 (47%) were asymptomaticalthough the survey was validated only for Part 1 survey.
According to Borsting et al.17 the performance-related
subscale (PRS) which consisted of six symptoms included loss
of concentration, loss of place with reading, reading slowly,
trouble remembering what was read, getting sleepy while
reading and having to re-read lines. The eye-related sub-scale consists of nine symptoms specific to visual functionor asthenopic-type complaints (such as eyes hurt, diplopia,blurred vision, headaches, eye tiring, eyes sore, words that
move and jump, uncomfortable eyes and pulling sensationsaround the eyes).17 The (PRS) are more frequent than theeye-related which was the case in the present study for fourof the PRS symptoms (Fig. 4) Symptoms from Part 2 (Fig. 5)are not part of the validated CISS scale.
Association between symptoms and reducedstereoacuity (Part 1 symptoms survey)
Overall, the mean symptoms scores for Part 1 was27.38 ± 11.04 and 15.93 ± 7.43 for Part 2 symptoms ques-tionnaire and the mean symptoms score (44.31 ± 24.88)for children with reduced stereoacuity was significan-tly worse than (39.15 ± 19.50) (p = 0.01) for those withnormal stereoacuity. Similarly, symptomatic participantshad significantly worse mean stereoacuity (31.96 ± 9.30)than the asymptomatic participants (8.58 ± 5.06) (p = 0.02).However, for percentages, the association between symp-toms and reduced stereoacuity was marginally significant
Correlations between clinical measures and symptoms 179
Table 4 Correlations between clinical measures and
stereoacuity.
Clinical measures Stereoacuity correlation
coefficients
r p
Refraction
Sphere (DS) −0.202 0.001*
Cylinder (DC) −0.075 0.002*
Vergence
NPC (cm) 0.292 0.001*
Phoria
Exophoria (pd) 0.088 0.004*
Esophoria(pd) 0.240 0.001*
Vertical(pd) 0.004 0.886
Fusional vergence
NFV break(pd) −0.553 0.001*
PFV break(pd) −0.365 0.001*
Accommodation
AA (binocular ) (D) −0.116 0.001*
AF (binocular ) (cpm) −0.244 0.001*
AR (lag) (DS) 0.095 0.002*
NRA (DS) −0.138 0.001*
PRA (DS) 0.146 0.001*
(p = 0.05). There were statistically significant moderate pos-itive correlation between stereoacuity and symptoms scoresthat is, as the symptoms scores increased, the stereoacu-ity threshold also increased (that is, worsened) (r2 = 0.26p = 0.001, 95% CI = 0.312−0.705) (Fig. 6). Furthermore, thePearson correlation tests revealed positive statistically sig-nificant but weak relationship between stereoacuity andsymptoms scores for Part 2 symptoms scores (r2 = 0.09, 95%CI = 0.125---0.39, p = 0.001).
The mean symptoms for participants with reducedstereoacuity (Mean, 12.94 ± 11.26) were significantly higher
Table 5 Percentage of defective clinical measures with
reduced stereoacuity.
Defective clinical measures with
cut-offs
Percentage failed
stereoacuity test
(n/%)
Vergence
NPC break (≥ 10) ( cm) 33 (16.6)
Exophoria (≥ 6) (pd) 45 (22.0)
Esophoria (> 2) (pd) 38 (18.6)
Hyperphoria (> 0.5) (pd) 3 (1.4)
Fusional vergences (pd)
NFV break (≤ 12)(pd) 59 (29.8)
PFV break (≤ 16)(pd) 59 (29.6)
Accommodation
AA (≤ 12 ) (D) 52 (26.4)
AF ± 2 (binocular ) (≤ 5 ) (cpm) 50 (27.6)
AR (lag) ( ≥ 0.75) (D) 68 (34.7)
than for those with good stereoacuity (Mean, 10.63 ± 10.35,p = 0.01). Furthermore, the relation of stereoacuity withspecific response (for ‘‘always’’ responses only) wasexplored. The mean symptoms for participants with reducedstereoacuity (Mean, 12.94 ± 11.26) were significantly higherthan for those with good stereoacuity (Mean, 10.63 ± 10.35)(p = 0.01). Similarly, for Part 2 symptoms survey, the meansymptoms for participants with reduced stereoacuity (mean,8.18 ± 7.53) was significantly higher than for those with goodstereoacuity (Mean 6.75 ± 7.08) (p = 0.01).
To facilitate differential diagnosis, analysis of asso-ciations of stereoacuity with specific symptoms wasinvestigated. For Part 1 symptoms, in 8 out of 15 ques-tions (53%), (Table 8a, highlighted) the reduced stereoacuitycategory showed significantly higher mean symptoms scoreswhile good stereoacuity had higher mean symptoms scoresfor 7/15 (47%) (Table 8a). For Part 2 questionnaire with 9questions, the mean for reduced stereoacuity was signifi-
Table 6 Sensitivity and specificity of diagnosis of defects in accommodative and vergence measures with Randot stereoacuity
test.
Clinical measures Area under
the curve
Lower limit Upper limit Sensitivity (%) PPV* (%) Specificity (%) NPV* (%)
Vergence
NPC break (≥ 10) (cm) 0.70 0.63 0.77 47.62 15.38 83.21 96.61
Exophoria (≥ 6) (pd) 0.53 0.48 0.58 24.86 22.05 82.63 84.76
Esophoria (≥ 2 (pd) 0.57 0.52 0.62 28.89 20.0 83.39 89.43
Right hyperphoria (≥ 0.5) (pd) 0.56 0.46 0.65 26.32 5.1 81.61 96.70
NFV break (≤ 12) (pd) 0.59 0.55 0.64 31.31 29.38 84.09 85.28
PFV break (≤ 16) (pd) 0.62 0.57 0.67 35.85 29.23 84.46 88.03
Accommodation
AA (binocular) (≤ 12) (D) 0.63 0.59 0.67 28.18 26.42 83.55 84.62
AF ± 2 (binocular) ≤ 5 (cpm) 0.62 0.58 0.67 27.07 27.53 83.98 83.91
AR (lag) ( ≥ 0.75) (DS) 0.60 0.56 0.64 26.98 35.23 84.16 78.30
NRA ≥ + 2.50 (DS) 0.43 0.40 0.47 15.84 33.16 79.84 60.04
PRA ≥ −3.00 (DS) 0.43 0.37 0.50 18.26 76.72 21.74 1.85
NPC = near point of convergence, NFV = near fusional vergence, PFV = positive fusional vergence, AA = amplitude of accommodation,
AF = accommodative facility, AR = accommodative response, NRA = negative relative accommodation, PRA = positive relative accommoda-
tion. PPV = positive predictive value, NPV = negative predictive value, Reduced stereoacuity score ≥ 60 s arc.

180 S.O. Wajuihian
Table 7 Relationship between fail of each clinical test and
stereoacuity.
Clinical measures Odds ratioa(95% CI) p-value
Vergence
NPC break (≥ 10)( cm) 4.51 (2.67---7.59) 0.001
Exophoria (≥ 6 )(pd) 1.57 (1.06---2.32) 0.03
Esophoria (≥ 2 ) (pd) 2.11 (1.40---3.19) 0.001
RE hyper (≥ 0.5) (pd) 1.58 (0.76---3.23) 0.308
NFV break (≤ 12) (pd) 2.41 (1.67---3.46) 0.001
PFV break (≤ 16) (pd) 3.04 (2.09---4.40) 0.001
Accommodation
AA (binocular) (≤ 12)
(D)
1.98 (1.37---2.86) 0.001
AF ± 2 (binocular) (≤
5)(cpm)
1.95 (1.33---2.84) 0.001
AR (lag) ( ≥ 0.75) (DS) 1.96 (1.40---2.75) 0.001
NRA ≥ + 2.50 (DS) 0.75 (0.54---1.04) 0.095
PRA ≥ −3.00 (DS) 0.06 (0.03-0.11) 0.001
a Tests if increase (or decrease) in stereoacuity scores is
associated with increase (or decrease) in odds of failing the
clinical test. Statistically significant (p < 0.05 are in bold fonts).
RE = right eye Hyperphoria. NPC = near point of convergence,
NFV = near fusional vergence, PFV = positive fusional vergence,
AA = amplitude of accommodation, AF = accommodative facility,
AR = accommodative response, NRA = negative relative accom-
modation, PRA = positive relative accommodation, Reduced
stereoacuity score ≥ 60 s arc.
cantly higher in only 3 out of 9 questions (33%) (Table 8b).Only variables with significant association with symptomsquestionnaire are indicated on Tables 8a and 8b.
Bivariate logistic regression analysis showed that parti-cipants with reduced stereoacuity were 1.67 times morelikely to be symptomatic compared to those with normalstereoacuity (OR = 1.67; p = 0.05; 95% CI: 1.027---2.774). Todetermine the validity of Randot stereoacuity test to dis-tinguish between symptomatic and asymptomatic schoolchildren were examined using the sensitivity and specificitytest. The maximum validity values of the CISS were: sensi-tivity was-90.26%, specificity 15.26%, PPV 19.60% and NPV87.24%. The Receiver Operating Curve (ROC) (Fig. 7) val-ues were: 0.57 (95% CI = 0.53---0.62, p = 0.001). These findingsindicate that the accuracy of the Randot stereoacuity test(≥60 s arc) to distinguish between symptomatic and asymp-tomatic children is poor.
Discussion
This study explored associations of stereoacuity with clin-ical measures and symptoms. Reduced stereoacuity anddefective clinical measures were prevalent in this sampleof high school students. Stereoacuities were worse in chil-dren with defects in clinical measures and in symptomaticthan in asymptomatic children. The findings suggest thatRandot stereoacuity test has a fair accuracy to distinguishbetween children with or without defective clinical mea-sures of accommodative and vergence. However, it has alow accuracy to identify symptomatic children. This implies
30
25
20
15
10
5
0
26.7
24.2 23.1
20 19.7 19.2
14.6 14.8 13.8
Series1
Fre
qu
en
cy (
%)
Eye
s wat
er
Hea
dach
es a
fter s
choo
lBoo
k to
o clos
e
Frow
n or
squ
eeze
Diff
icul
ty c
hang
ing.
..
Dizzy
Blu
rry
Eye
s re
d a
Boo
k aw
ay
Figure 5 Frequency of non-CISS (Part 2) symptoms.
r = 0.507; p=0,001; 95% CI = 0,312-0,705
450
400
350
300
250
200
150
100
50
00 10 20 30 40 50 60
Symptom scores
Ste
reoacuity t
hre
shold
Figure 6 Correlation between stereoacuity threshold and
symptoms scores.
that in a clinical setting, reduced stereoacuities could signifyreduced clinical measures.
Reduced stereoacuity: prevalence and associationswith accommodative and vergence measures
The prevalence of reduced stereoacuity varied across stud-ies and are influenced by diverse study designs. Theprevalence of reduced stereoacuity of 18.9% is higher than16.8% reported by Ponsonby et al.14 who studied primaryschool children in Australia. Lack of studies on similar pop-ulation as present study precludes extensive comparisonof results. On the association between clinical measuresand stereoacuity the participants with defective clinicalmeasures of accommodation and vergence had significantlyworse mean stereoacuities than those with good stereoacu-ity. Good stereoacuity requires clear retinal image andgiven the role of accommodation on stereopsis in adjust-ing focus for clear vision, blur caused by an accommodativeerror will disrupt the accommodative-convergence synergyand reduce the precision of stereopsis.20---25 With natu-ral pupils, errors of 1 D and 2 D cause nearly two-andten-fold reductions in stereoacuity, respectively.25 The sig-nificant association between reduced stereoacuities andthe clinical measures of AI (amplitude, lag and facility)(Table 3) corroborate the reported association between AIand stereoacuity.16
In the literature, the relation of vergences to stereoacu-ity tends to be of more research interest than withaccommodation.6---11 and this may be related to the fact

Correlations between clinical measures and symptoms 181
ROC curve1.0
0.8
0.6
0.4
0.2
0.2 0.4 0.6 0.8 1.0
1 - Specificity
Diagonal segments are produced by lies.
0.00.0
Se
nsitiv
ity
Figure 7 Receiver Operating Characteristics (ROC) Curve for
sensitivity and specificity of screening test for Stereoacuity and
symptom scores (CISS).
that vergence functions seem to be more relevant tostereoacuity and thus may be more affected than by accom-modative parameters. This is evident from the more reducedstereoacuities of convergence measures including the NPC &PFV (Table 3) Findings from earlier studies on the effect ofconvergence on stereoacuity varied though it seems unan-imous from the studies that the role of convergence maymainly be mechanical. The anatomical design of the eye-ball enables it to rotate freely therefore convergence setsthe eyes in place to commence the process of minimizingdisparity6---11 thus enhances the sense of depth.9
A significant correlation between esophoria andstereoacuity corroborates results from previous studieswhich found that even small degree of esophoria negativelyimpacted on stereoacuity more than did exophoria.26---27
Differences in stereo-functions between the esophores andexophores may be related to relative strengths of the sep-arate slow vergence adaptation mechanisms3,27 given thatexophores have slower convergence (take longer to reducedisparity error) compared to the same persons’ divergencemovements.28 Studies30---32 which related stereoacuity tovergence measures were conducted by experimentallyinducing vergences stress while stereoacuity was measured.Reduced stereoacuity is often associated with inductionof prism.30---34 Biler et al.30 found that the introduction ofbase in and base out prism caused significant reductionin stereoacuity with reduced stereoacuity occurring at 20pd for convergence and 13 or divergence. In the presentstudy, reduction of stereoacuity was associated with a meannegative fusional vergence break of less than 12 prismdioptres and less than 16 positive fusional vergence break.
Remarkably, the mean stereoacuities for convergencemeasures are higher than for accommodative measureswhich indicates a stronger associations of stereoacuity withvergence than accommodation measures (Table 3). Thisfinding further supports the idea that convergence func-
tion is more utilised in eye movement therefore may beprone to more stress than accommodative measures. Over-all, the weak correlation among stereoacuity and clinicalmeasures may be related to the low mean values fromclinical measures and may be a characteristic of this pop-ulation. From another perspective, Nicolson and Garzia,13
noted that reduced stereoacuity may not be related to clin-ical measures due to the nature of the stereoacuity testingwhere, unlike accommodative facility, stereoacuity test-ing lacks stimulus which could challenge the system duringtest. Stronger correlations between clinical measures andstereoacuity may be obtained after an intense near task.
In general, reduced stereoacuity from clinical measuresmay be related to breakdown in the accommodative-vergence synergy arising from performing near task. Fora stimulus to be seen as fused rather than diplopic, theeyes must be converged to a distance close to the objectdistance. The Panums fusional area measures between8−12 min of arc near the fovea.21 Beside the foveae, manyretinal loci can produce fusion and this area increasestowards the periphery.21 The tolerance range of Panum’sfusion area is approximately 15---30 min of arc.21,25 There-fore, vergence errors larger than 15---30 min of arc causea breakdown in binocular fusion and stereopsis is therebydisrupted.25---35 The individual may develop adaptive changeswhich cause accommodative-vergence anomalies and thosewho adapt poorly manifest symptoms.36
Overall, the complex neuronal interactions between theoculomotor and sensory processes which act to reduceexcessive retinal disparity suggest a strong link betweendepth perception and motor fusion.22,37 Thus, it could beargued that if the mechanism that controls fusion or thevergence mechanism is impaired, stereoacuity may also beimpaired.37,38 Also, the high vergence effort used to con-trol deviations could cause reduced stereoacuity, which alsoindicates the limits of practically useful vergence39 becausethe disparity magnitude exceeds its threshold value (that is,the Panum’s fusional area or tolerance for vergence error).40
Stereopsis occurs when retinal disparity is great enough topermit simple superimposition of the two retinal images,but not enough to elicit diplopia.1,41,42 Although smallervergence errors may not cause fusion to break, a markedreduction in stereoacuity may be expected.25,35,37 It maythus be inferred that abnormal accommodative-vergencemeasures could affect stereoacuity, at least up to a criti-cal level for fine stereopsis and greater level of associationwith vergences may be expected with coarse stereopsis.20,37
Coarse stereopsis is a low-resolution spatial frequency dis-parity range which plays a role in early development ofcoordinated binocular eye movements and permits thedevelopment of the first-order and high-resolution finestereoscopic system.20,42
Even though sensory fusion is essential for the highestdegree of stereopsis, lower degrees may occur in its absenceand in some cases, could occur in heterotropia of lessthan 10 prism dioptres1,37,39 as well as, in microtropia.1,37,39
Coarse stereopsis is common among people who have nor-mal fine stereoacuity and ocular alignment and in those whomay not have binocular vision anomalies.41---43 Jones42 andRichards43 reported a relatively high proportion of individ-uals who had an adequate binocular vision and normal finestereopsis but were found to manifest reduced or absent

182 S.O. Wajuihian
Table 8a Associations between stereoacuity and specific symptoms Part 1.
CISS numbering Symptoms questionnaires Stereoacuity
Symptoms Reduced (≥ 60) Normal (< 60) t-test (p-value
n Mean ± SD Mean ± SD
6 Do you have trouble
remembering what you have
read?
1017 2.34 ± 1.38 1.97 ± 1.29 3.51 (0.001)*
7 Do you have double vision
when reading or doing close
work?
1012 1.57 ± 1.32 1.32 ± 1.29 2.38 (0.002)*
8 Do you see the words move,
jump, swim, or appear to
float on the page when
reading or doing close work?
1030 1.45 ± 1.36 1.14 ± 1.31 2.95 (0.003)*
9 Do you feel like you read
slowly?
1017 2.37 ± 1.32 2.12 ± 1.41 2.36(0.002)*
11 Do your eyes ever feel sore
when reading or doing close
work?
1022 2.17 ± 1.38 1.87 ± 1.36 2.73(0.001)*
12 Do you feel a ‘‘pulling’’
feeling around your eyes
when reading or doing close
work?
1022 1.91 ± 1.33 1.60 ± 1.32 2.92 (0.004)*
14 Do you lose your place while
reading or doing close work?
935 1.92 ± 1.47 1.67 ± 1.40 2.06 (0.004)*
15 Do you have to re-read the
same line of words when
reading?
2.67 ± 1.28 2.37 ± 1.31 2.79 (0.001)*
Table 8b Associations between stereoacuity and specific symptoms Part 2.
PART 2 Symptoms survey
Symptoms Reduced stereoacuity (≥ 60) Normal stereoacuity (< 60) t-test (p-value)
18. Do you see things as blurry (not
clear) when you read or use
the computer?
1004 2.09 ± 1.37 1.78 ± 1.32 2.89 (0.004)*
19. Do you feel dizzy when you
read?
1020 2.13 ± 1.39 1.84 ± 1.39 2.59 (0.001)*
21. Do you have problems when
you look on the chalkboard,
back to your textbook, and
back to the chalkboard again?
1027 2.10 ± 1.45 1.77 ± 1.40 2.89 (0.004)*
convergent or divergent eye movements with associatedstereo anomaly for coarse stereopsis. Another mecha-nism of reduced stereoacuity under conditions of vergencestress include temporary anomalous retinal correspondence,which are small shifts in retinal correspondence that canoccur without disrupting Panum’s fusional process.44
Stereoacuity and symptoms
A high percentage (86%) of participants were symptomatic[mild: 41.29%, moderate: 32% and severe: 27%] which ishigher than 47.5% reported by Ponsonby et al.14 who also
used the CISS and the severity was not categorised. Giventhat CISS test was appropriately administered, several fac-tors could be proposed for the high prevalence in the presentstudy. The validation of the CISS in only the English languagemay create some challenges for non-native English speakersrural school children in this study. For example, it may bedifficult to understand a distinction between some of thesymptoms question options such as infrequently, sometimes
and fairly often even when translated to their native isiZululanguage. A study in India found that language affects theinterpretation of the CISS and recommended the validationsof the survey for other languages.45 Secondly, students may

Correlations between clinical measures and symptoms 183
exaggerate symptoms in order to be given spectacles. Fur-thermore, high frequency of symptoms in the present studymay also be related to the fact that cases of refractive errorswere not excluded as was done in some studies.46---48 Thesestudies46---48 found lower frequencies of symptoms which mayhave increased the prevalence compared to when refractiveerrors are excluded. It is also possible that high frequencyof symptoms is peculiar with this population and this mayrequire further investigation.
As in the present study, the findings of worse symptomsscores among children with worse stereocuities corroborateresults from previous studies.5,14 Given the significant asso-ciations between binocular anomalies and symptoms16 andstereoacuity test being a measure of the presence of goodbinocularity,3,23 an association between reduced stereoacu-ity and symptoms may be expected and further studies maybe needed to validate this.
Different cut-points yield different sensitivities andspecificities hence it is difficult to compare sensitivities andspecificities reported in different studies. Studies on thevalidity of stereoacuity to screen for symptoms could notbe found. Thus, the present study provides baseline datatowards further studies.
Summary, implications and applications offindings
School vision screening is often a good avenue to identifychildren who may be at risk for vision anomalies and withlimited access to eye care and unable to afford the inde-pendent optometrist. Binocular anomalies predispose thestudent to develop symptoms as near point visual demandsincreases. Developing a quick and simple screening toolwill enhance screening at every level. Findings from thisstudy could guide subsequent studies towards validation ofstereoacuities as a screening tool. The findings from thisstudy showed that:
� Participants with defective clinical measures had sig-nificantly worse stereoacuities than those with normalranges.
� Participants with reduced stereoacuity had significan-tly worse mean symptoms scores than asymptomaticalthough the weak correlation between stereocuity andsymptoms limits interpretation and application.
� The Randot Stereo test could be used as a screening toolto identify defects in clinical measures and those whomay be symptomatic children.
Being a simple and easy-to-administer tool, the Randotstereoacuity test will be useful to researchers, school per-sonnel and clinician as a screening tool.
Lack of cycloplegia is a limitation of this study although itwas difficult to get parents and school authorities to permitthe use of eye drops on their children. In addition, Laudon49
noted that the use of cycloplegia in studies on near visionanomalies may be unnecessary49 as the use of cycloplegiamay disrupt the sequence of testing and school principals donot always allow interruptions of children’s classes. Despitethe outlined limitations, the firm research design includinglarge sample size, random sampling, one optometrist col-
lected data are some strengths of the study. In addition, thedata was analyzed by a statistician who is a non-eye carepractitioner and is unaware of the criteria and terminolo-gies used throughout the study. Consequently, the findingsare valid and can be extrapolated to similar populations.
Conclusion
Reduced stereoacuity, defective clinical measures and symp-toms of asthenopia are prevalent in sample of schoolchildren studied and those with defective clinical mea-sures and those that are symptomatic are more likelyto have reduced stereoacuity. In a screening setting,Randot Stereoacuity test could fairly identify defective clin-ical measures although the accuracy to identify betweensymptomatic and asymptomatic school children was poor.Findings highlight the need for a fast and reliable screeningtool among school children. Further studies will be neededto validate present findings.
Conflicts of interest
The author has no proprietary interests or conflicts of inter-est related to this submission.
This submission has not been published anywhere previ-ously and it is not simultaneously being considered by anyother publication.
Acknowledgement
I am grateful to Prof Mark Rosenfield (SUNY College ofOptometry New York, USA) and Dr Rekha Hansraj (Universityof KwaZulu---Natal South Africa) for reviewing some drafts ofthis manuscript. I also thank Prof Rosenfield for supplyingme copies of the classic articles referenced.
Appendix A. Supplementary data
Supplementary material related to this article can be found,in the online version, at doi:https://doi.org/10.1016/j.optom.2020.02.002.
References
1. von Noorden G, Campos E. Binocular Vision and Ocular Motility:
Theory and Management of Strabismus. 6th ed. St Louis, MO:
Mosby; 2002.
2. Romano PE, Romano JA, Puklin JE. Stereoacuity development
in children with normal Binocular Single Vision. Am J Ophthal-
mol. 1975;79:966---971.
3. Saladin JJ. Stereopsis from a performance perspective. Optom
Vis Sci. 2005;82:186---205.
4. Scheiman M, Wick B. Clinical Management of Binocular Vision:
Heterophoric, Accommodative and Eye Movement Disorders.
3rd ed. Philadelphia: JB Lippincott; 2019.
5. Momeni-Moghadam H, Kundart J, Ehsani MK, Gholami K. The
comparison of stereopsis with TNO and Titmus tests in symp-
tomatic and asymptomatic university students. J Behav Optom.
2011;23:35---39.

184 S.O. Wajuihian
6. Rady AA, Ishak IG. Relative contributions of disparity
and convergence to stereoscopic acuity. J Opt Soc Am.
1955;45:530---634.
7. Rady AA, Ishak IG. Relative contributions of dispar-
ity and convergence to stereoscopic vision. Nature.
1955;175:305---306.
8. Wright WD. The role of convergence in stereoscopic vision. Proc
Phy Soc. 1951;64:289---297.
9. Ogle KN. Stereoscopic acuity and the role of convergence. J
Opt Soc. 1956;46:269---273.
10. Ogle KN. The role of convergence in stereoscopic vision. Proc
Phy Soc. 1953;66:513---514.
11. Weale RA. Stereoscopic acuity and convergence. J Opt Soc Am.
1956;46:907---909.
12. Poggio G, Poggio T. The analysis of stereopsis. Annu Rev Neu-
rosci. 1984;7:379---412.
13. Garzia RP, Nicholson SB. A study of binocular accommodative
and vergence facility and predictive analysis of global stereop-
sis. J Behav Optom. 1991;2:3---6.
14. Ponsonby AL, Smith K, Williamson E, Bridge D, Carmichael A.
Poor stereoacuity among children with poor literacy: Preva-
lence and associated factors. Optom Vis Sci. 2013;1:75---83.
15. Wajuihian S.O. Normative values for clinical measures used to
classify accommodative and vergence anomalies in a sample
of high school children in South Africa. J Optom. Available at
https://www.sciencedirect.com/science/article/pii/S188842
9618300323.
16. Wajuihian SO, Hansraj R. Association of symptoms with refrac-
tive, accommodative and vergence anomalies in high school
children in South Africa. Optom Vis Perf. 2017;5:27---36.
17. Borsting EJ, Rouse MW, Mitchell GL, Scheiman M, Cotter SA,
Cooper J. Validity and reliability of the revised convergence
insufficiency symptom survey in children aged 9 to 18 years.
Optom Vis Sci. 2003;80:832---838.
18. Gallaway M, Mitchell GL. Validity of the VERA visual skills
screening. Optometry. 2010;81:571---579.
19. Randot Stereo-test. Available at https://www.stereooptical.
com/manuals/. Last accessed 26th May, 2018.
20. Giaschi DE, Narasimhan S, Solski T, Harrison E, Wilcox L. On the
typical development of stereopsis: Fine and coarse processing.
Vision Res. 2013;89:65---71.
21. Grosvenor T. Primary Care Optometry. 5th ed. Philadelphia:
Butterworth Heinemann Elsevier; 2007.
22. Fricke TR, Siderov J. Stereopsis, Stereotests, and their rela-
tion to vision screening and clinical practice. Clin Exp Optom.
1997;80:165---172.
23. Ohlsson J, Villarreal G, Abrahamsson M, Cavazos H, Sjostrom
A, Sjostrand J. Screening merits of the Lang II, Frisby, Randot,
Titmus, and TNO stereo tests. J AAPOS. 2001;5:316---322.
24. Westheimer G. Clinical evaluation of stereopsis. Vision Res.
2013;90:38---42.
25. Hoffman DM, Girshick A, Akeley K, Banks MS.
Vergence---accommodation conflicts hinder visual performance
and cause visual fatigue. J Vision. 2008;8:1---30.
26. Shippman S, Kenneth R, Cohen MD. Relationship of heteropho-
ria to stereopsis. Arch Ophthalmol. 1983;101:609---910.
27. Saladin JJ. Effects of heterophoria on stereopsis. Optom Vis
Sci. 1995;72:487---492.
28. Alvarez TL. A pilot study of disparity vergence and near dis-
sociated phoria in convergence insufficiency patients before
vs. after vergence therapy. Front Hum Neurosci. 2015;9:419,
http://dx.doi.org/10.3389/fnhum.2015.0041.
29. Manan F, Jenkins TCA, Collinge AJ. The effect of clinical visual
stress on stereoacuity measured with the TNO Test. Malays J
Med Sci. 2001;8:25---31.
30. Demirkilinc Biler E, Guven Yilmaz S, Kucukceran E, Uretmen
O. The effect of convergence and divergence stress on near
stereoacuity. Int Ophthalmol. 2017;37:165---168.
31. Kromeier M, Schmitt C, Bach M, Kommerell G. Stereoacuity ver-
sus fixation disparity as indicators for vergence accuracy under
prismatic stress. Ophthalmic Physiol Opt. 2003;23:43---49.
32. Fry GA, Kent PR. The effects of base-in and base-out prisms on
stereo-acuity. Am J Optom Physiol Opt. 1994;21:492---497.
33. Spencer S, Firth AY. Stereoacuity is affected by induced pho-
ria but returns toward baseline during vergence adaptation. J
AAPOS. 2007;11:465---468.
34. Jiménez JR, Olivares JL, Pérez-ocón F, DEL Barco LJ. Associated
phoria in relation to stereopsis with random-dot stereograms.
Optom Vis Sci. 2000;77:47---50.
35. Blakemore C. The range and scope of binocular depth discrim-
ination in man. J Physiol. 1970;211:599---622.
36. Birnbaum MH. Optometric Management of Nearpoint
Vision Disorders. 2. Boston: Butterworth-Heinnemann;
1993:128---139.
37. Ukwade M, Bedell H, Harwerth R. Stereopsis is perturbed by
vergence error. Vision Res. 2003;43:181---193.
38. Lovasik JV, Szymkiw M. Effects of aniseikonia, anisometropia,
accommodation, retinal illuminance, and pupil size on stere-
opsis. Invest Ophthalmol Vis Sci. 1985;26:741---750.
39. Lugtigheid AJ, Wilcox LM, Allison RS, Howard IP. Ver-
gence eye movements are not essential for stereoscopic
depth. Proc R Soc. 2014;B 281, 20132118. Available at
http://rspb.royalsocietypublishing.org. Last accessed 29th
May, 2018.
40. Cuiffreda K. Components of clinical near vergence testing. J
Beh Optom. 1992;3:3---13.
41. Gonzalez F, Perez R. Neural mechanisms underlying stereo-
scopic vision. Prog Neurobiol. 1998;55:191---224.
42. Jones R. Anomalies of disparity detection in the human visual
system. J Physiol (Paris). 1977;264:621---640.
43. Richards W. Stereopsis and stereo-blindness. Exp Brain Res.
1970;10:380---388.
44. Laird PW, Hatt SR, Leske DA, Holmes JM. Stereoacuity
and binocular visual acuity in prism-induced exodeviation. J
AAPOS. 2007;11:362---366.
45. Hussaindeen JR. Binocular vision anomalies and normative
data (BAND) of binocular vision parameters among school
children between 7 and 17 years of age in rural and urban
Tamilnadu. Unpublished aspects of PhD thesis; 2016. Available;
http://shodhganga.inflibnet.ac.in/bitstream/10603/182182/
1/phd%20thesis%20with%20articles 301116.pdf Last accessed
14th April 2019.
46. Borsting E, Rouse MW, Deland PN, et al. Association of symp-
toms and convergence and accommodative insufficiency in
school-age children. Optometry. 2003;74:25---34.
47. Marran LF, De Land PN, Nguyen AL. Accommodative insuf-
ficiency is the primary source of symptoms in children
diagnosed with convergence insufficiency. Optom Vis Sci.
2006;83:281---289.
48. Bade A, Boas M, Gallaway M, et al. Relationship between clin-
ical signs and symptoms of convergence insufficiency. Optom
Vis Sci. 2013;90:988---995.
49. Smith D, Laudon RC. Point/counterpoint: Cycloplegia. Optom
Vis Perf. 2013;1:8---10.