correlation of mass spectrometry … summary a pyrolysis-gas chromatography-ion mobility...
TRANSCRIPT
EDGEWOODCHEMICAL BIOLOGICAL CENTER
U.S. ARMY RESEARCH, DEVELOPMENT AND ENGINEERING COMMAND
ECBC-TR-415
CORRELATION OF MASS SPECTROMETRY IDENTIFIED BACTERIALBIOMARKERS FROM A FIELDED PYROLYSIS-GAS CHROMATOGRAPHY-
ION MOBILITY SPECTROMETRY BIODETECTOR WITH THEMICROBIOLOGICAL GRAM STAIN CLASSIFICATION SCHEME
A. Peter SnyderWaleed M. Maswadeh
Charles H. Wick
RESEARCH AND TECHNOLOGY DIRECTORATE
Jacek P. DworzanskiAshish Tripathi
GEO-CENTERS GEO-CENTERS, INC., GUNPOWDER BRANCH
September 2005
Approved for public release;distribution is unlimited.
2O051212 034ABERDEEN PROVING GROUND, MD 21010-5424

Disclaimer.
The findings in this report are not to be construed as an official Department of the Armyposition unless so designated by other authorizing documents.

Form ApprovedREPORT DOCUMENTATION PAGE 0MB No. 0704-0188
Public reporting burden for fthi collection of Informaiaon is estimated to, average I hour per response, including the time for reviewing Instructions. searchilng erristing data sources, gatheing and maintsteng thedata needed, and completing and review"n this collection of Information. Send cofmment regarding this burden estimate or any othier aspect of this collection of Infomuation, Indluding suggestions for reducingfti burden to Departmrent of Defense, Washington Headquarters Services. Directorate fo Information Operations mnd Reports (0704-0188).,1215 Jefferson Davis INghway, Suite 1204. Arlingtont, VA 22202-
.4302. Respondents should be aime that notwivithtanding any othwer provision of law, no person stheli be subject to any penalty for feting to comply with a collection of Information If it does not display a currentlyvalid OMgfB control nunber. PLEASE DO NOT RETURN YOUR FORM TO THE ABOVE ADDRESS. ___________________
1. REPORT DATE (DD-MM-YflY) 2. REPORT TYPE 3. DATES COVERED (From - TO)XX-09-2005 Final Oct 2002 - Dec 2003
4. TITLE- AND SUBTITLE 5a. CONTRACT NUMBERCorrelation of Mass Spectrometry Identified Bacterial Biomarkers from a Fielded_________________Pyrolysis-Gas Chromatography-Ion Mobility Spectrometry Biodetector with the 5b. GRANT NUMBERMicrobiological Gram Stain Classification Scheme__________________
Se. PROGRAM ELEMENT NUMBER
6. AUTHOR(S) 5d. PROJECT NUMBERSnyder, A. Peter, Maswadeh, Waleed, M.; Wick, Charles H. (ECBC); Dworzanski, Jacek 206023.84BP0P.; and Tripathi, Ashish (GEO-CENTERS, Inc.) 5e. TASK NUMBER
5f. WORK UNIT NUMBER
7. PERFORMING ORGANIZATION NAME(S) AND ADDRESS(ES) AND ADDRESS(ES) 8. PERFORMING ORGANIZATION REPORTDIR ECBC, ATTN: AMSRD-ECBC-RT-II, APG, MD 21010-5424 NUMBERGEO-CENTERS, Inc., Gunpowder Branch, APG, MD 21010-5424 ECBC-TR-415
9. SPONSORING / MONITORING AGENCY NAME(S) AND ADDRESS(ES) 10. SPONSORIMONITOR'S ACRONYM(S)
11. SPONSORIMONITOR'S REPORT NUMBER(S)
12. DISTRIBUTION I AVAILABILITY STATEMENTApproved for public release; distribution is unlimited.
13. SUPPLEMENTARY NOTES
14. ABSTRACTThis work discusses the significance of the pyrolyzate peaks observed in the gas chromatography-ion mobility spectrometry (GC-IMS)dataspace of the pyrolysis-GC-IMS (Py-GC-IMS) briefcase system. This system has the ability to detect and classifyi deliberately releasedbioaerosols in outdoor field scenarios. The bioaerosols include Gram-positive spores and Gram-negative bacteria, the MS-2 Escherichiacoliphage virus, and ovalbumnin (OV) protein species. The work suggests certain improvements that can be made to the IMS detectionSystem.
15. SUBJECT TERMSPyrolysis Mass Spectrometry Gas ChromatographyBacteria Peptidoglycan LipopolysaccharidesBiomarkers Pyridinecarboxamide Ion Mobility Spectrometry
16. SECURITY CLASSIFICATION OF: 17. LIMITATION OF 18. NUMBER OF 19Ia. NAME OF RESPONSIBLE PERSONABSTRACT PAGES Sandra J. Johnson
a. REPORT b. ABSTRACT c. THIS PAGE [19b. TELEPHONE NUMBER (include area code)
U U U UL 36 I (410) 436-2914Standard Form 298 (Rev. 8-98)Prescribed by ANSI 9td. Z39.tB

Blank
2

EXECUTIVE SUMMARY
A pyrolysis-gas chromatography-ion mobility spectrometry (Py-GC-IMS)briefcase system can detect and classify deliberately released bioaerosols in outdoor fieldscenarios. The bioaerosols include Gram-positive spores and Gram-negative bacteria, the MS-2Escherichia coliphage virus, and ovalbumin (OV) protein species. However, the origin andstructural identities of the pyrolyzate peaks observed in the GC-IMS dataspace, theirmicrobiological information content, and taxonomic importance with respect to biodetectionhave not been determined.
The present work interrogates the identities of the peaks by inserting a time-of-flight (TOF) mass spectrometry (MS) system in parallel with the IMS detector through a Teeconnection in the GC module. Biological substances, producing ion mobility peaks from thepyrolysis of microorganisms, have been identified by their GC retention times, by matching theirelectron ionization mass spectra with authentic standards, and by the National Institute ofStandards and Technology (NIST) mass spectral database.
Strong signals from 2-pyridinecarboxamide were identified in Bacillus samples,including Bacillus anthracis, and their origins were traced to the cell wall peptidoglycanmacromolecule. 3-Hydroxymyristic acid is a component of lipopolysaccharides (LPS) in the cellwalls of Gram-negative organisms. The Gram-negative E. coli organism showed significantamounts of 3-Hydroxymyristic acid derivatives and degradation products in Py-GC-MSanalyses. Some of the fatty acid derivatives were observed in very low abundance in the ionmobility spectra and the highest boiling lipid species were absent.
Improvements that can be applied to the IMS detector are addressed. Biologicalcompounds, predominately found or only found in Gram-positive or Gram-negative bacterial cellwalls, contain microbiological taxonomy information and can be considered as biomarkers.Mass spectral analyses of bacterial pyrolyzates have confirmed the presence of biomarkercompounds generated from the Py-GC module in the briefcase Py-GC-IMS system. Evidence ispresented that the Py-GC-ambient temperature and pressure-IMS system generates and detectsbacterial biochemical information that can serve as components of a biological classificationscheme directly correlated to the Gram stain reaction in microorganism taxonomy.
3

Blank
4

PREFACE
The work described in this report was authorized under ProjectNo. 206023.84BPO. This work was started in October 2002 and completed in December 2003.
The use of either trade or manufacturers' names in this report does not constitutean official endorsement of any commercial products. This report may not be cited for purposesof advertisement.
This report has been approved for public release. Registered users should requestadditional copies from the Defense Technical Information Center; unregistered users shoulddirect such requests to the National Technical Information Service.
5

Blank

CONTENTS
1. INTRODUCTION ................................................................................................... 9
2. EXPERIM ENTATION .......................................................................................... 11
2.1 M aterials ....................................................................................................... 112.2 Bacteria Preparation ..................................................................................... 112.3 Pyrolysis-Gas Chromatography-Ion Mobility Spectrometry-Mass
Spectrom etry ................................................................................................ 122.4 Data Analysis ................................................................................................ 14
3. RESULTS AND DISCUSSION ...................................................................... 15
3.1 Gram -positive Bacterial Spores .................................................................... 153.2 Gram -positive Vegetative Cells .................................................................... 183.3 Gram -negative E. coli .................................................................................. 233.4 Biom arker Taxonom ic Utility ....................................................................... 243.5 Improvement of Py-GC-IMS Performance .................................................. 263.6 M ultivariate Data Analysis ........................................................................... 26
4. CONCLUSION S .................................... ............................................................ 27
LITERATURE CITED .................................................................................... 31
7

FIGURES
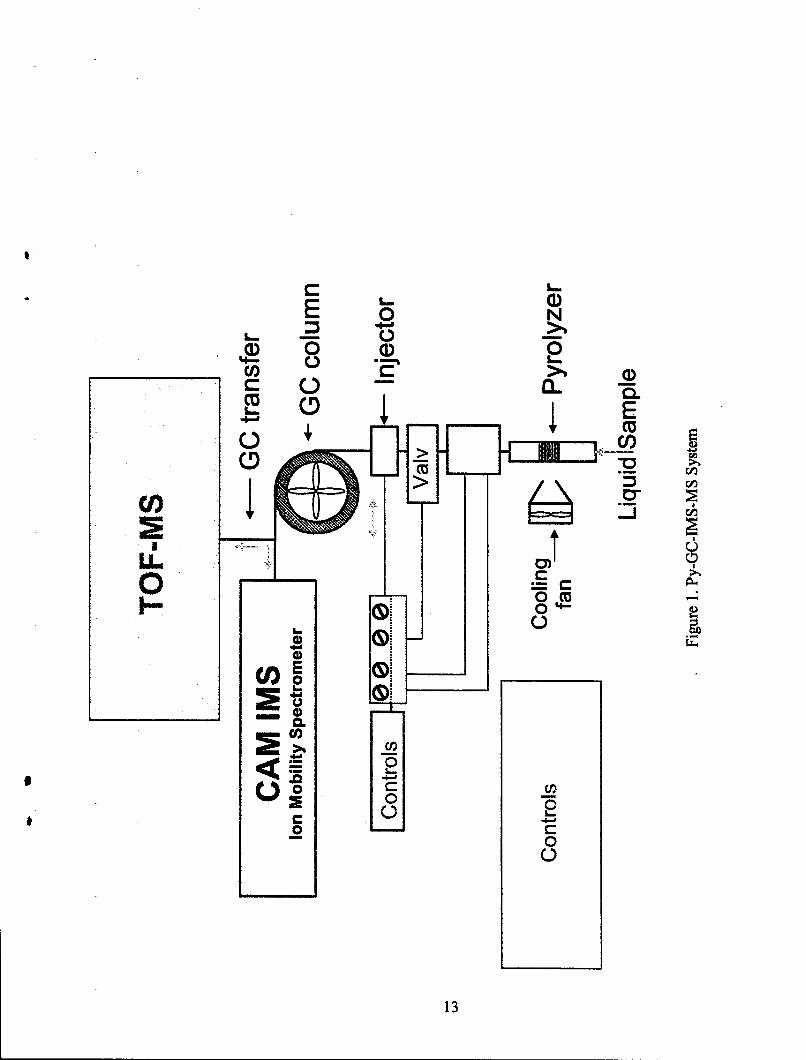
1. Py-GC-IMS-MS System ................................................................................... 13
2. Py-GC-IMS and Py-GC-MS Chromatograms of Gram-positive BG Spores ........ 16
3. Py-GC-IMS and Py-GC-MS Chromatograms of the Gram-positive A TexasVegetative Strain of B. anthracis ...................................................................... 22
4. Py-GC-IMS and Py-GC-MS Chromatograms of Gram-negative E. coli K-12 ..... 25
5. DF Plots of the Analysis of Liquid Suspensions of Gram-positive,Gram-negative, and Protein Biological Species .............................................. 28
TABLE
GC-MS Identified Pyrolysis Products .............................................................. 19
8

CORRELATION OF MASS SPECTROMETRY IDENTIFIED BACTERIAL BIOMARKERSFROM A FIELDED PYROLYSIS-GAS CHROMATOGRAPHY-ION MOBILITY
SPECTROMETRY BIODETECTOR WITH THE MICROBIOLOGICAL GRAM STAINCLASSIFICATION SCHEME
1. INTRODUCTION
Outdoor analytical systems that detect biological and chemical substances usuallytrace their roots to the configuration and performance standards of their laboratory-basedcounterparts. Fielded instruments are often compromised in their performance evaluationbecause of logistics and parameters such as
* Operator portability or transportability,* Small configuration and footprint,* Lack of bottled gas,* Extended times of unattended operation,* Low maintenance,* Turnkey start-up,* Lack of chemical and biological substance expendables, and* Low power requirements.
Analytical ion mobility spectrometry (IMS) is being used in field and laboratoryresearch and technology applications. The system is straightforward in concept and design."'2 Anickel-63 radioactive ionization source converts sample vapor into ions, which drift through anelectric field gradient in a linear tube between a pulsed voltage shutter grid and a Faraday plateion current detector. When operated in the low Torr regime under laboratory conditionsinterfaced in series with a time-of-flight mass spectrometry (TOF-MS) system, an IMS detectorcan obtain a separation of complex mixtures. This procedure has been reported by Hoaglund-Hyzer3-5 with bacterial proteome extracts, Gillig et al.6 9 with lipids and peptides, Matzet al. on amino acids, peptides and protein conformation, and Lee et al.3 "16 on carbon clustercompounds. However, when an IMS detector is operated at close to atmospheric pressure, lowerperformance characteristics become evident.'
Atmospheric pressure IMS is well suited to outdoor, field applications.1'2 7 23
Field utility of IMS is attractive because the system is easily portable and has low logistics andconsumable requirements. The IMS can be characterized as a TOF-MS detector at atmosphericpressure because the significant resistance between the sample ions and the atmosphericmolecules compromises the resolution of the instrument and inherent information potential of theions.
Pyrolysis (Py) converts a solid sample to vapors by rapid heating and gaschromatography (GC) separates a vapor mixture into its individual constituents. Py-GC is aconvenient method for processing solid samples and transferring the resulting fractionated vaporinto an atmospheric pressure IMS detector. Therefore, large solid biological substances such as
9

proteins and bacteria 17"20 , 24 can be interrogated by IMS through their thermal conversion intolow mass species.
GC-electron ionization (EI)-MS can provide unambiguous identification of asample from the GC retention time of a substance and its pattern of masses. GC-MS providesthe dimension of time in series with a mass spectrum as the second analytical dimension. GC-IMS, however, consists of two analytical separation stages in series, where the information inboth dimensions is time. This situation does not allow for the identification of a compoundcompared to that of GC-MS.
A laboratory Curie point wire, Py-GC-heated, IMS-MS system was used toinvestigate the presence of dipicolinic acid (DPA) in microorganisms.25 A Tee was placed in theGC to partition and transfer the biological sample at the same retention time into the ion trap MSand IMS detectors. The presence (Gram-positive organisms) and absence (Gram-negativeorganisms) of the picolinic acid thermal fragment of DPA in the GC-IMS and GC-MSdataspaces were determined. DPA, calcium dipicolinate salt, is found only in Gram-positivebacterial spores (5-15% by weight).26'27
The Py-GC-IMS laboratory concept 25' 28 was transformed into a field-operational,briefcase bioaerosol detector, and an aerosol concentrator was interfaced to the pyrolysis sourceof the system. The IMS detector component is a modified ambient pressure and temperatureChemical Agent Monitor (CAM) that is used by North Atlantic Treaty Organization (NATO)armed forces for the detection and screening of chemical agent vapor.
Outdoor bioaerosols consisting of Gram-positive Bacillus atrophaeus ((BG)formerly Bacillus globigil var. niger), Gram-negative Pantoea agglomerans ((EH) formerlyErwinia herbicola ), ovalbumin protein (OV), and the MS-2 Escherichia coliphage virus werereleased during formal trials at Western desert and prairie test sites in the United States andCanada. "'E° Differentiation between the four bioaerosols was possible by visual18"20 andmultivariate factor analysis determinations29 of the dispersion of pyrolyzate peaks in the GC-IMSdataspace. These tests documented the first successful detection and differentiation of outdoorreleased bioaerosols with an ambient temperature and pressure IMS detector interfaced to abiological sample Py-GC processing system.
Identification of the biological responses in the GC-IMS dataspace of thebriefcase fielded Py-GC-ambient temperature-IMS biodetector is investigated herein byinterfacing an EI-TOF-MS system in a parallel configuration similar to that of the Py-GC-IMS-MS laboratory system.25 The analytical mass spectrometer was used to identify the compoundsproduced and transferred by the Py-GC module in the fielded Py-GC-IMS device. Mass spectralinformation provided evidence that polar pyrolyzate compounds with significant biologicalclassification information (biomarkers) passed through the torturous Py-GC pathway. However,some of these compounds were spectrally silent in the IMS detector. Heating the IMS cell couldenable the observation of more, biologically relevant GC-IMS dataspace peak information in thePy-GC-IMS system.
10
A biological substance classification and differentiation scheme emerged from theMS-directed identification of the GC-IMS dataspace peaks. The classification scheme consistsof two fundamental components: (a) mass spectral identification of pyrolysis generatedbiochemical species (biomarkers) that are known to be specific to Gram-positive and Gram-negative microorganisms from cell wall and cell surface macromolecular and structuralviewpoints, and (b) multivariate discriminant analysis of the specific biomarkers and unidentifiedpeaks in the GC-IMS dataspace. Evidence has been presented that the outdoor fielded Py-GC-ambient temperature and pressure IMS bioaerosol detector produces biochemical informationthat can be correlated with the Gram stain reaction used for Gram-positive and Gram-negativemicroorganism taxonomy.
2. EXPERIMENTATION
2.1 Materials.
All protein and biochemical standards were obtained from Sigma-Aldrich(St. Louis, MO) except 2-pyridinecarboxamide, which was purchased from Lancaster Synthesis(Windham, NH) and Staphylococcal Enterotoxin B (SEB), which was purchased from ListBiological Laboratories, Inc (Campbell, CA). Peptidoglycan from Staphylococcus aureus andlipopolysaccharide (LPS) from Escherichia coli K-235, (prepared by phenol extraction) weresuspended in methanol (1 mg/mL). Model amino acids, sugars, peptides, proteins and nucleicacids were used as water solutions (1 mg/mL).
2.2 Bacteria Preparation.
Gram-positive vegetative cells of Bacillus anthracis (BA) and spores of B. cereusATCC 6464, B. megaterium, and BG were prepared as suspensions in deionized, distilled water.The BA strains included VNR1-A1, A Texas, and A Ames. The bacilli and suspensions of Gram-negative Pantoea agglomerans ATCC 33248 (EH) and E. coli K-12 were heat killed. A 1-PLaliquot of 0.1-5 mg/mL suspensions was used for all bacteria. BG was selected because itproduces spore-containing DPA and serves as a surrogate for BA in outdoor aerosol biodetectionscenarios. EH was chosen because it does not contain DPA, and it is the only Gram-negativeorganism approved by the Environmental Protection Agency (EPA) for outdoor, militarybioaerosol dissemination studies. Furthermore, EH is used as a surrogate for pathogenic Gram-negative organisms.
For Gram-positive bacterial growth and spore formation, a Bacillus culture wasstreaked for isolation onto an agar plate containing trypticase soy agar (TSA) and 5% sheep'sblood. The culture was incubated overnight at 37 *C. A single colony was then streaked onto anagar plate and incubated at 37 °C for about 4-6 hr or until there was visible growth on the plate.The bacterial growth was scraped from the agar plate and suspended in sterile broth or saline.The bacterial suspension (500 jiL) was pipetted onto the surface of nutrient sporulation media inan agar plate and spread evenly with a cell spreader. These plates were incubated at 37 0C for3 days until spore production reached a maximum. The spore generation was monitored usingphase contrast microscopy.
11

The vegetative cells appeared as dark, oblong cells in short or long chains exceptfor BG which appeared as smaller, highly refractile bodies either within vegetative cells or free-floating. Growth was scraped from the agar plates and washed twice with 200 mL sterile water,resuspended in sterile water, heat-killed, and lyophilized. The vegetative cells were prepared bysuspending isolated colonies from TSA and sheep's blood agar plates in sterile water to a densitycorresponding to a 1-McFarland standard.29 This was diluted 1:10, and 2 mL of the 1:10suspension was added to 200 mL of nutrient broth. The nutrient broth was incubated overnightat ambient temperature, centrifuged, and washed twice with 200-mL sterile water. The bacterialpellet was resuspended in sterile water, heat-killed, and lyophilized. All the cultures wereautoclaved for 20 min to kill vegetative cells and spores. BA preparations were cultured andkilled in Biosafety Level (BL) 3 facilities. All other organisms were handled and processedunder minimal safety level BL-1 conditions.
For the Gram-negative vegetative organisms, E. coli was streaked onto NutrientAgar plates and EH was grown in Brucella broth. Both organisms were incubated for 24 hr at37 IC. Nutrient broth (10 mL) was placed in a 15-mL conical tube and seeded with the Gram-negative bacteria. The tube was incubated at 37 TC for 24 hr. Nutrient broth (250 mL) was thenplaced in a 500-mL Erlenmeyer flask and seeded with a 1:10 dilution of a 1-McFarlandpreparation from the bacterial growth in the 15-mL conical tube. The flask was placed in ashaking incubator at ambient temperature. Aliquots of bacteria in broth were centrifuged at10,000 rpm for 25 min and washed twice with 200 mL of sterile water. The pellet wasresuspended and the aliquots were placed in the pyrolysis module.
2.3 Pyrolysis-Gas Chromatography-Ion Mobility Spectrometry-Mass Spectrometry.
The pyrolysis sample processor consisted of a Pyrex tube (4 mm ID, 8 mm OD,and 5 cm length) with a quartz microfiber filter (type QM-A, thickness 0.45 mm, from Whatman,Hillsboro, OR) supported by a Pyrex flit inside the tube (Figure 1). The Pyrex tube was wrappedwith a resistive heater filament (Omega Engineering, Stamford, CT). The heating apparatus wasused in two modes of operation: (a) a 10-s mode with the maximum temperature in the tube at120 °C for drying the moisture and other low boiling volatiles after a sample was deposited on'the filter, and (b) a subsequent pyrolysis mode with a maximum temperature of 400 'C in7s S8-20
Samples were deposited as water suspensions on the quartz filter. The resultingpyrolysis products were transferred through a heated SilcosteelTm tube, and the injection valvetransferred a portion of the sample into the GC column (stainless steel, 4 m x 0.50 mm ID UltraAlloy) coated with 0.10- pan layer of poly (dimethylsiloxane) from Quadrex (New Haven, CT,USA). The GC was kept in an isothermal mode at 40 0C prior to the pyrolysis event. Tenseconds after pyrolysis, the GC was ramped from 40-140 °C at the rate of 120 °C/min. Thetemperatures of the pyrolyzer, 3-way injection valve, and GC column were monitored by usingtype K thermocouples connected to in-house constructed control electronic boards interfaced to alaptop computer.
12
E N
0. CD042) 0 F) t-
C: C) CL4- 0 - a
CCO
rir
m 0
LL
Gl)
cm)n0 CDC 2
0
13

The pyrolyzer was kept at atmospheric pressure with nitrogen gas, and thepyrolyzate was transferred into the GC column during a pyrolysis event using a 3-way valve.The exit of the temperature programmable GC column was inserted into a Tee to split the carriergas between an EI-TOF-MS system (TEMPUS, ThermoFinnigan, San Jose, CA,) and a CAMWMS detector (General Dynamics, DeLand, FL) (Figure 1). The resulting pressure differencebetween the IMS and MS pumps was used as a driving force for the carrier gas flow during thepyrolyzate transfer and injection steps into and through the GC column. Further details of thePy-GC-IMS system configuration and parameters have been reported elsewhere. 20 Alternatively,pyrolysis was conducted under ambient atmospheric air conditions, and the pyrolyzate wascaptured at the entrance of the GC column at 40 *C. The carrier gas was then changed tonitrogen. The pyrolyzate portion that entered the IMS cell was diluted with an additionalnitrogen gas supply to prevent saturation of the Faraday detector. The mass spectral and ionmobility chromatograms produced equivalent GC-MS and GC-IMS information regardless ofwhether a sample was pyrolyzed under air or nitrogen carrier gas conditions.
The flows of nitrogen gas to the MS and IMS detectors were 3 and 15 mL/min,respectively. These flow rates were determined by the transfer line ID, temperature, andpressure difference between the Tee and each detector. The carrier gas flow rates and bothtransfer line ID and length dimensions were adjusted so that the GC eluate entered both detectors-at the same time.
2.4 Data Analysis.
Multivariate data analysis was applied to the GC-IMS dataspace information frombiological substance solutions and suspensions. However, GC-IMS produces a 3-dimensionaldataset (3-D) that includes ion drift time, GC retention time, and intensity. Multivariate dataanalysis can only interrogate 2-dimensional (2-D) information; therefore, the GC-IMS dataspacewas converted from 3-D to 2-D data.3°'
An automated peak search was performed on a raw GC-IMS dataspace where thesearch was conducted at longer drift times than the protonated, water reactant ion peak (RIP) (1).A cell grid (7x14) was placed over the GC-IMS dataspace domain where 14-successive cellswere positioned between 5.2- and 11-ms drift times at 0.41-ms intervals on the abscissa. Sevencells were partitioned between 5 and 50 s after pyrolysis in the GC retention time ordinate at6.4-s intervals, which yielded 98 cells. All the peak intensities in each cell were summed toproduce one intensity value per cell. Therefore, one GC-IMS dataspace from the analysis of asample is represented by a row of 7 x 14 = 98 summed intensity values. The 98 cells aretransformed into vectors or dimensions in multivariate dataspace that are mathematicallyorthogonal to each other. The summed intensity value for each cell represents the magnitude forits respective vector or dimension axis.
The first 9-principal component (PC) factors described 95% of the datasetvariance. They were used as the variables for discriminant function (DF) analysis of thebiological substances. The PC factors were used as variables because the very low cases(experiments) to dimension ratio yielded poor standard deviation statistics,32 The number ofcases (experimental replicates) was 20 for each of the 12-different biological substances or
14

categories (vide infra). An additional 24 cases for the "blank" category, consisted of 2experiments for each of the 12-sample categories. The amount of sample deposited in thepyrolysis region was below the IMS detection threshold of< 0.05 gg/ptL and the number ofdimensions was 98. The case/dimension ratio = 264/98 = 2.7, and only 3 cases per dimensionyielded poor standard deviation statistics. Instead of a significantly increased number ofexperimental cases, a reduced number of variables representing the first 9 PC factors was chosen.
3. RESULTS AND DISCUSSION
The use of Py-GC-IMS to detect and provide bacterial aerosol differentiation inoutdoor environments has already been published. 17-2 However, fundamental performanceconcerns, such as the microbiological meaning of the various peaks in the GC-IMS dataspace,still remain. Additional concerns are the degree of biochemical analyte throughput in theprocessing and transfer modules, and the ability of the IMS detector to respond to the GC eluatecomponents.
The Py-GC- ambient temperature and pressure IMS system has been shown todistinguish between BG Gram-positive spores, EH Gram-negative bacteria, and OV proteinbioaerosols in outdoor field scenarios. 20 This work presents clarification and proof that thePy-GC module of the Py-GC-IMS system provides biochemical information that hasmicrobiological taxonomic meaning from the analysis of bacterial pyrolyzates.
3.1 Gram-positive Bacterial Spores.
Dworzanski, et al.3 3 have described the performance of the Py-GC module, in thebriefcase Py-GC-IMS biodetector, interfaced with a TOF-MS detector in the analyses ofbiochemicals and microorganisms. Nonspecific and bacteria specific biomarker compoundsWere observed for Gram-positive bacteria. In addition, plausible pyrolysis decompositionmechanisms for peptidoglycan macromolecule standards and model biochemical compoundswere postulated to identify the pyrolysis products and deduce their bacterial origin.
Figure 2 presents data showing the GC-MS total ion chromatogram (TIC) andcorresponding peaks in the GC-IMS dataspace for a BG spore sample. Direct correlations areobserved between the dominant GC and IMS peaks, which are highlighted by arrows. All majorand minor GC peaks have discernible matching peaks in the IMS chromatograms. Therefore, a
* high degree of visual correlation exists between the two chromatograms.
15

C)
00
Lo 0
-- 0
16~
M Co
0 c0
(09sw0
16

The compound identities of the labeled numbers in the TIC are listed in the Tablealong with their structures and known bacterial origin. Most of these compounds have beenidentified by either the National Institute of Standards and Technology (NIST) EI mass spectraldatabase or mass spectral comparison to commercially available authentic standards, or by bothmethods. For authentic standard identification, GC retention times were matched with therespective experimentally observed GC peaks. The mass spectra for compounds 16, 17, 21, and24 did not produce a satisfactory match with the NIST database because the standards were notcommercially available. The taxonomic classification of the compounds was tentativelyidentified based on mass spectral interpretation.
Peaks 11 and 19 are particularly noteworthy because these pyrolysis productspredominately originated from Gram-positive bacteria. Peak 11 is picolinic acid,25 whichoriginated from the calcium dipicolinate compound that is found only in Gram-positivespores. 26' 27 The vegetative Gram-positive organism does not contain calcium dipicolinate;therefore, the observation of picolinic acid signifies the presence of a Gram-positive spore. Peak19 is novel 33 in that it has not been previously reported in bacterial pyrolysis publications. Thiscompound is 2-pyridine-carboxamide and it has been shown to originate from the lysine peptidecross links in peptidoglycan.33 The amount of the compound is high enough to form an intensedimer ion (1) at GC: IMS coordinates of 53 s : 8.4 ms. A weak monomer ion is observed at thesame GC retention time and at a faster drift time of 6.3 ms. Why a significant amount of thesubstance formed and its absence from bacterial pyrolysis literature are unclear. However,pyrolysis tube airflow operational conditions are different from those in standard biologicalpyrolysis and Py-GC literature. Generally, a drying step is used, and a fast 20 mlimin sweepand flushing of the tube during pyrolysis facilitates the rapid removal of pyrolysis products fromthe heating zone. This process prevents the occurrence of secondary pyrolysis mechanisms,51
which cause degradation of the primary products to lower molecular weight fragments.
Peak 1, a pyridine, is observed in the thermal processing of organisms in general.It originates from the protein, nucleic acid, and peptidoglycan components of
25,34-37microorganisms. However, peak 1 is a significant product of Gram-positive sporesbecause it is formed predominately from the DPA chelate in calcium dipicolinate. Secondarypyrolysis mechanisms on 2-pyridinecarboxamide (19) can also contribute to the generation ofpyridine (1).
Compounds 6, 9, 12, and 13, listed in the Table, are indicative of proteinaceouspyrolysis products. The appearance of protein peaks is expected because proteins constitute50-70% of the dry weight of bacteria. However, the presence of these peaks is mostly genericwith respect to bacterial biomarker utility. No direct useful bacterial distinction ordiscrimination information has been obtained from these substances.
The pyrolysis compounds eluted in under 0.75 min, which can be characterized asa relatively rapid analysis of a complex pyrolyzate. Except for 19, the pyrolyzate productsgenerally have high mobilities (low ion drift times) compared to the RIP.
17

3.2 Gram-positive Vegetative Cells.
The appearance of the TIC and GC-IMS dataspace of BA A Texas in Figure 3 aresimilar to that of BG in Figure 2. An intense, fast GC peak is initially observed, and it primarilyconsists of pyridine (1) and 2-butenoic acid or crotonic acid (4). Pyridine is found in the TICs ofboth bacilli (Figures 2 and 3), but crotonic acid is found only in the BA chromatogram. Pyridinecan originate from the peptidoglycan cell wall layer in BA. The acid, 3-hydroxybutyric, is themonomeric subunit of the polyhydroxybutyric acid (PHBA) polymer, which is an energy storagecompound in certain bacteria. Crotonic acid is the monomeric subunit pyrolysis product ofPHBA. Microbiological literature shows that BG synthesizes very low amounts of PHBA,52 butBA produces appreciable quantities of the compound.3 6'5 3
Under pyrolysis conditions, polymer compounds usually fragment thermally intothe monomeric repeat unit, compounds containing multiples and fragments of the monomer. Thedimer pyrolysis product of PHBA contains two molecules of 3-hydroxybutyric acid minus awater molecule. The mass spectrum of the dimer (18 in the Table) was present in Figure 3 butwas not observed for BG in Figure 2. Confirmation of the presence of the dimer in BA wasobtained from the same GC retention time and matching mass spectrum as that of the PHBAmodel compound (mass spectral data not shown).
In Figure 2, picolinic acid (11) is observed in the BG Gram-positive spore, but is*absent in the Gram-positive vegetative cells of BA in Figure 3. Microbiological,2 6',2
36 37,51 17, 18,20,25
Py-MS, ' 7 and, Py-GC-MS ' ' publications provide extensive evidence that Gram-positive spores do generate picolinic acid while vegetative cells do not.
BG and BA yield an array of pyrolysis products that have their origin in theproteinaceous component (Figures 2 and 3). Because the protein component dominates theweight of dehydrated microorganisms, a significant presence of protein pyrolysis species in GC-MS bacteria analyses is typically observed. The Table outlines the most abundant speciesobserved in Figures 2 and 3. The assignments were confirmed either by matching the GCretention time and mass spectra with standards or by matching the mass spectral with the NISTmass spectral database.
Compounds 21 and 24 were observed in the mass spectral chromatogram inFigure 3, but equivalent signals were not evident in the GC-JMS dataspace (dotted lines). Thesecompounds were determined to be diketopiperazine (DKP) species by mass spectralinterpretation. Pyrolysis has been documented to convert proteins and peptides into cyclicdiamino acid products 42' 48, 49, 55 such as compounds 21 and 24 (Table). The amino end of anamino acid residue and the carboxyl moiety of the adjacent residue cyclize by a dehydrationreaction. The N atom of each residue is resident in the ring in a para position and the R groupsare in the para positions as side groups on the ring. Compounds 21 and 24 were tentativelyidentified as the His-Val and Pro-Pro DKP species, respectively.
18

Table. GC-MS Identified Pyrolysis Products
PeakNumber(Na, Sb) Structure Name Source Reference
Picolinic acid,I N, S Pyridine Proteins, 25, 34-37
n N INucleic acids
2-furan-2 N, S 0 carboxaldehyde, Carbohydrates 34, 38
0 furfural5-methyl-2-
3 N, S 0 furancarbox-O aldehyde, 5-methyl- Carbohydrates 39
furfural
OH Poly (3-hydroxy-4 N, S I Crotonic acid butyric acid), 40
"UO Gram +
0Benzene-
5 N, S acetaldehyde, Proteins 41benzaldehyde
6 N CN? Hexahydropyrrolizin- Proteins 423-one0
OH
7 N, S Phenol Proteins: tyrosine 34
I \ 2- Nucleic acids,8 N, S hydroxymethylfuran, carbo43,h44
S)OH Furfuryl alcohol carbohydrates
OH
9 N, S I p-Cresol Proteins 41,45
19

Table. GC-MS Identified Pyrolysis Products (Continued)
PeakNumber(Na, Sb) Structure Name Source Reference
10 N, S .~ N Phenylacetonitrile, Proteins 34,381 ,benzonitrile
Pyridine-2- Pyridine-2,5-
11 N, S OH carboxylic acid, dicarboxylic acid, 26, 27N icolinic acid Gram positive
0 spores
S1-acetyl-1,2,3,4- Proteins 35
tetrahydropyridine
0
4,5,6,7-13. N tetrahydroindole-3- Proteins 46
oneH
-N.•N Benzene
14 N propanenitrile Proteins 47
15 N,S Indole Proteins 34,35,41
H
16 (CH3)2CH(CH2)9CN iso-tridecanenitrile Branched lipids; 33lipoproteins
17 CH3(CH2)10CH=CH2 1-tridecene Lipopolysaccharides 33_(LPS), Gram -
0OH Dimer of crotonic Poly (3-hydroxy-18 N,S U acid butyric acid), Gram 40
0 +NH2NH2 2-pyridine- Peptidoglycan,
19 N, S 0 carboxamide, Gram +-
TNN picolinamide
20

Table. GC-MS Identified Pyrolysis Products (Continued)
PeakNumber(Na,Sb) Structure Name Source Reference
020 N, S C11HA Dodecanal LPS, Gram - 33
HNr0121 0 NH Diketopiperazine Proteins 48,49
(His-Val)N,K/
NH
.
22 N,S A 2-tridecanone LPS, Gram - 33C11 H23 CH3
23 N, O n-dodecanoic acid, Phospholipids, LPS, 33,50C 11H23 O lauric acid Gram -
0
24 - N Diketopiperazine Proteins 48,4924 yN - (Pro-Pro)
25 N N 2-tetradecenitrile LPS, Gram - 33
C11H23
26 N,S OH n-tetradecanoic Phospholipids, LPS, 33,40,50C13H27 1ý0 acid, myristic acid Gram -
"N, NIST El-mass spectrum identification.b S, Standard commercially obtained compound used for identification.
21

0 0
0 >
z
1&"c•~0
o
z -
----------
(o')w 0
0 CA
C'))
ewil wPCa
22

In addition to the DKP species, compound 16 was observed in the masschromatogram but not in the ion mobility chromatogram. Compound 16 was tentativelyidentified as iso-tridecanenitrile by mass spectral interpretation. Fatty acid species in Gram-positive organisms are predominately branched5 6 while those in Gram-negative organisms arelinear in nature.50 This fatty acid derivative most likely originated from intra-cellular lipoproteinspecies resident in the BA vegetative cells.
Compounds 16, 21, and 24 traversed the torturous Py-GC pathway and wereregistered in the mass spectrometer. However, the IMS cell was not able to respond to thecompounds. Ionization is effected by the transferal of a proton in the proton-water hydratespecies, formed in the 63-Ni source, to the neutral analyte only if the latter has a higher protonaffinity than water. All three compounds display high proton affinity nitrogen moieties, whichare amenable to proton ionization and, therefore, capable of being detected by the LMS detector.Clemner et al.5 report the presence of small and large peptide species observed in electrosprayIMS-TOF-MS proteomics studies. Woods et al.9 describe the characterization of a number ofbiochemical compounds, including peptides and lipids, such as sphingomyelin and cerebrosidesulfate, in their matrix-assisted laser desorption-ionization (MALDI)-IMS-TOF-MSinvestigations.
With Gram-negative bacteria, the absence of certain pyrolyzate species in the ionmobility chromatogram is also unusual. The possible reasons for this phenomenon are outlinedin the next section.
3.3 Gram-negative E. coli.
Figure 4 presents the Py-GC-IMS-MS mass spectra for E. coli. The proteinpyrolysis species distribution appears very similar to that of the Gram-positive organisms(Figures 2 and 3). Except for compound 12, all protein pyrolyzate species have the core benzenering with an attached side chain (Table).
There are a few volatile pyrolysis species that can originate from thecarbohydrate-containing biomolecules in the E. coli cells. These species include compounds2, 3, and 8. Pyrolysis products 4 and 18, formed from PHBA in vegetative BA (Figure 3), werenot observed in the E. coli mass chromatogramn (Figure 4). The absence of PHBA in Figure 4can be explained by the fact that E. coli does not manufacture and store PHBA57' 5 8 under normalgrowth conditions. A relatively small amount of 2-pyridinecarboxamide (19) is observed on the
Sfast side of peak 20 as a low intensity shoulder. The amount of peptidoglycan in Gram-negativecells is about 10% of that in Gram-positive cells; therefore, compound 19 is expected to be invery low abundance.30 Pyridine (1), which can originate from low amounts of 2-pyridinecarboxamide (19),is observed in the chromatogram. The amount of pyridine is relativelylow when compared to the number of BG spores (Figure 2) and BA (Figure 3). Since E. colidoes not contain calcium dipicolinate, picolinic acid (11) is absent in the chromatogram.
The mass chromatogram in Figure 4 is particularly rich in lipid substances. Theseinclude free fatty acids and fatty acid derivatives. Mass spectral confirmation details arepresented elsewhere.33 The outer surface layer of Gram-negative organisms such as E. coli is
23

covered with an LPS complex macromolecule. This layer produces the endotoxin material thatcirculates in the bloodstream when a human is infected by a Gram-negative microorganism.
The two earliest eluting fatty acid derivatives (17, 20) have very low intensities inthe ion mobility chromatogram (vertical arrows), whereas the analogous peaks in the masschromatogram show significant abundances. These compounds are 1-tridecene (C13, 17)(compound 17 was determined by mass spectral interpretation), and dodecanal (C 12, 20).Compounds C12 and C13 indicate that the molecules have a backbone containing 12 and 13carbon atoms, respectively (Table). The thermal decomposition mechanisms that lead to theappearance of these fatty acid derivatives, originating from the 3-hydroxymyristic acid portion ofthe LPS macromolecule, are outlined in a companion paper. The other four lipid species evidentin the mass chromatogram are 2-tridecanone (C 13, 22), n-dodecanoic acid (C 12) or lauric acid(23), 2-tetradecenenitrile (C14, 25), and tetradecanoic acid (C14) or myristic acid (26). Theyield of these four high boiling compounds is much lower than the two lower boiling fatty acidderivatives. Their thermal decomposition mechanisms and generation are also outlinedelsewhere. 33 These relatively high boiling lipid substances are not observed in the ion mobilitychromatogram from the fielded Py-GC-IMS system.
Compounds 5, 7, 10, 12, 14 and 15 indicate proteinaceous substances (Figure 4);however, compounds 17, 20, 22, 23, 25 and 26 indicate Gram-negative, LPS derived lipidsubstances. The latter group of compounds is an important indicator for the presence of Gram-negative organisms, which are either relatively low in intensity or just cannot be observed by theJMS detector.
3.4 Biomarker Taxonomic Utility.
Thermal processing of bacterial substances produces biochemical information thatcan provide more than a biological or non-biological analysis with respect to differentiation andbiodetection goals and objectives. The fielded Py-GC-IMS system has shown that it can indeedproduce a significant number of direct biochemical products from the thermal processing ofwhole, intact microorganisms. More specifically, a number of biochemical polar species,originating in cell walls that react either in a positive or negative fashion with the Gram stain, arecreated in the pyrolysis region; swept rapidly enough from the heated pyrolysis region and intothe GC column; and eluted from the column. The Py-GC is a torturous path for polarbiomolecules and has many sites for compound degradation and adsorption. Secondary thermaldegradation reactions may occur in the pyrolysis source and adsorption may occur in thepyrolyzer, Py-GC interface, and GC column. The operating conditions of the pyrolysis module,however, were optimized to limit the loss of biomaterial. 51 The mass chromatograms, along withauthentic standards and NIST mass spectral database matching, provided confirmatory supportfor the biodetection potential of the system.
24

z
o.o;--------- ---->
CN
CVJ
c..J
CV))
(0esw)OW11 .Jpcj
25

The Py-GC-ambient temperature and pressure-IMS system has been shown todiscriminate between a deliberately released Gram-positive BG spore, Gram-negative EH, andOV protein1 '820 aerosols between 200-800 m from the stand-alone operational system in outdoorscenarios. The present work provides mass spectral evidence of distinct biochemicalcompounds, produced by the pyrolysis module, from microorganisms that contain Gram-positiveand Gram-negative taxonomic information. This lends credibility to the outdoor performance ofthe Py-GC-IMS biodetector.
3.5 Improvement of Pv-GC-IMS Performance. 4
The Py-GC module was operated at the same conditions for the IMS and MSanalyses, yet differences were observed between the two chromatograms primarily in therelatively higher temperature region of the GC column. A fundamental concern of the Py-GC-IMS system is that the temperature of the IMS detector is relatively cold and controlled to adegree by the ambient environment about the briefcase housing.18"20 When operated in anoutdoor field application, the IMS cell is subject to uneven, non-uniform temperatures: ambientenvironmental temperature and heat generated by internal components, including the Py-GCmodule, electronics, and pumping system. Good laboratory practices generally require that ananalytical detector be just as hot, if not hotter, in temperature than the sample analyteintroduction, processing, and transfer modules. Therefore, a constant uniform temperature aboutthe IMS cell is warranted. A CAM IMS detector has been shown to fail irreversibly attemperatures greater than 150 °C because its internal components and solder connections are nothigh temperature compatible.60 In the briefcase biodetector, a heated IMS cell can allow theobservation of compounds such as 16, 21-26 as well as a greater abundance of crucial Gram-positive and Gram-negative bacterial indicator compounds such as 4, 11, 17, 19 and 20.
The IMS detector temperature may not be the only parameter that causes minimalto negligible appearance of certain polar, biochemical compounds from the pyrolysis ofmicroorganisms. Improvement in the signal of certain compounds may also be influenced by thepressure, sweep gas flow rate, internal gas flow patterns, and internal geometry in the IMS cell toremove excess, contaminating neutral species. For example, relatively high (atmospheric)pressure and low, ambient cell temperature can lead to condensation conditions. However,relatively lower pressures and higher temperatures can significantly reduce sample condensationon the inner surfaces of the IMS cell.
3.6 Multivariate Data Analysis.
4bFigure 5 shows two DF plots that provide a significant degree of differentiation
for the GC-IMS dataspaces of bacterial and protein species. Even though protein species are notpart of the Gram classification scheme, inclusion of this class of biological molecule in themultivariate data analyses provides more comprehensive biological discrimination capability forthe Py-GC-ambient temperature and pressure-IMS system. The percent variance or informationcontent of the dataset expressed by the first three DF vectors is DF1, 36%; DF2, 20%; and DF3,17.9%. Both DF plots in Figure 5 show that each of the three Bacillus spore species isdistinguishable from the other two and the vegetative B. anthracis strains group. The relativelylow molecular weight Y and L proteins cluster as a group, while the higher molecular weight
26

SEB and OV species are clearly separated in multivariate DF space. The Gram-negative speciesalso cluster as a group, while background samples are clearly separated. DF3 has the ability todistinguish the OV protein from the B. megaterium spore.
It appears that the differentiation and distinction of the bacterial groups inFigure 5 have a high correlation with the Gram taxonomic information from the bioanalyticalresults presented in Figures 2-4. The Gram-negative species cluster as a group, and the Gram-positive vegetative and spore species are clearly differentiated from each other. This find issignificant because the biochemical species identified in Figures 2-4 may be able to providedistinctive characteristics concerning microbiological Gram stain taxonomy. This grouping isshown on a broader scale in Figure 5 than in Figures 2-4. The addition of protein analytesjustifies the use of the Py-GC-IMS system for biological classification. Figure 5 provides adegree of credibility to the documented performance of the Py-GC-IMS biodetector at theoutdoor bioaerosol field trials for the determination of bacterial and protein presence anddiscrimination.
4. CONCLUSIONS
The pyrolysis-gas chromatography (Py-GC) module in the fielded Py-GC ionmobility spectrometry (IMS) system generated biomolecules from bacterial species. A portionof the pyrolyzate was transferred to a mass spectrometry (MS) detector. Mass spectral analysesconfirmed that these biomolecules contained microbiological discrimination information. Thisinformation appears to augment and confirm the outdoor bioaerosol performance capabilities ofthe briefcase Py-GC-IMS because taxonomically useful pyrolyzate species were generated anddetected by the biodetector. The 2-pyridinecarboxamide and 3-hydroxymyristic acid derivativebiomolecules can be used as biomarker indicators for certain classes of bacteria. Thesebiomolecules contain microbiological taxonomic information. The biomarkers, both individuallyand collectively, correlate to a significant degree with the microbiological Gram stainclassification scheme. The acid, a 2-pyridinecarboxamide, produced by the fielded Py-GC-IMS,can be directly correlated to Gram-positive classification information, and the 3-hydroxymyristicacid derivative compounds can be directly correlated to Gram-negative bacteria. An addedbenefit is that these specific biomarkers are invariant to microbiological growth and cultureparameters such as growth media conditions, age of the cells, growth temperatures, and harvestconditions. Observation of these biomarkers can confirm the presence of either Gram-positive orGram-negative microorganisms. Picolinic acid and polyhydroxybutyric acid (PHBA) pyrolyzate
* species are not directly related to the Gram stain phenomenon. However, they correlate with aGram-positive or Gram-negative organism and are added benefits to the information content in aPy-GC-IMS spectrum.
27

Cd 04
U-
owo
CDd
CO
o LL•• o •, • •
="0 000 0 "
(~ 00
COo
-I
mmm ~04-
>-a.
-6= >1 •, • • .
<0
(.0
C4\J
28u
28

Specific instrumental parameter modifications were suggested to improve the detection oftaxonomically useful information, such as applying a relatively high isothermal temperature tothe analytically challenged ambient temperature and pressure IMS cell. Certain relatively highboiling lipid and diketopiperazine (DKP) polar compounds, observed in the mass chromatogram,are of very low intensity or absent in the corresponding ion mobility chromatogram. Together,the mass spectral information generated and transferred from the Py-GC module, thediscriminant factor (DF) analyses of the GC-IMS dataspaces of a suite of biological samples and
£ the documented performance of the fielded Py-GC-IMS system provide microbiological,scientific, technical and operational support for the utility of the system in biologicalclassification and discrimination scenarios.
2
29

Blank
a
30

LITERATURE CITED
1. Eiceman, G.A.; Karpas, Z., Eds. Ion Mobility Spectrometry; CRC Press:Boca Raton, FL, 1994.
2. Turner, R.B. Transitioning Analytical Instrumentation from the Laboratoryto Harsh Environments. Pure Appl. Chem. 2002, 74, pp 2317-2322.
3. Hoaglund-Hyzer, C.S.; Clemmer, D.E. Ion Trap/Ion Mobility/Quadrupole/Time-of-Flight Mass Spectrometry for Peptide Mixture Analysis. Anal. Chem.2001, 73, pp 177-184.
4. Barnes, C.A.S.; Hilderbrand, A.E.; Valentine, S.J.; Clemmer, D.E.Resolving Isometric Peptide Mixtures: A Combined HPLC/Ion Mobility-TOFMS Analysis of a4000-Component Combinatorial Library. Anal. Chem. 2002, 74, pp 26-36.
5. Myung, S.; Lee, Y.J.; Moon, M.H.; Taraszka, J.; Sowell, R.; Koeniger, S.;Hilderbrand, A.E.; Valentine, S.J.; Cherbas, L.; Cherbas, P.; Kaufmnann, T.C.; Miller, D.F.;Mechref, Y.; Novotny, M.; Ewing, M.A.; Sporleder, C.R.; Clemmer, D.E. Development of High-Sensitivity Ion Trap Ion Mobility Spectrometry Time-of-Flight Techniques: A High ThroughputNano-LC-IMS-TOF Separation of Peptides Arising from a Drosophila Protein Extract. Anal.Chem. 2003, 75, pp 5137-5145.
6. Gillig, K.J.; Ruotolo, B.; Stone, E.G.; Russell, D.R.; Fuhrer, K.; Gonin, M.;Schultz, A.J. Anal. Coupling High Pressure MALDI with Ion Mobility/Orthogonal Time-of-Flight Mass Spectrometry. Anal. Chem. 2000, 72, pp 3965-3971.
7. Woods, A.S.; Koomen, J.M.; Ruotolo, B.T.; Gillig, K.J.; Fuhrer, K.; Gonin,M.; Egan, T.F.; Schultz, J.A. A Study of Peptide-Peptide Interactions using MALDI IonMobility o-TOF and ESI Mass Spectrometry. J. Am. Soc. Mass Spectrom. 2002, 13, pp 166-169.
8. McLean, J.A.; Russell, D.H. Sub-femtomole Peptide Detection in IonMobility-Time-of-Flight Mass Spectrometry Measurements. J. Proteome Res. 2003, 2,pp 427-430.
9. Woods, A.S.; Ugarov, M.; Egan, T.; Koomen, J.; Gillig, K.J.; Fuhrer, K.;Gonin, M.; Schultz, J.A. Lipid/Peptide/Nucleotide Separation with MALDI-Ion Mobility-TOFMS. Anal. Chem. 2004, 76, pp 2187-2195.
10. Matz, L.M.; Asbury, G.R.; Hill, Jr., H.H. Two-Dimensional Separation withElectrospray Ionization Ambient Pressure High-Resolution Ion Mobility Spectrometry/Quadrupole Mass Spectrometry. Rapid Commun. Mass Spectrom. 2002, 16, pp 670-675.
31

11. Matz, L.M.; Steiner, W.E.; Clowers, B.H.; Hill, H.H., Jr. Evaluation ofMicro-Electrospray Ioization with Ion Mobility Spectrometry/Mass Spectrometry. Intl. J. MassSpectrom. 2002, 213, pp 191-202.
12. Steiner, W.E.; Clowers, B.H.; English, W.A.; Hill, H.H., Jr. AtmosphericPressure Matrix-Assisted laser Desorptionlionization with Analysis by Ion Mobility Time-of-Flight Mass Spectrometry. Rapid Commun. Mass Spectrom. 2004, 18, pp 1-7.
13. Lee, S; Gotts, N.G.; von Heldon, G.; Bowers, M.T. Evidence from Ion 6
Chromatography Experiments that Met-Cars are Hollow Cage Clusters. Sci., 1995, 267,pp 999-1001.
14. Bowers, M.T.; Kemper, P.R.; von Helden, G.; van Koppen, P.A.M. Gas-Phase Ion Chromatography: Transition Metal State Selection and Carbon Cluster Formation.Sci., 1993, 260, pp 1446-1451.
15. Dugourd, Ph.; Hudgins, R.R.; Clemmer, D.E.; Jarrold, M.F. High-Resolution Ion Mobility Measurements. Rev. Sci. Instrumen. 1997, 68, pp 1122-1129.
16. Fye, J.L.; Jarrold, M.F. Ion Mobility Studies of Metal-Coated Fullerenes.Intl. J. Mass Spectrom. 1999, 185/186/1187, pp 507-515.
17. Dworzanski, J.P.; McClennen, W.H.; Cole, P.A.; Thornton, S.N.;Meuzelaar, H.L.C.; Arnold, N.S.; Snyder, A.P. Field-Portable, Automated Pyrolysis-GC/IMSSystem for Rapid Biomarker Detection in Aerosols: A Feasibility Study. FieldAnal. Chem.Technol. 1997, 1, pp 295-305.
18. Snyder, A.P.; Maswadeh, M.M.; Parsons, J.A.; Tripathi, A.; Meuzelaar,H.L.C.; Dworzanski, J.P.; Kim, M.-G. Field Detection of Bacillus Spore Aerosols with Stand-Alone Pyrolysis-Gas Chromatography-Ion Mobility Spectrum. FieldAnal. Chem. Technol.1999, 3, pp 315-326.
19. Snyder, A.P.; Maswadeh, M.M.; Tripathi, A.; Dworzanski, J.P. Detection ofGram-Negative Erwinia herbicola Outdoor Aerosols with Pyrolysis-Gas Chromatography/IonMobility Spectrometry. Field Anal. Chem. Technol. 2000, 4, pp 111-126.
20. Snyder, A.P.; Tripathi, A.; Maswadeh, M.M.; Ho, J.; Spence, M. Field ADetection and Identification of a Bioaerosol Suite by Pyrolysis-Gas Chromatography-IonMobility Spectrometry. Field Anal. Chemn. Technol. 2001, 5, pp 190-204.
21. Snyder, A.P.; Maswadeh, M.M.; Tripathi, A.; Eversole, J.; Ho, J.; Spence,M. Orthogonal Analysis of Mass and Spectral Based Technologies for the Field Detection ofBioaerosols. Anal. Chim. Acta 2004, 513, pp 365-377.
32
22. Eiceman, G.A. Advances in Ion Mobility Spectrometry: 1980-1990. Crit.Rev. Anal. Chem. 1991, 22, pp 471-490.
23. Baumbach, J.I.; Eiceman, G.A. Ion Mobility Spectrometry; Arriving onSite and Moving Beyond a Low Profile. Appl. Spectro. 1999, 53, pp 338A-355A.
24. Vinopal, R.T.; Jadamec, J.R.; deFur, P.; Demars, A.L.; Jakubielski, S.;Green, C.; Anderson, C.P.; Dugas, J.E.; DeBono, R.F. Fingerprinting Bacterial Strains Using
£ Ion Mobility Spectrometry. Anal. Chim. Acta 2002, 457, pp 83-95.
25. Snyder, A.P.; Thornton, S.N.; Dworzanski, J.P.; Meuzelaar, H.L.C.Detection of the Picolinic Acid Biomarker in Bacillus Spores Using a Potentially Field-PortablePyrolysis-Gas Chromatography-Ion Mobility Spectrometry System. FieldAnal. Chem. Technol.1996, 1, pp 49-58..
26. Breed, R.S.; Murray, E.G.D.; Smith, N.R., Eds. Bergey's Manual ofDeterminative Bacteriology; 7th ed. The Williams & Wilkins Company: Baltimore, 1957,pp 295-305.
27. Gould, G.W.; Hurst, A., Eds. The Bacterial Spore; Academic Press: NewYork, NY, 1969.
28. Snyder, A.P.; Harden, C.S.; Brittain, A.H.; Kim, M.-G.; Arnold, N.S.;Meuzelaar, H.L.C. Portable Hand-Held Gas Chromatography/Ion Mobility SpectrometryDevice. Anal. Chem. 1993, 65, pp 299-306.
29. Snyder, A.P.; Maswadeh, W.M.; Tripathi, A. ECBC, Edgewood, MD. Jan-Feb, 2001.
30. Lennette, E.H.; Balows, A.; Hausler, W.J., Jr.; Eds. Manual of ClinicalMicrobiology; Chapter 98; American Society for Microbiology: Washington, DC, 1980.
31. Kroonenberg, P.M., Ed. Three-Mode Principal Component Analysis:Theory and Applications; DWO Press: Leiden, The Netherlands, 1983.
32. Marengo, E.; Leardi, R.; Robotti, E.; Righetti, P.G.; Antonucci, F.; Cecconi,D. Application of Three-Way Principal Component Analysis to the Evaluation of Two-
£ Dimensional Maps in Proteomics. J. Proteome Res. 2003, 2, pp 351-360.
33. Hair, J.F., Jr.; Anderson, R.E.; Tatham, R.L.; Black, W.C. MultivariateData Analysis; Prentice-Hall, Inc.: Upper Saddle River, NJ, 1998.
34. Dworzanski, J.P.; Tripathi, A.; Snyder, A.P.; Maswadeh, M.M.; Wick, C.H.Novel Biomarkers for Gram-Type Differentiation of Bacteria by Pyrolysis-GasChromatography-Mass Spectometry. J. Anal. Appl. Pyrolysis 2005, 73, pp 29-38.
33

35. Fox, A.; Morgan, S.L. The Chemotaxonomic Characterization ofMicroorganisms by Capillary Gas Chromatography and Gas Chromatography-MassSpectrometry. In Rapid Detection and Identification of Microorganisms: Chapter 5; Nelson,W.H., Ed.; VCH Publishers: Deerfield Beach, FL, 1985, pp 135-164.
36. Stankiewicz, B.A.; van Bergen, P.F.; Duncan, I.J.; Carter, J.F.; Briggs,D.E.G.; Evershed, R.P. Recognition of Chitin and Proteins in Invertebrate Cuticles UsingAnalytical Pyrolysis/Gas Chromatography and Pyrolysis/Gas Chromatography/MassSpectrometry. Rapid Commun. Mass Spectrom. 1996, 10, pp 1747-1757.
37. Beverly, M.B.; Voorhees, K.J.; Hadfield, T.L. Direct Mass SpectrometricAnalysis of Bacillus Spores. Rapid Commun. Mass Spectrom. 1999, 13, pp 2320-2326.
38. Beverly, M.B.; Basile, F.; Voorhees, K.J.; Hadfield, T.L. A RapidApproach for the Detection of Dipicolinic Acid in Bacterial Spores using Pyrolysis/MassSpectrometry. Rapid Commun. Mass Spectrom. 1996, 10, pp 455-458.
39. Eudy, L.W.; Walla, M.D.; Morgan, S.L., Fox, A. Gas Chromatographic-Mass Spectrometric Determination of Muramic Acid Content and Pyrolysis Profiles for a Groupof Gram-positive and Gram-negative Bacteria. Analyst 1985, 110, pp 381-385.
40. Medley, E.E.; Simmonds, P.G.; Manatt, S.L. A Pyrolysis GasChromatography Mass Spectrometry Study of the Actinomycete Streptomyces longisporoflavus.Biomed. Mass Spectrom. 1975, 2, pp 261-265.
41. Grassie, N.; Murray, E.J.; Holmes, P.A. The Thermal Degradation of Poly(-(D)-beta-hydroxybutyric acid): Part 3-The Reaction Mechanism. Polymer Degradation Stability1984, 6, pp 127-134.
42. Chiavari, G.; Galletti, G. Pyrolysis-Gas Chromatography/MassSpectrometry of Amino Acids. J. Anal. Appl. Pyrolysis 1992, 24, pp 123-137.
43. Smith, G.G.; Reddy, G.S.; Boon, J.J. Gas Chromatographic-MassSpectrometric Analysis of the Curie-Point Pyrolysis Products of Some Dipeptides and TheirDiketopiperazine. J. Chem. Soc. Perkin Trans. 1988, II, pp 203-211.
44. Schrodter, R.; Baltes, W. Pyrolysis of Various Furan Model Compounds.J. Anal. Appl. Pyrolysis 1991, 19, pp 131-137.
45. van der Kaaden, A.; Haverkamp, J.; Boon, J.J.; de Leeuw, J.W. AnalyticalPyrolysis of Carbohydrates. 1. Chemical Interpretation of Matrix Influences on Pyrolysis-MassSpectra of Amylose Using Pyrolysis-gas Chromatography-Mass Spectrometry. J. Anal. Appl.Pyrolysis 1983, 5, pp 199-220.
34

46. Tsuge, S.; Matsubara, H. High-Resolution Pyrolysis-Gas Chromatographyof Proteins and Related Materials. J Anal. Appl. Pyrolysis 1985, 8, pp 49-64.
47. Boon, J.J.; de Leeuw, J.W. Amino Acid Sequence Information in Proteinsand Complex Proteinaceous Material Revealed by Pyrolysis-Capillary Gas Chromatography-Low and High Resolution Mass Spectrometry. J. Anal. Appl. Pyrolysis 1987, 11, pp 313-327.
48. Voorhees, K.J.; Zhang, W.; Hendricker, A.D.; Murugaverl, B. An£ Investigation of the Pyrolysis of Oligopeptides by Curie-Point Pyrolysis-Tandem Mass
Spectrometry. J. Anal. Appl. Pyrolysis 1994, 30, pp 1-16.
49. Hendricker, A.D.; Voorhees, K.J. Amino Acid and Oligopeptide AnalysisUsing Curie-Point Pyrolysis Mass Spectrometry with In-Situ Thermal Hydrolysis andMethylation: Mechanistic Considerations. J. Anal. Appl. Pyrolysis 1998, 48, pp 17-33.
50. Hendricker, A.D.; Voorhees, K.J. An Investigation into the Curie-PointPyrolysis-Mass Spectrometry of Glycyl Dipeptides. J. Anal. Appl. Pyrolysis 1996, 36, pp 51-70.
51. Wilkinson, S.G. In Microbial Lipids; Chapter 7; Ratledge, C.; Wilkinson,S.G., Eds.; Academic Press: London, UK, 1988.
52. Tripathi, A.; Maswadeh, M.M.; Snyder, A.P. Optimization of Quartz TubePyrolysis Atmospheric Pressure Ionization Mass Spectrometry for the Generation of BacterialBiomarkers. Rapid Commun. Mass Spectrom. 2001, 15, pp 1672-1680.
53. Reusch, R.A.; Sadoff, H.L. D-(-)-Poly-Beta-Hydroxybutyrate inMembranes of Genetically Competent Bacteria. J Bacteriol. 1983, 156, pp 778-788.
54. Watt, B.E.; Morgan, S.L.; Fox, A. 2-Butenoic Acid, a Chemical Marker forPoly-Beta-Hydroxbutyrate Identified by Pyrolysis-Gas Chromatography/Mass Spectrometry inAnalyses of Whole Microbial Cells. J. Anal. Appl. Pyrolysis 1991, 19, pp 237-249.
55. Morikawa, H.; Marchessault, R.H. Pyrolysis of Bacterial Polyalkanoates.Can. J. Chem. 1981, 59, pp 2306-2313.
56. Noguerola, A.S.; Murugaverl, B.; Voorhees, K.J. An Investigation ofDipeptides Containing Polar and Nonpolar Side Groups by Curie-Point Pyrolysis Tandem MassSpectrometry. J. Am. Soc. Mass Spectrom. 1992, 3, pp 750-756.
57. O'Leary, W.M.; Wilkinson, S.G. In Microbial Lipids; Chapter 5; Ratledge,C.; Wilkinson, S.G., Eds.; Academic Press: London, UK, 1988.
35

58. Reusch, R.; Hiske, T.; Sadoff, H.; Harris, R.; Beveridge, T. CellularIncorporation of Poly-Beta-Hydroxybutyrate into Plasma Membranes of Escherichia coli andAzotobacter vinelandii Alters Native Membrane Structure. Can. J. Microbiol. 1987, 33,pp 435-444.
59. Reddy, C.S.K.; Ghai, R.; Rashmi, V.C.K. Polyhydroxyalkanoates: AnOverview. Bioresource Technol. 2003, 87, pp 137-146.
60. Arnold, N.A., University of Utah, Salt Lake City, UT, 2004
36