correlation between laboratory and field performance of greywacke aggregates qinxin cao, adelia...
TRANSCRIPT

CORRELATION BETWEEN LABORATORY AND FIELD PERFORMANCE OF GREYWACKE AGGREGATES
Qinxin Cao, Adelia Nataadmadja, and Dr. Douglas Wilson

Overview
Background Project Objectives Methodology Results Conclusions Further Research Direction
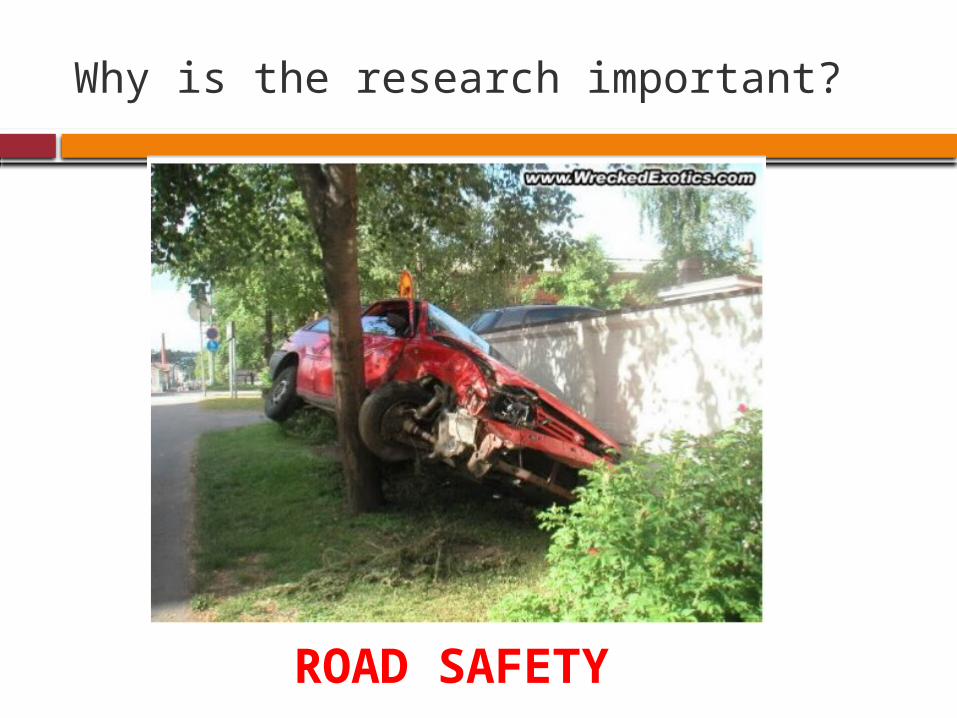
Why is the research important?
ROAD SAFETY

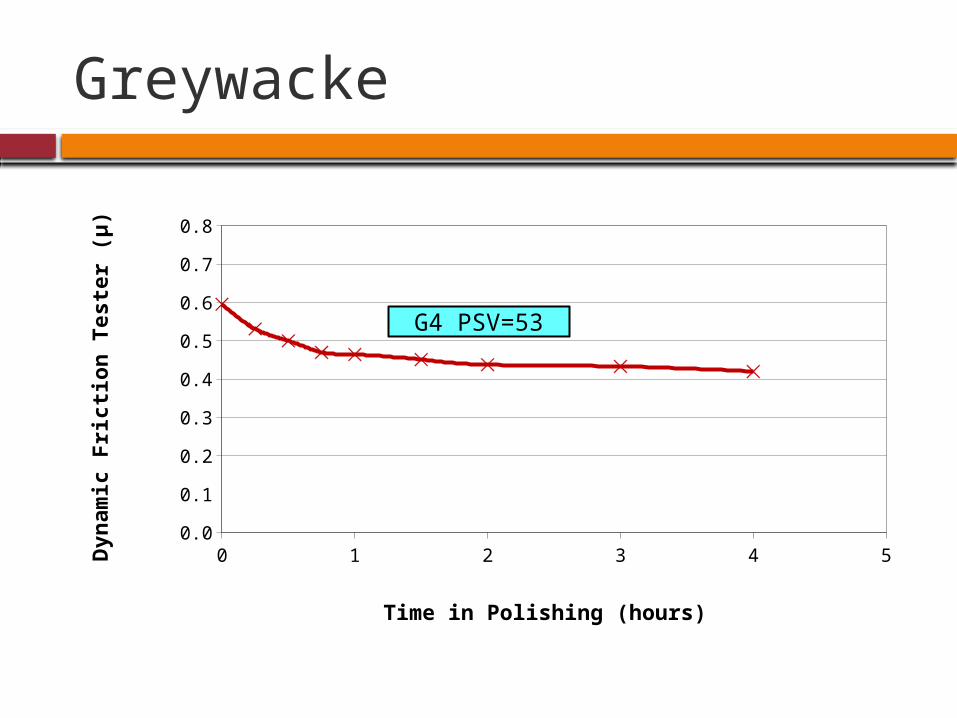
Greywacke
Skid Resistance (μ) Performance of Greywacke Sandstone Rock Aggregates cf Melter Slag Aggregate Under Accelerated Polishing
y = 0.007x2 - 0.060x + 0.548
R2 = 0.823
y = 0.049x2 - 0.213x + 0.614
R2 = 0.835
y = 0.010x2 - 0.118x + 0.875
R2 = 0.995
y = 0.006x2 - 0.065x + 0.887
R2 = 0.982
0.3
0.4
0.5
0.6
0.7
0.8
0.9
1
0.0 0.5 1.0 1.5 2.0 2.5 3.0 3.5 4.0 4.5 5.0 5.5 6.0
Accelerated Polishing Duration - Time (hours)
DF
T T
este
r C
oF
(μ
)
G1 Pol G2 Pol G3 Pol MS1 Pol
Poly. (G1 Pol) Poly. (G2 Pol) Poly. (G3 Pol) Poly. (MS1 Pol)
MS1 PSV = 55
G3 PSV = 63
G1 PSV = 51
G2 PSV = 55*
Greywacke
0 1 2 3 4 50.0
0.1
0.2
0.3
0.4
0.5
0.6
0.7
0.8
Time in Polishing (hours)
Dyn
am
ic F
rict
ion
Test
er
(μ)
G4 PSV=53

6
Project Objectives
Correlating the laboratory and measured field skid resistance performance of the G4 Auckland greywacke aggregate
Comparing the field performance between the G4 Auckland Greywacke and a greywacke aggregate (G1) from another quarry in Northland of New Zealand (NZ).
Investigating a skid resistance related crash model for the G4 Auckland greywacke
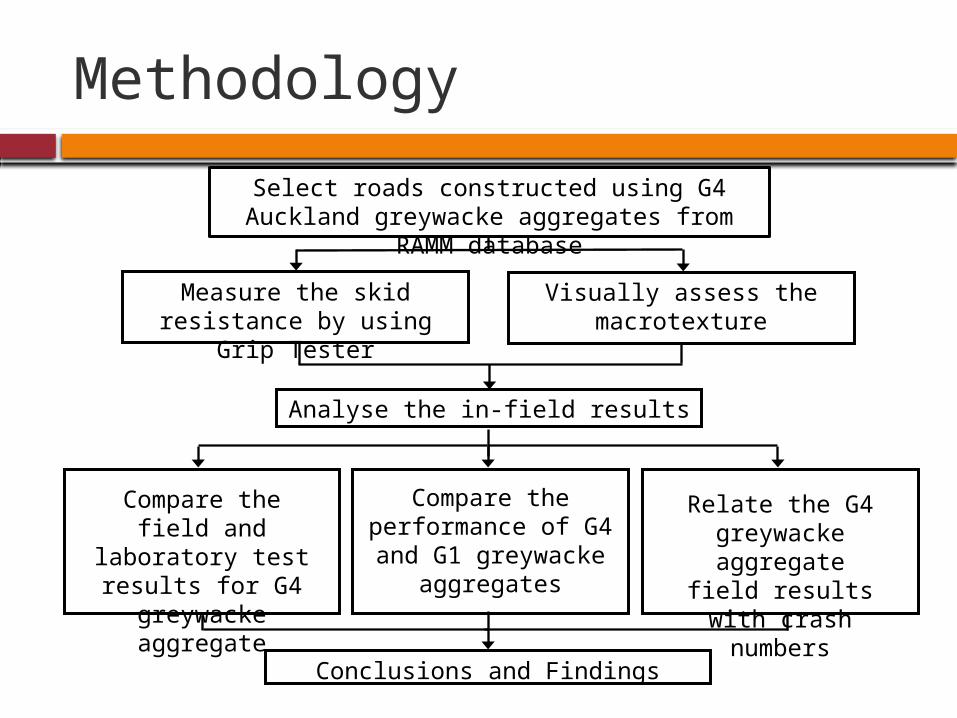
Methodology
Select roads constructed using G4 Auckland greywacke aggregates from RAMM database
Measure the skid resistance by using Grip Tester
Visually assess the macrotexture
Analyse the in-field results
Compare thefield and laboratory test
results for G4 greywacke aggregate
Compare the performance of G4 and
G1 greywacke aggregates
Relate the G4 greywacke aggregatefield results with crash
numbers
Conclusions and Findings

8

Skid Testing Procedures
2-3 runs Run at 30-40
km/h Calibrated every
2-3 days of skid testings
Seasonal Variations

Northland G1Greywacke Aggregate
Source: http://www.epccn.com/en/productinfo448.html
Source: http://maps.google.com/
SH 11

11
Crash Analysis Methodology
Input
Map
Define
Report

Crash Data Analysis
Exposure Relative Crash Rate

Laboratory versus Field Performance
0 1 2 3 4 50.00.10.20.30.40.50.60.70.8
Time in Polishing (hours)
Dyn
am
ic F
rict
ion
Test
er
(μ)
0 1 2 3 4 5 6 7 8 9 10 11 120
0.10.20.30.40.50.60.70.8
Surface Age (year)
Gri
p N
um
ber
(GN
)Laboratory
Results (Kumar, 2009)
Field Results

Laboratory and Field Performance
1 2 3 4 5 6 7 8 9 10 11
Se-ries1
0.4
0.45
0.5
0.55
0.6
0.65
0.7
0.75
0.4
0.45
0.5
0.55
0.6
0.65
0.7
0.75
Surface Age (year)
GN
Polishing Time (hours)
DFT (
µ)

Macrotexture
Good
Medium
Poor

Traffic Polishing
0 100000 200000 300000 400000 500000 600000 7000000
0.1
0.2
0.3
0.4
0.5
0.6
0.7
0.8
GN Against %HCV
ADT 100-500ADT 501-2000ADT 2001-4000ADT 4001-10000
Surface Age x ADT x %HCV (105)
Gri
p N
um
ber
(G
N)

Northland Greywacke Aggregates
0 1 2 3 4 5 6 7 8 9 100
0.1
0.2
0.3
0.4
0.5
0.6
0.7
0.8
f(x) = − 0.0190330053259258 ln(x) + 0.472939843470488R² = 0.103194690412337f(x) = 0.470786123463245 x^-0.0453690062716688R² = 0.110997197696856
Age
SC
RIM
0 1 2 3 4 5 6 7 8 9 10 11 120
0.10.20.30.40.50.60.70.8
Surface Age (year)
Gri
p N
um
ber
(GN
)
0 0.5 1 1.5 2 2.5 30
0.10.20.30.40.50.60.70.8
PoorMediumGood
Macrotexture
SC
RIM
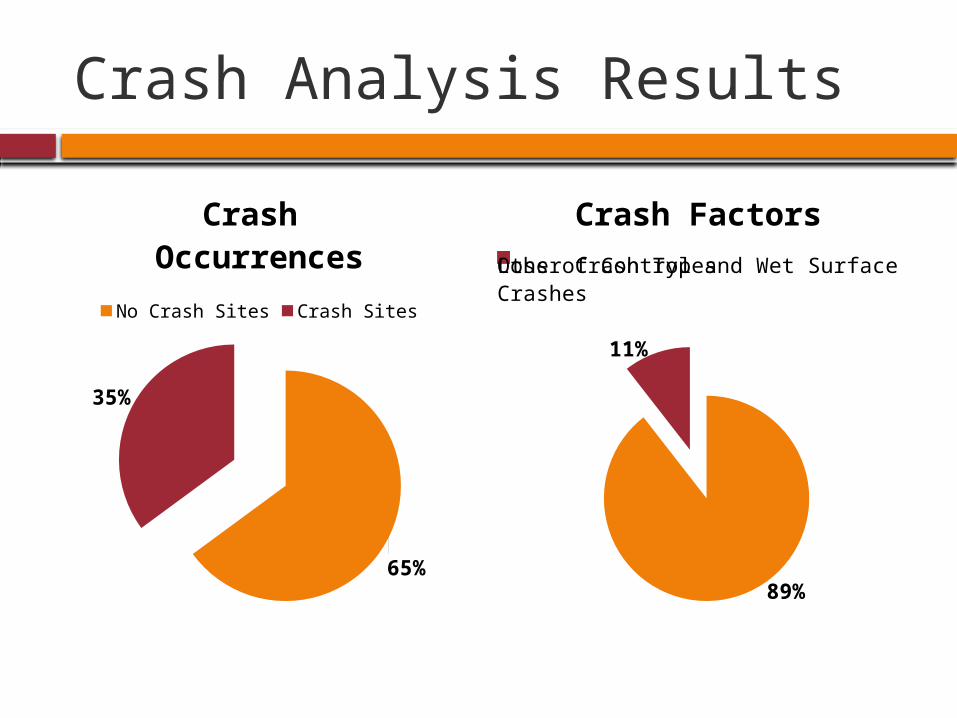
Crash Analysis Results
65%
35%
Crash OccurrencesNo Crash Sites Crash Sites
18
89%
11%
Crash FactorsOther Crash TypesLoss of Control and Wet Surface Crashes

Relative Crash Rate Against Skid Resistance
0 0.1 0.2 0.3 0.4 0.5 0.6 0.7 0.80
1
2
3
4
5
f(x) = 157267.276177605 exp( − 25.1247211917621 x )R² = 0.88454829027296
Grip Number (GN)
Rela
tive C
rash
R
ate
0.45 0.47 0.49 0.51 0.53 0.55 0.57 0.590
0.2
0.4
0.6
0.8
1
f(x) = 157267.276177605 exp( − 25.1247211917621 x )R² = 0.88454829027296
Grip Number (GN)
Rela
tive
Cra
sh
Rate
Conclusions
The accelerated laboratory polishing prediction methodology developed at UoA by Wilson (2006) can adequately reflect the field performance as measured by the GT for G4 and by the SCRIMM++ for G1
The relative crash rate decrease exponentially with increasing skid resistance.
Macrotexture and microtexture measurements are important to adequately describe skid resistance field measurements

Further Research Directions
Analyse single coat seal and asphaltic concrete type pavements
Extend the analysis to different road categories
Extend crash analysis to different aggregates types
Analyse geometrically variable road sections
Jayden Ellis (Stevenson Ltd)Barry Larsen (Stevenson Ltd)Ross Ashby (Stevenson Ltd)Noel Perinpayagam (The University of Auckland)Sujith Jose Padiyara (The University of Auckland)Si Thu Win (Downer EDI)
Acknowledgements

MAIREPAV 7 Conference, Auckland, NZ - Call for Abstracts now open….
AUCKLAND, NEW ZEALAND – AUGUST 27-30, 2012

MAIREPAV 7 Conference, Auckland, NZ - Call for Abstracts now open….
27-30th August 2012