correlation between inhibition efficiency and chemical structure
TRANSCRIPT

Int. J. Electrochem. Sci., 8 (2013) 5925 - 5943
International Journal of
ELECTROCHEMICAL
SCIENCE
www.electrochemsci.org
Correlation Between Inhibition Efficiency and Chemical
Structure of Some Amino Acids on the Corrosion of Armco Iron
in Molar HCl
A. Aouniti1, K.F. Khaled
2,3,*, B. Hammouti
1
1 LCAE-UAC18, Faculté des Sciences, Université Mohammed Premier, 60000 Oujda, Morocco
2 Electrochemistry Research Laboratory, Ain Shams University, Faculty of Education, Chemistry
Department, Roxy, Cairo, Egypt 3
Materials and Corrosion Laboratory, Taif University, Faculty of Science, Chemistry Department,
Taif, Hawiya 888, Kingdom of Saudi Arabia *E-mail: [email protected]
Received: 20 October 2012 / Accepted: 6 February 2013 / Published: 1 April 2013
Weight loss measurement and various electrochemical AC and DC corrosion monitoring techniques
are performed at 308 K using Armco iron specimens immersed in 1M HCl solution in the presence and
absence of various amino acids (methionine, cysteine, cystine, glycine, leucine, arginine, serine,
glutamic acid, ornithine, Lysine, aspartic acid, alanine, valine, asparagine, glutamine, and threonine).
Polarisation curves indicated that theses amino acids act as cathodic inhibitors. Methionine, cysteine
and cystine who have a sulphur atom in their molecular structure are the best inhibitors, and we
suggested that theses three amino acids are adsorbed on the metal surface through the sulphur active
centre and that the extent of inhibition is directly related to the formation of the adsorption layer which
is sensitive function of the molecular structure. The corrosion inhibition of methionine is regarded by
simple blocked fraction of the electrode surface related to the adsorption of inhibitor species according
to Frumkin isotherm model on the Armco iron surface. It is clear that quantum descriptors are a better
choice when predictivity is the main issue. Among the descriptors with major contribution we should
point out that highest occupied molecular orbital energy (EHOMO), total dipole moment, total energy
and binding energy are important predictive descriptors.
Keywords: Corrosion inhibitor, Amino acids, Genetic Function Approximation, QSAR
1. INTRODUCTION
Its know that the efficiency of an organic compound as corrosion inhibitor depends not only on
the characteristics of the environment in which it acts, the nature of the metal surface and
electrochemical potential at the interface, but also on the structure of the inhibitor itself [1, 2] .

Int. J. Electrochem. Sci., Vol. 8, 2013
5926
The inhibitor molecule should have centres capable of forming bonds with the metal surface
via electron transfer. Thus, the metal acts as an electrophile, whereas the inhibitor molecule acts as a
Lewis base, whose nucleophilic centre are normally available for sharing, i.e. formation of a bond.
Organic compounds containing electro-negative functional groups and electron in triple or
conjugated double bonds are usually good inhibitors [3-11].
In recent decades, the use of natural compounds, nontoxic and ecologically friendly is required
in industry. In our laboratory, various researches showed that aminoacids [3-11] and some extracts or
oil from natural plants [22–24] exhibited as efficient corrosion inhibitors for steel, iron and copper in
different test solutions. The excellent inhibitory effect of methionine on the iron corrosion in HCl
solution was patented [25].
Grigor’ev and Kusnetsov [12] studied the effect of glycine derivatives as inhibitors of the
production of hydrogen in the corrosion of zinc and iron in H2SO4 solutions. They found that an
increase in the electron acceptor properties of the substituent radical resulted in greater control of the
liberation of hydrogen from the metals. Issa et al. [13] investigated the inhibiting efficiency of some
amino compounds including cystine, cysteine, semicarbazide and thiosemicarbazide on the corrosion
of aluminium by acids. They suggested that the adsorption of the organic compound on the metal
surface took place through the C=S group in the case of thiosemicarbazide and through the C=O group
in other cases. Brandt et al.[14] studied the inhibition by organic sulphides of the corrosion of iron by
acids. They reported that the sulphur atom of the aliphatic sulphides is the reaction centre for their
interaction with the metal surface.
Several attempts have been made to predict corrosion inhibition efficiency with a number of
individual parameters obtained via various quantum chemical calculation methods as a tool for
studying corrosion inhibitors [15-18] .
Khaled studied the relationship between the structural properties of several classes of organic
inhibitors and their effect on their inhibition efficiencies using genetic function approximation and
neural network analysis methods[1, 19, 20].
In the present work corrosion tests and electrochemical measurements are performed on Armco
iron in HCl solution in the presence of some amino acids containing an active sulphur (methionine:
Met, cysteine: Cys, cystine: Cyt) and a sulphur-free amino acids (glycine: Gly, leucine: Leu, arginine:
Arg, serine: Ser, glutamic acid: Glu, ornithine: Orn, Lysine: Lys, aspartic acid: Asp, alanine: Ala,
valine: Val, asparagine: Asn, glutamine: Gln, and threonine: Thr) to determine (a) the efficiency of
these compounds as inhibitors of the corrosion of Armco iron by acid and (b) the inhibition
mechanism. The structural properties of these amino acids well be calculated using quantum chemical
calculations and a QSAR model will be thought.
2. EXPERIMENTAL DETAILS
All chemicals used were of AR grade and the inhibitors are from commercial products (Fig. 1).
The specimens used in the chemical investigations are in the form of strips of dimensions
1cm2cm0.05cm. Table 1 shows the chemical composition of pure Armco iron:

Int. J. Electrochem. Sci., Vol. 8, 2013
5927
Cyt
AlaCH3 Val
CH2SSCH2CHNH2
CO2H
CH
CO2H
NH2
ArgCH
CO2H
NH2
CH2HS Cys
CH2S CH2CH3CH
CO2H
NH2 MetCH
CO2H
NH2
H GLY
CH
CO2H
NH2
CH2HOSer
NH2
CO2H
CHCH2CH
CH3
CH3Leu
NH2
CO2H
CHC CH2CH2
O-
O
Glu
CH2CH2CH2CH
CO2H
NH2
NH2Orn
NH2
CO2H
CHC CH2
O-
O
Asp
NH2
CO2H
CHC CH2
O
NH2Asn Lys
CH
CO2H
NH2
CH
OH
CH3Thr
Gln
NH2
CO2H
CHCH2C
O
NH2 CH2
CH
CO2H
NH2NH2
CO2H
CHCH
CH3
CH3
CH2NHC
NH
NH2CH
CO2H
NH2
CH2CH2
CH2CH2CH2CH
CO2H
NH2
NH2 CH2
Figure 1. Molecular structure of amino acids studied.
Table 1. Chemical composition of Armco iron.
element C Si Mn S P Cu Ni Cr N O Fe
% 0.012 0.01 0.07 0.006 0.008 0.025 0.02 0.015 0.04
2
0.072 balance
The mass loss was measured on Armco iron sheets in 100 ml of 1M HCl solution.
Electrochemical impedance and potentiodynamic measurements are carried out in a conventional
three-electrode electrolysis cylindrical tempered glass cell. The working electrode, in the form of a
disc cut from Armco iron, had a geometric area of 1.0 cm2. A saturated calomel electrode (SCE) and a
platinum (Pt) electrode are used as reference and auxiliary electrodes, respectively. The polarisation
curves are recorded with an Amel 550 potentiostat using an Amel 567 linear sweep generator at a scan
rate of 20 mV/min. Before recording the cathodic polarisation curves, the iron electrode was polarised
at -800 mV/SCE for 10min. For anodic curves, the potential electrode was swept from its corrosion
potential maintained for 30 min, to more positive values.
All impedance spectra in the frequency range 10 mHz f 64000 Hz are performed in the
potentiostatic mode at the corrosion potential, using an EGG Princeton model 6310 Frequency
Response Analyser. A small amplitude signals (10 mV) are used in the frequency domain cited. The
impedance diagrams are given in the Nyquist representation (R-jG) where R is the real and -jG is the
imaginary part.
Int. J. Electrochem. Sci., Vol. 8, 2013
5928
The aggressive solution (1M HCl) is prepared by dilution of analytical-grade 37% HCl with
doubly distilled water. All tests are obtained in magnetically stirred and deaerated solutions. Prior
measurement, the iron samples are polished with different emery paper, rinsed with doubly distilled
water and dried in air.
3. COMPUTATIONAL DETAILS
Geometrical parameters of all stationary points for the investigated amino acids are optimised
both in gas and aqueous phases, employing analytic energy gradients. The generalised gradient
approximation (GGA) within the density functional theory was conducted with the software package
DMol3 in Materials Studio of Accelrys Inc. All calculations were performed using the Becke–Lee–
Yang–Parr (BLYP) exchange correlation functional and the double numerical with polarization (DNP)
basis set [21-23] , since this was the best set available in DMol3. A Fermi smearing of 0.005 hartree
and a real space cutoff of 3.7 Å was chosen to improve the computational performance. All
computations were performed with spin polarization.
The phenomenon of electrochemical corrosion takes place in the liquid phase, so it is relevant
to include the effect of solvent in the computations. Self-consistent reaction field (SCRF) theory [24],
with Tomasi’s polarised continuum model (PCM) was used to perform the calculations in solution.
These methods model the solvent as a continuum of uniform dielectric constant ( =78.5) and define
the cavity where the solute is placed as a uniform series of interlocking atomic spheres. Frontier orbital
distribution was obtained, at the same basis set level, to analyse the reactivity of inhibitor molecules.
The genetic function approximation (GFA) algorithm offers a new approach to the problem of
building quantitative structure-activity relationship (QSAR) and quantitative structure-property
relationship (QSPR) models. Replacing regression analysis with the GFA algorithm allows the
construction of models competitive with or superior to those produced by standard techniques and
makes available additional information not provided by other techniques. Unlike most other analysis
algorithms, GFA provides multiple models, where the populations of the models are created by
evolving random initial models using a genetic algorithm. GFA can build models using not only linear
polynomials but also higher-order polynomials, splines, and other nonlinear functions [25].
4. RESULTS AND DISCUSSION
4.1 Comparative experimental studies.
The structure of the amino acids tested are shown in Fig. 1. The effect of addition of amino
acids on the corrosion of iron in 1M HCl solution was also studied by weight-loss at 308K after 6
hours of immersion period (Table 2). Inhibition efficiency (Ew%) are calculated as follows:
% (1 ) 100w o
wE
w

Int. J. Electrochem. Sci., Vol. 8, 2013
5929
where w and ow are the corrosion rates of iron samples in the absence and presence of the
organic compounds, respectively.
The cathodic and anodic polarisation curves of iron in molar HCl in the absence and presence
of these molecules at 10-3
M are presented in Figs. 2 and 3, respectively.
The curves reveal that all amino acids tested at 10-3
M inhibit only the cathodic process and
Met, Cys and Cyt who have a sulphur atom in their structure are the best inhibitors. The organic
compounds studied perform their inhibiting action by slowing down the cathodic reaction of hydrogen.
Values of associated electrochemical parameters and inhibition efficiency ( %potE ) of all compounds
are given in Table 2. In this case of polarisation method, no Tafelic straight line was found especially
with Met, Cys, Cyt and Arg, then the inhibition efficiency ( %potE ) is determined by the relation:
% 1 100corrpot o
corr
iE
i
Where /corr corri i A : A is the exposed surface area and o
corri , corri are the uninhibited and
inhibited corrosion current densities, respectively, for a given ( %potE )
Figure 2. Cathodic potentiokenitic polarisation curves of Armco iron in 1M HCl in the presence of
different amino acids.
The inhibiting properties of many compounds are determined by electron density at the atom
containing the main reaction centre [26]. In our work, all inhibitors discussed have an acidic and amine
functions in their structure. Further, owing to the acidity of the medium, amino acid compounds cannot
remain in solution as free molecules and they exist in the solution in the cationic form:
RNH3
+
COOH"R" is a radical
-800 -700 -600 -500 -400 -3001
2
3
4
5
6 hcl. arg. cys. met. val.
leu. lys. gly. AspAcid. gluta.
ser. ornith. Aglut. threon.
Cur
rent
Den
sity
( m
A / c
m 2 )
Potential ( Volt / SCE )
Int. J. Electrochem. Sci., Vol. 8, 2013
5930
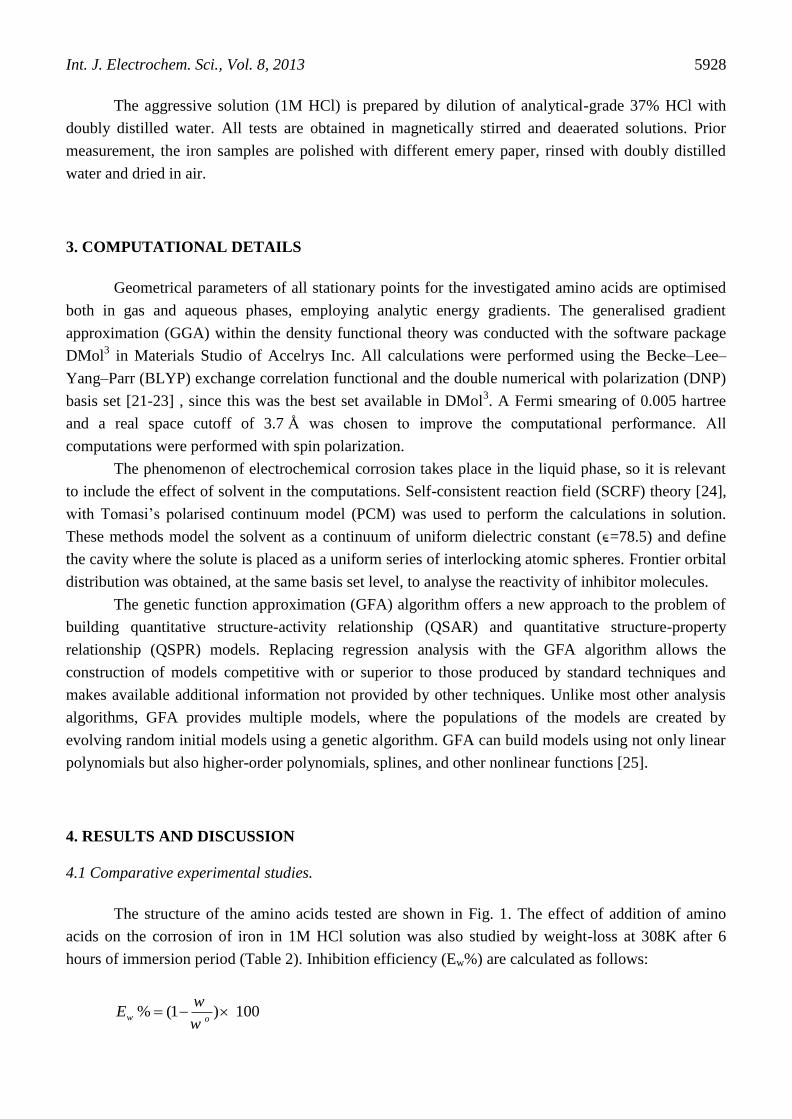
However, variation in inhibition efficiency among the various additives would originate from
the changing nature of substituents in the end of the radical « R
».
Table 2. Gravimetric and electrochemical data of the iron corrosion in 1M HCl with various amino
acids at 10-3
M.
compounds HCl Met Cys Cyt Arg Val Leu Lys Gly Asp Gln Ser Orn Glu Thr Ala Asn
Gravimetric measurements
W(mg.cm-2.h-1) 0.572 0.156 0.239 0.225 0.189 0.482 0.240 0.364 0.563 0.489 0.492 0.579 0.430 0.530 0.418 0.506 0.418
E % --- 72.7 58.2 60.7 66.9 15.7 58.0 36.4 1.6 14.5 14.0 -1.2 24.8 7.3 26.9 11.5 26.9
Polarisation measurements
Ecorr (mV) -477 -485 -497 -488 -472 -464 -466 -478 -460 -468 -460 -483 -475 -466 -474 -461 -463
E = -700 mV
I (mA/cm2) 15100
2140 5400 4090 6430 9000 8060 9820 13000
10740
9280 24400
12900
14900
13300
9560 7440
E % - - - 85.8 64.2 72.9 57.4 40.4 46.6 35.0 13.9 28.9 38.5 -61.6 14.6 1.3 11.9 36.7 50.7
E = -600 mV
I (mA/cm2) 4540 515 980 1180 1620 2270 1780 2239 3539 2390 2060 6470 3310 3780 3230 2090 2238
E % - - - 88.7 78.4 74.0 64.3 50.0 60.8 50.7 22.0 47.4 54.6 -42.5 27.1 16.7 28.8 54.0 50.7
E = -500 mV
I (mA/cm2) 1332 205 260 248 627 676 353 452 1153 442 514 2000 973 818 673 732 355
E % - - - 84.6 80.4 81.4 52.9 49.2 73.5 66.1 13.4 66.8 61.4 -50.1 26.9 38.6 49.5 45.0 73.3
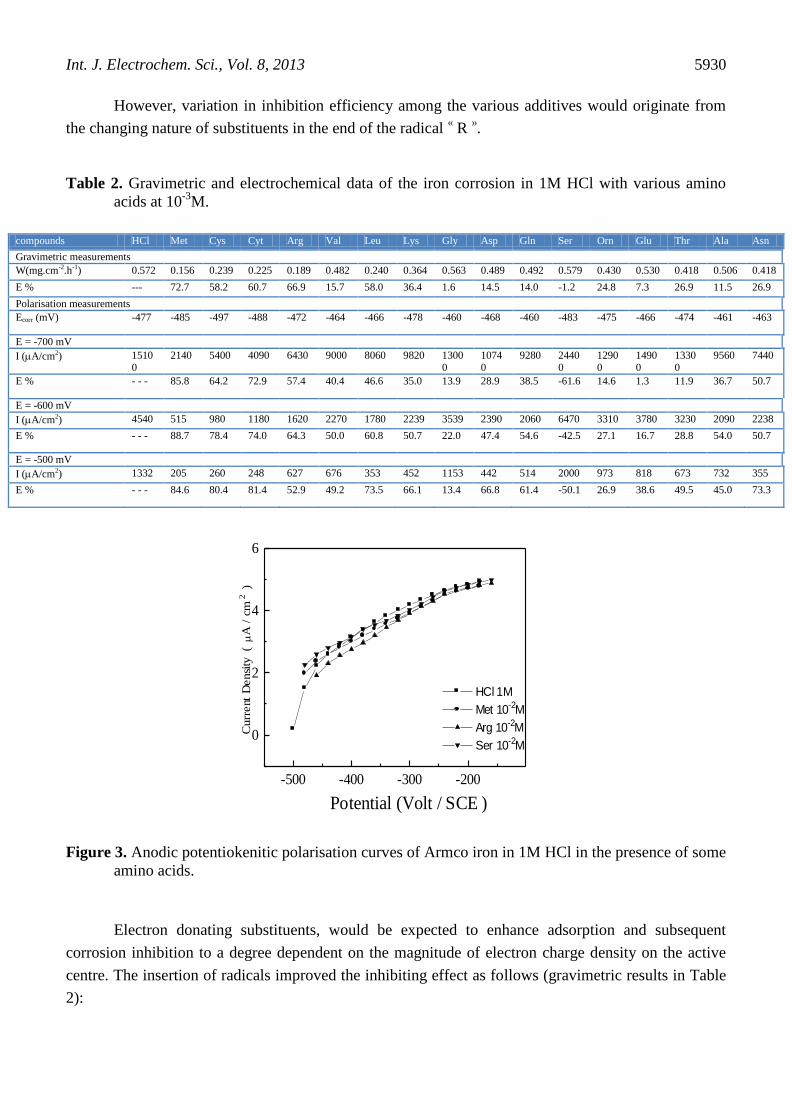
Figure 3. Anodic potentiokenitic polarisation curves of Armco iron in 1M HCl in the presence of some
amino acids.
Electron donating substituents, would be expected to enhance adsorption and subsequent
corrosion inhibition to a degree dependent on the magnitude of electron charge density on the active
centre. The insertion of radicals improved the inhibiting effect as follows (gravimetric results in Table
2):
-500 -400 -300 -200
0
2
4
6
HCl 1M
Met 10-2M
Arg 10-2M
Ser 10-2M
Curr
ent
Densi
ty (
mA
/ c
m 2
)
Potential (Volt / SCE )

Int. J. Electrochem. Sci., Vol. 8, 2013
5931
HS
CH3
CH3
CH C
O
NH2O
-C
O
H HO
Csy Leu Asn Asp Ala Ser
C
O
NH2O
-C
O
SCH3
Met Gln Glu
NH2C
NH2
NH
NH
Arg Orn
The inhibiting efficiency of the compounds depends on many factors which include the number
of adsorption actives centres in the molecule and their charge density, molecule size, mode of
adsorption and formation of metalic copmlex [26-28].
The essential effect of the corrosion inhibition is due to presence of electron donors groups (N,
O, S) in the molecular structure of amino acid tested. The presence of free electron pairs in the
nitrogen, sulphur atoms and electron on double bond favours the adsorption of the inhibitor.
Comparison of the experimental data given in Table 2 indicates that the inhibition efficiency of
compounds Ala, Leu, Asp, Asn and Lys is greater than that Gly, Val, Orn, Glu and Gln, respectively.
This behaviour is explained on the basis on the difference in the number of the carbon atoms in the
chaine of radical « R
». The inhibition efficiency changes with increasing number of CH2 group in
radical « R
» of the molecule.
We have two cases:
1°) If the substituent at the end of the radical « R
» is an electron donating substituent, then
inhibition efficiency increase with increasing number of CH2 group in radical « R
» of the molecule.
Ala > Gly ; Leu > Val ; Lys > Orn
2°) On the other hand, if the substituent is an acceptor substituent, then inhibition efficiency
decrease with increasing number of CH2 group in radical « R
» of the molecule.
Asp > Glu ; Asn > Gln
The addition of Ser to blank solutions increased the cathodic and anodic current densities
without shifting the corrosion potential. The negative E% values indicated that this compound
stimulated the corrosion process. This result indicated Ser had a catalytic effect on the proton
discharge and on iron dissolution.
Brandt et al [14]. reported that the sulphur atom is the active centre of the aliphatic sulphides in
their interaction with the metal surface. Therefore cysteine, cystine and methionine are adsorbed at the
metal surface through the sulphur active centre. To confirm this argument the effect of a sulphur-free
amino acid (alanine) on the corrosion of Armco iron in acid was studied.
Figure 4 shows the change in the degree of surface coverage as a function of the logarithm of
the concentration of Cys and Ala. Cys shows a stronger inhibiting effect than Ala. These results
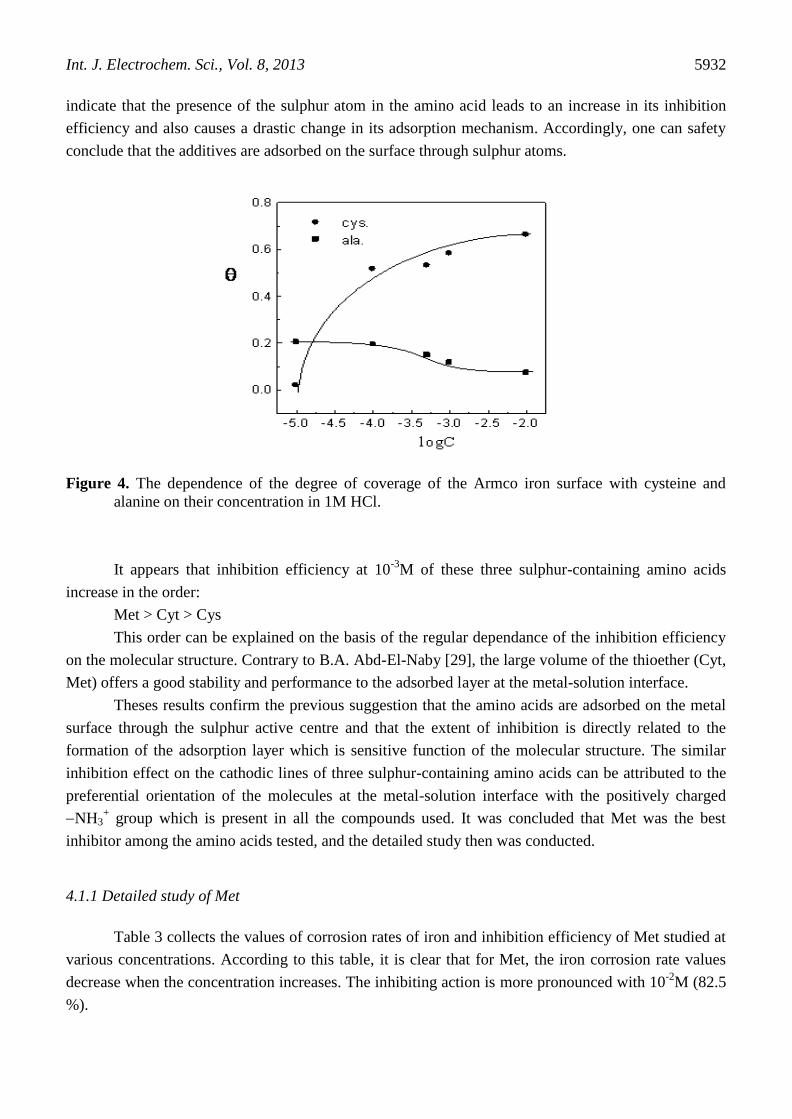
Int. J. Electrochem. Sci., Vol. 8, 2013
5932
indicate that the presence of the sulphur atom in the amino acid leads to an increase in its inhibition
efficiency and also causes a drastic change in its adsorption mechanism. Accordingly, one can safety
conclude that the additives are adsorbed on the surface through sulphur atoms.
Figure 4. The dependence of the degree of coverage of the Armco iron surface with cysteine and
alanine on their concentration in 1M HCl.
It appears that inhibition efficiency at 10-3
M of these three sulphur-containing amino acids
increase in the order:
Met > Cyt > Cys
This order can be explained on the basis of the regular dependance of the inhibition efficiency
on the molecular structure. Contrary to B.A. Abd-El-Naby [29], the large volume of the thioether (Cyt,
Met) offers a good stability and performance to the adsorbed layer at the metal-solution interface.
Theses results confirm the previous suggestion that the amino acids are adsorbed on the metal
surface through the sulphur active centre and that the extent of inhibition is directly related to the
formation of the adsorption layer which is sensitive function of the molecular structure. The similar
inhibition effect on the cathodic lines of three sulphur-containing amino acids can be attributed to the
preferential orientation of the molecules at the metal-solution interface with the positively charged
NH3+ group which is present in all the compounds used. It was concluded that Met was the best
inhibitor among the amino acids tested, and the detailed study then was conducted.
4.1.1 Detailed study of Met
Table 3 collects the values of corrosion rates of iron and inhibition efficiency of Met studied at
various concentrations. According to this table, it is clear that for Met, the iron corrosion rate values
decrease when the concentration increases. The inhibiting action is more pronounced with 10-2
M (82.5
%).
Int. J. Electrochem. Sci., Vol. 8, 2013
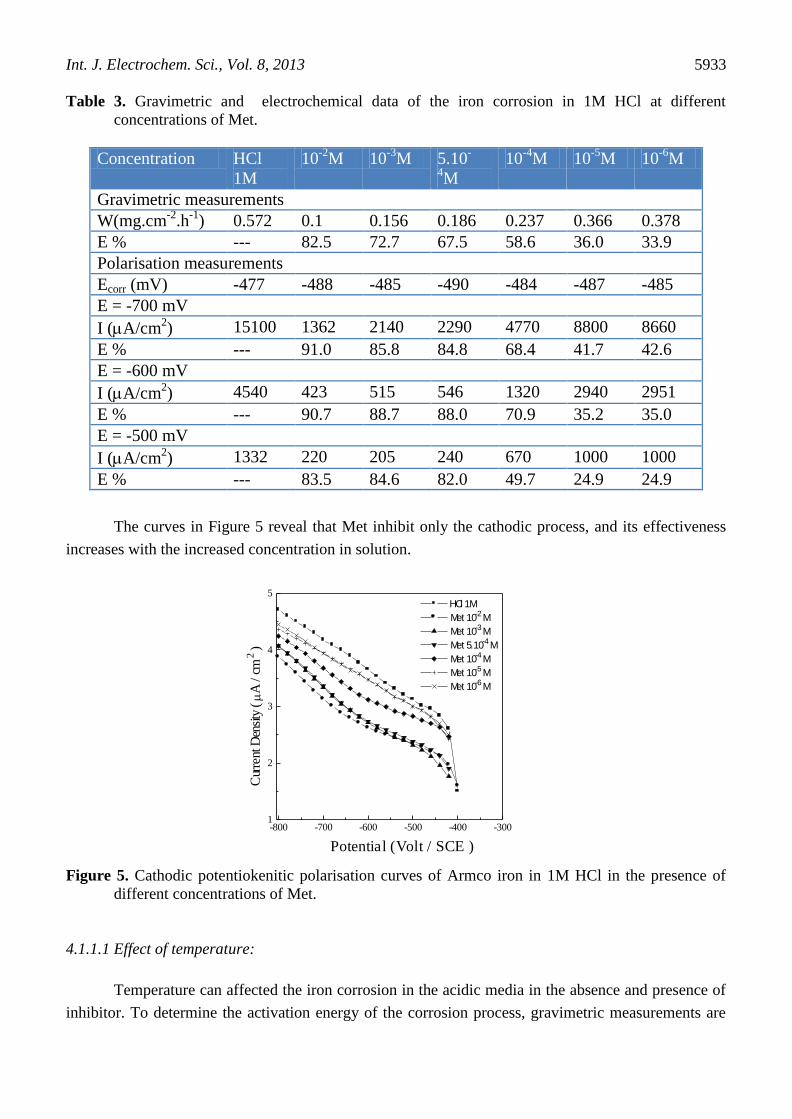
5933
Table 3. Gravimetric and electrochemical data of the iron corrosion in 1M HCl at different
concentrations of Met.
Concentration HCl
1M
10-2
M 10-3
M 5.10-
4M
10-4
M 10-5
M 10-6
M
Gravimetric measurements
W(mg.cm-2
.h-1
) 0.572 0.1 0.156 0.186 0.237 0.366 0.378
E % --- 82.5 72.7 67.5 58.6 36.0 33.9
Polarisation measurements
Ecorr (mV) -477 -488 -485 -490 -484 -487 -485
E = -700 mV
I (mA/cm2) 15100 1362 2140 2290 4770 8800 8660
E % --- 91.0 85.8 84.8 68.4 41.7 42.6
E = -600 mV
I (mA/cm2) 4540 423 515 546 1320 2940 2951
E % --- 90.7 88.7 88.0 70.9 35.2 35.0
E = -500 mV
I (mA/cm2) 1332 220 205 240 670 1000 1000
E % --- 83.5 84.6 82.0 49.7 24.9 24.9
The curves in Figure 5 reveal that Met inhibit only the cathodic process, and its effectiveness
increases with the increased concentration in solution.
Figure 5. Cathodic potentiokenitic polarisation curves of Armco iron in 1M HCl in the presence of
different concentrations of Met.
4.1.1.1 Effect of temperature:
Temperature can affected the iron corrosion in the acidic media in the absence and presence of
inhibitor. To determine the activation energy of the corrosion process, gravimetric measurements are
-800 -700 -600 -500 -400 -3001
2
3
4
5 HCl 1M
Met 10-2 M
Met 10-3 M
Met 5.10-4 M
Met 10-4 M
Met 10-5 M
Met 10-6 M
Cur
rent
Den
sity
( m
A /
cm
2 )
Potential (Volt / SCE )

Int. J. Electrochem. Sci., Vol. 8, 2013
5934
taken at various temperatures (308-353K) in the absence and presence of Met at 10-2
M. The
corresponding results are given in Table 4.
Although the weight-loss due to the corrosion increases with temperature, the inhibition
efficiency of Met was found to increase slightly with the rise in temperature from 308 to 333K (82.5 %
84.8 % ) and above 333K, the efficiency decrease and search 73.9% at 353K.
Figure 6 shows Arrhenius plots for iron corrosion. The apparent activation energies in the
absence (Ea) and presence (E’a) of Met can be determined by the relation:
W = K.exp(-Ea /RT) W’ = K.exp(-E’a /RT)
Ea = 83.4 kJ /mol E’a = 84.2 kJ /mol
We note the stabilities of the apparent activation energy in the presence of Met.
Table 4. Influence of temperature on the corrosion rate of Armco iron electrode immersed in 1M HCl
and in 1M HCl + 10-2
M of Met.
Temperature
(K)
Corrosion rate in
1M HCl (mg.cm-
2.h
-1)
Corrosion rate in 1M HCl +
10-2
M of Met (mg.cm-2
.h-1
)
Inhibition
efficiency
E%
308 0.572 0.100 82.5
313 0.900 0.128 85.8
323 2.031 0.294 85.5
333 4.704 0.714 84.8
343 12.975 3.653 71.8
353 34.576 9.037 73.9
Figure 6. Arrhenius plots calculated from corrosion rate in 1M HCl and in 1M HCl + 10-2
M of Met.
2.8 2.9 3.0 3.1 3.2 3.3
-2
0
2
4
HCl 1M
Met 10-2M
lnW
(m
g.c
m-2.h
-1 )
1000 / T (K-1)

Int. J. Electrochem. Sci., Vol. 8, 2013
5935
4.2 EIS measurements.
The EIS experiments give similar results (figure 7 and Table 5). The complex spectra exhibit
three less-than-half circles for three different concentrations of Met at Ecorr. The impedance plots
extrapolate at high frequencies to almost zero value for the solution resistance Rs between the Armco
iron electrode and the reference electrode.
An iron electrode dissolving in the active state in acid media shows impedance diagrams
similar to a semicircle in Nyquist plot [30-33], which corresponds to an electrochemical charge
transfer process. In our tests, in hydrochloric acid solution, the impedance diagram does not show
perfect semicircle and the imaginary part of the faradic impedance is zero even at very low frequency
values. This difference has been attributed to the frequency dispersion.
According to Frignani et al. [34, 35], in the presence of very corrosion efficient
derivatives the capacitive loop deviates from a semicircle, while in the presence of not very corrosion
efficient additives, the impedance diagram is rather similar to a perfect semicircle. In no case is a clear
inductive loop found, as happens in the presence of other types of organic additives [36-38]. In EIS
measurements, the inhibition efficiencies %EISE are calculated as follow:
'
% (1 ) 100tEIS
t
RE
R
tR and '
tR are the charge transfer resistance in absence and in presence of Met, respectively.
The values of the capacity associated with the different loop are calculated from the relation:
Cdl = 1/ 2fo tR
where Rt represents the diameters of different loops and fo is the frequency at tR /2.
Figure 7. Electrochemical galvanostatic impedance diagrams of the Armco iron electrode in 1M HCl
with various concentration of Met.
0 50 100 150 200 250
0
50
100
Met 10-2 M
Met 10- 4 M
HCL 1M
-Zim
( W
. c
m 2 )
Zre (W.cm2)

Int. J. Electrochem. Sci., Vol. 8, 2013
5936
Table 5. Impedance parameters for the corrosion of Armco iron in 1M HCl in the absence and in
presence of different concentrations of Met.
Concentration (M) Rt (W.cm2) fo (Hz) Cdl (mF/cm
2) E%
0 M 68 40 58 -
10-2
M 228 15.0 46.5 70.1
10-4
M 105 40.4 37.5 35.2
Figure 8. Electrochemical galvanostaic impedance diagrams of the Armco iron electrode in 1M HCl at
various potantials.
It is observed from Table 5 that the value of tR increases with the increase in the concentration
of the inhibitor at Ecorr. As impedance diagrams for solution examined have almost a semicircular
appearance, it indicates that the corrosion of Armco iron is mainly controlled by charge transfer
process. In fact, the presence of Met enhances the value of Rt in acidic solution. Values of double layer
capacitance are also brought down to the maximum extent in the presence of Met and the decrease in
the values of Cdl follows the order similar to that obtained for values of IEi in this study. The decrease
in Cdl may be due to the adsorption of inhibitor on the metal surface leading to the formation of a film
from acidic solution, similar results were also observed [50] for the case of adsorption of inhibitor or
especially for polymer coated metals, Cdl can become so small.
For all potentials (Figs. 8 and 9) the impedance diagrams present well defined capacitive loops
at high frequencies. Moreover, low frequencies inductive loops appear at anodic potentials proving an
active dissolution of the metal.
1.5 1.6 1.7 1.8 1.9 2.0 2.1 2.2-0.1
0.0
0.1
0.2
0.3
Zre (W.cm2)
E = -200 mV
-Zim
( W
.cm
2 )
0 2 4 6 8 10 12 14 16 18 20-2
0
2
4
6
8 E = -400 mV
1.4 1.6 1.8 2.0 2.2 2.4 2.6 2.8 3.0 3.2
-0.2
0.0
0.2
0.4
0.6
0.8 E = -300 mV
0 5 10 15 20
0
5
10
15
E = -700 mV
2.0 2.4 2.8 3.2 3.6 4.0
0.0
0.4
0.8 E = -800 mV
0 50 100 150 200 250
0
50
100 E = -500 mV
0 20 40 60 80 100
0
20
40 E = -600 mV
Int. J. Electrochem. Sci., Vol. 8, 2013
5937
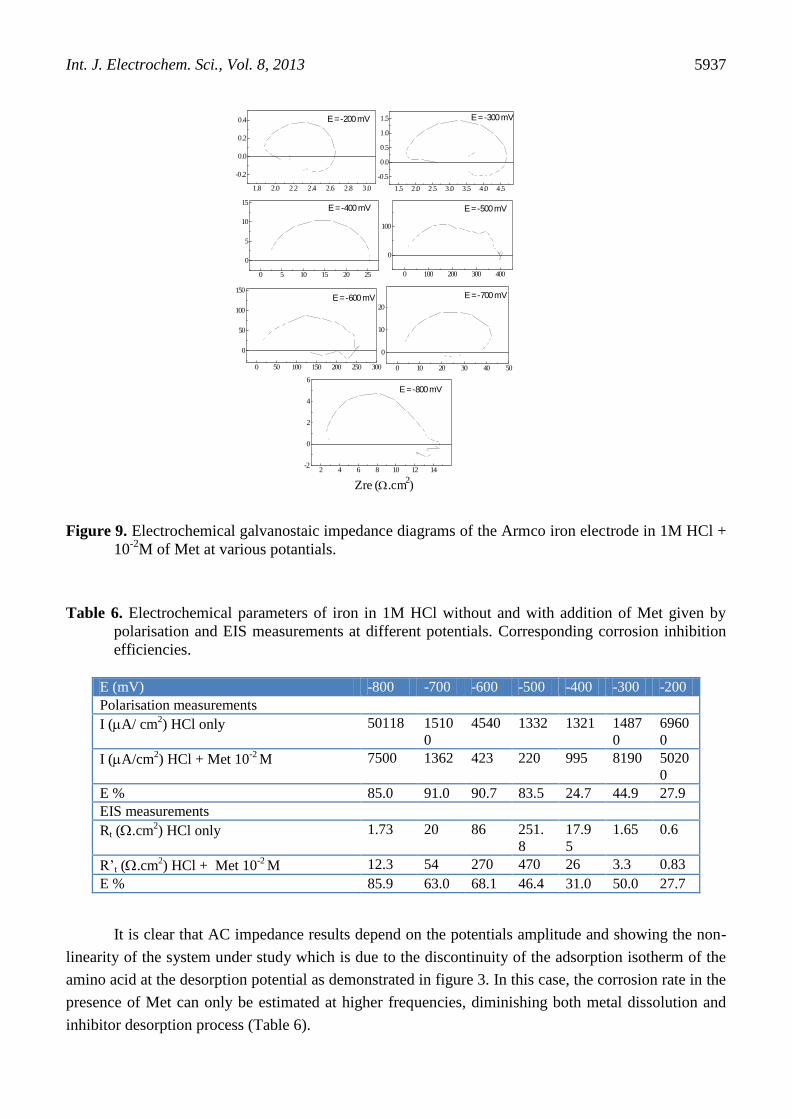
Figure 9. Electrochemical galvanostaic impedance diagrams of the Armco iron electrode in 1M HCl +
10-2
M of Met at various potantials.
Table 6. Electrochemical parameters of iron in 1M HCl without and with addition of Met given by
polarisation and EIS measurements at different potentials. Corresponding corrosion inhibition
efficiencies.
E (mV) -800 -700 -600 -500 -400 -300 -200
Polarisation measurements
I (mA/ cm2) HCl only 50118 1510
0
4540 1332 1321 1487
0
6960
0
I (mA/cm2) HCl + Met 10
-2 M 7500 1362 423 220 995 8190 5020
0
E % 85.0 91.0 90.7 83.5 24.7 44.9 27.9
EIS measurements
Rt (W.cm2) HCl only 1.73 20 86 251.
8
17.9
5
1.65 0.6
R’t (W.cm2) HCl + Met 10
-2 M 12.3 54 270 470 26 3.3 0.83
E % 85.9 63.0 68.1 46.4 31.0 50.0 27.7
It is clear that AC impedance results depend on the potentials amplitude and showing the non-
linearity of the system under study which is due to the discontinuity of the adsorption isotherm of the
amino acid at the desorption potential as demonstrated in figure 3. In this case, the corrosion rate in the
presence of Met can only be estimated at higher frequencies, diminishing both metal dissolution and
inhibitor desorption process (Table 6).
1.8 2.0 2.2 2.4 2.6 2.8 3.0
-0.2
0.0
0.2
0.4 E = -200 mV
1.5 2.0 2.5 3.0 3.5 4.0 4.5
-0.5
0.0
0.5
1.0
1.5 E = -300 mV
0 5 10 15 20 25
0
5
10
15E = -400 mV
0 100 200 300 400
0
100
E = -500 mV
0 50 100 150 200 250 300
0
50
100
150E = -600 mV
0 10 20 30 40 50
0
10
20
E = -700 mV
2 4 6 8 10 12 14-2
0
2
4
6
E = -800 mV
Zre (W.cm2)

Int. J. Electrochem. Sci., Vol. 8, 2013
5938
Nevertheless, the Tables 2-6 show that in the presence of various concentrations of Met no
evident differences are found in the inhibiting efficiency values obtained with the different methods.
The fraction of the surface covered by adsorbed molecules of the inhibitor () was determined
by the ratio E%/100. The relation E% and logC, where C is the amino acid concentration, had the
character of an S-shaped adsorbed isotherm (figure 10). This result showed that Met was adsorbed on
the iron surface electrode according to the Frumkin isotherm:
(1- )-1
exp(-f.C) = K.C.
where K is the equilibrium constant of the adsorption reaction, f is a function of adsorption
energy, and is the surface coverage.
Figure 10. Frumkin isotherm adsorption model of Met on the surface of Armco iron in 1M HCl
solution
Chemisorption plays an important role in the action mechanism of this additive. In point of fact
higher inhibiting efficiency values are experienced by increasing not only the surface coverage of the
amino acid, but also by increasing their electrons availability.
Moreover, a likely relationship is obtained between chemisorption and the deviation of the
capacitive loop from a perfect semicircle [36].
4.3 QSAR study
To understand the quantitative structure and activity relationships of the studied class of amino
acids and their inhibition efficiencies on iron corrosion in 1.0 M HCl, a statistical analysis using
genetic function approximation (GFA) method has been performed. A study table was belt and
presented in Table 7. Second, a correlation matrix, Table 8 was derived, and then regression
parameters were obtained. Table 7 shows the structural descriptors for the training set (the class of the
amino acids used in this study). It includes include total energy, HOMO , LUMO, energy gap (LUMO-
HOMO) and binding energy between the amino acid and the iron surface.
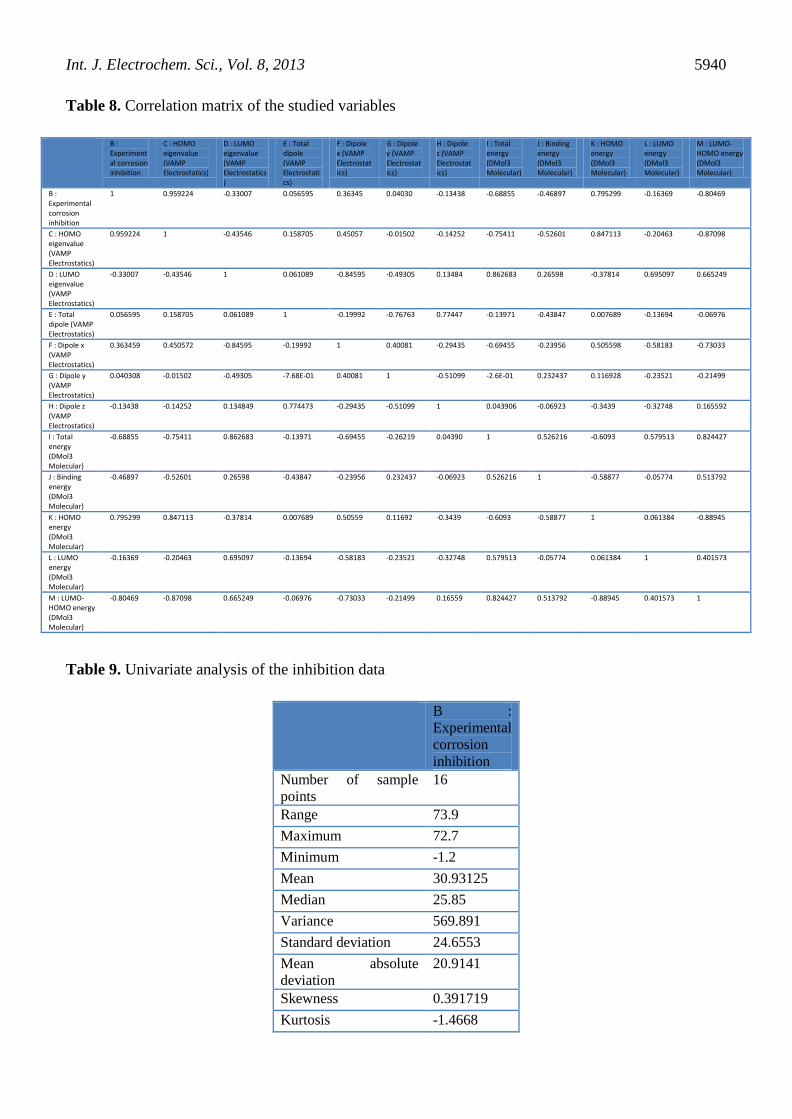
A univariate analysis is performed on the inhibition efficiency data in Table 9 as a tool to
assess the quality of the data available and its suitability for next statistical analysis. Data in Table 9
-5 -4 -3 -2 -1 0
-0.4
-0.2
0.0
0.2
0.4
log
(
/ 1
-
)
logC

Int. J. Electrochem. Sci., Vol. 8, 2013
5939
show acceptable normal distribution. Statistical parameters presented in Table 9 have been discussed
in details in our previous study [20].
Table 8 contains a correlation matrix which gives the correlation coefficients between each pair
of columns included in the analysis in Table 7. Correlation coefficients between a pair of columns
approaching +1.0 or -1.0 suggest that the two columns of data are not independent of each other. The
cells in the correlation matrix, Table 8 are colored according to the correlation value of in each cell.
Inspection of Table 8 shows that the descriptors most highly correlated with corrosion inhibition
efficiency include: LUMO energy , total dipole moment, total energy, binding energy and energy gap
of the inhibitor molecule. After constructing the correlation matrix the genetic function approximation
algorithm will be used to perform a regression analysis. The GFA algorithm works with a set of
strings, called a population. This population is evolved in a manner that leads it toward the objective of
the search. Following this, three operations are performed iteratively in succession: selection,
crossover, and mutation. Newly added members are scored according to a fitness criterion. In the GFA,
the scoring criteria for models are all related to the quality of the regression fit to the data. The
selection probabilities must be re-evaluated each time a new member is added to the population
[39].The procedure continues for a user-specified number of generations, unless convergence occurs in
the interim. Convergence is triggered by lack of progress in the highest and average scores of the
population.
Table 10 shows the GFA analysis which gives summary of the input parameters used for the
calculation. Also, it reports whether the GFA algorithm converged in specified number of generations.
The GFA algorithm is assumed to have converged when no improvement is seen in the score of the
population over a significant length of time, either that of the best model in each population or the
average of all the models in each population. When this criterion has been satisfied, no further
generations are calculated.
Table 7. Descriptors for the studied amino acids inhibitor molecules calculated using quantum
chemical methods
Experimental
corrosion
inhibition
HOMO eigenvalue
(VAMP Electrostatics)
LUMO eigenvalue
(VAMP Electrostatics)
Total dipole
(VAMP Electrostatics)
Total energy
(DMol3 Molecular)
Binding energy
(DMol3 Molecular)
HOMO energy
(DMol3 Molecular)
LUMO energy
(DMol3 Molecular)
LUMO-HOMO
energy (DMol3 Molecular)
11.5 -10.3589 -0.40431 4.199 -321.111 -2.19048 -0.20824 -0.12033 0.087908
66.9 -8.37501 -0.43918 6.944 -601.475 -4.41508 -0.16743 -0.11647 0.05096
26.9 -9.98429 -0.5164 3.329 -488.491 -2.9702 -0.1911 -0.11844 0.072663
14.5 -10.3697 -0.84148 1.942 -508.265 -2.8307 -0.1902 -0.12584 0.064359
58.2 -8.9818 -0.76803 1.772 -717.964 -2.29689 -0.19374 -0.1298 0.063947
60.7 -8.46022 -2.33617 4.296 -1.43E+03 -4.40306 -0.17321 -0.13414 3.91E-02
7.3 -10.6179 -0.67916 7.863 -547.194 -3.33906 -0.21803 -0.13424 0.083789
14 -9.91646 -0.45563 8.049 -527.421 -3.47946 -0.19654 -0.12097 0.075566
1.6 -10.6003 -0.56603 2.125 -282.168 -1.66767 -0.20397 -0.11707 0.086905
18 -10.3111 -0.31439 3.576 -437.962 -3.77893 -0.20718 -0.11253 0.094649
36.4 -9.86675 -0.36782 2.956 -492.87 -4.07566 -0.1845 -0.11386 0.070636
72.7 -8.63782 -0.39101 5.459 -795.864 -3.35085 -0.18227 -0.12079 0.061477
24.8 -9.92098 -0.33094 2.661 -453.924 -3.55101 -0.19024 -0.11376 0.076473
27.2 -10.2768 -0.51608 2.597 -395.822 -2.37681 -0.20643 -0.12397 0.082461
16.9 -10.4808 -0.33151 5.453 -434.763 -2.89764 -0.20207 -0.11552 0.086548
15.7 -10.2822 -0.40849 4.061 -399.006 -3.24319 -0.20708 -0.12169 0.085388
Int. J. Electrochem. Sci., Vol. 8, 2013
5940
Table 8. Correlation matrix of the studied variables
B :
Experimental corrosion inhibition
C : HOMO eigenvalue (VAMP Electrostatics)
D : LUMO eigenvalue (VAMP Electrostatics)
E : Total dipole (VAMP Electrostatics)
F : Dipole x (VAMP Electrostatics)
G : Dipole y (VAMP Electrostatics)
H : Dipole z (VAMP Electrostatics)
I : Total energy (DMol3 Molecular)
J : Binding energy (DMol3 Molecular)
K : HOMO energy (DMol3 Molecular)
L : LUMO energy (DMol3 Molecular)
M : LUMO-HOMO energy (DMol3 Molecular)
B : Experimental corrosion inhibition
1 0.959224 -0.33007 0.056595 0.36345 0.04030 -0.13438 -0.68855 -0.46897 0.795299 -0.16369 -0.80469
C : HOMO eigenvalue (VAMP Electrostatics)
0.959224 1 -0.43546 0.158705 0.45057 -0.01502 -0.14252 -0.75411 -0.52601 0.847113 -0.20463 -0.87098
D : LUMO eigenvalue (VAMP Electrostatics)
-0.33007 -0.43546 1 0.061089 -0.84595 -0.49305 0.13484 0.862683 0.26598 -0.37814 0.695097 0.665249
E : Total dipole (VAMP Electrostatics)
0.056595 0.158705 0.061089 1 -0.19992 -0.76763 0.77447 -0.13971 -0.43847 0.007689 -0.13694 -0.06976
F : Dipole x (VAMP Electrostatics)
0.363459 0.450572 -0.84595 -0.19992 1 0.40081 -0.29435 -0.69455 -0.23956 0.505598 -0.58183 -0.73033
G : Dipole y (VAMP Electrostatics)
0.040308 -0.01502 -0.49305 -7.68E-01 0.40081 1 -0.51099 -2.6E-01 0.232437 0.116928 -0.23521 -0.21499
H : Dipole z (VAMP Electrostatics)
-0.13438 -0.14252 0.134849 0.774473 -0.29435 -0.51099 1 0.043906 -0.06923 -0.3439 -0.32748 0.165592
I : Total energy (DMol3 Molecular)
-0.68855 -0.75411 0.862683 -0.13971 -0.69455 -0.26219 0.04390 1 0.526216 -0.6093 0.579513 0.824427
J : Binding energy (DMol3 Molecular)
-0.46897 -0.52601 0.26598 -0.43847 -0.23956 0.232437 -0.06923 0.526216 1 -0.58877 -0.05774 0.513792
K : HOMO energy (DMol3 Molecular)
0.795299 0.847113 -0.37814 0.007689 0.50559 0.11692 -0.3439 -0.6093 -0.58877 1 0.061384 -0.88945
L : LUMO energy (DMol3 Molecular)
-0.16369 -0.20463 0.695097 -0.13694 -0.58183 -0.23521 -0.32748 0.579513 -0.05774 0.061384 1 0.401573
M : LUMO-HOMO energy (DMol3 Molecular)
-0.80469 -0.87098 0.665249 -0.06976 -0.73033 -0.21499 0.16559 0.824427 0.513792 -0.88945 0.401573 1
Table 9. Univariate analysis of the inhibition data
B :
Experimental
corrosion
inhibition
Number of sample
points
16
Range 73.9
Maximum 72.7
Minimum -1.2
Mean 30.93125
Median 25.85
Variance 569.891
Standard deviation 24.6553
Mean absolute
deviation
20.9141
Skewness 0.391719
Kurtosis -1.4668

Int. J. Electrochem. Sci., Vol. 8, 2013
5941
Table 10. Validation Table of the Genetic Function Approximation
Predicted Inhibition Efficiency = 32.5 (HOMO) - 1.3 (Total dipole)
+ 0.002 (Total energy) - 0.686 (Binding energy)
+ 225.36 (LUMO-HOMO)
Friedman LOF 102422101122
R-squared 2439053922
Adjusted R-squared 2432952322
Cross validated R-squared 2432325122
Significant Regression Yes
Significance-of-regression F-value 13425529222
Critical SOR F-value (95%) 9491021022
The Friedman's lack-of-fit (LOF) score in Table 10 evaluates the QSAR model. The lower the
LOF, the less likely it is that GFA model will fit the data. The significant regression is given by F-test,
and the higher the value, the better the model.
Figure 11 shows the relationship between the measured corrosion inhibition efficiencies of the
studied inhibitors presented in Table 6 and the predicted efficiencies calculated by the following
equation:
Predicted Inhibition Efficiency = 32.5 (HOMO) - 1.3 (Total dipole)
+ 0.002 (Total energy) - 0.686 (Binding energy)
+ 225.36 (LUMO-HOMO)
The distribution of the residual values against the measured corrosion inhibition efficiencies
values are presented in Fig. 11. The residual values can be defined as the difference between the
predicted value generated by the model and the measured values of corrosion inhibition efficiencies.
Figure 11. Plot of predicted inhibition and residuals versus measured corrosion inhibition
Int. J. Electrochem. Sci., Vol. 8, 2013
5942
5. CONCLUSION
Steady-state electrochemical measurements have shown that all amino acids tested act as
cathodic inhibitors. Met, Cys and Cyt who have a sulphur atom in their molecular structure are the best
inhibitors and they are adsorbed at the metal surface through the sulphur active centre. Met was the
best inhibitor in the serie tested and its inhibition efficiency increases with its concentration . The
corrosion inhibition by methionine is interpreted by assuming that it simply blocked a fraction of the
electrode surface where the adsorption of inhibitor species take place according to a Frumkin isotherm
model on the iron surface. Inhibition efficiency was found to increase slightly with the rise in
temperature from 308 to 333K. The computational method has proved satisfactory for the inhibition
efficiency estimations. High correlation was obtained with the multivariate correlation, i.e. all the
indices combined together, where the prediction power was very high for GFA. Although GFA proved
to be efficient in predicting ability, more work is still required toward understanding structure-property
correlation on inhibition corrosion studies, particularly concerning the analysis of different structural
chemical descriptors.
References
1. K. Khaled, N. Abdel-Shafi, N. Al-Mobarak, Int. J. Electrochem. Sci, 7 (2012) 1027-1044.
2. O.L. Riggs, J.K. Morrison, D.A. Brunsel, Corrosion, 35 (1976) 356.
3. D. Eaves, G. Williams, H.N. McMurray, Electrochim. Acta, 79 (2012) 1-7.
4. D. Kesavan, M.M. Tamizh, M. Gopiraman, N. Sulochana, R. Karvembu, J Surfactants Deterg, 15
(2012) 567-576.
5. A. Sudheer, M.A. Quraishi, E.E. Ebenso, M. Natesan, Int. J. Electrochem. Sci, 7 (2012) 7463-
7475.
6. J. Jose Santana, M. Paehler, W. Schuhmann, R.M. Souto, Chempluschem, 77 (2012) 707-712.
7. A. Aytac, S. Bilgic, G. Gece, N. Ancin, S.G. Oztas, Mater Corros, 63 (2012) 729-734.
8. G.-h. Chen, J.-m. Zhao, Chem Res Chinese U, 28 (2012) 691-695.
9. A. Chetouani, K. Medjahed, S.S. Al-Deyab, B. Hammouti, I. Warad, A. Mansri, A. Aouniti, Int. J.
Electrochem. Sci, 7 (2012) 6025-6043.
10. A.S. Fouda, M. Abdallah, I.S. Ahmed, M. Eissa, Arab. J. Chem., 5 (2012) 297-307.
11. B.M. Mistry, N.S. Patel, S. Sahoo, S. Jauhari, Bull. Mater. Sci., 35 (2012) 459-469.
12. V.P. Grigor’ev, V.V. Kuznetsov, I. Vyssh, U. Zaved, Khim. Khim. Tekhnol, 11 (1968) 1237.
13. I.M. Issa, A.A. El-Samahy, Y.M. Temerk, J. Chem. U.A.R., 13 (1970) 121.
14. H. Brandt, M. Fischer, K. Schwab, Corros. Sci., 10 (1970) 631.
15. M. Ozcan, F. Karadag, I. Dehri, Colloid Surf.A, 316 (2008) 55-61.
16. G. Bereket, C. Ogretir, C. Ozsahin, J Mol Struc-Theochem, 663 (2003) 39-46.
17. Q. Zhao, Y. Liu, E.W. Abel, Appl. Surf. Sci., 240 (2005) 441-451.
18. C. Öğretir, B. Mihçi, G. Bereket, J Mol Struc-Theochem, 488 (1999) 223-231.
19. K. Khaled, N. Al-Mobarak, Int. J. Electrochem. Sci, 7 (2012) 1045-1059.
20. K.F. Khaled, Corros. Sci., 53 (2011) 3457-3465.
21. J.R. Mohallem, T. de O. Coura, L.G. Diniz, G. de Castro, . Assafr o, T. Heine, J. Phys. Chem. A,
112 (2008) 8896-8901.
22. J.A. Ciezak, S.F. Trevino, J. Phys. Chem. A, 110 (2006) 5149-5155.
23. J. Zhang, G. Qiao, S. Hu, Y. Yan, Z. Ren, L. Yu, Corros. Sci., 53 (2011) 147-152.
24. M.W. Wong, M.J. Frisch, K.B. Wiberg, J. Am. Chem. Soc., 113 (1991) 4776-4782.
25. K. Khaled, N. Abdel-Shafi, Int. J. Electrochem. Sci, 6 (2011) 4077-4094.

Int. J. Electrochem. Sci., Vol. 8, 2013
5943
26. A. Aouniti, B. Hammouti, M. Brighli, S. Kertit, F. Berhili, S. El-Kadiri, A. Ramdani., J. Chim.
Phy, 93 (1996) 1262.
27. A.S. Fouda, M.N. Moussa, F.I. Taha, A.I. Elneanaa, Corros. Sci., 26 (1986) 719-726.
28. N.A.F. Al-Rawashdeh, A.K. Maayta, Anti-Corros Method M., 52 (2005) 160-166.
29. B.A. Abd-El-Nabey, N. Khalil, A. Mohamed, Surface Technology, 24 (1985) 383-389.
30. S.S.A. El-Rehim, M.A.M. Ibrahim, K.F. Khaled, J. Appl. Electrochem., 29 (1999) 593-599.
31. K.F. Khaled, Electrochim. Acta, 48 (2003) 2493-2503.
32. K. Khaled, N. Hackerman, Electrochim. Acta, 48 (2003) 2715-2723.
33. K. Khaled, N. Hackerman, Mater. Chem. Phys., 82 (2003) 949-960.
34. A. Frignani, M. Tassinari, C. Monticelli, G. Trabanelli, Corros. Sci., 27 (1987) 75-81.
35. A. Frignani, C. Monticelli, G. Brunoro, G. Trabanelli, Proc. Proceeding of 6th European
Symposium on Corrosion Inhibitors, Ann, Univ, Ferrara,, 1985.
36. W.J. Lorenz, F. Mansfeld, Corros. Sci., 21 (1981) 647-672.
37. I. Epelboin, M. Keddam, Electrochim. Acta, 17 (1972) 177-186.
38. I. Epelboin, C. Gabrielli, M. Keddam, Corros. Sci., 15 (1975) 155-171.
39. Accelrys Materials Studio 6.0 Manual, (2011).
© 2013 by ESG (www.electrochemsci.org)