corrections on the specimen volume change and axial force...
TRANSCRIPT
Corrections on the
specimen volume change and axial force
in the Wykeham Farrance
WF11001/SN:100257-9 triaxial cell
Georgopoulos Ioannis-Orestis1
Vardoulakis Ioannis2
15th December 2005
1PhD Student, NTU Athens, Greece2Professor, NTU Athens, Greece

2
Contents
1 Introduction 11
2 Cell volume change corrections 132.1 Volume change due to water compressibility, ∆Vwater . . . . . 152.2 Volume change due to piston movement, ∆Vpiston . . . . . . . 152.3 Volume change due to nylon flexible pipe expansion, ∆Vpipe . 162.4 Volume change due to triaxial cell expansion, ∆Vcell . . . . . 25
3 Specimen volume change corrections 353.1 Specimen section area . . . . . . . . . . . . . . . . . . . . . . 353.2 Membrane penetration effect . . . . . . . . . . . . . . . . . . 36
4 Axial load corrections 414.1 Standard bush . . . . . . . . . . . . . . . . . . . . . . . . . . 414.2 Rotating bush . . . . . . . . . . . . . . . . . . . . . . . . . . . 514.3 Submersible load cell . . . . . . . . . . . . . . . . . . . . . . . 51
5 Conclusions 55
3

4 CONTENTS

List of Figures
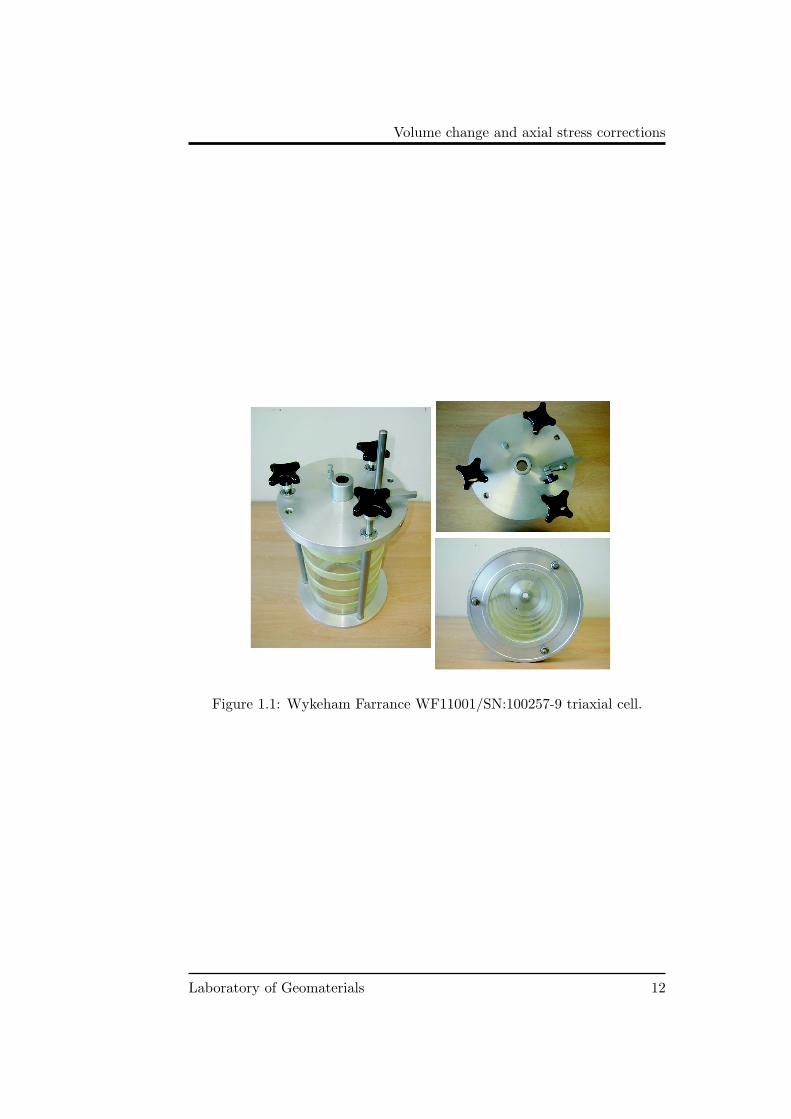
1.1 Wykeham Farrance WF11001/SN:100257-9 triaxial cell. . . . 12
2.1 Representation of factors which influence cell volume changemeasurements: (a) components due to specimen, (b) effectsduring saturation and consolidation stages, (c) effect of pistonpenetration during compression ([6]). . . . . . . . . . . . . . . 14
2.2 Automatic volume change apparatus calibration, 2005-03-02. 172.3 Automatic volume change apparatus calibration, 2005-03-07. 172.4 Automatic volume change apparatus calibration, 2005-12-05-
load. . . . . . . . . . . . . . . . . . . . . . . . . . . . . . . . . 182.5 Automatic volume change apparatus calibration, 2005-12-05-
unload. . . . . . . . . . . . . . . . . . . . . . . . . . . . . . . 182.6 Automatic volume change apparatus calibration, 2005-12-09. 192.7 Automatic volume change apparatus calibration, 2005-12-09-
load. . . . . . . . . . . . . . . . . . . . . . . . . . . . . . . . . 192.8 Automatic volume change apparatus calibration, 2005-12-09-
unload. . . . . . . . . . . . . . . . . . . . . . . . . . . . . . . 202.9 Automatic volume change apparatus calibration @ 100kPa,
2005-12-12. . . . . . . . . . . . . . . . . . . . . . . . . . . . . 202.10 Automatic volume change apparatus calibration @ 200kPa,
2005-12-12. . . . . . . . . . . . . . . . . . . . . . . . . . . . . 212.11 Automatic volume change apparatus calibration @ 300kPa,
2005-12-12. . . . . . . . . . . . . . . . . . . . . . . . . . . . . 212.12 Automatic volume change apparatus calibration @ 400kPa,
2005-12-12. . . . . . . . . . . . . . . . . . . . . . . . . . . . . 222.13 Automatic volume change apparatus calibration @ 500kPa,
2005-12-12. . . . . . . . . . . . . . . . . . . . . . . . . . . . . 222.14 Automatic volume change apparatus calibration @ 600kPa,
2005-12-12. . . . . . . . . . . . . . . . . . . . . . . . . . . . . 232.15 Calibration of nylon flexible pipe expansion, 2005-11-15. . . . 242.16 Calibration of nylon flexible pipe with de-aired water expan-
sion, 2005-11-15. . . . . . . . . . . . . . . . . . . . . . . . . . 24
5

6 LIST OF FIGURES
2.17 Typical curve of volume change of a triaxial chamber versuscell pressure (Head, K.H., 1986). . . . . . . . . . . . . . . . . 26
2.18 Section and side/top view of the WF11001/SN:100257-9 tri-axial cell. . . . . . . . . . . . . . . . . . . . . . . . . . . . . . 27
2.19 WF11001/SN:100257-9 triaxial cell calibration. . . . . . . . . 292.20 WF11001/SN:100257-9 triaxial cell calibration, 2005-12-12-b. 292.21 WF11001/SN:100257-9 triaxial cell calibration, 2005-12-12-c. 302.22 WF11001/SN:100257-9 triaxial cell calibration, 2005-12-14-a. 302.23 WF11001/SN:100257-9 triaxial cell calibration, 2005-12-14-b. 312.24 WF11001/SN:100257-9 triaxial cell calibration, 2005-12-14-c. 312.25 WF11001/SN:100257-9 triaxial cell calibration, 2005-12-14-d. 32
3.1 Specimen section area due to barreling . . . . . . . . . . . . . 373.2 Membrane penetration effect (after K.H. Head [6]) . . . . . . 383.3 Membrane penetration error in a typical triaxial test . . . . . 393.4 Membrane penetration error as a function of the volumetric
strain in an isotropic consolidation test. . . . . . . . . . . . . 39
4.1 The error in axial load measurement due to ram friction: vari-ation with axial strain in a typical test on a 4-in. diametersample ([3]). . . . . . . . . . . . . . . . . . . . . . . . . . . . . 42
4.2 WF11001/SN:100257-9 triaxial cell bush friction, calibration2005-03-12-loading . . . . . . . . . . . . . . . . . . . . . . . . 42
4.3 WF11001/SN:100257-9 triaxial cell bush friction, calibration2005-03-12-unloading . . . . . . . . . . . . . . . . . . . . . . . 43
4.4 WF11001/SN:100257-9 triaxial cell bush friction @ 0kPa, cal-ibration 2005-12-14-loading . . . . . . . . . . . . . . . . . . . 43
4.5 WF11001/SN:100257-9 triaxial cell bush friction @ 0kPa, cal-ibration 2005-12-14-unloading . . . . . . . . . . . . . . . . . . 44
4.6 WF11001/SN:100257-9 triaxial cell bush friction @ 20kPa,calibration 2005-12-12-loading . . . . . . . . . . . . . . . . . . 44
4.7 WF11001/SN:100257-9 triaxial cell bush friction @ 20kPa,calibration 2005-12-12-unloading . . . . . . . . . . . . . . . . 45
4.8 WF11001/SN:100257-9 triaxial cell bush friction @ 100kPa,calibration 2005-12-12-loading . . . . . . . . . . . . . . . . . . 45
4.9 WF11001/SN:100257-9 triaxial cell bush friction @ 100kPa,calibration 2005-12-12-unloading . . . . . . . . . . . . . . . . 46
4.10 WF11001/SN:100257-9 triaxial cell bush friction @ 200kPa,calibration 2005-12-12-loading . . . . . . . . . . . . . . . . . . 46
4.11 WF11001/SN:100257-9 triaxial cell bush friction @ 200kPa,calibration 2005-12-12-unloading . . . . . . . . . . . . . . . . 47
4.12 WF11001/SN:100257-9 triaxial cell bush friction @ 300kPa,calibration 2005-12-12-loading . . . . . . . . . . . . . . . . . . 47

LIST OF FIGURES 7
4.13 WF11001/SN:100257-9 triaxial cell bush friction @ 300kPa,calibration 2005-12-12-unloading . . . . . . . . . . . . . . . . 48
4.14 WF11001/SN:100257-9 triaxial cell bush friction @ 400kPa,calibration 2005-12-12-loading . . . . . . . . . . . . . . . . . . 48
4.15 WF11001/SN:100257-9 triaxial cell bush friction @ 400kPa,calibration 2005-12-12-unloading . . . . . . . . . . . . . . . . 49
4.16 WF11001/SN:100257-9 triaxial cell bush friction @ 500kPa,calibration 2005-12-12-loading . . . . . . . . . . . . . . . . . . 49
4.17 WF11001/SN:100257-9 triaxial cell bush friction @ 500kPa,calibration 2005-12-12-unloading . . . . . . . . . . . . . . . . 50
4.18 WF11001/SN:100257-9 triaxial cell bush friction @ 600kPa,calibration 2005-12-12-loading . . . . . . . . . . . . . . . . . . 50
4.19 WF11001/SN:100257-9 triaxial cell bush friction @ 600kPa,calibration 2005-12-12-unloading . . . . . . . . . . . . . . . . 51
4.20 Wykeham Farrance STALC3-50kN triaxial submersible loadcell . . . . . . . . . . . . . . . . . . . . . . . . . . . . . . . . . 52
4.21 DBBSE-50kN-A2242 external load cell (Applied Ltd) . . . . . 53

8 LIST OF FIGURES

List of Tables
2.1 Area A of WF17044/SN:107584-7 and VJT310/SN:0134 au-tomatic volume change apparatus piston calibration table. . . 16
2.2 Logarithmic law parameters for nylon flexible pipe (filled withde-aired water) 6/8mm calibration. . . . . . . . . . . . . . . . 25
2.3 Logarithmic-linear law parameters for WF11001/SN:100257-9 triaxial cell calibration. . . . . . . . . . . . . . . . . . . . . 32
4.1 WF11001/SN:100257-9 triaxial cell bush friction coefficient µcalibration. . . . . . . . . . . . . . . . . . . . . . . . . . . . . 52
9

10 LIST OF TABLES

Chapter 1
Introduction
In this report the Wykeham Farrance triaxial cell WF11001/SN:100257-9calibration is presented in detail. The main purpose of the calibration isto allow for estimation of precise volume change of specimens, when noon-sample transducers are available or when partially saturated granularmedia are considered. In these cases, no direct specimen volume changemeasurement can be performed, thus leading to indirect estimation of thevolumetric strain.
The WF11001/SN:100257-9 is a triaxial cell (Ph. 1.1), which may hostspecimens of diameter up to 105mm and is equipped with a submersibleload cell STALC3-50kN, adjusted to its piston. The maximum cell pressureis 1700kPa. More information concerning the triaxial cell can be found inthe internal report The Handbook of Wykeham Farrance GeoTriax.
11
Volume change and axial stress corrections
Figure 1.1: Wykeham Farrance WF11001/SN:100257-9 triaxial cell.
Laboratory of Geomaterials 12
Chapter 2
Cell volume changecorrections
In pp.164 of Manual of soil laboratory testing, Vol.3, K.H.Head states: “Mea-surements of the volume change on the cell pressure line require several cor-rections and are consequently less accurate than volume change measure-ments made in the back pressure system. Cell volume change measurementsare not required in the test procedures specified in BS 1377:Part 8:1990.However, the movement of water into or out of a partially saturated soilfrom the back pressure system is not a true measurement of the specimenvolume change, and for some soils (e.g.) expansive clays independent mea-surements based on changes in the cell line are necessary. Factors whichaffect the movement of water into or out of the cell, and which must there-fore be taken into account in the cell line volume change measurements, areas follows. These factors are represented diagrammatically in Figure 2.1where they are numbered as above.”
1. Irregularities on specimen surface
2. Air trapped between specimen and rubber membrane and side drains(if fitted)
3. Expansion of cell due to pressure increase
4. Continued expansion of cell (creep) with time under constant pressure
5. Absorbtion of water into, and mitigation through, cell body
6. Air trapped at top cell
7. Leakage of water
- through piston bushing
- through membrane and bindings
13

Volume change and axial stress corrections
Figure 2.1: Representation of factors which influence cell volume changemeasurements: (a) components due to specimen, (b) effects during satura-tion and consolidation stages, (c) effect of piston penetration during com-pression ([6]).
- from connecting lines and valves
8. Voids in specimen
9. Change in specimen due to drainage of water (consolidation or swelling)
10. Movement of piston
Following Head’s suggestions, the main purpose of the triaxial cell vol-ume calibration is to allow the user to estimate with good accuracy thespecimen volume change, when no on-sample transducers are available, orwhen the automatic volume change apparatus cannot be used, due to par-tially saturated or dry soil. In such cases, it is quite common that theWF17044/SN:107584-7 automatic volume change apparatus is connected tothe cell pressure line (Port 1 or 3) instead of being connected directly to thepore pressure lines (Port 2 or 4). By this way, the automatic volume changeapparatus is able to measure the volume of water entering of coming outfrom the triaxial cell during a test. The measurement of the apparatus isconsidered to be less accurate, as it contains several errors that have to bewithdrawn. These are:
Laboratory of Geomaterials 14

Volume change and axial stress corrections
1. Volume change due to water compressibility, ∆Vw
2. Volume change due to piston movement, ∆Vpiston
3. Volume change due to flexible pipe expansion, ∆Vpipe
4. Volume change due to triaxial cell expansion, ∆Vcell
In the following sections each one of the four corrections will be criticallydiscussed and estimated.
2.1 Volume change due to water compressibility,∆Vwater
Although water is much less incompressible than air, it still remains a com-pressible medium. Water compressibility cw depends much on the existenceof dissolved air in its mass. In the case of de-aired water, the de-aired watercompressibility takes the value of
cw0 = 4.93 · 10−7/kPa (2.1)
Should a volume of de-aired water Vw sustain an increase in pressure∆σc, the water volume decrease is calculated from eq.2.2
∆Vw = cw0 ·∆σc · Vw (2.2)
2.2 Volume change due to piston movement, ∆Vpiston
This correction applies to the volume of water displaced or inserted by theloading ram movement, during a triaxial compression or extension test. Thevolume of water is equal to the volume of the loading ram entering or comingout of the triaxial cell,
∆Vpiston =πd 2
piston
4∆h (2.3)
where dpiston is the diameter of the loading ram (= 25.1mm) and ∆h is therelative movement of the piston to the triaxial cell.
The volume of water displaced by the loading ram in a triaxial compres-sion test must be equal to the volume of water measured by the two auto-matic volume change apparatus (WF & VJT), connected to the WF11001/SN:100257-9 triaxial cell. The water of the cell is allowed to come out orenter the triaxial cell under pressure (cell pressure σc). In this way bothautomatic volume change apparatus are calibrated and the results are givenin Table 2.1. The WF17044/SN:107584-7 and VJT310/SN:0134 automatic
Laboratory of Geomaterials 15

Volume change and axial stress corrections
Vol.ch.app. WF17044/SN:107584-7 VJT310/SN:0134 CellDispl.trans. LSC-HS25-9016 LSC-HS25-12071 pressure
Date AWF (mm2) AV JT (mm2) σc(kPa)2005-03-02 4264 − 712.62005-03-07 4234 − 199.62005-12-05-load. − 4247 202.82005-12-05-unload. − 4209 200.42005-12-09 4182 4273 402.92005-12-09a-load. 4147 4298 204.12005-12-09a-unload. 4193 4311 198.02005-12-12 @ 100kPa 4181 4275 97.92005-12-12 @ 200kPa 4140 4268 203.52005-12-12 @ 300kPa 4143 4246 304.52005-12-12 @ 400kPa 4151 4242 402.92005-12-12 @ 500kPa 4160 4245 506.72005-12-12 @ 600kPa 4176 4257 607.3
Table 2.1: Area A of WF17044/SN:107584-7 and VJT310/SN:0134 auto-matic volume change apparatus piston calibration table.
volume change apparatus are connected to the cell pressure line. Calibra-tion tests were performed under various cell pressures σc and the area ofthe internal piston for both apparatus was estimated. From Table 2.1 thepropose the following calibration parameters for the WF & VJT automaticvolume change apparatus,
A (mm2) ={
4164 , WF4261 , V JT
2.3 Volume change due to nylon flexible pipe ex-pansion, ∆Vpipe
One correction that should also be taken into account is the expansion ofthe flexible pipes, connecting the automatic volume change apparatus withthe cell/pore pressure line and the air/water cylinders. Nylon flexible pipesof internal/external diameter (6/8) are used for this reason. They offerrelatively high flexibility while their compressibility is rather low.
Calibration tests up to 1200kPa in a 3170mm long flexible nylon pipewere performed in order to estimate the compressibility. The total volumechange of the flexible pipe filled with de-aired water is given from eq. 2.4
Laboratory of Geomaterials 16

Volume change and axial stress corrections
Volume change displaced by loading ram and measured by
WF automatic volume change apparatus @ 712.6kPa (2005-03-02)
0
2.000
4.000
6.000
8.000
10.000
0,0 1,0 2,0 3,0 4,0 5,0 6,0 7,0
Time [min]
Vo
lum
e c
han
ge [
mm
3]
Volume displaced by piston
Volume measured by WF
Figure 2.2: Automatic volume change apparatus calibration, 2005-03-02.
Volume change displaced by loading ram and measured by
WF automatic volume change apparatus @ 199.6kPa (2005-03-07)
0
4.000
8.000
12.000
16.000
20.000
0,0 10,0 20,0 30,0 40,0 50,0 60,0 70,0 80,0
Time [min]
Vo
lum
e c
han
ge [
mm
3]
Volume displaced by piston
Volume measured by WF
Figure 2.3: Automatic volume change apparatus calibration, 2005-03-07.
Laboratory of Geomaterials 17

Volume change and axial stress corrections
Volume change displaced by loading ram and measured by
VJT automatic volume change apparatus @ 202.8kPa (2005-12-05-load)
0
10.000
20.000
30.000
40.000
50.000
60.000
0,0 2,5 5,0 7,5 10,0 12,5 15,0 17,5 20,0 22,5
Time [min]
Vo
lum
e c
han
ge [
mm
3]
Volume displaced by piston
Volume measured by VJT
Figure 2.4: Automatic volume change apparatus calibration, 2005-12-05-load.
Volume change displaced by loading ram and measured by
VJT automatic volume change apparatus @ 200.4kPa (2005-12-05-unload)
0
10.000
20.000
30.000
40.000
50.000
60.000
0,0 2,5 5,0 7,5 10,0 12,5 15,0 17,5 20,0 22,5
Time [min]
Vo
lum
e c
han
ge [
mm
3]
Volume displaced by piston
Volume measured by VJT
Figure 2.5: Automatic volume change apparatus calibration, 2005-12-05-unload.
Laboratory of Geomaterials 18

Volume change and axial stress corrections
Volume change displaced by loading ram and measured by
WF & VJT automatic volume change apparatus @ 402.9kPa (2005-12-09)
0
10.000
20.000
30.000
40.000
50.000
60.000
0,0 5,0 10,0 15,0 20,0 25,0 30,0 35,0 40,0 45,0
Time [min]
Vo
lum
e c
han
ge [
mm
3]
Volume displaced by piston
Volume measured by WF
Volume measured by VJT
Figure 2.6: Automatic volume change apparatus calibration, 2005-12-09.
Volume change displaced by loading ram and measured by
WF & VJT automatic volume change apparatus @ 204.1kPa (2005-12-09a-l)
0
10.000
20.000
30.000
40.000
50.000
60.000
0,0 2,5 5,0 7,5 10,0 12,5 15,0 17,5 20,0 22,5
Time [min]
Vo
lum
e c
han
ge [
mm
3]
Volume displaced by piston
Volume measured by WF
Volume measured by VJT
Figure 2.7: Automatic volume change apparatus calibration, 2005-12-09-load.
Laboratory of Geomaterials 19

Volume change and axial stress corrections
Volume change displaced by loading ram and measured by
WF & VJT automatic volume change apparatus @ 198kPa (2005-12-09a-un)
0
10.000
20.000
30.000
40.000
50.000
60.000
0,0 2,5 5,0 7,5 10,0 12,5 15,0 17,5 20,0 22,5
Time [min]
Vo
lum
e c
han
ge [
mm
3]
Volume displaced by piston
Volume measured by WF
Volume measured by VJT
Figure 2.8: Automatic volume change apparatus calibration, 2005-12-09-unload.
Volume change displaced by loading ram and measured by
WF & VJT automatic volume change apparatus @ 97.9kPa (2005-12-12)
0
10.000
20.000
30.000
40.000
50.000
60.000
0,0 5,0 10,0 15,0 20,0 25,0 30,0 35,0 40,0 45,0
Time [min]
Vo
lum
e c
han
ge [
mm
3]
Volume displaced by piston
Volume measured by WF
Volume measured by VJT
Figure 2.9: Automatic volume change apparatus calibration @ 100kPa, 2005-12-12.
Laboratory of Geomaterials 20

Volume change and axial stress corrections
Volume change displaced by loading ram and measured by
WF & VJT automatic volume change apparatus @ 205.5kPa (2005-12-12)
0
10.000
20.000
30.000
40.000
50.000
60.000
0,0 5,0 10,0 15,0 20,0 25,0 30,0 35,0 40,0 45,0
Time [min]
Vo
lum
e c
han
ge [
mm
3]
Volume displaced by piston
Volume measured by WF
Volume measured by VJT
Figure 2.10: Automatic volume change apparatus calibration @ 200kPa,2005-12-12.
Volume change displaced by loading ram and measured by
WF & VJT automatic volume change apparatus @ 304.5kPa (2005-12-12)
0
10.000
20.000
30.000
40.000
50.000
60.000
0,0 5,0 10,0 15,0 20,0 25,0 30,0 35,0 40,0 45,0
Time [min]
Vo
lum
e c
han
ge [
mm
3]
Volume displaced by piston
Volume measured by WF
Volume measured by VJT
Figure 2.11: Automatic volume change apparatus calibration @ 300kPa,2005-12-12.
Laboratory of Geomaterials 21

Volume change and axial stress corrections
Volume change displaced by loading ram and measured by
WF & VJT automatic volume change apparatus @ 402.9kPa (2005-12-12)
0
10.000
20.000
30.000
40.000
50.000
60.000
0,0 5,0 10,0 15,0 20,0 25,0 30,0 35,0 40,0 45,0
Time [min]
Vo
lum
e c
han
ge [
mm
3]
Volume displaced by piston
Volume measured by WF
Volume measured by VJT
Figure 2.12: Automatic volume change apparatus calibration @ 400kPa,2005-12-12.
Volume change displaced by loading ram and measured by
WF & VJT automatic volume change apparatus @ 506.7kPa (2005-12-12)
0
10.000
20.000
30.000
40.000
50.000
60.000
0,0 5,0 10,0 15,0 20,0 25,0 30,0 35,0 40,0 45,0
Time [min]
Vo
lum
e c
han
ge [
mm
3]
Volume displaced by piston
Volume measured by WF
Volume measured by VJT
Figure 2.13: Automatic volume change apparatus calibration @ 500kPa,2005-12-12.
Laboratory of Geomaterials 22

Volume change and axial stress corrections
Volume change displaced by loading ram and measured by
WF & VJT automatic volume change apparatus @ 607.3kPa (2005-12-12)
0
10.000
20.000
30.000
40.000
50.000
60.000
0,0 5,0 10,0 15,0 20,0 25,0 30,0 35,0 40,0 45,0
Time [min]
Vo
lum
e c
han
ge [
mm
3]
Volume displaced by piston
Volume measured by WF
Volume measured by VJT
Figure 2.14: Automatic volume change apparatus calibration @ 600kPa,2005-12-12.
∆V = ∆Vpipe + ∆Vw,pipe (2.4)
where ∆V is the volume change of the flexible pipe filled with water, mea-sured by the WF automatic volume change apparatus, ∆Vpipe is the ex-pansion of the flexible pipe due to increase of pressure and ∆Vw,pipe is thecompression of water inside the flexible pipe, evaluated from eq. 2.2, whereVw,pipe is given from eq. 2.5
∆Vw,pipe =πd 2
int
4L (2.5)
where dint is the internal diameter of the nylon flexible pipe (6.0mm) and Lthe length of the flexible pipe.
In Fig. 2.16 a calibration graph of a nylon flexible pipe filled with de-aired water is given. From the data regression curves, we obtain a powerlaw for the flexible pipe expansion in loading-unloading.
The volume expansion per unit length of the nylon flexible pipes of inter-nal/external diameter due to internal pipe pressure 6/8mm is given throughthe following expression, in eq. 2.6,
∆Vpipe/mm = A(
ln(∆σc)− ln(σc0))
(2.6)
where A (mm2/kPa) and σc0 (kPa) are the parameters of the power lawmodel. The same model applies also for the volume expansion of the flexible
Laboratory of Geomaterials 23

Volume change and axial stress corrections
Nylon flexible pipe expansion, diameter=6/8mm, length=3170mm
y = 22,301e0,002x
R2 = 0,979
y = 20,755e0,0021x
R2 = 0,9795
y = 22,019e0,0021x
R2 = 0,9748
0
200
400
600
800
1.000
1.200
1.400
0 250 500 750 1.000 1.250 1.500 1.750 2.000 2.250 2.500
Flexible pipe expansion Vpipe [mm3]
Pre
ss
ure
c [
kP
a]
Test-02/2005-11-15
Test-03/2005-11-15
Test-04/2005-11-15
Figure 2.15: Calibration of nylon flexible pipe expansion, 2005-11-15.
Nylon flexible pipe (filled with de-aired H2O) expansion
diameter=6/8mm, length=3170mm
y = 22,717e0,002x
R2 = 0,979
y = 21,146e0,002x
R2 = 0,980
y = 22,420e0,002x
R2 = 0,975
0
200
400
600
800
1.000
1.200
1.400
0 250 500 750 1.000 1.250 1.500 1.750 2.000 2.250 2.500
Flexible pipe expansion Vpipe [mm3]
Pre
ss
ure
c [
kP
a]
Test-02/2005-11-15
Test-03/2005-11-15
Test-04/2005-11-15
Figure 2.16: Calibration of nylon flexible pipe with de-aired water expansion,2005-11-15.
Laboratory of Geomaterials 24

Volume change and axial stress corrections
Model Parameters A (mm2/kPa) σc0 (kPa)
Calibration, 2005-11-15 (test02) 0.153 22.7Calibration, 2005-11-15 (test03) 0.153 21.1Calibration, 2005-11-15 (test04) 0.156 22.4
Table 2.2: Logarithmic law parameters for nylon flexible pipe (filled withde-aired water) 6/8mm calibration.
nylon pipes filled with de-aired water and is given by the expression in eq.2.7,
∆Vpipe&water/mm = A(
ln(∆σc)− ln(σc0))
(2.7)
where A (mm2/kPa) and σc0 (kPa) are the parameters of the power lawmodel.
Comparing Fig. 2.15 and 2.16 shows that the volume expansion of theflexible nylon pipe is much greater than the compression of de-aired water inthe nylon flexible pipe, ∆Vpipe À ∆Vw,pipe. Table 2.2 summarises the powerlaw model constants for various calibrations.
2.4 Volume change due to triaxial cell expansion,∆Vcell
The last, but not least, volume change correction is the one referring to theWF triaxial cell. Typical curves of cell volume change vs cell pressure arereported by Head, K.H., in Soil Laboratory Testing, Vol.3, 1986 (Fig. 2.17).
The WF11001/SN:100257-9 is a triaxial cell of an almost cylindricalshape. The internal diameter of the triaxial cell is d cyl
int = 168.0mm whileits height is h cyl = 352.0mm. Figure 2.18 presents in detail the WF11001/SN:100257-9 triaxial cell, the triaxial base plate, the top cap and pedestalof the specimen, as well as the submersible load ram & cell. This willlater on allow us to roughly estimate the volume of the above triaxial cellitems. Next to the rough calculations of the volume of the triaxial items,in parenthesis, the volume of its item will be given, estimated from theArchimedes principle.
Laboratory of Geomaterials 25

Volume change and axial stress corrections
Figure 2.17: Typical curve of volume change of a triaxial chamber versuscell pressure (Head, K.H., 1986).
Vcell = Vcylinder − Vbase plate − Vload ram&cell
Vcylinder =πd 2
cyl
4hcyl =
π16.82
435.2 = 7803 cm3
Vbase plate =πd 2
base plate
4hbase plate =
π10.02
42.8 = 220 cm3 (2.8)
where Vload ram&cell is the volume of the load ram plus the volume of thesubmersible load cell (STALC3-50kN-24937). As the load ram & cell mayfreely slide along the triaxial bush, inside the triaxial cell, the volume of theload ram & cell depends on its vertical position. The minimum volume thatthe load ram & cell occupies in the triaxial cell, is when it is placed in theupper most position, where the load ram is out of the triaxial cell and theload cell is in contact with the lower part of the triaxial cell bush. Shouldthe piston slide into the triaxial cell, the volume the load ram should alsobe taken into account. In other words, the volume of the load cell & ram isgiven by eq. 2.9,
Vload ram&cell = Vload ram + Vload cell =
=πd 2
load ram
4hload ram +
πd 2load cell
4hload cell =
=πd 2
load ram
4hload ram + 151 cm3 (150 cm3) (2.9)
where d 2load ram = 25.1mm and hload ram is the length of the load ram in the
triaxial cell.
Laboratory of Geomaterials 26

Volume change and axial stress corrections
Figure 2.18: Section and side/top view of the WF11001/SN:100257-9 triaxialcell.
Laboratory of Geomaterials 27

Volume change and axial stress corrections
Suppose that the triaxial cell is filled with de-aired water and there isno specimen housed in the cell. Assume also that the load ram & cell isplaced in the upper most part of the triaxial cell (thus only the load cell issubmerged into the cell and the load ram is outside the triaxial cell). In thiscase the volume of water in the triaxial cell is according to eq. 2.8,
Vw,cell = 7803− 220− 151 = 7431 cm3 (7580 cm3) (2.10)
The volume in parenthesis is the volume of water needed to fill the triaxialcell. The difference between the two values lies in the fact that the triaxialcell is not a perfect cylinder of diameter d and height h, while the triaxialbase plate has also small openings and pipes where water may enter. Forthis reason the volume of de-aired water needed to fill the triaxial cell isgreater than the rough estimate.
The calibration setup, which will allow us to estimate the triaxial cellexpansion as a function of the cell pressure, will follow the calibration setupof the two automatic volume change apparatus (described in previous sec-tion), but for the fact that the cell pressure line will be closed. In otherwords, the triaxial cell will be filled with de-aired water, the loading ramwill be forced to reach its upper limit, thus only the loading cell will be inthe cell at the beginning of the calibration test and the increase of the cellpressure will be monitored from cell pressure line port 1. As the loading ramslides inside the triaxial cell, keeping all cell valves closed, cell water pres-sure is increased. The total volume change ∆Vtotal of the triaxial cell filledwith de-aired water will be equal to the volume of the loading ram enteringthe cell. By denoting VWF−cell the volume change attributed to the triaxialcell expansion and VWF−cell−water the volume change due to de-aired waterinside the triaxial cell, the WF triaxial cell expansion is calculated from eq.2.11,
∆Vtotal = ∆VWF−cell + ∆VWF−cell−water (2.11)
where ∆Vtotal =πd 2
piston
4∆hpiston
A logarithmic-linear law is applied to the experimental data (see Fig.2.20, Fig. 2.21, Fig. 2.22, Fig. 2.23, Fig. 2.24 and Fig. 2.25), leading tothe following analytical expression for the WF triaxial cell expansion due topressure,
∆VWF−cell = c1 ln(σc
σc0) + c2(σc − σc0) + c3 (2.12)
where the values of c1, c2, c3, σc0 are given in Table 2.3In the case of specimen’s presence in the triaxial cell, eq. 2.11 has to be
modified as follows,
Laboratory of Geomaterials 28

Volume change and axial stress corrections
WF11001/SN:100257-9 triaxial cell expansion, GIO/GeoLab
0
200
400
600
800
1.000
1.200
1.400
0 4.000 8.000 12.000 16.000 20.000 24.000 28.000 32.000 36.000 40.000
Cell expansion Vcell [mm3]
Ce
ll p
res
su
re
c [
kP
a]
2005-12-12b / Vw=7450 cm^3
2005-12-12c / Vw=7450 cm^3
2005-12-14a / Vw=7480 cm^3
2005-12-14b / Vw=7480 cm^3
2005-12-14c / Vw=7160 cm^3
2005-12-14d / Vw=7160 cm^3
Figure 2.19: WF11001/SN:100257-9 triaxial cell calibration.
WF11001/SN:100257-9 expansion
(base plate, load ram, Vw=7.450cm3)
Loading ram, GIO/GeoLab/2005-12-12-b
0
200
400
600
800
1.000
1.200
1.400
0 4.000 8.000 12.000 16.000 20.000 24.000 28.000 32.000 36.000 40.000
Cell expansion Vcell [mm3]
Ce
ll p
res
su
re
c [
kP
a]
Experimental data
Model curve loading
Model curve unloading
Figure 2.20: WF11001/SN:100257-9 triaxial cell calibration, 2005-12-12-b.
Laboratory of Geomaterials 29

Volume change and axial stress corrections
WF11001/SN:100257-9 expansion
(base plate, load ram, Vw=7.450cm3)
Loading ram, GIO/GeoLab/2005-12-12-c
0
200
400
600
800
1.000
1.200
1.400
0 4.000 8.000 12.000 16.000 20.000 24.000 28.000 32.000 36.000 40.000
Cell expansion Vcell [mm3]
Ce
ll p
res
su
re
c [
kP
a]
Experimental data
Model curve loading
Model curve unloading
Figure 2.21: WF11001/SN:100257-9 triaxial cell calibration, 2005-12-12-c.
WF11001/SN:100257-9 expansion
(base plate, load ram, Vw=7.480cm3)
Loading ram, GIO/GeoLab/2005-12-14-a
0
200
400
600
800
1.000
1.200
1.400
0 4.000 8.000 12.000 16.000 20.000 24.000 28.000 32.000 36.000 40.000
Cell expansion Vcell [mm3]
Ce
ll p
res
su
re
c [
kP
a]
Experimental data
Model curve loading
Model curve unloading
Figure 2.22: WF11001/SN:100257-9 triaxial cell calibration, 2005-12-14-a.
Laboratory of Geomaterials 30

Volume change and axial stress corrections
WF11001/SN:100257-9 expansion
(base plate, load ram, Vw=7.480cm3)
Loading ram, GIO/GeoLab/2005-12-14-b
0
200
400
600
800
1.000
1.200
1.400
0 4.000 8.000 12.000 16.000 20.000 24.000 28.000 32.000 36.000 40.000
Cell expansion Vcell [mm3]
Ce
ll p
res
su
re
c [
kP
a]
Experimental data
Model curve loading
Model curve unloading
Figure 2.23: WF11001/SN:100257-9 triaxial cell calibration, 2005-12-14-b.
WF11001/SN:100257-9 expansion
(base plate, load ram & dummy cylinder, Vw=7.160cm3)
Loading ram, GIO/GeoLab/2005-12-14-c
0
200
400
600
800
1.000
1.200
1.400
0 4.000 8.000 12.000 16.000 20.000 24.000 28.000 32.000 36.000 40.000
Cell expansion Vcell [mm3]
Ce
ll p
res
su
re
c [
kP
a]
Experimental data
Model curve loading
Model curve unloading
Figure 2.24: WF11001/SN:100257-9 triaxial cell calibration, 2005-12-14-c.
Laboratory of Geomaterials 31

Volume change and axial stress corrections
WF11001/SN:100257-9 expansion
(base plate, load ram & dummy cylinder, Vw=7.160cm3)
Loading ram, GIO/GeoLab/2005-12-14-d
0
200
400
600
800
1.000
1.200
1.400
0 4.000 8.000 12.000 16.000 20.000 24.000 28.000 32.000 36.000 40.000
Cell expansion Vcell [mm3]
Ce
ll p
res
su
re
c [
kP
a]
Experimental data
Model curve loading
Model curve unloading
Figure 2.25: WF11001/SN:100257-9 triaxial cell calibration, 2005-12-14-d.
Model c1 c2 c3 σc0
parameters (mm3) (mm3/kPa) (mm3) (kPa)
2005-12-12-b-loading 364.7 31.5 384.2 62.02005-12-12-b-unloading 1500.5 28.2 1582.8 65.92005-12-12-c-loading 531.7 30.3 1720.1 65.92005-12-12-c-unloading 1302.7 28.6 2050.8 69.82005-12-14-a-loading 1123.8 30.1 238.2 80.72005-12-14-a-unloading 1900.6 27.9 350.9 71.72005-12-14-b-loading 984.1 30.0 262.0 76.12005-12-14-b-unloading 1793.4 28.1 286.3 71.82005-12-14-c-loading 216.5 31.4 456.2 81.62005-12-14-c-unloading 1316.4 28.7 504.4 72.82005-12-14-d-loading 331.9 30.7 354.8 75.32005-12-14-d-unloading 1196.7 28.9 648.0 80.7
Table 2.3: Logarithmic-linear law parameters for WF11001/SN:100257-9triaxial cell calibration.
Laboratory of Geomaterials 32

Volume change and axial stress corrections
∆Vtotal = ∆VWF−cell + ∆VWF−cell−water + ∆Vpipe + ∆Vspecimen (2.13)
where ∆VWF−cell is calculated according to logarithmic-linear law, ∆VWF−cell−water
is the volume of de-aired water in the cell, ∆Vpipe is the volume expansion ofthe pipes between the cell pressure line of the triaxial cell and the automaticvolume apparatus and ∆Vspecimen is the volume of the specimen.
Laboratory of Geomaterials 33

Volume change and axial stress corrections
Laboratory of Geomaterials 34

Chapter 3
Specimen volume changecorrections
During a drained or undrained triaxial compression/extension test, the spec-imen deforms. Such deformation inevitably leads to a change its geometricaldimensions. The calculation of the axial stress or strain should take into ac-count the deformed configuration of the specimen.
3.1 Specimen section area
During a triaxial compression/extension test the cylindrical specimen de-forms and the its cross section (perpendicular to the primary axis x1) in-creases/decreases. Let us assume that the initial cylindrical configurationof the specimen is given by its height h0 and its diameter d0. The initialvolume of the specimen is given by the eq.3.1
V0 =πd 2
0
4h0 (3.1)
In the case of undrained triaxial compression/extension, where the vol-ume change of the specimen is zero (∆V = 0) and the specimen remainscylindrical, the following expression holds for the initial and final specimenvolume,
V0 = V ′ ⇒ πd ′2
4h ′ =
πd 20
4h0 ⇒ d ′ = d0
√h0
h ′(3.2)
In this case, the area of any section perpendicular to a vertical axis ofthe specimen will be given by
A =πd ′2
4h ′ = A0
h0
h ′(3.3)
35

Volume change and axial stress corrections
In the case of a drained test, the above expressions can be modified totake into account the change of the volume due to drainage. By denoting thevolumetric strain εvol = ∆V/V0 (positive if water comes out of the specimen,that is compression positive) and εax = ∆h/h0, we get:
V ′ = V0 −∆V ⇒ V ′
V0= 1− εv ⇒ Ah = A0h
′(1− εvol) ⇒
A = A01− εvol
1− εax(3.4)
During triaxial compression tests “barreling” of the specimen may alsooccur. The specimen ceases to deform as a cylinder and the cross section ofthe specimen perpendicular to the vertical axis is not constant. This is thecase where the friction in the top cap and pedestal is high enough so it doesnot allow the specimen to freely expand. Barreling may fully or partiallyappear. In the first case the diameter of the specimen as a function of thevertical distance from the pedestal is given by eq. 3.5
A =π
4(d0 + 2a sin
πz
h)2 (3.5)
while for the case of partial barreling eq. 3.6 holds,
A =π
4(d0 + 2a cos
πz
2h)2 (3.6)
The volume of the specimen for each of the two above cases is given byintegration of eq. 3.5 and 3.6 in respect to the height of the specimen, thatis respectively,
V =∫ h
0Adz =
∫ h
0
[π
4(d0 + 2a sin
πz
h)2
]dz =
πd 20h
4+ 2ahd0 +
πa2h
2(3.7)
and
V =∫ h
0Adz =
∫ h
0
[π
4(d0 + 2a cos
πz
2h)2
]dz =
πd 20h
4+ 2ahd0 +
πa2h
2(3.8)
Inserting eq. 3.7 and 3.8 into eq. 3.4 the parameter ‘a’ can be evaluatedand thus the section A of the specimen along the vertical axis is known.
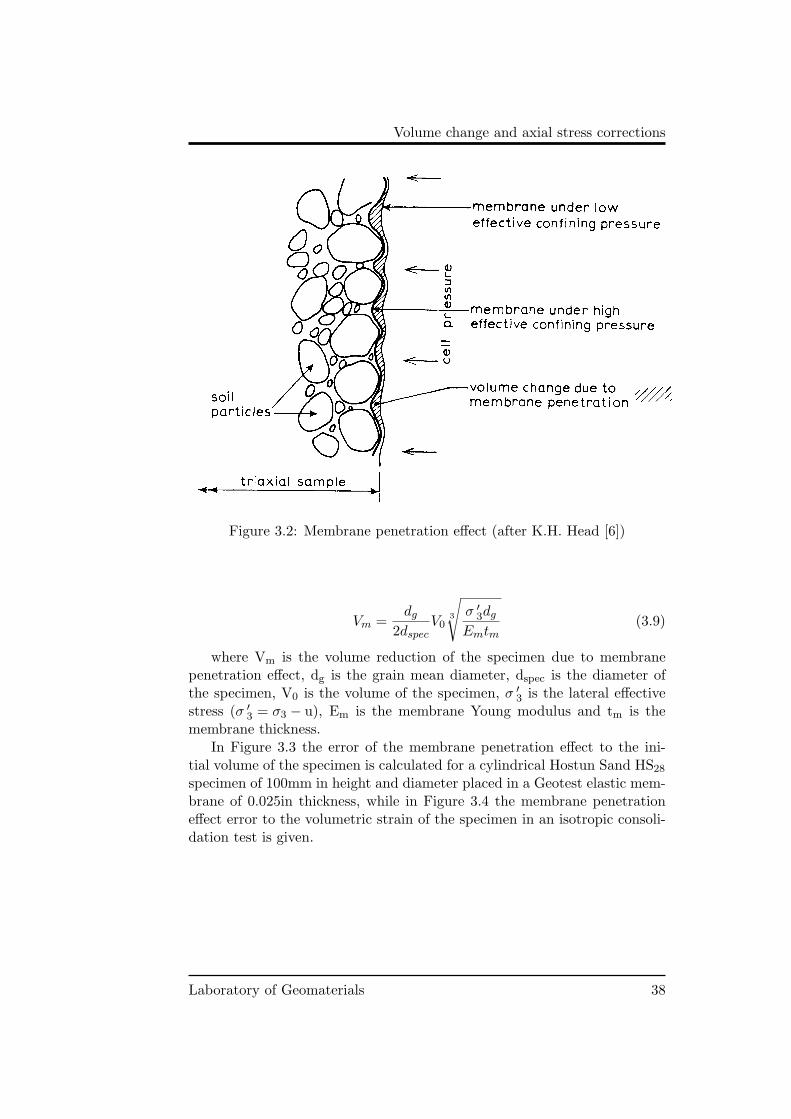
3.2 Membrane penetration effect
In the triaxial test on a granular soil a volume change measurement madeas a result of an increase in confining pressure will be influenced by thepenetration of the membrane enclosing the specimen into the voids between
Laboratory of Geomaterials 36

Volume change and axial stress corrections
Figure 3.1: Specimen section area due to barreling
the particles at the interface. This is known as the membrane penetrationeffect, illustrated in Figure 3.2. It can affect volume change measurementsin both the back pressure line and the cell pressure line. The effect hasbeen shown to depend mainly on particle size, and to a much lesser extenton the state of packing (i.e. density) and particle shape, as well as on themembrane thickness and stiffness. It applies to materials of medium sandsize and upwards, having a 50% particle size, D50, exceeding 0.1mm, and is ofgreatest significance with large diameter specimens. The effect is negligiblefor fine-grained soils.
Newland and Allely (1959) studied the effect using lead shot, and Roscoe,Schofield and Thurairajah (1963) investigated it using Ottawa sand. Agraphical method of estimating the effect in sandy silts, based on the 50%size D50, was given by Frydman, Zeitlen and Alpan (1973). Corrections ofthe same order of magnitude were derived theoretically by Poulos (1964)using measured elastic properties of membrane material. Most recent inves-tigations were made by Molenkamp and Luger (1981). This correction isunlikely to by significant in routine testing.
Baldi and Nova ([1]) investigated theoretically and experimentally themembrane penetration effects in triaxial testing. They found that membranepenetration depends strongly on the diameter of the grain (expressed byd50), the value of the mean effective stress σ ′
3 and the diameter of thespecimen dspecimen. According to their analysis, a semiempirical relation(eq. 3.9) allows for a quantitative membrane penetration correction in atypical triaxial test.
Laboratory of Geomaterials 37
Volume change and axial stress corrections
Figure 3.2: Membrane penetration effect (after K.H. Head [6])
Vm =dg
2dspecV0
3
√σ ′
3dg
Emtm(3.9)
where Vm is the volume reduction of the specimen due to membranepenetration effect, dg is the grain mean diameter, dspec is the diameter ofthe specimen, V0 is the volume of the specimen, σ ′
3 is the lateral effectivestress (σ ′
3 = σ3 − u), Em is the membrane Young modulus and tm is themembrane thickness.
In Figure 3.3 the error of the membrane penetration effect to the ini-tial volume of the specimen is calculated for a cylindrical Hostun Sand HS28
specimen of 100mm in height and diameter placed in a Geotest elastic mem-brane of 0.025in thickness, while in Figure 3.4 the membrane penetrationeffect error to the volumetric strain of the specimen in an isotropic consoli-dation test is given.
Laboratory of Geomaterials 38

Volume change and axial stress corrections
Membrane penetration effect
Hostun Sand HS28, Geotest membranes 0.025in
0,000%
0,050%
0,100%
0,150%
0,200%
0,250%
0,300%
0 100 200 300 400 500 600 700 800 900 1000
Lateral effective stress '3 [kPa]
Rati
o o
f m
em
bra
ne p
en
etr
ati
on
to
init
ial
vo
lum
e V
m/V
0 [
-]
Figure 3.3: Membrane penetration error in a typical triaxial test
Membrane penetration effect error in isotropic consolidation test
CD-HS28-100-20 (eo=1.044), Geotest membrane tm=0.025in
0%
5%
10%
15%
20%
25%
30%
35%
40%
45%
50%
0 100 200 300 400 500 600 700 800 900 1000 1100 1200
Lateral effective stress '3 [kPa]
Err
or
of
mem
bra
ne p
en
etr
ati
on
in
iso
tro
pic
co
nso
lid
ati
on
test
[-]
Figure 3.4: Membrane penetration error as a function of the volumetricstrain in an isotropic consolidation test.
Laboratory of Geomaterials 39

Volume change and axial stress corrections
Laboratory of Geomaterials 40

Chapter 4
Axial load corrections
4.1 Standard bush
The correction to the measured axial force due to friction of the piston inthe cell bushing can be allowed for by running the compression machine,with the cell under pressure, at the rate of displacement required for thetest, but with the piston not in contact with the specimen top cap. If thisis done immediately before starting a compression test and the load ringdial gauge is set to read zero, no further correction will be necessary at thatmachine speed so long as the lad remains truly axial.
If there are no lateral forces, the friction loss for a piston and bush ingood condition should be small if oil is inserted at the top of the cell as alubricant. Bishop and Henkel quoted errors of about 1− 3% of the axialforce, increasing with axial strain. Tests on 100mm diameter specimens ina cell with a 19mm diameter piston indicated that the correction of about1% of the axial force should be deducted for every 5% strain.
When a specimen fails by slipping along a single plane, lateral forces areintroduced which can appreciably increase the bush friction. Under theseconditions Bishop and Henkel suggested that the error could rise to about5% of the axial force. The correction needed would also depend on the axialstrain, and a deduction of about 1% of the measured force for every 2%strain from the start of slip seems appropriate.
The nominal corrections suggested above are accurate enough for mostpractical purposes. If the frictional force is likely to exceed about 2% of themeasured axial force it is better to measure the force with a device mountedinside the triaxial cell (submerged load cell/ring).
In Figures 4.2, 4.3 the normal and shear stress applied on the bush, aswell as the friction coefficient µ are given,
41

Volume change and axial stress corrections
Figure 4.1: The error in axial load measurement due to ram friction: varia-tion with axial strain in a typical test on a 4-in. diameter sample ([3]).
WF11001/SN:100257-9 triaxial cell bush friction
GeoLab/GIO/2005-03-12/loading/ =1,76o
y = 0,0308x
R2 = 0,9968
0,00
0,20
0,40
0,60
0,80
1,00
1,20
1,40
1,60
0,00 5,00 10,00 15,00 20,00 25,00 30,00 35,00 40,00 45,00 50,00
Normal stress [MPa]
Sh
ea
r s
tre
ss
[
MP
a]
Figure 4.2: WF11001/SN:100257-9 triaxial cell bush friction, calibration2005-03-12-loading
Laboratory of Geomaterials 42

Volume change and axial stress corrections
WF11001/SN:100257-9 triaxial cell bush friction
GeoLab/GIO/2005-03-12/unloading/ =1,86o
y = 0,0324x
R2 = 0,9972
0,00
0,20
0,40
0,60
0,80
1,00
1,20
1,40
1,60
0,00 5,00 10,00 15,00 20,00 25,00 30,00 35,00 40,00 45,00 50,00
Normal stress [MPa]
Sh
ea
r s
tre
ss
[
MP
a]
Figure 4.3: WF11001/SN:100257-9 triaxial cell bush friction, calibration2005-03-12-unloading
WF11001/SN:100257-9 triaxial cell bush friction @ 0kPa
GeoLab/GIO/2005-12-14/loading
0,00
0,25
0,50
0,75
1,00
1,25
1,50
0,00 5,00 10,00 15,00 20,00 25,00 30,00 35,00 40,00 45,00 50,00
Normal stress [MPa]
Sh
ea
r s
tre
ss
[
MP
a]
Figure 4.4: WF11001/SN:100257-9 triaxial cell bush friction @ 0kPa, cali-bration 2005-12-14-loading
Laboratory of Geomaterials 43

Volume change and axial stress corrections
WF11001/SN:100257-9 triaxial cell bush friction @ 0kPa
GeoLab/GIO/2005-12-14/unloading
0,00
0,25
0,50
0,75
1,00
1,25
1,50
0,00 5,00 10,00 15,00 20,00 25,00 30,00 35,00 40,00 45,00 50,00
Normal stress [MPa]
Sh
ea
r s
tre
ss
[
MP
a]
Figure 4.5: WF11001/SN:100257-9 triaxial cell bush friction @ 0kPa, cali-bration 2005-12-14-unloading
WF11001/SN:100257-9 triaxial cell bush friction @ 20kPa
GeoLab/GIO/2005-12-12/loading
0,00
0,25
0,50
0,75
1,00
1,25
1,50
0,00 5,00 10,00 15,00 20,00 25,00 30,00 35,00 40,00 45,00 50,00
Normal stress [MPa]
Sh
ear
str
ess
[M
Pa]
Figure 4.6: WF11001/SN:100257-9 triaxial cell bush friction @ 20kPa, cali-bration 2005-12-12-loading
Laboratory of Geomaterials 44
Volume change and axial stress corrections
WF11001/SN:100257-9 triaxial cell bush friction @ 20kPa
GeoLab/GIO/2005-12-12/unloading
0,00
0,25
0,50
0,75
1,00
1,25
1,50
0,00 5,00 10,00 15,00 20,00 25,00 30,00 35,00 40,00 45,00 50,00
Normal stress [MPa]
Sh
ea
r s
tre
ss
[
MP
a]
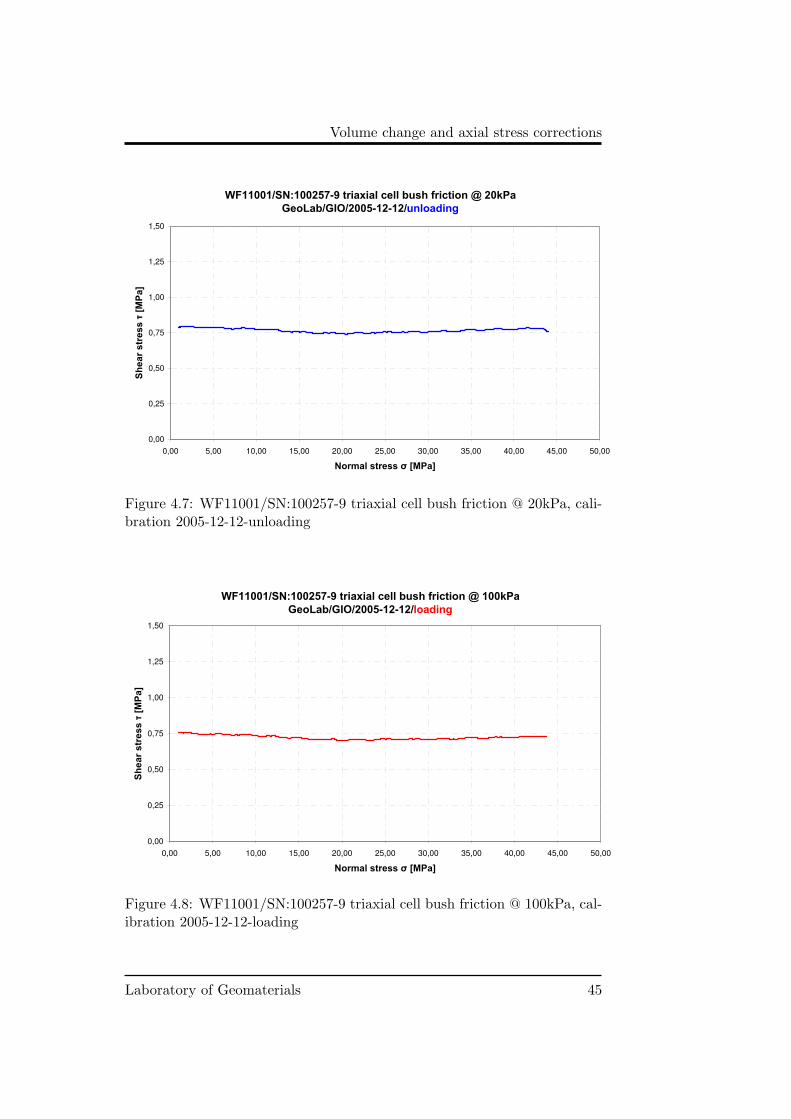
Figure 4.7: WF11001/SN:100257-9 triaxial cell bush friction @ 20kPa, cali-bration 2005-12-12-unloading
WF11001/SN:100257-9 triaxial cell bush friction @ 100kPa
GeoLab/GIO/2005-12-12/loading
0,00
0,25
0,50
0,75
1,00
1,25
1,50
0,00 5,00 10,00 15,00 20,00 25,00 30,00 35,00 40,00 45,00 50,00
Normal stress [MPa]
Sh
ea
r s
tre
ss
[
MP
a]
Figure 4.8: WF11001/SN:100257-9 triaxial cell bush friction @ 100kPa, cal-ibration 2005-12-12-loading
Laboratory of Geomaterials 45

Volume change and axial stress corrections
WF11001/SN:100257-9 triaxial cell bush friction @ 100kPa
GeoLab/GIO/2005-12-12/unloading
0,00
0,25
0,50
0,75
1,00
1,25
1,50
0,00 5,00 10,00 15,00 20,00 25,00 30,00 35,00 40,00 45,00 50,00
Normal stress [MPa]
Sh
ea
r s
tre
ss
[
MP
a]
Figure 4.9: WF11001/SN:100257-9 triaxial cell bush friction @ 100kPa, cal-ibration 2005-12-12-unloading
WF11001/SN:100257-9 triaxial cell bush friction @ 200kPa
GeoLab/GIO/2005-12-12/loading
0,00
0,25
0,50
0,75
1,00
1,25
1,50
0,00 5,00 10,00 15,00 20,00 25,00 30,00 35,00 40,00 45,00 50,00
Normal stress [MPa]
Sh
ea
r s
tre
ss
[
MP
a]
Figure 4.10: WF11001/SN:100257-9 triaxial cell bush friction @ 200kPa,calibration 2005-12-12-loading
Laboratory of Geomaterials 46

Volume change and axial stress corrections
WF11001/SN:100257-9 triaxial cell bush friction @ 200kPa
GeoLab/GIO/2005-12-12/unloading
0,00
0,25
0,50
0,75
1,00
1,25
1,50
0,00 5,00 10,00 15,00 20,00 25,00 30,00 35,00 40,00 45,00 50,00
Normal stress [MPa]
Sh
ea
r s
tre
ss
[
MP
a]
Figure 4.11: WF11001/SN:100257-9 triaxial cell bush friction @ 200kPa,calibration 2005-12-12-unloading
WF11001/SN:100257-9 triaxial cell bush friction @ 300kPa
GeoLab/GIO/2005-12-12/loading
0,00
0,25
0,50
0,75
1,00
1,25
1,50
0,00 5,00 10,00 15,00 20,00 25,00 30,00 35,00 40,00 45,00 50,00
Normal stress [MPa]
Sh
ea
r s
tre
ss
[
MP
a]
Figure 4.12: WF11001/SN:100257-9 triaxial cell bush friction @ 300kPa,calibration 2005-12-12-loading
Laboratory of Geomaterials 47

Volume change and axial stress corrections
WF11001/SN:100257-9 triaxial cell bush friction @ 300kPa
GeoLab/GIO/2005-12-12/unloading
0,00
0,25
0,50
0,75
1,00
1,25
1,50
0,00 5,00 10,00 15,00 20,00 25,00 30,00 35,00 40,00 45,00 50,00
Normal stress [MPa]
Sh
ea
r s
tre
ss
[
MP
a]
Figure 4.13: WF11001/SN:100257-9 triaxial cell bush friction @ 300kPa,calibration 2005-12-12-unloading
WF11001/SN:100257-9 triaxial cell bush friction @ 400kPa
GeoLab/GIO/2005-12-12/loading
0,00
0,25
0,50
0,75
1,00
1,25
1,50
0,00 5,00 10,00 15,00 20,00 25,00 30,00 35,00 40,00 45,00 50,00
Normal stress [MPa]
Sh
ea
r s
tre
ss
[
MP
a]
Figure 4.14: WF11001/SN:100257-9 triaxial cell bush friction @ 400kPa,calibration 2005-12-12-loading
Laboratory of Geomaterials 48

Volume change and axial stress corrections
WF11001/SN:100257-9 triaxial cell bush friction @ 400kPa
GeoLab/GIO/2005-12-12/unloading
0,00
0,25
0,50
0,75
1,00
1,25
1,50
0,00 5,00 10,00 15,00 20,00 25,00 30,00 35,00 40,00 45,00 50,00
Normal stress [MPa]
Sh
ea
r s
tre
ss
[
MP
a]
Figure 4.15: WF11001/SN:100257-9 triaxial cell bush friction @ 400kPa,calibration 2005-12-12-unloading
WF11001/SN:100257-9 triaxial cell bush friction @ 500kPa
GeoLab/GIO/2005-12-12/loading
0,00
0,25
0,50
0,75
1,00
1,25
1,50
0,00 5,00 10,00 15,00 20,00 25,00 30,00 35,00 40,00 45,00 50,00
Normal stress [MPa]
Sh
ea
r s
tre
ss
[
MP
a]
Figure 4.16: WF11001/SN:100257-9 triaxial cell bush friction @ 500kPa,calibration 2005-12-12-loading
Laboratory of Geomaterials 49
Volume change and axial stress corrections
WF11001/SN:100257-9 triaxial cell bush friction @ 500kPa
GeoLab/GIO/2005-12-12/unloading
0,00
0,25
0,50
0,75
1,00
1,25
1,50
0,00 5,00 10,00 15,00 20,00 25,00 30,00 35,00 40,00 45,00 50,00
Normal stress [MPa]
Sh
ea
r s
tre
ss
[
MP
a]
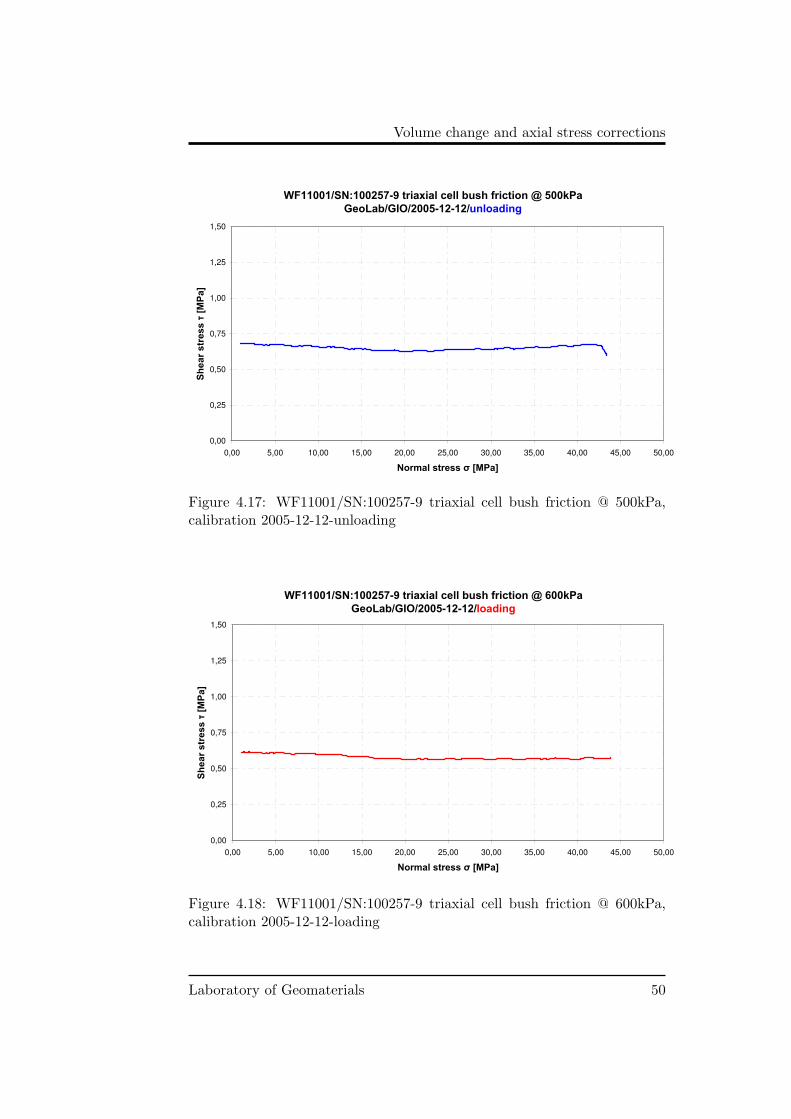
Figure 4.17: WF11001/SN:100257-9 triaxial cell bush friction @ 500kPa,calibration 2005-12-12-unloading
WF11001/SN:100257-9 triaxial cell bush friction @ 600kPa
GeoLab/GIO/2005-12-12/loading
0,00
0,25
0,50
0,75
1,00
1,25
1,50
0,00 5,00 10,00 15,00 20,00 25,00 30,00 35,00 40,00 45,00 50,00
Normal stress [MPa]
Sh
ea
r s
tre
ss
[
MP
a]
Figure 4.18: WF11001/SN:100257-9 triaxial cell bush friction @ 600kPa,calibration 2005-12-12-loading
Laboratory of Geomaterials 50

Volume change and axial stress corrections
WF11001/SN:100257-9 triaxial cell bush friction @ 600kPa
GeoLab/GIO/2005-12-12/unloading
0,00
0,25
0,50
0,75
1,00
1,25
1,50
0,00 5,00 10,00 15,00 20,00 25,00 30,00 35,00 40,00 45,00 50,00
Normal stress [MPa]
Sh
ea
r s
tre
ss
[
MP
a]
Figure 4.19: WF11001/SN:100257-9 triaxial cell bush friction @ 600kPa,calibration 2005-12-12-unloading
4.2 Rotating bush
Where the effect of piston is significant, such as with very soft soils andstiff soils that fail along a slip surface, a cell fitted with a rotating bushreduces the friction to a negligible amount, if oil is used in the top of thecell. provided that the piston and the bush are in good condition, the effectof lateral thrust caused by slip-plane failure can be neglected.
4.3 Submersible load cell
The effect of friction between piston and cell bush can be eliminated al-together if a submersible force measuring device can be mounted insidethe triaxial cell. Electrical devices of this kind, known as submersible loadtransducers, are now often used in place of externally mounted rings in com-mercial testing, especially for the use with automatic recording and data-processing systems.
Laboratory of Geomaterials 51

Volume change and axial stress corrections
Calibration friction coef. aver. shear stress cell pressuredate µ (0) τ (MPa) mathrmσc (kPa)
2005-03-12 (loading) 1.76 - 0.02005-03-12 (unloading) 1.86 - 0.02005-12-14 (load & unload) - 0.74 0.02005-12-12 (load & unload) - 0.76 21.72005-12-12 (load & unload) - 0.74 101.02005-12-12 (load & unload) - 0.71 200.42005-12-12 (load & unload) - 0.68 299.92005-12-12 (load & unload) - 0.66 400.02005-12-12 (load & unload) - 0.63 500.32005-12-12 (load & unload) - 0.61 602.5
Table 4.1: WF11001/SN:100257-9 triaxial cell bush friction coefficient µcalibration.
Figure 4.20: Wykeham Farrance STALC3-50kN triaxial submersible loadcell
Laboratory of Geomaterials 52

Volume change and axial stress corrections
Figure 4.21: DBBSE-50kN-A2242 external load cell (Applied Ltd)
Laboratory of Geomaterials 53

Volume change and axial stress corrections
Laboratory of Geomaterials 54
Chapter 5
Conclusions
The main purpose of this short report was to calibrate the WF11001/SN:100257-9 triaxial cell in order to be able to measure with fairly goodaccuracy the volume change of the specimen during a test in the case ofpartially saturated or dry material, in absence of on-sample transducers.From the above analysis it is clearly stated that in order to measure as pre-cise as possible the volume change of a specimen through the cell pressureline with an automatic volume change-like apparatus, four main aspectshave to be taken into account:
• The triaxial cell, nylon flexible pipes and volume change apparatus areflushed with de-aired water.
• The volume of de-aired water inside the cell is well-known.
• The nylon flexible pipes used to connect the triaxial cell with the au-tomatic volume change apparatus and the pressure pump are properlycalibrated.
• The initial position and movement of the load ram during the test ismonitored.
The method of measuring the volume change of a specimen indirectlyinserts by default many errors, which most of the times can not be traceddown. For this reason, in cases when other methods of measuring the vol-ume change of the specimen are available (optical ones), a first preliminarycomparison of the results would avoid possible hidden errors.
55

Volume change and axial stress corrections
Laboratory of Geomaterials 56

Bibliography
[1] Baldi, G. and Nova, R. (1984). Membrane Penetration Effects in Triax-ial Testing, ASCE, Journal of Geotechnical engineering, Vol. 110, No.3,Paper No. 18633.
[2] Bardet, J.P. (1997). Experimental Soil Mechanics, Prentice Hall,pp.582.
[3] Bishop, A.W. and Henkel, D.J. (1957). The Measurment of Soil Prop-erties in the Triaxial test, 2nd ed., Edward Arnold, London, pp.228.
[4] Frydman, S., Zeitlen, J.G., and Alpan, I. (1973). The membrane effectsin triaxial testing of granular soils. Journal of Testing and Evaluation,ASTM, Vol.1, pp.37-41.
[5] Georgopoulos, I.O. and Vardoulakis, I. (2005). The Handbook of Wyke-ham Farrance GeoTriax, internal laboratory report, pp.296.
[6] Head K.H. (1992). Manual of soil laboratory testing, Volume 3: Effec-tive stress tests, second edition, John Wiley & Sons, New York, pp.428.
[7] Newland, P.L. and Allely, B.H. (1959). Volume changes in drained tri-axial tests on granular materials. Geotechnique, Vol.9, pp.174-182.
[8] Steinbach, J. (1967). Volume change due to membrane penetration intriaxial tests on granular materials. Thesis presented to Cornell Uni-versity, at Ithaca, in 1967, in partial fullfillment of the requirements forthe degree of Master of Science.
57