corrections, department of
TRANSCRIPT

Corrections, Department ofAnnual Performance Progress Report
Reporting Year 2020
Published: 9/30/2020 12:30:26 PM

KPM # Approved Key Performance Measures (KPMs)
1 Measure 17 compliance - Percentage of Adults in Custody (AIC) in compliance with 40-hour work/education requirements of the constitution (M17)
2Successful Completion of Treatment, Education, and/or Cognitive Programming - Percentage of moderate/high-risk released Adults in Custody (AIC) with an identified education, cognitive, or treatment need who successfully completed at least one ofthe identified need programs before release.
3Recidivism - Percent of offenders: 1. Arrested for a new crime within 3 years of release from a facility to parole/post-prison supervision; 2. Convicted of a new misdemeanor or felony within 3 years of release from a facility to parole/post-prisonsupervision; AND 3. Incarcerated for a new felony within 3 years of release from a facility to parole/post-prison supervision
4 Staff Assaults - The number of Class 1 assaults on individual staff per year.
5 Walk-a-Ways - The number of Adult in Custody (AIC) walk-a-ways from outside work crews per year.
6 Reduce all Energy Usage - Reduce the annual average electricity, propane, geothermal, diesel and natural gas usage. Measure on a monthly kBtu/square foot basis.
7 Adult in Custody (AIC) Misconducts - The number of Adults in Custody (AIC) sanctioned for level 1 misconducts, including Violations Not Responsible (VNR)
8 Secure Custody Escapes - The number of escapes per year from secure-custody facilities (armed perimeter).
9 Unarmed Perimeter Escapes - The number of escapes from DOC unarmed perimeter facilities.
10 Leave Programs - The percentage of Adults in Custody (AIC) who complete transitional leave and non-prison leave (AIP)
11 Customer Service - Percent of customers rating their satisfaction with the agency customer service as "good" or "excellent": overall customer service, timeliness, accuracy, helpfulness, expertise and availability of information.
12 Offsite Medical Healthcare - Percent of total Adult in Custody (AIC) healthcare encounters that occur offsite.
13 OSHA Recordable Rate - Average number of OSHA recordable injuries per 100 employees who work a whole year.
Performance Summary Green Yellow Red
= Target to -5% = Target -5% to -15% = Target > -15%
Summary Stats: 46.15% 15.38% 38.46%
redgreenyellow

KPM #1 Measure 17 compliance - Percentage of Adults in Custody (AIC) in compliance with 40-hour work/education requirements of the constitution (M17)Data Collection Period: Jul 01 - Jun 30
* Upward Trend = positive result
Report Year 2016 2017 2018 2019 2020
Compliance with M17Actual 69% 70.17% 69% 69% 70%Target 80% 80% 80% 80% 80%
How Are We DoingThe Department did not meet target for this reporting period. The percentage of Ballot Measure 17 compliant adults in custody (AICs) increased slightly to 70% in 2019-2020. Although not meeting thefull 40-hour requirement for compliance, a majority of AICs have engaged in some type of work/education activity. It remains difficult to reach the target for a variety of reasons. To work on an outsidework crew, AICs must be classified as minimum custody and meet strict criteria to ensure public safety. The Department must also find a balance in prioritizing case management to support workopportunities, treatment, and education – all of which can be part of an AIC’s corrections plan. Oregon Corrections Enterprises (OCE) works in partnership with the Department of Corrections byproviding work opportunities that, as much as possible, mirror real world employment experiences.
Factors Affecting ResultsInstitution maintenance, janitorial work, kitchen help, garment factory, laundry and call centers are examples of work counting toward the 40 hour requirement. Qualified programs like education andtreatment for alcohol and drug addictions take priority over work program assignments and create conflicts with scheduling. The average AIC population decreased through the year, while the numberof compliant AICs remained steady until the end of the year. Impacts from COVID related quarantines and work program suspensions through OCE will impact these numbers. However, the number ofAIC jobs needed to support institution operations remained relatively unchanged. Limited funding for programs and staff support will not allow us to reach all those in need. Outside work crews arelimited by the amount of funding public entities have available to finance those activities, coupled with the continued restrictions barring sex offenders from outside work crews reduces the number ofinmates available for these crews. OCE continues to work on expansion of work opportunities offered, yet continues to struggle to fund overtime salaries for correctional officer staffing to supportexpansion efforts. Despite the difficulties, OCE averaged just over 1,400 inmates participating in its programs, a number similar to the previous reporting period. While the Department and OCE addpositions every year, fluctuation in the inmate population inhibits the Department’s ability to increase the percentage assigned to qualifying assignments.
actual target

The Department will continue to evaluate future job market trends and offer work and programming opportunities to provide the skills necessary for AICs to obtain employment in industries wherethere is projected growth for job openings. Staff will continue to develop community relationships and innovative ways of supplying work crews for the needs of local communities (e.g., host agencycrews, etc.) in support of Ballot Measure 17. The Department has initiated teams to evaluate and identify the root causes of compliance issues at local institutions and will use its findings to identifyadditional opportunities for improvement within current programs. Oregon Corrections Enterprises continues to expand its Business Strategy Team through its Advisory Council to work with businessand community leaders. Their goal is to establish new work opportunities as well as grow Ballot Measure 17 compliant work programs across the state.

KPM #2 Successful Completion of Treatment, Education, and/or Cognitive Programming - Percentage of moderate/high-risk released Adults in Custody (AIC) with an identified education, cognitive,or treatment need who successfully completed at least one of the identified need programs before release.Data Collection Period: Jul 01 - Jun 30
* Upward Trend = positive result
Report Year 2016 2017 2018 2019 2020
High & Medium Risk Inmates That Receive Prioritized Corrections Plan ProgramActual 78.10% 80.92% 79.70% 78.42% No DataTarget 75% 75% 75% 80% 80%
How Are We DoingSince our last report (2016), a number of changes have been made that impact this measure. We have added new “education need” codes that identify AICs assessed as needing education butalready have a high school diploma or GED and, thus, are not prioritized for education programming. The codes enable us to exclude AICs that already have an education credential from the“education need” pool for reporting purposes. In addition, the DOC implemented a gender-responsive needs assessment tool (Women’s Risk Need Assessment [WRNA]) to better evaluate the areasof greatest risk of recidivism for our female population. Because this will impact needs assessment results and identification of programming needs for case planning, we have reevaluated how KPM#2 is capturing and reporting the programming needs of our residents. As a result, we are proposing revisions to KPM #2 to more clearly identify what is being measured and reported.
This work as not been completed yet and will update the report for this KPM soon.
Factors Affecting Results
actual target

KPM #3 Recidivism - Percent of offenders: 1. Arrested for a new crime within 3 years of release from a facility to parole/post-prison supervision; 2. Convicted of a new misdemeanor or felony within 3years of release from a facility to parole/post-prison supervision; AND 3. Incarcerated for a new felony within 3 years of release from a facility to parole/post-prison supervisionData Collection Period: Jan 01 - Dec 31
Report Year 2016 2017 2018 2019 2020
1. Arrests for a new crime within 3 years of releaseActual No Data No Data No Data 55% 55%Target TBD TBD TBD 40% 40%2. Convicted of a new misdemeanor or felony within 3 years of releaseActual No Data No Data No Data 42% 42%Target TBD TBD TBD 30% 30%3. Incarcerated for a new felony within 3 years of releaseActual No Data No Data No Data 18% 18%Target TBD TBD TBD 10% 10%
How Are We DoingSince the passage of HB 3194 (2013), which significantly expanded Oregon’s recidivism definition, the rate of those arrested for a new crime within 3 years of release and those convicted of a newcrime have remained consistent and those incarcerated for a new felony have increased slightly. These exceed the target rates for each measure.
Factors Affecting ResultsThe Department and county community corrections agencies put considerable effort into assessing and developing a comprehensive corrections plan that will address identified risks and needs. Thisincludes use of the Level of Service/Case Management Inventory (LS/CMI), a measure of risk and need factors, as well as a fully functional case management tool. In addition, in recent years thedepartment and counties have begun using the Women’s Risk Need Assessment (WRNA) tool which targets the female population. Ongoing system improvements have been made to better target
actual target

in-prison interventions and to conduct more careful and coordinated release planning. In addition, community corrections agencies, statewide, are working collaboratively with the Department toincrease the effective and efficient transition of inmates from prison to community supervision as evidenced by the Short Term Transitional Leave program. The efforts are supportive of the combinedcommitment to implement and enhance evidence-based practices throughout Oregon’s criminal justice system. Combined, these efforts should bolster the success of an adult in custody’s positive re-entry into society.
The Department continues to target interventions and resources on those at highest risk to commit new crimes as well as focus on the preparation and transition of adults in custody back into thecommunity with the ultimate goal of reducing future criminal behavior; however, we also recognize that in addition to our efforts there are many factors that impact recidivism to include individual localcounty practices.

KPM #4 Staff Assaults - The number of Class 1 assaults on individual staff per year.Data Collection Period: Jul 01 - Jun 30
* Upward Trend = negative result
Report Year 2016 2017 2018 2019 2020
Staff AssaultsActual No Data No Data No Data 95 121Target TBD TBD TBD 80 80
How Are We DoingODOC did not meet the KPM target for the 2020 reporting period. In 2019 there were 95 staff assaulted. This number increased to 121 staff assaulted in 2020.
Factors Affecting ResultsThis number unfortunately has increased from the previous year. There were 88 incidences in which staff were assaulted. While the majority of these assaults involved a single staff member, therewere 19 cases that involved two or more staff with 7 of these incidences resulting in 28 staff being assaulted. 38% of the staff assaults happened on a mental health unit.
The department will continue to implement the Oregon Accountability Model (OAM). This model, in part, requires staff to hold adults in custody accountable by providing both positive and negativeconsequences to inmate behavior and guiding offenders towards pro-social behavior. Another component of OAM is Correctional Case Management. Through this component the department targetsresources to those adults in custody who are most likely to recidivate by including employees in a multi-disciplinary case management approach. In addition, the department continues to engage inthe “Oregon Way” which is utilizing the principles of humanizing and normalizing. Normalizing an individual’s environment and creating humane conditions and interactions while incarcerated isbelieved to create safer prisons and communities through successful re-entry and lower recidivism.
actual target
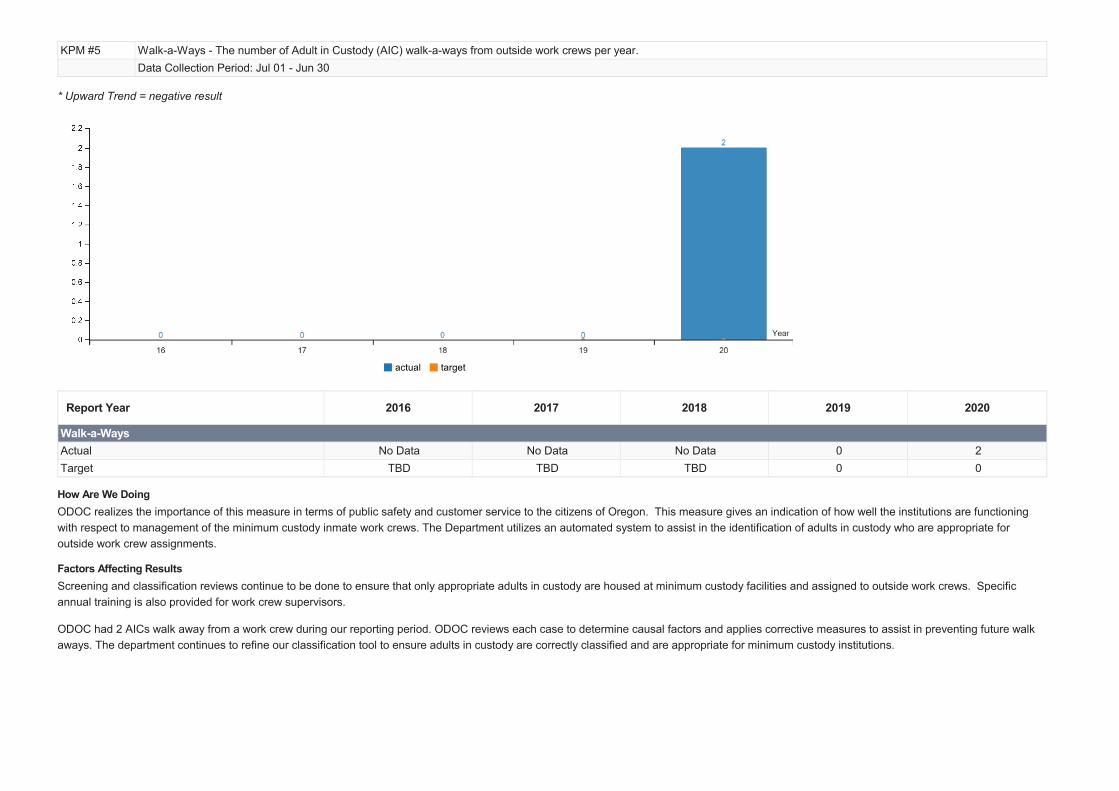
KPM #5 Walk-a-Ways - The number of Adult in Custody (AIC) walk-a-ways from outside work crews per year.Data Collection Period: Jul 01 - Jun 30
* Upward Trend = negative result
Report Year 2016 2017 2018 2019 2020
Walk-a-WaysActual No Data No Data No Data 0 2Target TBD TBD TBD 0 0
How Are We DoingODOC realizes the importance of this measure in terms of public safety and customer service to the citizens of Oregon. This measure gives an indication of how well the institutions are functioningwith respect to management of the minimum custody inmate work crews. The Department utilizes an automated system to assist in the identification of adults in custody who are appropriate foroutside work crew assignments.
Factors Affecting ResultsScreening and classification reviews continue to be done to ensure that only appropriate adults in custody are housed at minimum custody facilities and assigned to outside work crews. Specificannual training is also provided for work crew supervisors.
ODOC had 2 AICs walk away from a work crew during our reporting period. ODOC reviews each case to determine causal factors and applies corrective measures to assist in preventing future walkaways. The department continues to refine our classification tool to ensure adults in custody are correctly classified and are appropriate for minimum custody institutions.
actual target

KPM #6 Reduce all Energy Usage - Reduce the annual average electricity, propane, geothermal, diesel and natural gas usage. Measure on a monthly kBtu/square foot basis.Data Collection Period: Jul 01 - Jun 30
* Upward Trend = negative result
Report Year 2016 2017 2018 2019 2020
Reduce all Energy UsageActual No Data 158.50 153.23 150.71 150.86Target TBD 158.22 151.49 151.49 144.76
How Are We DoingODOC is at 8.9% energy reduction towards the 20% goal (compared to 2013 baseline year).
Factors Affecting ResultsThere are three sites meeting current target goals since baseline year. Climate changes in weather (compared to 30-year average weather conditions) is increasing usage. Due to older infrastructure,equipment failures and emergencies/pandemic have changed normal operations at various sites which has attributed to significant energy increases. Also, OCE operations (longer hours) impactsusage at several sites.
Our agency continues to work on improving education and awareness for employee and adults in custody engagement around behavior practices that effect energy usage. ODOC is in the sixth yearof energy challenges between the facilities and empowering green teams. Focus on procuring energy efficient equipment, adopting plug-load strategies and encouraging behavior changes willcontinue to help ODOC gain more traction to overall goals. ODOC had seven sites achieve 50001 Ready recognition through US DOE. These certifications are the first for prisons (and for non-industrial businesses) word wide.
actual target
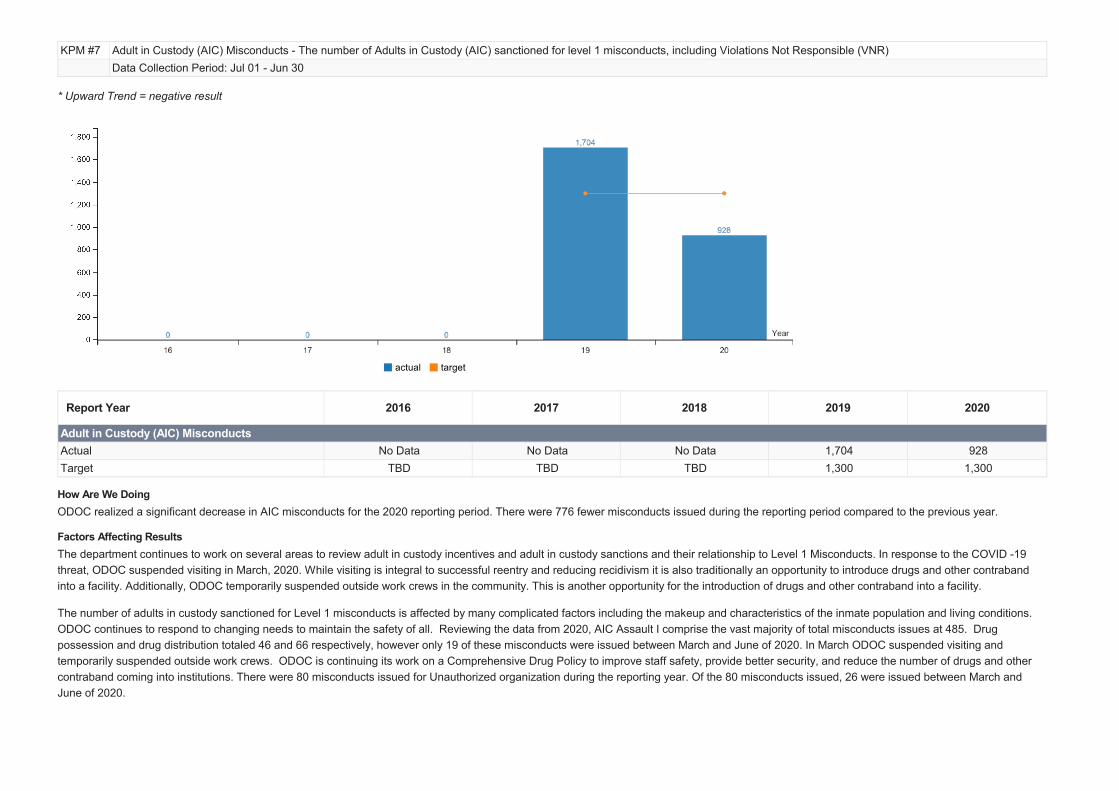
KPM #7 Adult in Custody (AIC) Misconducts - The number of Adults in Custody (AIC) sanctioned for level 1 misconducts, including Violations Not Responsible (VNR)Data Collection Period: Jul 01 - Jun 30
* Upward Trend = negative result
Report Year 2016 2017 2018 2019 2020
Adult in Custody (AIC) MisconductsActual No Data No Data No Data 1,704 928Target TBD TBD TBD 1,300 1,300
How Are We DoingODOC realized a significant decrease in AIC misconducts for the 2020 reporting period. There were 776 fewer misconducts issued during the reporting period compared to the previous year.
Factors Affecting ResultsThe department continues to work on several areas to review adult in custody incentives and adult in custody sanctions and their relationship to Level 1 Misconducts. In response to the COVID -19threat, ODOC suspended visiting in March, 2020. While visiting is integral to successful reentry and reducing recidivism it is also traditionally an opportunity to introduce drugs and other contrabandinto a facility. Additionally, ODOC temporarily suspended outside work crews in the community. This is another opportunity for the introduction of drugs and other contraband into a facility.
The number of adults in custody sanctioned for Level 1 misconducts is affected by many complicated factors including the makeup and characteristics of the inmate population and living conditions. ODOC continues to respond to changing needs to maintain the safety of all. Reviewing the data from 2020, AIC Assault I comprise the vast majority of total misconducts issues at 485. Drugpossession and drug distribution totaled 46 and 66 respectively, however only 19 of these misconducts were issued between March and June of 2020. In March ODOC suspended visiting andtemporarily suspended outside work crews. ODOC is continuing its work on a Comprehensive Drug Policy to improve staff safety, provide better security, and reduce the number of drugs and othercontraband coming into institutions. There were 80 misconducts issued for Unauthorized organization during the reporting year. Of the 80 misconducts issued, 26 were issued between March andJune of 2020.
actual target

KPM #8 Secure Custody Escapes - The number of escapes per year from secure-custody facilities (armed perimeter).Data Collection Period: Jul 01 - Jun 30
* Upward Trend = negative result
Report Year 2016 2017 2018 2019 2020
Annual escapes from secure-custody facilitiesActual 0 0 0 0 0Target 0 0 0 0 0
How Are We DoingODOC realizes the criticality of this measure in terms of public safety and customer service to the citizens of Oregon. This performance measure gives an indication of how well the institutions arefunctioning. It also, is an indicator of the effectiveness of the Oregon Accountability Model (OAM). This model, in part, requires staff to hold adults in custody accountable by providing both positiveand negative consequences to inmate behavior and guiding offenders towards pro-social behavior. Another component of OAM is Correctional Case Management. Through this component thedepartment targets resources to those adults in custody who are most likely to recidivate by including employees in a multi-disciplinary case management approach.
Factors Affecting ResultsEach escape is reviewed to identify the causal factors and determine if architectural design, equipment, or staff training needs to be addressed. Protective measures are initiated as identified andneeded by these reviews. A review is conducted for any incident. The results of the review and any security recommendations are made to the Superintendent of the institution. The Oregon StatePolice, county and local police agencies and the department’s Special Investigations Unit work together to quickly apprehend escapees. Annual Security Audits are conducted to test and reviewsecurity practices to guard against breaches in security.
When an escape does occur from an armed facility, the incident is reviewed to identify causal factors, deficiencies, and determine a course of action. ODOC will continue to hold staff to this highstandard.
actual target

KPM #9 Unarmed Perimeter Escapes - The number of escapes from DOC unarmed perimeter facilities.Data Collection Period: Jul 01 - Jun 30
* Upward Trend = negative result
Report Year 2016 2017 2018 2019 2020
The number of escapes from DOC unarmed perimeter facilitiesActual 4 0 0 0 0Target 0 0 0 0 0
How Are We DoingODOC realizes the criticality of this measure in terms of public safety and customer service to the citizens of Oregon. This performance measure gives an indication of how well the institutions arefunctioning. There is no such thing as an acceptable escape. The department has approximately 2,991 minimum-custody beds. The department continues to refine our classification tools to ensureadults in custody are correctly classified and are appropriate for minimum custody housing.
Factors Affecting ResultsEach escape is reviewed to identify the causal factors and determine if architectural design, equipment, or staff training needs to be addressed. Protective measures are initiated as identified andneeded by these reviews. A review is conducted for any incident. The results of the review and any security recommendations are made to the Superintendent of the institution. The Oregon StatePolice, county and local police agencies and the department’s Special Investigations Unit work together to quickly apprehend escapees. Annual Security Audits are conducted to test and reviewsecurity practices to guard against breaches in security.
When an escape does occur from an unarmed facility, the incident is reviewed to identify causal factors, deficiencies, and determine a course of action. ODOC will continue to hold staff to this highstandard. The department continues to refine our classification tool to ensure adults in custody are correctly classified as minimum custody and are appropriate for minimum custody institutions.
actual target

KPM #10 Leave Programs - The percentage of Adults in Custody (AIC) who complete transitional leave and non-prison leave (AIP)Data Collection Period: Jan 01 - Dec 31
* Upward Trend = positive result
Report Year 2016 2017 2018 2019 2020
Leave ProgramsActual No Data No Data No Data 86.55% 85.40%Target TBD TBD TBD 90% 85%
How Are We DoingThis KPM reflects the performance of two varieties of DOC transitional leave programs: Non-Prison Leave associated with the Alternative Incarceration Programs (AIP), and Short Term TransitionalLeave (STTL).
The Oregon Department of Corrections offers alcohol and drug treatment as well as cognitive Alternative Incarceration Programs (AIP) to inmates who have been sentenced by a judge as eligible forAIP, and who apply to participate and meet other statutory and Department policy requirements to participate. The programs are based on intensive interventions targeted at criminogenic risks,rigorous personal responsibility and accountability, physical labor, and service to the community. Additionally, AIP consists of an institutional phase for a minimum of 180 days, followed by a period ofnon-prison leave of up to 90 days, for a total minimum program length of 270 days. During the institutional phase, these programs provide 14 to 16 hours of highly structured and regimented routineevery day for a minimum of 180 days. Adults in Custody (AIC) who are eligible to participate in AIP are screened through the multidisciplinary Treatment Assignment Screening Committee todetermine the most appropriate program to meet the AICs’ needs.
The Department also offers STTL of up to 120 days to inmates who are not enrolled in an Alternative Incarceration Program. As with AIP/Non-Prison Leave, AICs must meet the statutory anddepartment policy requirements to be approved for Short Term Transitional Leave. Regardless of whether it is Non-Prison Leave or Short Term Transitional Leave, offenders are closely monitored forcompliance with their transition plans while in the community. The higher the percentage of successful completions, the greater the success.
actual target

For the 2019-20 reporting period, the transitional leave completion rate for STTL declined (83.53%) when compared with the 2018-19 reporting period, while the completion rate for AIP Non-PrisonLeave increased (90.92%) when compared with the 2018-19 reporting period.
Short Term Transitional Leave participation rates for this reporting period increased from an average rate of 126 per month in 2018-2019 to an average 127 per month, representing approximatelyone quarter of the monthly releasing population. A key barrier to increasing the participation rate for all transitional leave programs going forward is inadequate housing in the community. An additionalbarrier to increasing AIP transitional leave participation is limited treatment program bed space, which must be used for both AIP and non-AIP participants.
DOC continues to review, refine and streamline its internal processes to ensure it is targeting those most appropriate for STTL. This includes development of automation designed to further increaseboth efficiency and effectiveness of the process, as well as substantially improve both the quality and quantity of data collected and analyzed. Phase I of automation was completed in 2017 and PhaseII, which was designed to greatly enhance efficiency and the ability for all stakeholders to track individual offender history and current STTL status, rolled out September 2019. Work on Phase III,aimed at greatly improving data collection efficiency as well as quality and quantity of program data, is set to begin in the near future. In addition to automation efforts, DOC continues its focus ondeveloping solid transition plans that will increase the successful reintegration of all AICs, into the community.
Factors Affecting ResultsSTTL figures remain down from the 2016-17 reporting period during which DOC further tightened standards for successful completion of STTL in order to maintain program integrity and public safety. Additionally, as anticipated, the rate of STTL failure has increased due to the expansion of STTL from 90 to 120 days, which increased the amount of time that AICs are out on STTL in thecommunity.
High standards remain in place for those AICs granted Non-Prison or Short Term Transitional Leave. Statutorily eligible AICs who have not met Department policy requirements are not granted leave,which is one of the primary reasons success rates of offenders on leave continues to be high. Approved transitional housing continues to be a problem for some AICs who are completing the in-prisonportion of AIP or releasing onto STTL from a substance use disorder (SUD) program. When AICs complete the in-prison portion of the programs and do not have approved housing in their communitythey are returned to general population until their release date. The SUD programs try to keep them engaged in some level of day-treatment until they release, but that is not always possible.

KPM #11 Customer Service - Percent of customers rating their satisfaction with the agency customer service as "good" or "excellent": overall customer service, timeliness, accuracy, helpfulness,expertise and availability of information.Data Collection Period: Jan 01 - Jan 01
Report Year 2016 2017 2018 2019 2020
1. ExpertiseActual 66.80% No Data 64.20% No Data 76.30%Target 90% 90% 80% 80% 80%2. AccuracyActual 67.80% No Data 65.70% No Data 78.10%Target 90% 90% 80% 80% 80%3. HelpfulnessActual 52.90% No Data 51.20% No Data 62.10%Target 90% 90% 80% 80% 80%4. TimelinessActual 55.30% No Data 53.20% No Data 69.70%Target 90% 90% 80% 80% 80%5. Availability of InformationActual 64.90% No Data 56.30% No Data 58%Target 90% 90% 80% 80% 80%6. OverallActual 55.50% No Data 51.10% No Data 65.60%Target 90% 90% 80% 80% 80%
How Are We Doing
actual target

In previous reporting periods, we were only able to obtain 317 (2018) and 316 (2016) responses. This year we were able to add email to our outreach efforts and in a one-month period received 850responses. The visitors that responded to our survey rated the agency as “good” or “excellent” in the following visiting customer-service categories.
2020 2018 ImprovementTimeliness 69.7% 53.2% 16.50%
Accuracy 78.1% 65.7% 12.40%
Helpfulness 62.1% 51.2% 10.90%
Expertise 76.3% 64.2% 12.10%
Availability of Information 58.0% 56.3% 1.70%
Overall Service 65.6% 51.1% 14.50%We have improved in every area of measurement.
Factors Affecting ResultsIn the past, this biennial measure was advertised through visiting rooms, social media, and the Agency website. Participants used personal devices to complete the online survey over a three-monthperiod. The survey collects limited personal information to encourage the participant to be candid when responding. For these reasons, we have no way of knowing if the same people are completingthe survey every two years nor do we have ways to confirm their visiting location, frequency, or status.
We delayed the start of the 2020survey hoping that in-person visiting could be resumed before it was conducted. However, at the time of this report visiting is still paused due to the COVID-19pandemic. Because of our delay in starting the survey, we only had one month, instead of three months, in which to conduct the survey. As a result of work with our IT to modify our data system andthrough the work of Visiting and Communications staff, we were able to add email to our survey advertisement. Because in-person visiting had been prohibited for five months during the surveyperiod, we anticipated this COVID restriction would have an overall negative impact on our visitors’ responses.
Visitation in a prison can be inherently stressful and emotional and it is assumed that those visiting generally dislike the visiting process. Security staff in visiting posts rotate every six months, makingit more challenging to adjust and sustain customer service norms. Nevertheless, the Agency chose this customer service measure, anticipating the target of 80% would be difficult to achieve, becausethis stakeholder group is very important to us.
Research shows maintaining positive family and friend connections through visiting reduces recidivism. To overcome some of the inherent negativity associated with prison visitation, DOC used thedata from the 2016 and 2018 surveys to implement process improvements, revise OAR 291-127 to reduce barriers to visitation for guests, provide trauma-informed care/approach (TIC) training forsome of its visiting staff, and obtained federal technical assistance grants and worked with community-based organizations to find ways to improve its visiting environments and experiences. Muchwork has gone into improving our performance in this area, and we think this is reflected in the survey results - despite the negative impact of the months-long halt to in-person visiting due to COVID.
Even with this progress, there is still much room for improvement.
TIC Training - The prison visiting experience can be stressful, and especially traumatic for children. In 2019, through a federal grant, we began providing trauma-informed care/approach (TIC)training for two institutions’ visiting staff to help them be more effective in their work with our visitors. In addition, we received a second federal technical assistance grant that provided train-the-trainer TIC training, which has equipped DOC with multiple certified trainers to provide in-depth TIC training to other key personnel. General TIC training is scheduled to be provided to all DOCstaff as part of the 2021 annual service training curriculum. Despite a 12.10-percent improvement in expertise, 23.7 percent of respondents still rated DOC visiting staff expertise as fair or poor. We did improve by 14.50 percent in our overall service,but 32.0 percent of respondents still reported our overall service as fair or poor. We anticipate providing additional training to our administrative visiting staff and believe the TIC trainingprovided to the institution (security) visiting staff will have a positive impact on this measure.We had a small improvement in availability of information, but it is still only at 58 percent positive. DOC was recently able to revise and upgrade its web page, and we anticipate additionalwebsite work to make visitors’ and potential visitors’ access to our information and resources easier to find, complete, and submit.

KPM #12 Offsite Medical Healthcare - Percent of total Adult in Custody (AIC) healthcare encounters that occur offsite.Data Collection Period: Jul 01 - Jun 30
* Upward Trend = negative result
Report Year 2016 2017 2018 2019 2020
Percent of Total Inmate Offsite EncoutersActual 0.78% 0.68% 1.03% 0.98% 1.78%Target 1% 1% 1% 1% 1%
How Are We DoingHS is doing great. Our staff manages and treats our patients with great efficiency and care.
Factors Affecting ResultsAlthough we saw a 5% increase in onsite patient care we also saw a 57% increase in offsite patient care during the same time period. This increase is due to several factors including our population iscoming in sicker and requiring more specialty care offsite.
actual target

KPM #13 OSHA Recordable Rate - Average number of OSHA recordable injuries per 100 employees who work a whole year.Data Collection Period: Jan 01 - Dec 31
* Upward Trend = negative result
Report Year 2016 2017 2018 2019 2020
OSHA Recordable RateActual No Data No Data No Data 2.80 3.10Target TBD TBD TBD 0 6.50
How Are We DoingDoing well. the Based upon latest OSHA National Average Recordable rate of all Correctional facilities across the USA is 7.3
Factors Affecting ResultsEffective Safety Committees, Statewide Workers Compensation management
actual target