corporation income tax returns, 1994 · corporation income tax returns, 1994 50 by madeline deming...
TRANSCRIPT
Corporation Income Tax Returns, 1994
50
by Madeline Deming Boerner
p
re-tax corporation profits for Tax Year 1994 were$577.3 billion, a gain of 15.9 percent from theprevious year, extending the upward growth trend
seen since the end of the 1990-1991 recession. DuringTax Year 1994, corporate sales and other receipts grewnearly $ 1. 1 billion, an 8.9 percent increase, while deductions increased. 8.6 percent, to a total of $12.8 billion.More important, the number of profit-reporting companiesrose 11.6 percent, nearly tripling the growth rate of3.9percent reported for Tax Year 1993. Profits for thesecompanies climbed $80.8 billion, up 12.3 percent, to$739.5 billion. Moreover, although the number ofcompa-nies reporting deficits increased 7.1 percent for Tax Year1994; total corporate net-losses increased only -L I percentto $1612 billion.
The increase in positive net income led to a 13.1 per-cent gain in "income subject to tax" (the tax base forregular income tax purposes) to $494.0 billion. This gain,in part,.prompted the regular corporation income tax(before tax credits) to climb from $149.0 I~illion for-19-93-to $167.5 billion for 1994. Similarly, total income taxafter credits (the amount payable to the U.S. Government)increased t 15.6 billion from $119.9 billion for 1993 to$135.5 billion.
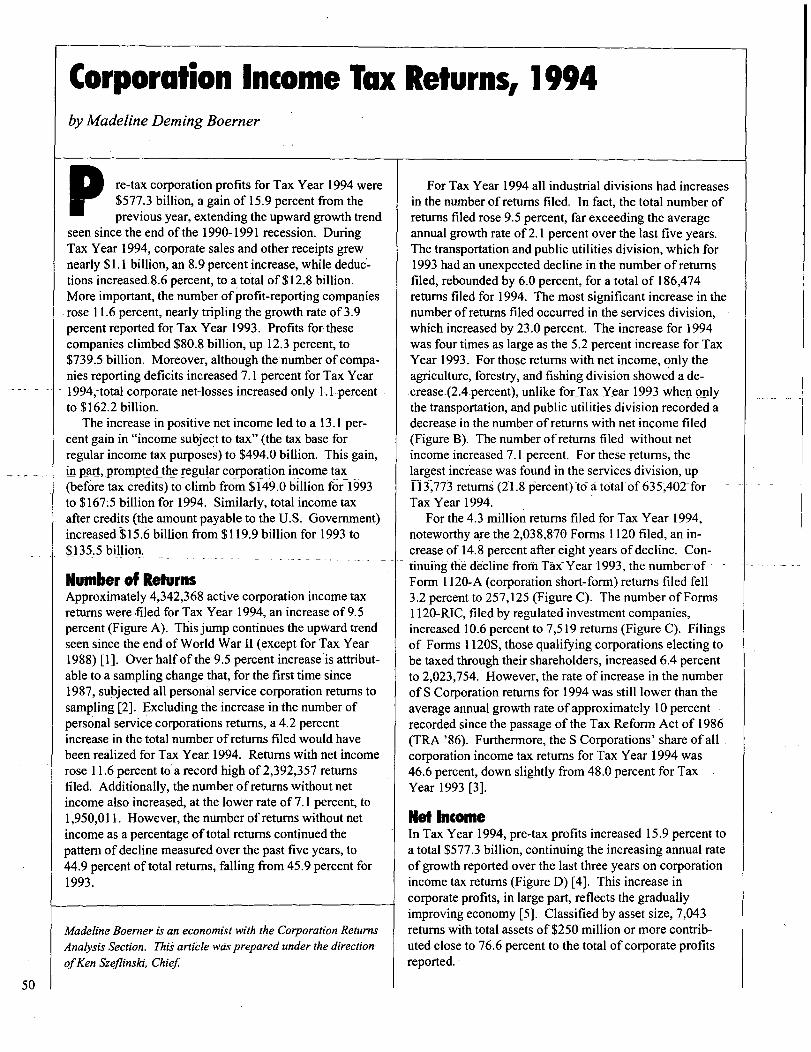
Number of ReturnsApproximately 4,342,368 active corporation income taxreturns werefiled for Tax Year 1994, an increase of 9.5percent (Figure A). This jump continues the upward trendseen since the end of World War 11 (except for Tax Year1988) [1]. Over half of the 9.5 percent increase is attribut-able to a sampling change that, for the first time since1987, subjected all personal service corporation returns tosampling [2]. Excluding the increase in the number ofpersonal service corporations returns, a 4.2 percentincrease in the total number ofreturns filed would havebeen realized for Tax Year. 1994. Returns with net incomerose 11.6 percent to'a record high of 2,392,357 returnsfiled. Additionally, the number ofreturns without netincome also increased, at the lower rate of7.1 percent, to1,950,011. However, the number of returns without netincome as a percentage of total returns continued thepattern ofdecline measured over the past five years, to44.9 percent of total returns, falling from 45.9 percent for1993.
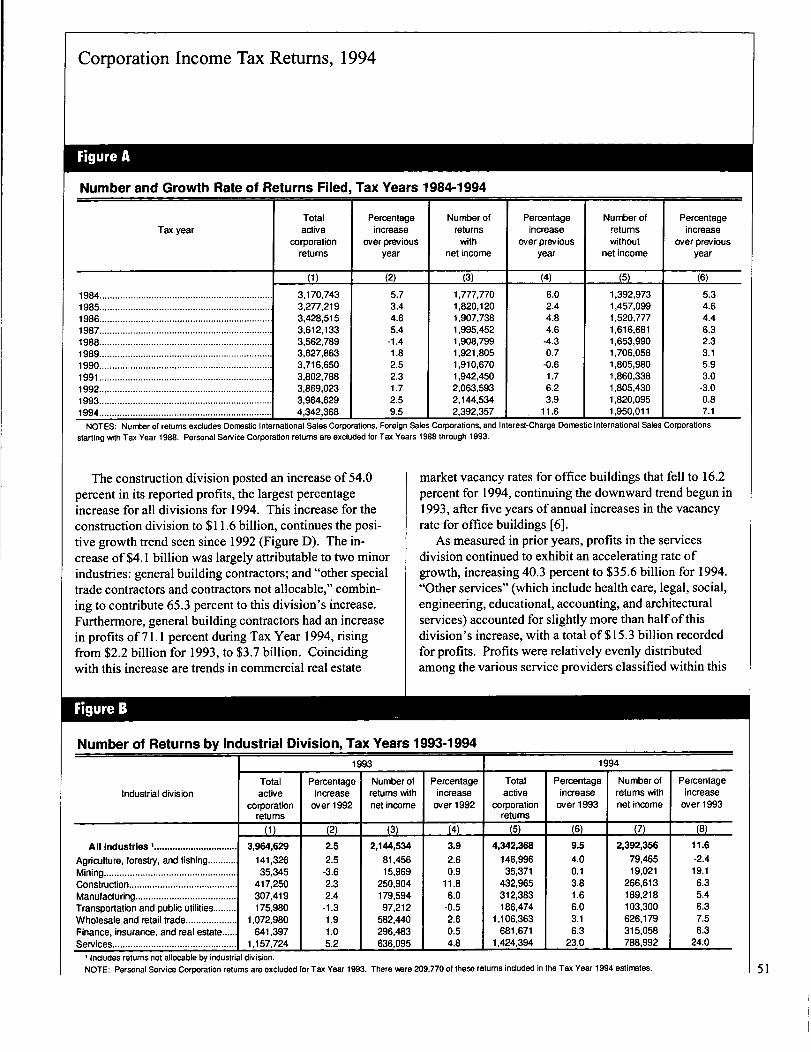
For Tax Year 1994 all industrial divisions had increasesin the number of returns filed. In fact, the total number ofreturns filed rose 9.5 percent, far exceeding the averageannual growth rate of2. 1 percent over the last five years.The transportation and public utilities division, which for1993 had an unexpected decline in the number ofreturnsfiled, rebounded by 6.0 percent, for a total of 186,474returns filed for 1994. The most significant increase in thenumber of returns filed occurred in the services division,which increased by 23.0 percent. The increase for 1994was four times as large as the 5.2 percent increase for TaxYear 1993. For those returns with net income, only theagriculture, forestry, and fishing division showed a de--crease-(2.4-percent), unlike for-Tax Year 1,993 when onlythe transportation, and public utilities division recorded adecrease in the number of returns with net income filed(Figure B). The number of returns filed without netincome increased 7.1 percent. For these returns, thelargest increase was found in the services division, up113,773 retu rns (21.8 percent) -to a total-of 635,402-forTax Year 1994.
For the 4.3 million returns filed for Tax Year 1994,noteworthy are the 2,038,870 Forms 1 120 filed, an in-crease of 14.8 percent after eight years ofdecline. Con-timing the decline-froni TaxYear 1993, the number-of -Form I I 20-A (corporation short-form) returns filed fell3.2 percent to 257,125 (Figure Q. The number of Forms1120-RIC, filed by regulated investment companies,increased 10.6 percent to 7,519 returns (Figure C). Filingsof Forms I 120S, those qualifying corporations electing tobe taxed through their shareholders, increased 6.4 percentto 2,023,754. However, the rate of increase in the numberofS Corporation returns for 1994 was still lower than theaverage annual growth rate of approximately 10 percentrecorded since the passage of the Tax Reform Act of 1986(TRA '86). Furthermore, the S Corporations' share ofallcorporation income tax returns for Tax Year 1994 was46.6 percent, down slightly from 48.0 percent for TaxYear 1993 [3].
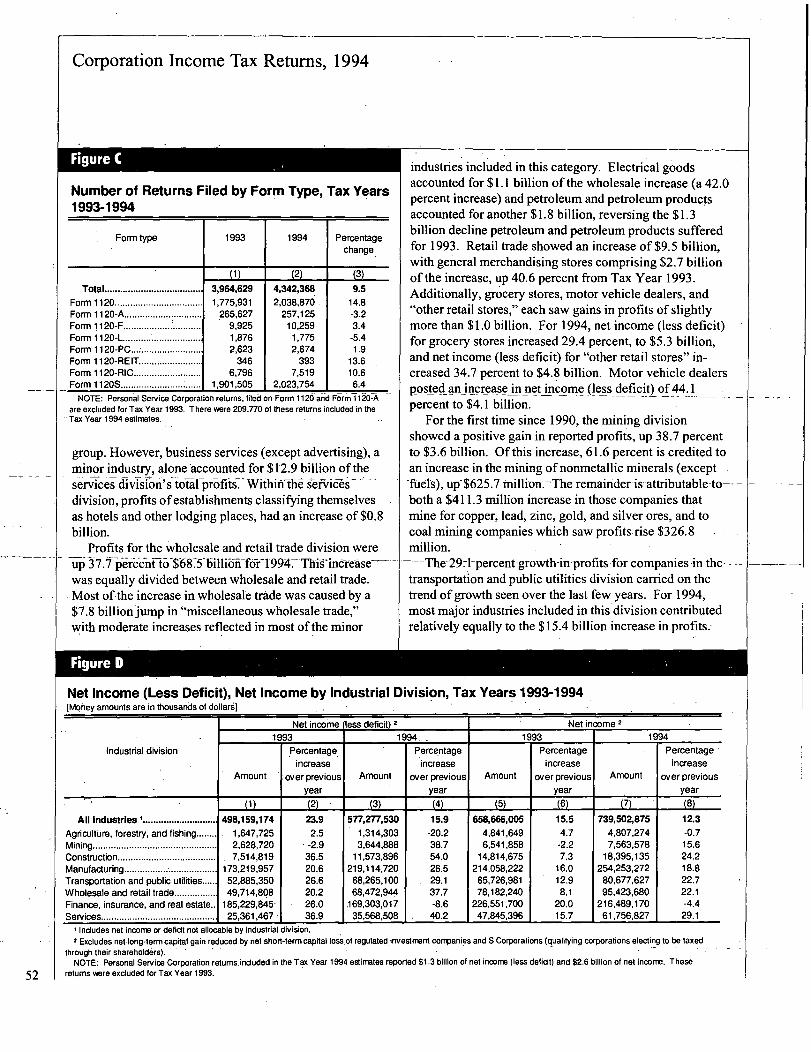
Net IncomeIn Tax Year 1994, pre-tax profits increased 15.9 percent toa total $577.3 billion, continuing the increasing annual rateof growth reported over the last three years on corporationincome tax returns (Figure D) [4]. This increase incorporate profits, in large part, reflects the gradually
Madeline Boerner is an economist with the Corporation ReturnsAnalysis Section. This article was prepared under the directionofKen Szeflinski, Chief.
improving economy [5]. Classified by asset size, 7,043returns with total assets of$250 million or more contrib-uted close to 76.6 percent to the total ofcorporate profitsreported. -
Corporation Income Tax Returns, 1994
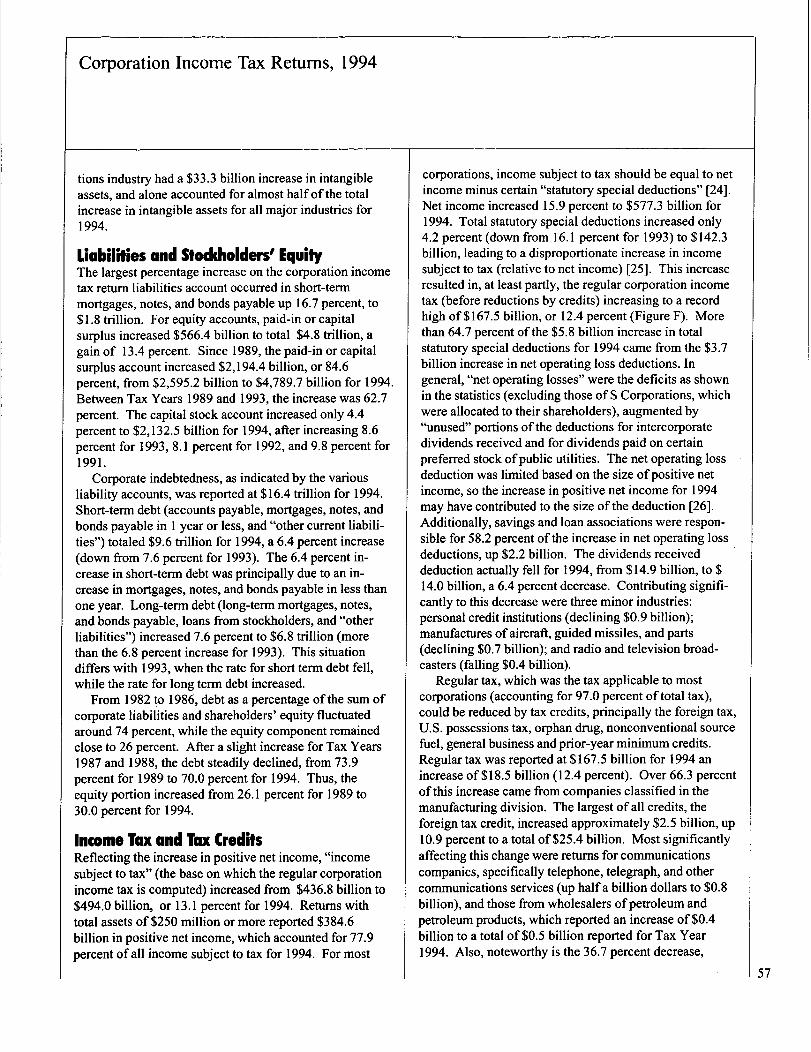
Figure A
Number and Growth Rate of Returns Filed, Tax Years 1984-1994
Tax yearTotal
activecorporation
returns
Percentageincrease
over previousyear
Number ofreturns
withnet income
Percentageincrease
over previousyear
Number ofreturnswithout
net income
Percentageincrease
over previousyear
(1) -(2) (3) (4) (5) (6)
1984 .................................................................. 3,170,743 5.7 1,777,770 6.0 1,392,973 5.31985 .................................................................. 3,277,219 3.4 1,820,120 2.4 1,457,099 4.61986 .................................................................. 3,428,515 4.6 1,907,738 4.8 1,520,777 4.41987 .................................................................. 3,612,133 5.4 1,995,452 4.6 1,616,681 6.31988.................................................................. 3,562,789 -1.4 1,908,799 -4.3 1,653,990 2.31989................................................................... 3,627,863 1.8 1,921,805 0.7 1,706,058 3.11990................................................................... 3,716,650 2.5 1,910,670 -0.6 1,805,980 5.91991 ................................................................... 3,802,788 2.3 1,942,450 1.7 1,860,338 3.01992................................................................... 3,869,023 1.7 2,063,593 6.2 1,805,430 -3.01993................................................................... 3,964,629 2.5 2,144,534 3.9 1,820,095 0.81994................................................................... 4,342,368 9.5 2,392,357 11.6 1,950,011 7.1
NOTES: Number of returns excludes Domestic International Sales Corporations, Foreign Sales Corporations, and Interest-Charge Domestic International Sales Corporations
starting with Tax Year 1988. Personal Service Corporation returns are excluded for Tax Years 1988 through 1993.
The construction division posted an increase of 54.0percent in its reported profits, the largest percentageincrease for all divisions for 1994. This increase for theconstruction division to $11.6 billion, continues the posi-tive growth trend seen since 1992 (Figure D). The in-crease of $4.1 billion was largely attributable to two minorindustries: general building contractors; and "other specialtrade contractors and contractors not allocable," combin-ing to contribute 65.3 percent to this division's increase.Furthermore, general building contractors had an increasein profits of7 1. 1 percent during Tax Year 1994, risingfrom $2.2 billion for 1993, to $3.7 billion. Coincidingwith this increase are trends in commercial real estate
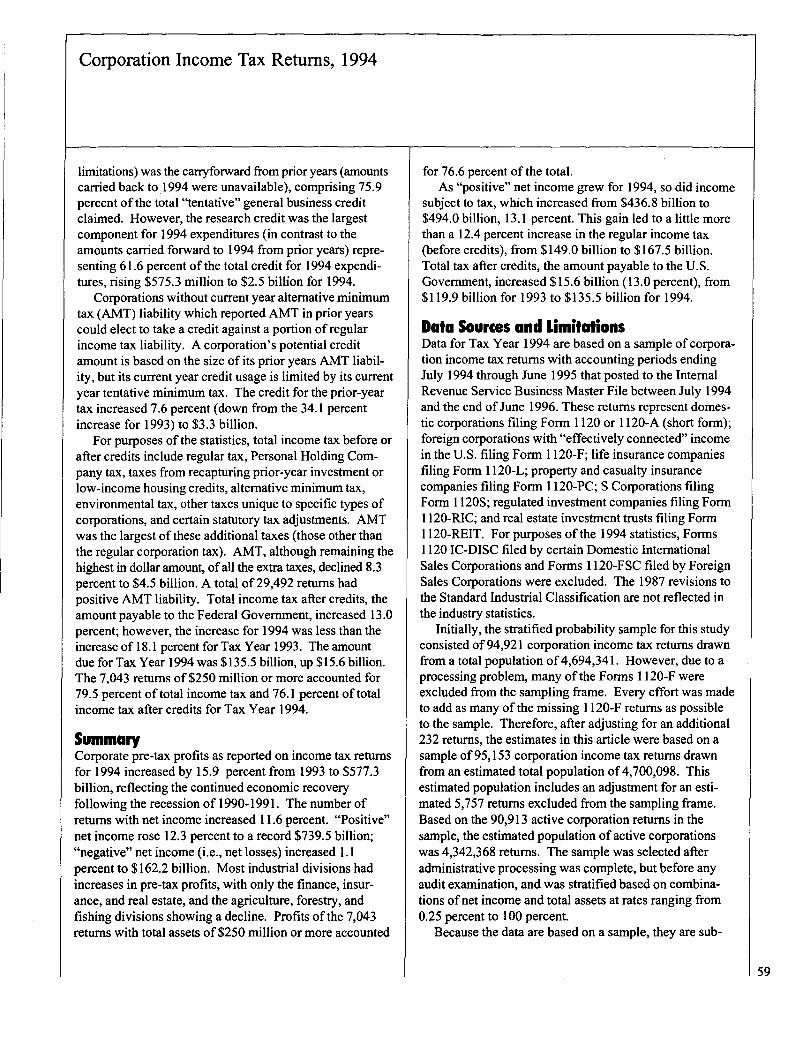
Figure B
market vacancy rates for office buildings that fell to 16.2percent for 1994, continuing the downward trend begun in1993, after five years of annual increases in the vacancyrate for office buildings [6].
As measured in prior years, profits in the servicesdivision continued to exhibit an accelerating rate ofgrowth, increasing 40.3 percent to $35.6 billion for 1994."Other services" (which include health care, legal, social,engineering, educational, accounting, and architecturalservices) accounted for slightly more than halfof thisdivision's increase, with a total of$15.3 billion recordedfor profits. Profits were relatively evenly distributedamong the various service providers classified within this
Number of Returns by Industrial Division, Tax Years 1993-1994
Industrial division
All Industries I ................................
Agriculture, forestry, and fishing ...........Mining ...................................................Construction ..........................................Manufacturing .......................................Transportation and public utilitiesWholesale and retail trade....................Finance, insurance, and real estate ......Services................................................
Totalactive
corporationreturns
-LI)3,964,629
141,32635,345
417,250307,419175,980
1,072,980641,397
1,157,724
Percentageincrease
over1992
L2
2.5
2.5-3.62.32.4
-1.31.91.05.2
1993
Number ofreturns withnet income
J3)
2,144,53481,45615,969
250,904179,594
97,212582,440296,483636,095
Percentageincrease
over1992
_L41
3.92.60.9
11.86.0
-0.52.60.54.8
Totalactive
corporationreturns
(5)
4,342,368146,99635,371
432,965312,383186,474
1,106,363681,671
1,424,394
Percentageincrease
over1993
9.54.00.13.81.66.03.16.3
23.0
1994
Numberofreturns withnet income
L7)
2,392,356
79,46519,021
266,613189,218103,300626,179315,058788,992
Percentageincrease
over1993
11.6-2.419.16.35.46.37.56.3
24.0
I Includes returns not allocable by industrial division.
NOTE: Personal Service Corporation returns are excluded for Tax Year 1993. There vere 209,770 of these returns included in the Tax Year 1994 estimates. 51
Corporation Income Tax Returns, 1994
Figure C
Number of Returns Filed by Form Type, Tax Years1993-1994
Form type
Total......................................
Form 1120 ..................................
Form 11 20-A..............................
Form 1120-F ................... ............
Form 1120-L...............................
Form 1120-PC... :........................
Form 1120-RE IT.........................
Form 1120-RIC ................. ; ........
Form 11 20S ...............................
1993
(1)3,964,6291,775,931
~265,6279,9251,8762,623
3466,796
1,901,505
1994
(2)
4,342,3682,038,870
257,12510,2591,7752,674
3937,519
2,023,754
Percentagechange
(3)9.5
14.8-3.23.4
-5.41.9
13.610.66.4
NOTE: Personal Service Corporation returns, filed on Form 1120 and Form 1120-A
are excluded for Tax Year 1993. There were 209,770 of these returns included in theTax Year 1994 estimates.
group. However, business services (except advertising), aminor industry, aloneaccounted for $12.9 billion of theservices divisiori~~to~ta-l-pr-ofi-ts-.-Wi-thiifth-e ser_vicds*-___division, profits ofestablishments classifying themselvesas hotels and other lodging places, had an increase of $0.8billion.
Profits for the wholesale and retail trade division wereu-p--~7.1-p-er~~6nf-tb-$68.-5-billi6n-fiYf 19947. Thi§-increase--was equally divided between wholesale and retail trade.Most of the increase in wholesale trade was caused by a$7.8 billionjump in "miscellaneous wholesale trade,"with moderate increases reflected in most of the minor
Figure D
industries included in this category. Electrical goodsaccounted for $ 1.1 billion of the wholesale increase (a 42.0percent increase) and petroleum and petroleum productsaccounted for another $1.8 billion, reversing the $1.3billion decline petroleum and petroleum products sufferedfor 1993. Retail trade showed an increase of $9.5 billion,with general merchandising stores comprising $2.7 billionof the increase, up 40.6 percent from Tax Year 1993.Additionally, grocery stores, motor vehicle dealers, and"other retail stores," each saw gains in profits ofslightlymore than $ 1.0 billion. For 1994, net income (less deficit)for grocery stores increased 29.4 percent, to $5.3 billion,and net income (less deficit) for "other retail stores" in-creased 34.7 percent to $4.8 billion. Motor vehicle dealersposted anjincrease in net income (less
-defic i t) of44.1
percent to $4.1 billion.For the first time since 1990, the mining division
showed a positive gain in reported profits, up 38.7 percentto $3.6 billion. Of this increase, 61.6 percent is credited toan increase in the mining ofnonmetallic minerals (except-fuels), up-$625.7 million.-The remairider-is attributable-to-- -both a $411.3 million increase in those companies thatmine for copper, lead, zinc, gold, and silver ores, and tocoal mining companies which saw profits. rise $326.8million.
---The-29.-I-percent-growth-in-profits-for companies -in-the- - --transportat ion and public utilities division carried on thetrend ofgrowth seen over the last few years. For 1994,most major industries included in this division contributedrelatively equally to the $15.4 billion increase in profits.
Net Income (Less Deficit), Net Income,by Industrial Division, Tax Years 1993-1994[Money amounts are in thousands of dollar~j
Net income less deficit) 2 Net income 2
1993 1994 1993 1994
Industrial division Percentage, Percentage Percentage Percentageincrease increase increase increase
Amount overprevious Amount aver previous Amount over previous Amount over previousyear year year year
(1) (2) (3) (4) (5) (6) (7) (8)
All Industries I..; .......................... 498,159,174 23.19 5779277,530 15.9 658,666,005 15.5 739,502,875 12.3
Agriculture, forestry, and fishing ........ , 1,647,725 2.5 1,314,303 -20.2 4,841,649 4.7 4,807,274 -0.7Mining ................................................ 2,628,720 -2.9 3,644,888 38.7 6,541,858 -2.2 7,563,578 15.6Construction...................................... 7,514,819 36.5 11,573,896 54.0 14,814,675 7.3 18,395,135 24.2Manufacturing .................................... 1 /j, 19,957 20.6 219,114,720 26.5 214,058,222 16.0 254,253,272 18.8Transportation and public utilities ...... 52,885,350 26.6 68,265,100 29.1 65,726,981 12.9 80,677,627 22.7Wholesale and retail trade ................ 49,714,808 20.2 68,472,944 37.7 78,182,240 8.1 95,423,680 22.1Finance, insurance, and real estate.. 185,229,845- 26.0 .169,303,017 -8.6 226,551,700 20.0 216,489,170 -4.4Services ............................................. 25,361,467', 36.9 , 35,568,508 40.2 47,845,396 15.7 , 61,756,827 29.1
52
Includes net income or deficit not allocable by industrial division.
2 Excludes net long-term capital gain reduced by net short-term capital loss of regulatedinvestment companies and S Corporations (qualifying corporations electing to be taxed
through their shareholders).NOTE: Personal Service Corporation retums,included in the Tax Year 1994 estimates reported $1.3 billion of net income (less deficit) and $2.6 billion of net income. These
returns were excluded for Tax Year 1993.

Corporation Income Tax Returns, 1994
Most significant was the $5.9 billion increase in profits inthe communications sector, up 23.5 percent. Growth in thecommunications sector is predicted to increase rapidly inthe next few years as the technology allowing for wirelesscommunication lures single service providers, such astelephone companies, to augment their services to includeadditional types ofcommunications technology, such ascable services. Only the minor industries ofgas producersand distributors, transportation companies involved in pipeline transportation (except for natural gas), and transporta-tion by air companies reported losses, down 9.2 percent,8.4 percent, and 78.5 percent, respectively.
For Tax Year 1994, net income (less deficit) for manu-facturers increased 26.5 percent, or $45.9 billion. Withinthis division, some significant changes occurred betweenTax Year 1994 and Tax Year 1993. Profits for producersof chemical and allied products rose 28.1 percent, to $44.1billion. This major industry alone accounted for 21.1percent of all ofmanufacturer's increase in profits. Sig-nificant changes were also realized in other major indus-tries: profits for electrical and electronic equipment suppli-ers rose $8.6 billion; manufacturers of instruments andrelated products had an increase of$4.9 billion, to a totalof $11.5 billion; tobacco manufacturers' profits increased56.7 percent, or $3.1 billion; the primary metal industryhad positive net income (less deficit) of $3.3 billion, ascompared with $ -0.9 billion for Tax Year 1993; andpetroleum refining and related minor industries had an18.0 percent decrease in profits posted, down from $21.5billion for 1993, to $17.6 billion for 1994.
Only two of the nine industrial divisions had decreasesin profits: the finance, insurance, and real estate division'sprofits fell 8.6 percent, and the agriculture, forestry, andfishing division's profits dropped 20.2 percent. The bulkof the decline in the finance, insurance, and real estatedivision was attributable to insurance-related companies.About 84.1 percent of this division's decline, or $13.4billion, is equally spread among three minor insuranceindustries: mutual life insurance, mutual insurance, and"other insurance companies." During Tax Year 1994,property and casualty insurers experienced catastrophiclosses, with claims for environmental and asbestos (E&A)losses primarily responsible for the decrease in profits [7].There was also a notable decline in profits for banks(except mutual savings banks and bank holding compa-nies) which contributed another $3.0 billion to thedivision's total decline in profits reported for Tax Year1994. All of this decrease was attributable to losses fromforeign banks. Losses for foreign banks were four times ashigh for Tax Year 1994, as they were for 1993 [8]. Addi-
tionally, bank holding companies saw profits shrink to$40.4 billion, down 4.1 percent from 1993. This decreasereversed the great stride bank holding companies showedin large profit gains for Tax Year 1993 [9]. In the agricul-ture, forestry, and fishing division a decrease to $1.3billion for profits posted was the direct result of the poorprofits by agricultural producers, which accounted for allof the decrease, falling 44.7 percent ($542.7 million) forTax Year 1994.
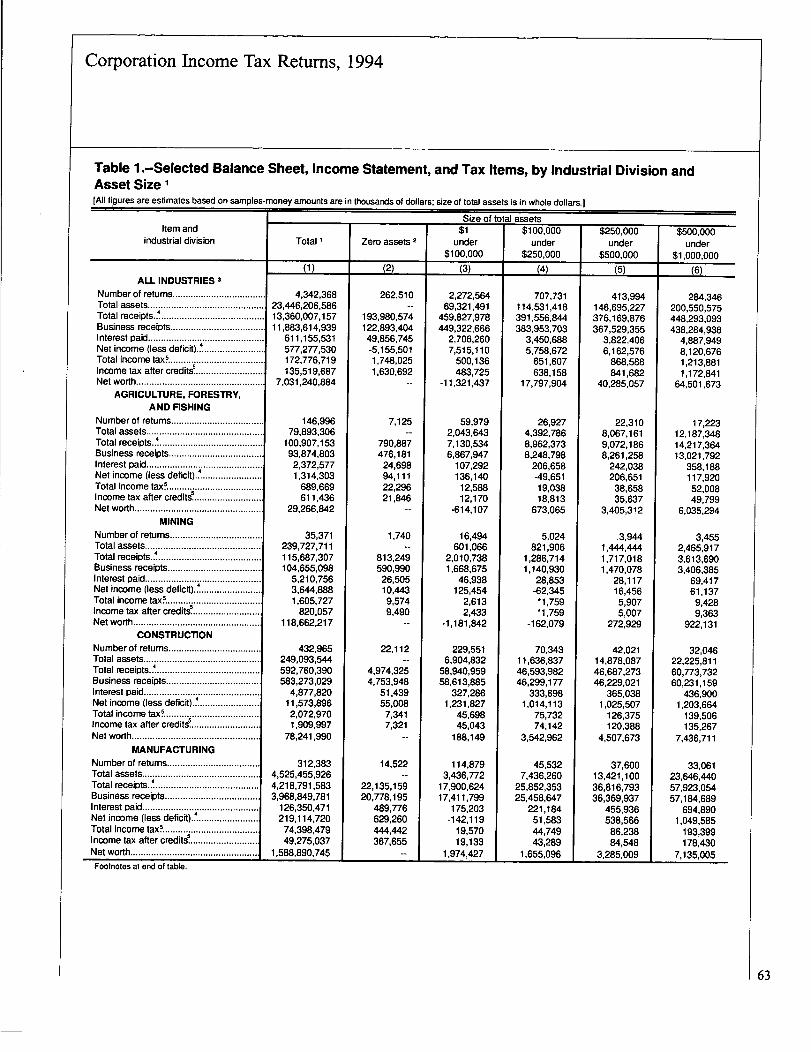
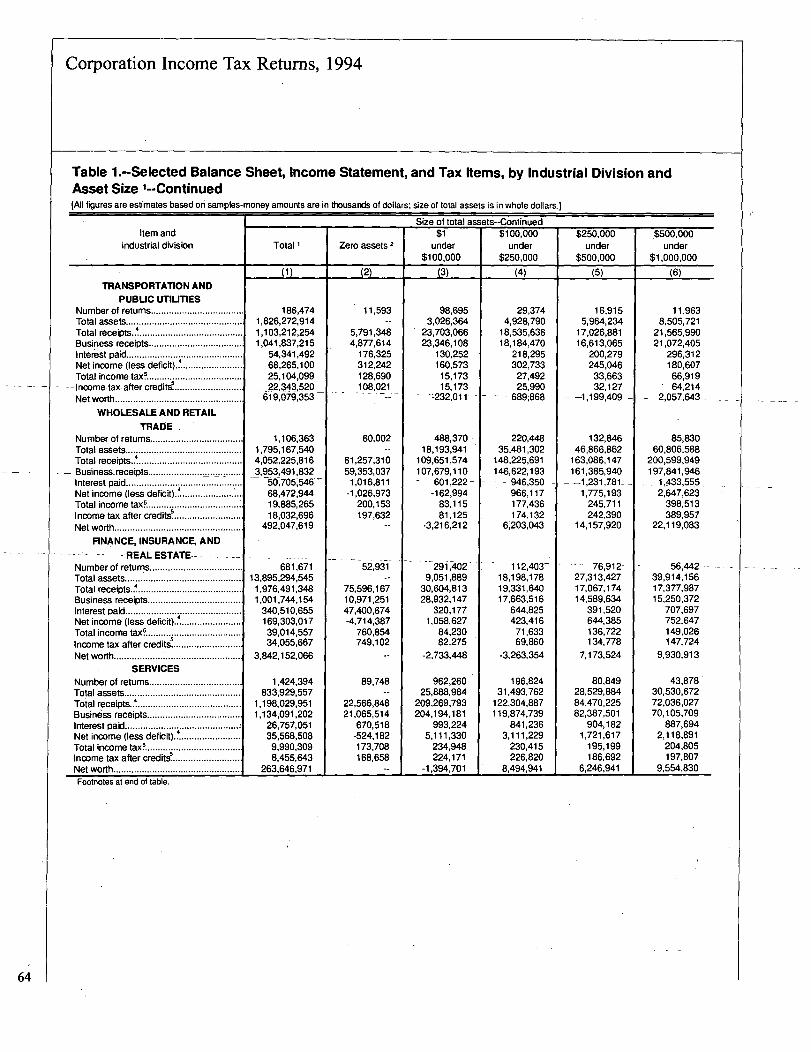
ReceiptsTotal receipts, defined as the sum ofbusiness receipts andinvestment income, rose $1,090.3 billion during Tax Year1994, to $13.4 trillion (Table 1) [10]. This 8.9 percentincrease is roughly double the growth rate of 4.5 percentfor Tax Year 1993. The increase in total receipts ex-ceeded, though modestly, the $1,010.1 billion growth indeductions, leading to the increase in corporate profits (seethe Net Income section of this article). For Tax Year1994, those 7,043 returns with total assets of $250 millionor more accounted for 53.9 percent ofall receipts. Thistotal is similar to the 54.9 percent this asset class contrib-uted to total receipts for all divisions for Tax Year 1993.
Greater than 61.9 percent of total receipts were attribut-able to two divisions, manufacturing and wholesale andretail trade. Receipts reported by the manufacturing andwholesale and retail divisions increased 8.4 percent and9.2 percent, respectively for 1994. Manufacturing, histori-cally the largest single contributor to total receipts, wasresponsible for $4,218.8 billion, while wholesale and retailtrade followed closely with $4,052.2 billion in total re-ceipts.
The largest increase for a single division was in ser-vices, which rose 27.2 percent to $1,198.0 billion. Afterthree years ofdecline in total receipts, the mining divisionsaw a gain of3.2 percent, up $3.6 billion. A decline ingrowth rate for total receipts occurred in both the financeand the agriculture, forestry, and fishing divisions. For thefinance division, the growth rate for 1994 was 1.9 percent,slightly less than the 2.1 percent increase for 1993. Theagriculture, forestry, and fishing division saw total receiptsrise 2.7 percent for 1994, falling slightly from the 2.9percent rate for 1993. Total receipts for constructioncontinued positive growth for 1994, after a brief declinefor 1992, by 10. 1 percent to total $592.8 billion. Finally,the transportation and public utilities division's totalreceipts also grew 6.4 percent, or $66.1 billion. For TaxYear 1994, business receipts (overall, gross receipts fromgoods sold) totaled $11.9 trillion, a 9.4 percent increasefrom 1993 [11]. This gain far exceeded the average
53

Corporation Income Tax Returns, 1994
annual rate ofgrowth measured, of 2.8 percent, since1990.
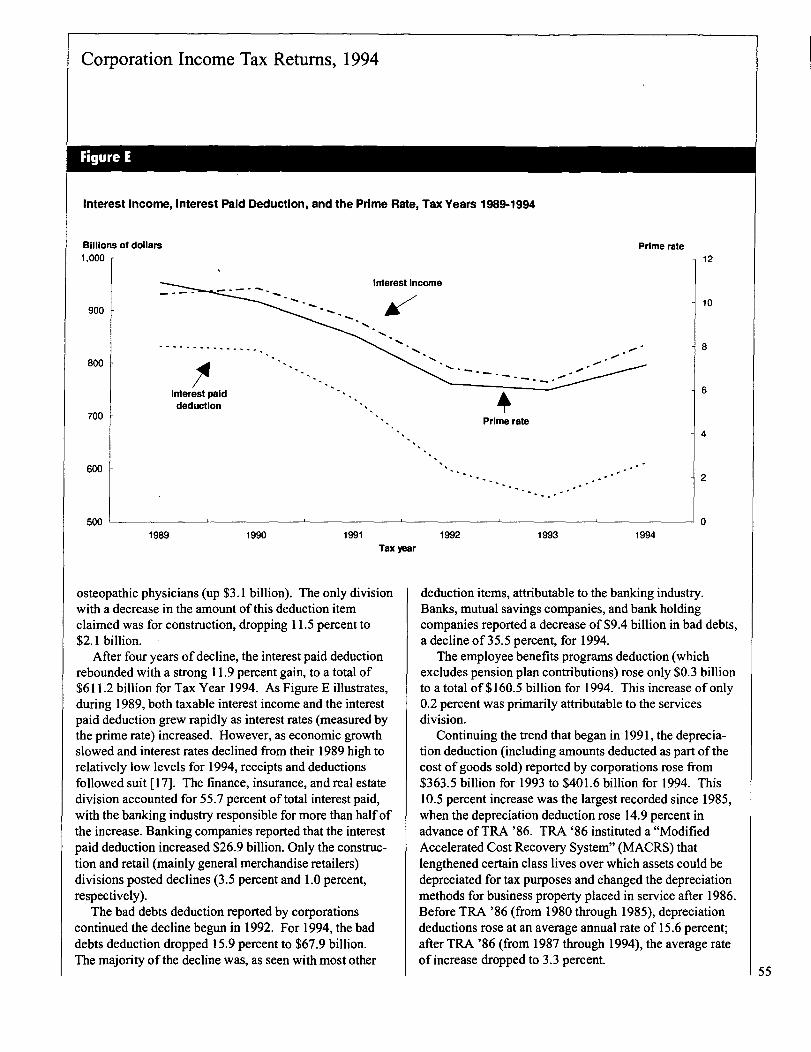
Reversing a three-year trend ofnegative growth result-ing from declining interest rates, taxable interest incomerose 9.5 percent for 1994, from $764.5 billion for 1993 to$837.2 billion (Table 2) [12]. As in prior years, most ofthe interest income was attributable to commercial banksand bank holding companies. For 1994, 84.0 percent ofalltaxable interest income was associated with finance-relatedbusinesses. The most dominant contributors to this in-crease were from banks (except mutual savings banks andbank holding companies) up $16.6 billion, or 29.9 percent,and bank holding companies, with an increase of $16.0billion, or 6.7 percent. Additionally, bank holding compa-nies conipis-M-303 percent ($253.6 billion) of total - - -- -- --taxable interest income for all returns for 1994. Also *significant, is the $10.6 billion, or 18.6 percent, increase intaxable interest income from regulated investment compa-nies. The remainder of the $703.1 billion taxable incomeattributable to finance7related companies is-spread-amongall other finance-related businesses. Paralleling the statis-tics of 1993, both the construction and retail divisions haddeclines in taxable interest income. For the constructiondivi
'sion, most major industries (other than plumbing,
heating,-air-conditioning, and "other construction") re-_ported decreases in interest income as compared with1993. Conversely, within the retail division, generalmerchandisers solely accounted for the decrease in re-ported interest income, falling $2.0 billion to $5.4'billion.
Tax-exempt interest (on State and local Governmentobligations) increased a modest 2.6 percent to $44.4billion, as compared with the growth of 13.0 percentduring 1993, resulting in an increase of slightly over a $ 1. 1billion (as opposed to the $5 billion increase for 1993).Like taxable interest, most tax-exempt interest income wasattributable to the finance division; however, unlike tax-able interest, most was reported by regulated investmentcompanies (i.e., mutual funds, rather than banks). Tax-exempt interest reported by regulated investment compa-nies increased 2.2 percent for 1994 to $22.8 billion.Although this rise is much smaller than the 28.1 percentreported for Tax Year 1993, regulated investment compa-nies still contributed approximately halfofall tax-exemptinterest reported, as they did for 1993. The finance divi-sion, as a whole, contributed more than 89.3 percent, or$39.7 billion, to the 1994 total of $44.4 billion.
The largest percentage decline among other types ofcorporate receipts was for net short-term capital gains(reduced by net long-term capital losses), which fell $15.1billion (57.8 percent) to $11.0 billion. Indicative of the
fluctuating nature of these short-term transactions, short-term gains had risen 78.7 percent for 1993. Companies inthe insurance industry reported a $7.1 billion decrease inshort-term capital gains, accounting for 47.2 percent of thetotal decline in this account. Net long-term capital gains(reduced by net short-term capital losses) also fell for1994, reversing the two previous years ofgrowth [13].For 1994, net long-term gains declined 10. 1 percent to$47.9 billion. The decrease of $5.4 billion would havebeen higher, had not companies classified as "other medi-cal services" achieved a gain of $2.3 billion [ 14].
Dividends received from foreign corporations had thelargest increase for 1994, rising 17.0 percent to $30.3billion. Rental receipts fell for the third consecutive year-although declining only 4.3 percent-for Tax Year -19949substantially less than the 13.6 percent drop for 1993. Asexpected, manufacturing companies accounted for most ofthe decrease, falling 18.6 percent to $22.3 billion.
DedudionsDuring 1994, total deductions increased $1.0 trillion, or8.6 percent to $12.8 trillion. However, because thisgrowth was 0.3 percentage points smaller than the rate ofincrease for total receipts (8.9 percent), sizable gains in netincome (generally, the difference _between-tota-I receipts - - - -and total deductions) were realized. "Cost of goods sold,"typically the largest deduction item, rose to $7,624.9billion, or 8.1 percent (Table 2) [15]. Although thisgrowth of 8.1 percent was roughly double the 4.1 percentincrease for 1993, the cost of goods sold was less than the9.4 percent increase in business receipts for 1994, contrib-uting to the increase in net income.
In terms ofpercentage increases, the biggest gainamong deduction items for 1994 was for pension, profit-sharing, stock bonus, and annuity plans, which increased25.9 percent to $76.9 billion. The services division hadthe largest increase, with a 94.5 percent rise, up from$6.1 billion for 1993 to $11.9 billion for 1994. Thisreflects the rapid increase in the number ofemployeesworking in the services division seen since the early1980's. During 1990 workers employed in the servicesdivision comprised 25.5 percent of the total work force;this climbed to 28.0 percent for 1994 [16]. Nevertheless,manufacturers claimed the greatest share of pension,profit-sharing, stock bonus, and annuity plans, with 49.2percent of the total reported for all divisions. For 1994,two minor industries alone accounted for 57.4 percent ofthe increase in pension, profit-sharing, stock bonus, andannuity plans: manufacturers ofmotor vehicles and equip-ment (up $6.0 billion); and offices ofphysicians and
54
Corporation Income Tax Returns, 1994
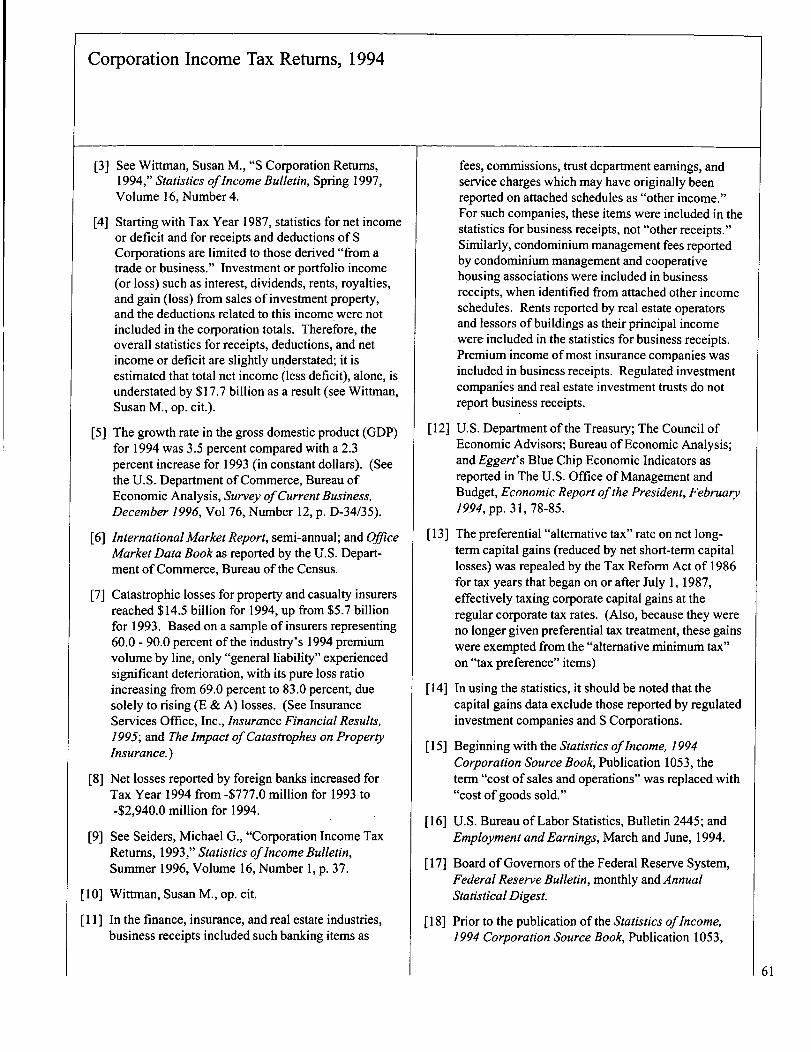
Figure E
Interest Income, Interest Paid Deduction, and the Prime Rate, Tax Years 1989-1994
1989 1990 1991Tax year
osteopathic physicians (up $3.1 billion). The only divisionwith a decrease in the amount of this deduction itemclaimed was for construction, dropping 11.5 percent to$2.1 billion.
After four years ofdecline, the interest paid deductionrebounded with a strong 11. 9 percent gain, to a total of$611.2 billion for Tax Year 1994. As Figure E illustrates,during 1989, both taxable interest income and the interestpaid deduction grew rapidly as interest rates (measured bythe prime rate) increased. However, as economic growthslowed and interest rates declined from their 1989 high torelatively low levels for 1994, receipts and deductionsfollowed suit [ 17]. The finance, insurance, and real estatedivision accounted for 55.7 percent of total interest paid,with the banking industry responsible for more than halfofthe increase. Banking companies reported that the interestpaid deduction increased $26.9 billion. Only the construc-tion and retail (mainly general merchandise retailers)divisions posted declines (3.5 percent and 1.0 percent,respectively).
The bad debts deduction reported by corporationscontinued the decline begun in 1992. For 1994, the baddebts deduction dropped 15.9 percent to $67.9 billion.The majority of the decline was, as seen with most other
1992 1993 1994
12
10
8
6
4
2
0
deduction items, attributable to the banking industry.Banks, mutual savings companies, and bank holdingcompanies reported a decrease of $9.4 billion in bad debts,a decline of35.5 percent, for 1994.
The employee benefits programs deduction (whichexcludes pension plan contributions) rose only $0.3 billionto a total of $160.5 billion for 1994. This increase ofonly0.2 percent was primarily attributable to the servicesdivision.
Continuing the trend that began in 1991, the deprecia-tion deduction (including amounts deducted as part of thecost ofgoods sold) reported by corporations rose from$363.5 billion for 1993 to $401.6 billion for 1994. This10.5 percent increase was the largest recorded since 1985,when the depreciation deduction rose 14.9 percent inadvance of TRA '86. TRA '86 instituted a "ModifiedAccelerated Cost Recovery Systenf ' (MACRS) thatlengthened certain class lives over which assets could bedepreciated for tax purposes and changed the depreciationmethods for business property placed in service after 1986.Before TRA '86 (from 1980 through 1985), depreciationdeductions rose at an average annual rate of 15.6 percent;after TRA '86 (from 1987 through 1994), the average rateof increase dropped to 3.3 percent.
55

Corporation Income Tax Returns, 1994
For Tax Year 1994, data for salaries and wages wastaken out of, and presented separate from, "other deduc-tions" totals. When accounting for this change in datapresentation, a modest 8.3 percent growth was realized for"other deductions" with all industrial divisions contribut-ing relatively equally to the increase [18].
Assets - -For 1994, the rate ofgrowth in the year-end book value oftotal assets reported on corporation income tax returns wasdown slightly from 1993. The 7.5 percent increase, from$21.8 trillion to $23.4 trillion, represents smaller growththan the rate of 9.1 percent for 1993. In fact, this is thefirst year since 1989, in which the rate ofgrowth in the
-book value -of total assets has - increased -at a-declining rate.The largest percentage increase on asset accounts of thebalance sheet was recorded for inventories, up 18.8percent. The largest increase in dollars was recorded for"other investments," growing $564.5 billion (Table 2).
-Allowances for-bad debts-(the only-asset account that-fellduring Tax Year 1994) declined 1.7 percent.
By industrial division, the largest percent increase intotal assets for 1994 was for the services division, with anincrease of $89.2 billion, totaling $833.9 billion. The 12.0percent increase was primarily due to increases inbusinessservices and "other services."
The finance, insurance, and real estate division had thelargest dollar increase in total assets, from $12.8 trillionreported for 1993 to $13.9 trillion for 1994 (Table 1). Asin prior years, the finance, insurance, and real estatedivision was the largest contributor to total assets for alldivisions. For 1994, finance, insurance, and real estatecompanies made up 59.3 percent ofall total assets, closeto the 5 8.8 percent they contributed for 1 993. Total assetsfor finance-related companies (not including insurance,real estate, or holding companies) contributed close to athird of this division's total assets, or $7.5 trillion. Break-ing the trend of the past three years when regulated iinvest-ment companies recorded the largest dollar increase intotal a
'ssets annually, bank holding companies reported the
largest dollar increase, up $303.4 billion for 1994. Regu-lated investment companies dropped to second place, withtotal assets increasing $204.3 billion for 1994. (After1990, total assets of regulated investment companiesnearly doubled, increasing from $1.2 trillion for 1990 to$2.5 trillion for 1994. The rapid growth ofassets inmutual funds reflects the optimistic performance of thesecurities markets and the infusion ofnew cash as a conse-quence of lower interest rates as compared with the' 1990-1991 period [19]).
Wholesalers posted total assets of $901.1 billion,increasing 7.3 percent, with wholesalers ofmotor vehicleand automotive equipment, and paper and paper productscombining to contribute more than 46.1 percent of thisdivision's increase. And, interestingly, the total assets ofamusement and other recreation services fell $9.0 billionfor Tax Year 1994, unlike that of 1993 when the amuse-ment and recreation industry grew $53.0 billion, up 45.2percent [20]. This decline for 1994 was primarily theresult ofan $8.7 billion decrease (9.9 percent) in totalassets for companies classified in the minor industry ofmotion picture production, distribution, and services.
Net notes and accounts receivables (after subtractingthe allowance for bad debts) dropped to third place, from
--second place-for 1993 in asset accounts by dollar -sizeJor1994 representing only 19.9 percent of total assets. "Otherinvestments" comprised 26.7 percent oftotal assets anddepreciable assets contributed another 22.5 percent.Rebounding from a fall of 3.8 percent for 1993, loans tostockholders-climbed a modest 1.7 percent-for 1994. Netdepreciable assets (after deducting accumulated deprecia-tion) accounted for 12.1 percent of total assets for 1994,down from 12.4 percent for 1993.
Tax-exempt securities, which had seen rapid growth-over-the-past five years increased from $701.1 billion for-1993 to $711.6 billion for 1994 (Table 2). The $10.5billion increase for 1994 followed an $85.5 billion in-crease the year before. The majority of the small increasethat occurred came from entities in the finance, insurance,and real estate division, where tax-exempt investmentsrose from $647.4 billion for Tax Year 1993 to $656.0billion for 1994, a modest 1.3 percent increase. Thedecrease in the rate of growth was attributable to taxexempt securities ofregulated investment companies,which fell 3.8 percent, from $318.4 billion for 1993, to$306.3 billion for 1994. This $12.1 billion decrease byregulated investment companies was offset by increases inother areas: mutual
.life insurance companies had increases
in tax-exempt securities of $8.2 billion; "other creditagencies" realized a gain of$5.1 billion; and personalcredit institutions reported an increase of $3.5 billion.
Continuing an increase that began for 1992, intangible'assets rose 12.8 percent to $630.4 billion for Tax Year1994. This continued growth may reflect the increase inthe number of.completed mergers and acquisitions ob-served in 1994 [21, 22]. In general, the acquisition costsof trademarks, patents, copyrights, and like assets tend toincrease during periods of increased merger and acquisi-tion activity, and such acquisition costs are properlyaccounted for as intangible assets [23]. The communica-
56
Corporation Income Tax Returns, 1994
tions industry had a $33.3 billion increase in intangibleassets, and alone accounted for almost half of the totalincrease in intangible assets for all major industries for1994.
Liabilities and Stockholdersf EquityThe largest percentage increase on the corporation incometax return liabilities account occurred in short-termmortgages, notes, and bonds payable up 16.7 percent, to$1.8 trillion. For equity accounts, paid-in or capitalsurplus increased $566.4 billion to total $4.8 trillion, again of 13.4 percent. Since 1989, the paid-in or capitalsurplus account increased $2,194.4 billion, or 84.6percent, from $2,595.2 billion to $4,789.7 billion for 1994.Between Tax Years 1989 and 1993, the increase was 62.7percent. The capital stock account increased only 4.4percent to $2,132.5 billion for 1994, after increasing 8.6percent for 1993, 8.1 percent for 1992, and 9.8 percent for1991.
Corporate indebtedness, as indicated by the variousliability accounts, was reported at $16.4 trillion for 1994.Short-term debt (accounts payable, mortgages, notes, andbonds payable in I year or less, and "other current liabili-ties") totaled $9.6 trillion for 1994, a 6.4 percent increase(down from 7.6 percent for 1993). The 6.4 percent in-crease in short-term debt was principally due to an in-crease in mortgages, notes, and bonds payable in less thanone year. Long-term debt (long-term mortgages, notes,and bonds payable, loans from stockholders, and "otherliabilities") increased 7.6 percent to $6.8 trillion (morethan the 6.8 percent increase for 1993). This situationdiffers with 1993, when the rate for short term debt fell,while the rate for long term debt increased.
From 1982 to 1986, debt as a percentage of the sum ofcorporate liabilities and shareholders' equity fluctuatedaround 74 percent, while the equity component remainedclose to 26 percent. After a slight increase for Tax Years1987 and 1988, the debt steadily declined, from 73.9percent for 1989 to 70.0 percent for 1994. Thus, theequity portion increased from 26.1 percent for 1989 to30.0 percent for 1994.
Income Tax and Tax CreditsReflecting the increase in positive net income, "incomesubject to tax" (the base on which the regular corporationincome tax is computed) increased from $436.8 billion to$494.0 billion, or 13.1 percent for 1994. Returns withtotal assets of$250 million or more reported $384.6billion in positive net income, which accounted for 77.9percent ofall income subject to tax for 1994. For most
corporations, income subject to tax should be equal to netincome minus certain "statutory special deductions" (24].Net income increased 15.9 percent to $577.3 billion for1994. Total statutory special deductions increased only4.2 percent (down from 16.1 percent for 1993) to $142.3billion, leading to a disproportionate increase in incomesubject to tax (relative to net income) [25]. This increaseresulted in, at least partly, the regular corporation incometax (before reductions by credits) increasing to a recordhigh of$167.5 billion, or 12.4 percent (Figure F). Morethan 64.7 percent of the $5.8 billion increase in totalstatutory special deductions for 1994 came from the $3.7billion increase in net operating loss deductions. Ingeneral, "net operating losses" were the deficits as shownin the statistics (excluding those of S Corporations, whichwere allocated to their shareholders), augmented by"unused" portions of the deductions for intercorporatedividends received and for dividends paid on certainpreferred stock ofpublic utilities. The net operating lossdeduction was limited based on the size ofpositive netincome, so the increase in positive net income for 1994may have contributed to the size of the deduction [26].Additionally, savings and loan associations were respon-sible for 58.2 percent of the increase in net operating lossdeductions, up $2.2 billion. The dividends receiveddeduction actually fell for 1994, from $14.9 billion, to $14.0 billion, a 6.4 percent decrease. Contributing signifi-cantly to this decrease were three minor industries:personal credit institutions (declining $0.9 billion);manufactures of aircraft, guided missiles, and parts(declining $0.7 billion); and radio and television broad-casters (falling $0.4 billion).
Regular tax, which was the tax applicable to mostcorporations (accounting for 97.0 percent of total tax),could be reduced by tax credits, principally the foreign tax,U.S. possessions tax, orphan drug, nonconventional. sourceftiel, general business and prior-year minimum credits.Regular tax was reported at $167.5 billion for 1994 anincrease of $18.5 billion (12.4 percent). Over 66.3 percentof this increase came from companies classified in themanufacturing division. The largest ofall credits, theforeign tax credit, increased approximately $2.5 billion, up10.9 percent to a total of$25.4 billion. Most significantlyaffecting this change were returns for communicationscompanies, specifically telephone, telegraph, and othercommunications services (up half a billion dollars to $0.8billion), and those from wholesalers of petroleum andpetroleum products, which reported an increase of $0.4billion to a total of $0.5 billion reported for Tax Year1994. Also, noteworthy is the 36.7 percent decrease,
57

Corporation Income Tax Retums, 1994
58
Figure F
Statutory Special Deductions, Income Subject to Tax, Selected Tax and Tax Credit Items,Tax. Years 1993-1994[Money amounts are in thousands of dollars]
Item 1993 1994 -Percentage
change
(1) (2) (3)Statutory special deductions, total......................................................................... 136,513,433 142,297,660 4.2
Net operating loss deduction ................................................................................. 45,158,874 48,901,938 8.3Dividends received deduction ................................................................................ 14,933,621 13,982,146 -6.4Public utility dividends paid deduction ................................................................... 49,060 99,426 102.7Deduction for dividends paid by regulated investment companiesand real estate investment trusts........................................................................ 75,984,756 79,020,297 4.0
Income subject to tax............................................................................................... 436,797,939 493,9
-
96,239 13.1Income tax, total I..................................................................................................... 154,447,416 172,776,719 11.9
Regular tax .............................................................................................................
I
149,026,690 167,547,891 12.4Personal Holding Company tax 2 ........................................................................... 9,472 12,296 29.8Tax from recapture of investment and low-incomehousing credits 2.. . .............................................................................................. 22,873 54,923 140.2
Alternative minimum tax 2...................................................................................... 4,863,090 4,459,253 -8.3- -ErwironmentaltaX2.-; . .... ...... ....--........ ..........-- ........................................ -566,361 620,502- 9.6
Tax credits, total 3................. ................................................................................... 34,510,139 37,257,104 8.0Foreign tax credit................................................................................................... 22,895,789 25,401,339 10.9U.S. possessions tax credit................................................................................... 4,722,588 3,792,925 -19.7Orphan drug credit ................................................................................................. 20,486 21,166 3.3Nonconventional source fuel credit ....................................................................... 690,593 592,083 -14.3General - business credit......................................................................................... . 3,078,073____ _ 4,109,836 33.5Pdor-year minimum tax credit ................................................................................ 3,102,567 3,339,643 7.6
Total Income tax after credits .................................................................................. 119,937,278 135,519,687 13.0
1 Includes certain other taxes, not shown separately.2 For purposes of the statistics, this tax is included in both incorne tax before and after credits. By law, tax credits can only offset regular tax.3 Includes certain other credits, not shown separately.NOTE: Detail may not add to totals because of rounding.
equivalent to $1.0 billion, from manufacturers ofmotorvehicles and equipment.
For 1994, the U.S. possessions tax credit reversed thehistorical rate of increase measured since 1988, falling to$3.8 billion, down from $4.7 billion for 1993. Manufac-turers alone accounted for 95.5 percent of the total creditclaimed, with manufacturers ofelectrical and electronicequipment responsible for more than $0.7 billion of thiscredit's decrease [27].
The orphan drug credit increased 3.3 percent to $21.2million for Tax Year 1994. Given the criteria for procur-ing the credit, and as seen in Tax Year 1993, only threeminor industries received this credit: manufacturers ofdrugs; manufactures of agricultural and other chemicalproducts; and manufacturers of optical, medical, andophthalmic goods [28]. Finally, the nonconventional fuelcredit fell to $592.1 million (14.3 percent), for Tax Year1994.
The "general business credit," grew 33.5 percent for1994, up $ 1.0 billion after seven years of decline through
1992. During 1994, this credit included the investmentcredit (for certain 1994 capital expenditures still recog-nized for credit purposes under provisions of TRA '86,which otherwise abolished the credit for new acquisitions),jobs credit, credit for alcohol used as fuel, credit forincreasing research activities, low-income housing credit,enhanced oil recovery credit, disabled access credit,renewable electricity production credit, Indian employ-ment credit, credit for employer social security and Medi-care taxes paid on certain employees, credit for contribu-tions to selected community development corporations,empowerment zone employment credit, as well as thecarryforward ofpreviously unused investment credits [29].The purpose of the general business credit was to providea single limitation on these component credits and toestablish uniform rules for the carryback and carryforwardto other years of the unused amounts which were in excessof this limitation. Each of these component credits wascomputed separately. The largest component of the"tentative" general business credit (the credit before
Corporation Income Tax Retums, 1994
limitations) was the carryforward from prior years (amountscarried back to. 1994 were unavailable), comprising 75.9percent of the total "tentative" general business creditclaimed. However, the research credit was the largestcomponent for 1994 expenditures (in contrast to theamounts carried forward to 1994 from prior years) repre-senting 61.6 percent of the total credit for 1994 expendi-tures, rising $575.3 million to $2.5 billion for 1994.
Corporations without current year alternative minimumtax (AMT) liability which reported AMT in prior yearscould elect to take a credit against a portion ofregularincome tax liability. A corporation's potential creditamount is based on the size of its prior years AMT liabil-ity, but its current year credit usage is limited by its currentyear tentative minimum tax. The credit for the prior-yeartax increased 7.6 percent (down from the 34.1 percentincrease for 1993) to $3.3 billion.
For purposes of the statistics, total income tax before orafter credits include regular tax, Personal Holding Com-pany tax, taxes from recapturing prior-year investment orlow-income housing credits, alternative minimum tax,environmental tax, other taxes unique to specific types ofcorporations, and certain statutory tax adjustments. AMTwas the largest of these additional taxes (those other thanthe regular corporation tax). AMT, although remaining thehighest in dollar amount, of all the extra taxes, declined 8.3percent to $4.5 billion. A total of 29,492 returns hadpositive AMT liability. Total income tax after credits, theamount payable to the Federal Government, increased 13.0percent; however, the increase for 1994 was less than theincrease of 18.1 percent for Tax Year 1993. The amountdue for Tax Year 1994 was $135.5 billion, up $15.6 billion.The 7,043 returns of $250 million or more accounted for79.5 percent of total income tax and 76.1 percent of totalincome tax after credits for Tax Year 1994.
SummaryCorporate pre-tax profits as reported on income tax returnsfor 1994 increased by 15.9 percent from 1993 to $577.3billion, reflecting the continued economic recoveryfollowing the recession of 1990-199 1. The number ofreturns with net income increased 11.6 percent. "Positive"net income rose 12.3 percent to a record $739.5 billion;64negative" net income (i.e., net losses) increased 1. 1percent to $162.2 billion. Most industrial divisions hadincreases in pre-tax profits, with only the finance, insur-ance, and real estate, and the agriculture, forestry, andfishing divisions showing a decline. Profits of the 7,043returns with total assets of $250 million or more accounted
for 76.6 percent of the total.As "positive" net income grew for 1994, so did income
subject to tax, which increased from $436.8 billion to$494.0 billion, 13.1 percent. This gain led to a little morethan a 12.4 percent increase in the regular income tax(before credits), from $149.0 billion to $167.5 billion.Total tax after credits, the amount payable to the U.S.Government, increased $15.6 billion (13.0 percent), from$119.9 billion for 1993 to $135.5 billion for 1994.
Data Sources and LimitaflonsData for Tax Year 1994 are based on a sample ofcorpora-tion income tax returns with accounting periods endingJuly 1994 through June 1995 that posted to the InternalRevenue Service Business Master File between July 1994and the end ofJune 1996. These returns represent domes-tic corporations filing Form 11 20 or I I20-A (short form);foreign corporations with "effectively connected" incomein the U.S. filing Form I 120-F; life insurance companiesfiling Form I 120-L; property and casualty insurancecompanies filing Form I 120-PC; S Corporations filingForm 1 120S; regulated investment companies filing FormI 120-RIC; and real estate investment trusts filing FormI I 20-REIT. For purposes of the 1994 statistics, Forms11 20 IC-DISC filed by certain Domestic InternationalSales Corporations and Forms 1120-FSC filed by ForeignSales Corporations were excluded. The 1987 revisions tothe Standard Industrial Classification are not reflected inthe industry statistics.
Initially, the stratified probability sample for this studyconsisted of 94,921 corporation income tax returns drawnfrom a total population of4,694,34 1. However, due to aprocessing problem, many of the Forms I I 20-F wereexcluded from the sampling frame. Every effort was madeto add as many of the missing I 120-F returns as possibleto the sample. Therefore, after adjusting for an additional232 returns, the estimates in this article were based on asample of95,153 corporation income tax returns drawnfrom an estimated total population of4,700,098. Thisestimated population includes an adjustment for an esti-mated 5,757 returns excluded from the sampling frame.Based on the 90,913 active corporation returns in thesample, the estimated population of active corporationswas 4,342,368 returns. The sample was selected afteradministrative processing was complete, but before anyaudit examination, and was stratified based on combina-tions ofnet income and total assets at rates ranging from0.25 percent to 100 percent.
Because the data are based on a sample, they are sub-
59
Corporation Income Tax Retums, 1994
60
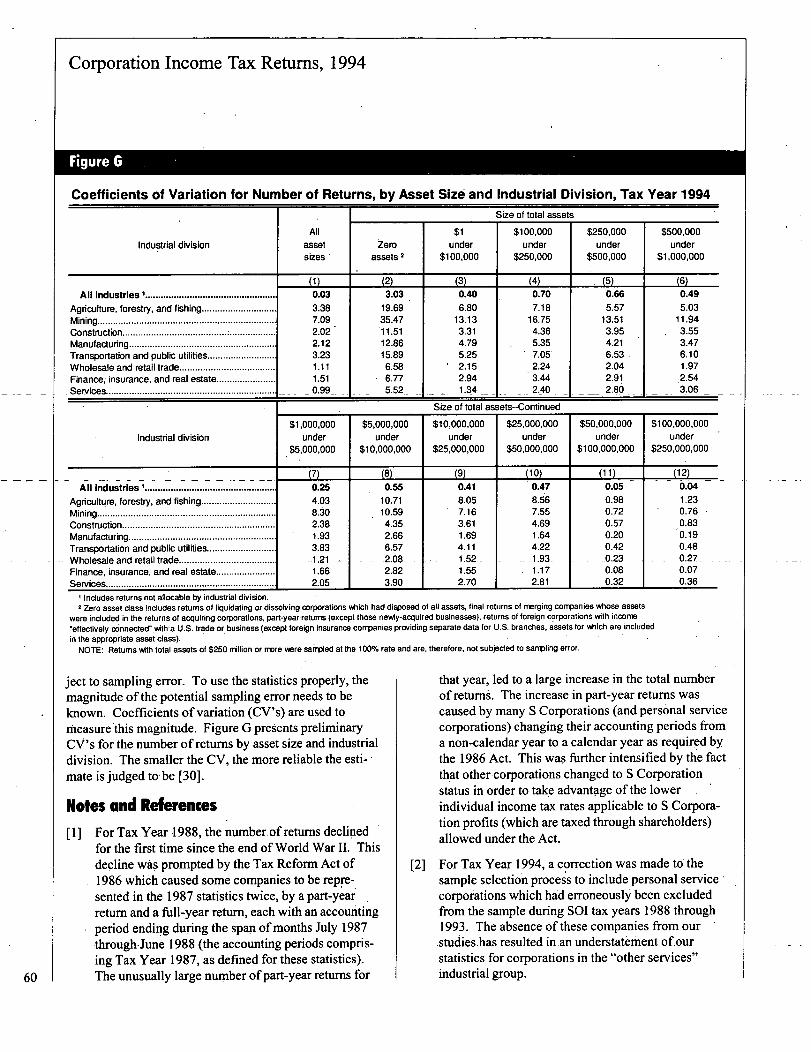
Figure G
Coefficients of Variation for Number of Returns, by Asset Size and Industrial Division, Tax Year 1994Size of total assets
All $1 $100,000 $250,000 $500,000Industrial division asset zero under under under under
sizes assets 1 $100,000 $250,000 $500,000 $1,000,000
(1) (2) (3) 5 1c,
All Industries I .................................................. 0.03 3.03 0.40 0.70 0.66 0.49
Agriculture, forestry, and fishing ............................. 3.38 19.69 6.80 7.18 5.57 5.03Mining ..................................................................... 7.09 35.47 13.13 16.75 13.51 11.94Construction ........................................ .................. 2.02 11.51 3.31 4.36 3.95 3.55Manufacturing ......................................................... 2.12 12.86 4.79 5.35 4.21 3.47Transportation and public utilities .......................... 3.23 15.89 5.25 7.05 6.53 6.10Wholesale and retail trade .......................... 1 11 6.58 2.15 2.24 2.04 1.97Finance; insurance, and real estate ............ 1 ~51 6.77 2.94 3.44 2.91 2.54Services................................................................. 0.99 5.52 134 2.40 2.86 3.06
Size of total assets--Continued
$1,000,000 $5,000,000 $10,000,000 $25,000,000 $50,000,000 $100,000,000Industrial division under under under under under under
$5,000,000 $10,000,000 $25,000,000 $50,000,000 $100,000,000 $250,000,000
(7) (8) (9) (10) (11) (12)
All Industries .................................................. 0.25 0.55 0.41 0.47 0.05 0.04
Agriculture, forestry, and fishing ............................. 4.03 10.71 8.05 8.56 0.98 1.23Mining ..................................................................... 8.30 10.59 7.16 7.55 0.72 0.76
Construction ........................................................... 2.38 4.35 3.61 4.69 0.57
Manufacturing......................................................... 1.93 2.66 1.69 1.64 0.20 0.19Transportation and public utilities.......................... 3.83 6.57 4.11 4.22 0.42 0.48Wholesale and retail trade.........................
- ...... **'
__1,21 -2.08- 1.52- -1.93- -0.23 0.27--
Finance, insurance, and real estate....................... 1.66 2.82 1.55 1.17 0.08 0.07
Services................................................................... 2.05 3.90 2.70 2.81 0.32 0.36
I Includes returns not allocable by industrial division.2 Zero asset class includes returns of liquidating or dissolving corporations which had disposed of all assets, final returns of merging companies whose assets
Were included in the returns of acquiring corporations, part-year returns (except those newly-aoquired businesses), returns of foreign corporations With income"effectively connected"-with a U.S. trade or business (except foreign insurance cornpanies providing separate data for U.S. branches, assets for Mich are includedin the appropriate asset class).
NOTE: Returns with total assets of $250 rnillion or more Were sarnpled at the 1000/6 rate and are, therefore, not subjected to sampling error.
ject to sampling error. To use the statistics properly, themagnitude of the potential sampling error needs to beknown. Coefficients ofvariation (CV's) are used tomeasure'this magnitude. Figure G presents preliminaryCV's for the number of returns by asset size and industrialdivision. The smaller the CV, the more reliable the esti-mate is judged to be (30].
Notes and References
P] For Tax Year 1988, the number.of returns declinedfor the first time since the end of World War Il. Thisdecline was prompted by the Tax Reform Act of1986 which caused some companies to be repFe-sented in the 1987 statistics twice, by a part-yearreturn and a full-year return, each with an accountingperiod ending during the span ofmonths July 1987through-June 1988 (the accounting periods compris-ing Tax Year 1987, as defined for these statistics).The unusually large number of part-year returns for
that year, led to a large increase in the total numberof retums'. The increase in part-year returns wascaused by many S Corporations (and personal servicecorporations) changing their accounting periods froma non-calendar year to a calendar year as required bythe 1986 Act. This was further intensified by the factth
,at other corporations changed to S Corporation
status in order to take advantage of the lower -.
individual income tax rates applicable to S Corpora-tion profits (which are taxed through shareholders)allowed under the Act.
(2] For Tax Year 1994, a correction was made t6thesample selection process to include personal servicecorporations which had erroneously' been excludedfrom the sample during S01 tax years 1988 through1993. The absence of these companies from ourstudies-has resulted in an understateffient ofourstatistics for corporations in the "other services"industrial group.
Corporation Income Tax Returns, 1994
(3] See Wittman, Susan M., "S Corporation Returns,1994," Statistics ofIncome Bulletin, Spring 1997,Volume 16, Number 4.
[4] Starting with Tax Year 1987, statistics for net incomeor deficit and for receipts and deductions of SCorporations are limited to those derived "from atrade or business." Investment or portfolio income(or loss) such as interest, dividends, rents, royalties,and gain (loss) from sales of investment property,and the deductions related to this income were notincluded in the corporation totals. Therefore, theoverall statistics for receipts, deductions, and netincome or deficit are slightly understated; it isestimated that total net income (less deficit), alone, isunderstated by $17.7 billion as a result (see Wittman,Susan M., op. cit.).
[5] The growth rate in the gross domestic product (GDP)for 1994 was 3.5 percent compared with a 2.3percent increase for 1993 (in constant dollars). (Seethe U.S. Department ofCommerce, Bureau ofEconomic Analysis, Survey ofCurrent Business,December 1996, Vol 76, Number 12, p. D-34/35).
[6] International Market Report, semi-annual; and Office
[7]
Market Data Book as reported by the U.S. Depart-ment of Commerce, Bureau of the Census.
Catastrophic losses for property and casualty insurersreached $14.5 billion for 1994, up from $5.7 billionfor 1993. Based on a sample of insurers representing60.0 - 90.0 percent of the industry's 1994 premiumvolume by line, only "general liability" experiencedsignificant deterioration, with its pure loss ratioincreasing from 69.0 percent to 83.0 percent, duesolely to rising (E & A) losses. (See InsuranceServices Office, Inc., Insurance Financial Results,1995; and The Impact ofCatastrophes on PropertyInsurance.)
[8] Net losses reported by foreign banks increased for
191
Tax Year 1994 from -$777.0 million for 1993 to-$2,940.0 million for 1994.
See Seiders, Michael G., "Corporation Income TaxReturns, 1993," Statistics ofIncome Bulletin,Summer 1996, Volume 16, Number 1, p. 37.
[10] Wittman, Susan M., op. cit.
I I ] In the finance, insurance, and real estate industries,business receipts included such banking items as
fees, commissions, trust department earnings, andservice charges which may have originally beenreported on attached schedules as "other income."For such companies, these items were included in thestatistics for business receipts, not "other receipts."Similarly, condominium management fees reportedby condominium management and cooperativehousing associations were included in businessreceipts, when identified from attached other incomeschedules. Rents reported by real estate operatorsand lessors ofbuildings as their principal incomewere included in the statistics for business receipts.Premium income ofmost insurance companies wasincluded in business receipts. Regulated investmentcompanies and real estate investment trusts do notreport business receipts.
[12] U.S. Department of the Treasury; The Council ofEconomic Advisors; Bureau ofEconomic Analysis;and Eggert's Blue Chip Economic Indicators asreported in The U.S. Office ofManagement andBudget, Economic Report of the President, February1994, pp. 31, 78-85.
[13] The preferential "alternative tax" rate on net long-term capital gains (reduced by net short-term capitallosses) was repealed by the Tax Reform Act of 1986for tax years that began on or after July 1, 1987,effectively taxing corporate capital gains at theregular corporate tax rates. (Also, because they wereno longer given preferential tax treatment, these gainswere exempted from the "alternative minimum tax"on "tax preference" items)
[14] In using the statistics, it should be noted that thecapital gains data exclude those reported by regulatedinvestment companies and S Corporations.
[15] Beginning with the Statistics ofIncome, 1994Corporation Source Book, Publication 1053, theterm "cost of sales and operations" was replaced with"cost of goods sold."
[16] U.S. Bureau of Labor Statistics, Bulletin 2445; andEmployment and Earnings, March and June, 1994.
[17] Board ofGovernors of the Federal Reserve System,Federal Reserve Bulletin, monthly and AnnualStatistical Digest.
18] Prior to the publication of the Statistics ofIncome,1994 Corporation Source Book, Publication 1053,
61
Corporation Income Tax Returns, 1994
"salaries and wages" data was included in the totalslistedTor "other deductions." (An exception to this isfolind in ih e' 1993 SOI Corporation Income TaxReturns, Publication 16, when some tables providedsalaries and wages data separate ftom the data for"other deductions.") Thus-, in order to compare datafor "other deductions" between tax years (forpurposes of this article) "salaries and wages". wasadded to the amount reported for "other deduction"for Tax Year 1994 data. (For a detailed descriptionof salaries and-wages see 1993 SOI CorporationIncome Tax Returns, Publication 16, "Explanation ofTerms.")'
[19]. Boardof-G-overnprs ofthe Federal Reserve System,Federal Reserve Bulletin, October 1994 and FlaWofFunds Account, March 1995; and InvestmentCompany Institute, Washington, D.C., Mutual FundFact Book..
-[20]-Seiders,,Michael G., op., cit. p. 4,1.
[2 1 Mergers and Acquisitions, 1995 Almanac andIndex,May/June 1995, Volume 29, Number 6, pp. 48, 53.
[22] - Securities Data Company, Newark, NJ, Merger &Corporate-Transactions Database.
[23] Seiders, G. Michael, op., cit. p. 41;
[24] For 1994, statutory special deductions included thefollowing: the vari
'ous dividends received deductions;
the deduction for dividends paid on certain preferredstock ofpublic utilities; the deduction for dividendspaid by regulated investment companies and realestate investment trusts; the special deduction fortaxes paid by real estate investment trusts allowedunder section 857; and the special deduction allowedsmall life insurance companies.
[25] It should be noted that the statistics fors'tatutoryspecial deductions include: (a) certain unusedamounts reported by corporations without net incomeand, therefore, with no income subject to tax, as wellas (b)'unused portions attributable to some corpora-tionsmith net income where the total of these.deductions exceeded the amount needed to offset netincome; These corporations also had no income
subject to tax. In addition, the relationship between,net income and income subject to tax was defineddifferently for life insurance businesses and realestate investment trusts. Therefore, the net incomeshown i
*n.the statistics (which also includes the net
income of S Corporations which was, in general,taxable to shareholders), minus statutory specialdeductions, will not yield the statistics shown forincome subject to tax.
[261 The net operating loss deduction sitatisti6s are onlyfor prior year losses, not previously deducted and11carried'forWard" to 1994; future-year losses carriedback" as deductions for 1994 are unavailable.
[27]-The Tax Reform-Act-of 1976 added-the U.S.-posses- -sions tax credit in lieu of the ordinary foreign taxcredit in order to provide a tax incentive for domesticcorporations to invest in Puerio Rico or in U.S.possessions or territories (including American
- Samoa, Gu-am, Johnston Island, Midway Islands, and
Wake Island).
[28] The orphan drug credit consists of a credit of50.0percent of.the qualified clinical testing expenses paidor incurred before January 1, 1995, for certain drugscreated for rare diseases-and-conditions, (See U.S~Master Tax Guide, 1995, 78th Edition, CCH Incor-porated, para 1315.)
[29] The Empowerment Zone Employmentcredit is a newGeperal Business Credit for Tax Year 1994 (Form8844)* The credit allows employers a credit for up tothe fir
-st $15,000 ofwages'paid to employees who are
residents of an empowerment zone. (See U.S MasterTax'Guide, 1995, 78th Edition, CCH Incorporated,para' 1339A.)
[30] Final CV's will be published in the upcomingStatistics ofIncome, Corporation Income TaxReturns, 1994, Publication 16, Section 3, "Descrip-tion ofthe Sample And Limitations of the Data."
AcknowledgmentThe author would like to thank Bertrand M. Oberall, SOImathematical statistician, for contributing the sectio.n.onData Sources and Limitations, and Figure G.
62
Corporation Income Tax Retums, 1994
Table l.--Selected Balance Sheet, Income Statement, and Tax Items, by Industrial Division andAsset Size I[All figures are estimates based on samples-money amounts are in thousands of dollars; size of total assets is in whole dollars.]
Item andindustrial division
ALL INDUSTRIES 3
Number of returns ....................................Total assets .............................................Total receipts .
4......................................
Business receipts ....................................Interest paid .............................................Net income (less clefic it).
.4........................
Total income tax~ ....................................Income tax after credits!..........................Net worth.................................................
AGRICULTURE, FORESTRY,AND FISHING
Number of returns ....................................
Total assets ..............................................
Totalreceipts. 4
Business receipts .....................................
Interest paid .............................................4
Net income (less deficit) ..........................Total income tax~ ....................................Income tax after credits! ..........................Net worth ..................................................
MINING
Number of returns ...................................Total assets .............................................Total receipts
.
'
4
* ......... *.... *"**** ... **"** ...... * ...Business receipts ....................................
Interest paid .............................................4
Net income (less deficit) ..........................Total income tax~ ....................................Income tax after credite ..........................Net worth .................................................
CONSTRUCTION
Number of retums....................................
Total assets .............................................
Total receipts.
*
4
"'*"'*'** ........... * ...... ----Business receipts ....................................Interest paid .............................................
4Net income (less deficit) .........................Total income tax~ ....................................Income tax after credite ..........................Net worth .................................................
MANUFACTURINGNumber of returns ...................................Total assets .............................................Total receipts .4
***'* ... * ........... ......Business receipts ....................................Interest paid .............................................
4Net income (less deficit) ..........................Total income tax~ ....................................Income tax after credits ..........................Net worth .................................................
Footnotes at end of table.
Total I
(1)
4,342,36823,446,206,58613,360,007,15711,883,614,939
611,155,531577,277,530172,776,719135,519,687
7,031,240,884
146,99679,893,306
100,907,15393,874,803
2,372,5771,314,303
689,669611,436
29,266,842
35,371239,727,711115,687,307104,655,098
5,210,7563,644,8881,605,727
820,057118,662,217
432,965249,093,544592,760,390583,273,029
4,877,82011,573,8962,072,9701,909,997
78,241,990
312,3834,525,455,9264,218,791,5833,968,849,781
126,350,471219,114,720
74,398,47949,275,037
1,588,890,745
Zero assets 2
(2)
262,510
193,980,574122,893,40449,856,745-5,155,5011,748,0251,630,692
7,125
790,887476,181
24,69894,11122,29621,846
1,740
813,249590,990
26,50510,4439,5749,490
22,112
4,974,3254,753,948
51,43955,0087,3417,321
14,522
22,135,15920,778,195
489,776629,260444,442367,655
Size of total assets$1
under$100,000
(3)
2,272,56469,321,491
459,827,978449,322,666
2,706,2607,515,110
500,136483,725
-11,321,437
$100,000under
$250,000(4)
707,731114,531,418391,556,844383,953,703
3,450,6885,758,672
651,607638,158
17,797,904
59,9792,043,6437,130,5346,867,947
107,292136,140
12,58812,170
-614,107
16,494601,066
2,010,7381,668,675
46,938125,454
2,6132,433
-1,181,842
229,5516,904,832
58,940,95958,613,885
327,2861,231,827
45,69845,043
188,149
114,8793,436,772
17,900,62417,411,799
175,203-142,119
19,57019,133
1,974,427
26,9274,392,7868,962,3738,248,798
206,658-49,65119,03818,813
673,065
5,024821,906
1,286,7141,140,930
28,853-62,345
1,759-1,759
-162,079
70,34311,636,83746,593,98246,299,177
333,6981,014,113
75,73274,142
3,542,962
45,5327,436,260
25,852,35325,458,647
221,18451,58344,74943,289
1,655,096
$250,000under
$500,000(5)
413,994146,695,227376,169,876367,529,355
3,822,4066,162,576
868,588841,682
40,285,057
22,3108,067,1619,072,1868,261,258
242,038206,651
38,65835,637
3,405,312
.3,9441,444,4441,717,0181,470,078
28,11716,456
5,9075,007
272,929
42,02114,878,08746,687,27346,229,021
365,0381,025,507
126,375120,388
4,507,673
37,60013,421,10036,816,79336,369,937
455,936538,566
86,23884,548
3,285,009
$500,000under
$1,000,000
(6)
284,346200,550,575448,293,093438,284,938
4,887,9498~ 120,6761,213,8811,172,841
64,501,673
17,22312,187,34814,217,36413,021,792
358,188117,920
52,00849,799
6,035,294
3,4552,465,9173,613,6903,406,385
69,41761,1379,4289,363
922,131
32,04622,225,81160,773,73260,231,159
436,9001,203,664
139,506135,267
7,436,711
33,06123,646,44057,923,05457,184,689
694,8901,049,585
193,399178,430
7,135,005
63
Corporation Income Tax Returns, 1994
Table l.--Selected Balance Sheet, Income Statement, and Tax Items, by Industrial Division andAsset Size '--ContinuedJAJI figures are estimates based on samples-money amounts are in thousands of dollars; size of total assets is in whole dollars.]
Item andindustrial division
TRANSPORTATION ANDPUBLIC UTIL&IIES
Numberof returns ....................................Total assets .............................................Total
receipts..4.........................................
Business receipts ....................................Interest paid.............................................Net income (less deficit)..4........................Total income tax~ ....................................
- -Income tax- after credite..........................Net worth .................................................
WHOLESALE AND RETAIL
TRADE .Number of returns ....................................Total assets.............................................
4Total receipts...........................................- Business- receipts................. . .. .............
Interest paid .............................................4
Net income (less deficit).......................
Total income tax~ ....................................I noome tax after credits! ..........................Net worth ..................................................
FINANCE, INSURANCE, AND- - - - - REAL ESTATE-- -
Number of returns ....................................Total assets ..............................................Total
receipts..4.....................................
Business receipts .....................................
Interest paid .............................................Net income (less deficit)..
4.........................
Total income tax~ .....................................t 5
Income tax after credi s............................Net worth.................................................
SERVICES
Number of returns ....................................
Total assets.............................................
Total receipts...........................................
Business receipts....................................
Interest paid ............................................4Net income (less deficit)..........................Total income tax~ ....................................Income tax after credits! ..........................Net worth .................................................Footnotes at end of table.
Total I
(1)
186,4741,826,272,9141,103,212,2541,041,837,215
54,341,49268,265,10025,104,09922,343,520
619,670,M3
1,106,3631,795,167,5404,052,225,8163,953,491,832
K705,_54668,472,94419,885,26518,032,696
492,047,619
681,67113,895,294,545
1,976,491,3481,001,744,154
340,510,655169,303,01739,014,55734,055,667
3,842,152,066
1,424,394833,929,557
1,198,029,9511,134,091,202
26,757,05135,568,508
9,990,3098,455,643
263,646,971
Zero assets 2
(2)
11,593
5,791,3484,877,614
176,325312,242128,690108,021
60,002
61,257,31059,353,037
1,016,811-1,026,973
200,153197,632
52,931
75,596,16710,971,25147,400,674-4,714,387
760,854749,102
89,748
22,566,84821,065,514
670,518-524,182173,708168,658
Size of total assets--Continued$1
under$100,000
(3)
98,6953,026,364
23,703,06623,346,108
130,252160,573
15,17315,173
-232,011 -
$100,000under
$250,000(4)
29,3744,928,790
18,535,63618,184,470
218,295302,733
27,49225,990
- 689,868
488,37018,193,941
109,651,574107,679,110- -601,222-
-162,99483,11581,125
-3,216,212
291,4029,051,889
30,604,81328,932,147
320,1771,058,627
84,23082,275
-2,733,448
962,26025,8a8,984
209,269,793204,194,181
993,2245,111,330
234,948224,171
-1,394,701
220,44835,481,302
148,225,691146,622,193
- 946,350966,117177,436174,132
6"203,043
-112,403-18,198,M19,331,64017,663,516
644,825423,41671,63369,860
-3,263,354
196,82431,493,762
122,304,887119,874,739
841,2363,111,229
230,415226,820
8,494,941
$250,000under
$500,000
(5)
16,9155,964,234
17,026,88116,613,065
200,279245,04633,66332,127
- -1,199,409
132,84646,866,862
163,086,147161,385,940
- -1,231,781-1,775,193
245,711242,390
14,157,920
-- 76,912-27,313,42717,067,17414,589,634
391,520644,385136,722134,778
7,173,524
80,84928,529,88484,470,22582,387,501
904,1821,721,617
195,199186,692
6,246,941
.$500,000under
$1,000,000
(6)
11,9638,505,721
21,565,99021,072,405
296,312180,607
66,91964,214
2,057,643
85,83060,806,588
200,599,949197,841,946
- 1,433,5552,647,623
398,513389,957
22,119,083
56,44239,914,15617,377,98715,250,372
707,697752,647149,026147,724
9,930,913
43,87830,530,67272,036,02770,105,709
987,6942,118,891
204,805197,807
9,554,830

Corporation Income Tax Retums, 1994
Table l.--Selected Balance Sheet, Income Statement, and Tax Items, by Industrial Division andAsset Size '--Continued[All figures are estimates based on samples-money amounts are in thousands of dollars; size of total assets is in whole dollars.]
Item andindustrial division
ALL INDUSTRIES 3
Number of returns.............................
Total assets.......................................
Totalreceipts. 4
...
Business receipts ..............................
Interest paid.......................................
Net income (less deficft). .4..................
Total income tax ~ ..............................
I ncome tax after credite....................Net worth ...........................................
AGRICULTURE, FORESTRY,AND FISHING
Number of returns.............................Total assets .......................................
4Total receipts
.... *............
Business receipts ..............................Interest paid ........................................4 .................Net income (less deficit) ..Total income tax ~ ..............................Income tax after credite....................Net worth ...........................................
MINING
Number of returns .............................Total assets.......................................Total receipts. 4
Business receipts..............................Interest paid.......................................Net income (less deficit) .. .................Total income tax~ ..............................Income tax after credite ....................Net worth ...........................................
CONSTRUCTION
Numberof returns .............................Total assets .......................................Total
receipts. 4
Business receipts ..............................Interest paid .......................................
4Net income (less deficit)
....................
Total income tax'......Income tax after credits!....................
Net worth ...........................................
MANUFACTURING
Number of returns ..............................
Total assets.......................................4
Total receipts.
*--* ..... ----*- .......Business receipts..............................
Interest paid .......................................
Net income (less deficit). .4..................
Total income tax~ ..............................
Income tax after creditg ....................
Net worth ...........................................
Footnotes at end of table.
$1,000,000under
$5,000,000
(7)
296,105622,752,583
1,370,529,9981,341,088,721
16,281,57524,023,252
4,692,7284,520,848
176,202,989
12,19722,470,10426,564,85724,464,385
707,359-69,569124,747120,752
8,150,179
3,0666,228,2685,020,4354,540,235
127,362118,923
28,59723,509
2,068,071
30,58362,975,036
149,902,471148,177,952
1,093,7472,800,097
492,344466,657
19,256,792
44,879100,624,244229,681,328226,870,381
2,652,3586,334,2711,255,4231,195,530
37,052,310
$5,000,000under
$10,000,000
t8)
43,450301,453,256622,852,479607,736,314
7,603,92712,179,8072,708,0842,585,998
93,137,484
6644,565,2356,087,2005,797,631
118,69396,97541,54640,195
1,520,125
7215,206,1294,495,0453,966,443
112,842193,48247,90143,995
2,393,042
3,95827,105,58157,744,77857,023,548
383,5111,175,699
228,163217,466
8,482,041
9,14563,596,749
126,397,644124,681,219
1,630,1974,259,989
888,164835,367
25,031,581
Size of total assets--Continued$10,000,000
under$25,000,000
$25,000,000
under$50,000,000
$50,000,000under
$100,000,000
(9)
27,584424,684,771714,550,154692,727,035
10,324,61816,785,3234,065,7273,759,346
133,628,604
3454,942,2265,287,1874,901,777
145,714-9,824
45,95443,857
1,572,462
4607,252,0715,395,9274,851,397
148,037132,57655,03744,647
3,537,961
1,69524,991,20852,548,62951,769,861
372,3111,089,444
204,759198,795
8,360,678
6,37598,757,669
183,401,881181,021,044
2,398,1157,709,9301,607,9461,419,458
42,098,636
(10)
11,922420,068,459461,844,870435,954,616
9,860,35012,817,7793,971,1703,591,556
132,049,357
1173,918,0284,879,5724,648,474
77,711102,98740,33438,138
1,616,489
1495,409,8984,005,5943,663,781
108,55816,74853,10145,368
2,228,990
38813,463,46226,206,40125,738,506
213,283467,223126,087116,428
4,452,839
2,51387,171,081
144,318,514141,468,420
2,089,3596,167,7221,642,8251,413,572
38,147,106 1
8,221584,488,009456,152,763421,076,322
13,489,82616,188,534
5,227,9304,788,722
194,411,701
574,101,8694,903,6294,743,763
101,88213,09845,54743,184
1,510,750
1087,711,2884,255,0603,642,351
156,290126,91561,80350,400
4,051,211
15911,359,24120,381,46219,798,339
186,909397,014115,855107,134
4,118,457
1,488104,503,935157,975,124154,628,117
2,620,4016,716,3602,130,2701,840,567
44,203,183
$100,000,000under
$250,000,000
(12)
6,8991,095,048,889
668,722,946603,561,41023,255,66230,724,075
9,736,2948,355,903
417,030,791
344,733,0725,661,7555,445,781
146,02666,08532,59431,802
1,495,346
9717,042,66911,264,48610,314,876
369,104186,036144,389
96,9209,089,438
6911,432,79620,615,46420,067,900
184,786128,663119,127116,643
2,721,186
1,133177,139,560234,306,020227,416,295
4,661,57512,692,0994,225,7843,210,371
73,841,730
$250,000,000or
more
(13)
7,04319,466,611,9097,195,525,5826,019,486,454
465,615,525442,157,227137,392,549103,150,217
5,773,516,760
178,471,8357,349,6096,997,016
136,318609,382214,359155,244
3,901,927
112185,544,05571,809,35265,398,957
3,988,7342,719,0631,185,619
487,16695,442,365
3942,120,65247,390,91444,569,735
928,912985,637391,983304,713
15,174,502
1,2563,845,722,1162,982,083,0882,755,561,036
108,261,476173,107,473
61,859,67038,667,116
1,318,415,517
65
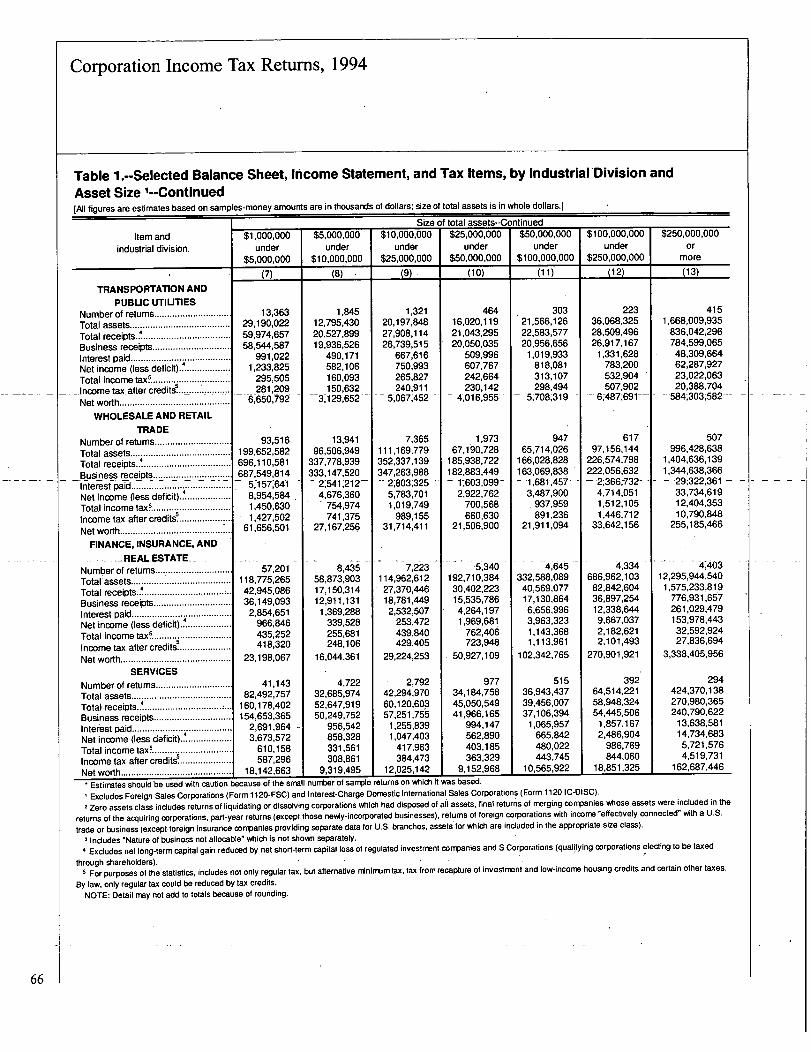
Corporation Income Tax Returns, 1994
Table i.--Selected Balance Sheet, Income Statement, and Tax Items, by Industrial'Division andAsset Size '--Continued[All figures are estimates based on samples-money amounts are in thousands of dollars; size of total assets is in whole dollars.)
Item andindustrial division
TRANSPORTATION AND
PUBLIC UTILITIESNumber of returns .............................Total assets.......................................
4Total receipts .....................................Business receipts..............................Interest paid .......................................
4Net income (less deficit)....................
Total income tax'_Income tax after credits!5 .. . ................
Net worth ...........................................
WHOLESALE AND RETAIL
TRADENumberof returns .............................Total as~ets .......................................
4Total receipts
....... ..........................
Business receipts ..............................
Interest paid .......................................4
Net income (less deficit)....................
Total income tax~ ..............................Income tax after credits! ....................Net worth...........................................
FINANCE, INSURANCE, AND
- --- ___REAL.ESTATE__ - -Number of returns .............................Total assets.......................................
4Total receipts..................................Business receipts..............................interest paid .......................................
4Net income (less deficit)
....................
Total income tax~ ..............................it 5
Income tax after cred s .....................Net worth...........................................
SERVICES
Number of returns .............................Total assets .......................................
4Total receipts .....................................Business receipts ..............................Interest paid .......................................defiCR).4 .................Net income (less
Total income tax~ ..............................Income tax after credite....................Net worth ............. .............................
2 Zero assets class includes returns of liquidating or dissolving corporations which had disposed of ail assets, final return's of merging companies whose assets were included in the
returns of the acquiring corporations, part-year returns (except those newly-incorporalled businesses), returns of foreign corporations with income "effectively connected" with a U.S.
trade or business (except foreign insurance companies providing separate data for U.S. branches, assets for which are included in the appropriate size class).
3 Includes "Nature of business not allocable" which is not shown separately.4 Excludes net long-term capital gain reduced by net short-term capital loss of regulated investment conpanies and S Corporations (qualifying corporations electing to be taxed
through shareholders).
5 For purposes of the statistics, includes not only regular tax, but alternative rninimum tax, tax from recapture of investment and low-income housing credits and certain other taxes.
By law, only regular tax could be reduced by tax credits.
NOTE: Detail may not add to totals because of rounding.
$1,000,000under
$5,000,000(7)
13,36329,190,02259,974,65758,544,587
991,0221,233,825
295,505281,209
6,650,792
93,516199,652,582696,110,581687,549,814
5,157,6418,954,5841,450,6301,427,502
61,656,501
57,201118,775,26542,945,08636,149,093
2,854,651966,846435,252418,320
23,198,067
41,14382,492,757
160,178,402154,653,365
2,691,964 -3,673,572
610,158587,296
18,142,663
$5,000,000under
$10,000,000
(8)
1,84512,795,43020,527,89919,936,526
490,171582,106160,093150,632
3,129,652
13,94196,506,949
337,778,939333,147,520
21-541,212-4,676,360
754,974741,375
27,167,256
8,43558,873,90317,150,31412,911,131
1,369,288339,528255,681248,106
16,044,361
4,72232,685,97452,647,91950,249,752
956,542858,328331,561308,861
9,319,495
$10,000,000under
$25,000,000
(9)
1,32120,197,84827,908,11426,739,515
667,616750,993265,827240,911
51067,452
7,365111,169,779352,337,139347,263,988-2,803,325
5,783,7011,019,749
989,15531,714,411
7,223114,962,61227,370,44618,781,449
2,532,507253,472439,840429,405
29,224,253
1 2,79242,294,97060,120,60357,251,765
1,255,8391,047,403
417,963384,473
12,025,142
Size of total assets--Continued$25,000,000
under$50,000,000
(10)
46416,020,11921,043,29520,050,035
509,996607,767242,664230,142
4,016,955
$50,000,000under
$100,000,000
30321,566,12622,583,57720,956,656
1,019,933818,081313,107298,494
51708,319
1,97367,190,728
185,938,722182,883,449
2,922,762700,568660,630
21,506,900
192,710,38430,402,22315,535,7864,264,1971,969,681
762,406723,948
50,927,109
97734,184,75845,050,54941,966,165
994,147562,890403,185363,329
9,152,968
94765,714,026
166,028,828163,069,838- 1,681,457
3,487,900937,959891,236
21,911,094
4,645332,588,089
40,569,07717,130,8646,656,9963,963,3231,143,3681,113,961
102,342,765
51536,943,43739,456,00737,106,394
1,065,957665,842480,022443,745
10,565,922
$100,000,000under
$250,000,000(12)
22336,068,32528,509,49626,917,167
1,331,628783,200532,904507,902
6,487,691--
61797,156,144
226,574,798222,056,632
21366,732-4,714,0511,512,1051,446,712
33,642,156
4,334686,962,103
82,842,60436,897,25412,338,6449,667,0372,182,6212,101,493
270,901,921
39264,514,22158,948,32454,445,506
1,857,1672,486,904
986,769844,060
18,851,325
$250,000,000or
more(13)
4151,668,009,935
836,042,296784,599,06548,309,66462,287,92723,022,06320,388,704
584,303,582
507996,428,638
1,404,636,1391,344,638,366
29,322,36133,734,61912,404,35310,790,848
255,185,466
4,40312,295,944,540
1,575,233,819776,931,657261,029,479153,978,44332,592,92427,836,694
3,338,405,956
294424,370,138270,980,365240,790,622
13,638,58114,734,6835,721,5764,519,731
162,687,446
Estimates should be used vAth caution because of the small number of sample returns on which it was based.
Excludes Foreign Sales Corporations (Form 11 20-FSC) and Interest-Charge Domestic International Sales Corporations (Form 11 20 IC-DISC).
66

Corporation Income Tax Returns, 1994
Table 2.--Selected Balance Sheet, Income Statement, and Tax Items, by Asset Size[All figures are estimates based on samples-money amounts are in thousands of dollars; size of total assets is in whole dollars.]
Item
Number of returns...................................
Total assets..............................................Cash ......................................................Notes and accounts receivable..............
Less: Allowance for bad debts ..........Inventories............................................Investment in U.S. Governmentobligations............................................Tax-exempt securities...........................Other current assets ..............................Loans to stockholders...........................Mortgage and real estate loans............Other investments.................................Depreciable assets ...............................
Less: Accumulated depreciation ........Depletable assets .................................
Less: Accumulated depletion .............Land......................................................intangible assets ...................................
Less: Accumulated amortization........Other assets .........................................
Total liabilities..........................................Accounts payable .................................Mortgages, notes, and bonds payable
in less than 1 year.............................Other current liabilities..........................Loans from stockholders .......................Mortgages, notes, and bonds payable
in 1 year or more ................................Other liabilities......................................Net worth ..............................................
Capital stock....................................Paid-in or capital surplus .................Retained earnings, appropriated .....Retained earnings, unappropriated.Other retained earnings (I 120S) .....Less: Cost of treasury stock............
Total receipts............................................Business receipts .................................Interest ..................................................Interest on State and localGovernment obligations.....................
Rents....................................................Royalties ...............................................Net short-term capital gain less
net long-term capital loss ...................Net long-term capital gain less
net short-term capital loss..................Net gain, noncapital assets...................
Dividends, domestic corporations .........
Dividends, foreign corporations ............
Other
Footnotes at and of table.
otal
(1)4,342,368
23,446,206,586853,076,121
4,767,673,175115,154,287
1,125,766,128
1,308,919,376711,589,861
1,662,091,48385,343,725
1,660,947,1656,265,265,7585,284,097,0032,438,539,251
147,617,55070,805,195
239,430,463630,439,740150,436,426
1,478,884,19923,446,206,586
1,606,156,180
1,830,544,4936,172,752,686
294,315,214
3,099,902,0333,411,295,0977,031,240,8842,132,453,8384,789,687,457
81,281,3671,467,774,310
149,417,8441,589,373,930
13,360,007,15711,883,614,939
837,214,525
44,424,83881,809,46650,0",128
10,997,054
47,895,61535,212,81813,233,14530,322,365
325,238,265
Zero assets I
U2262,510
193,980,574122,893,40458,861,362
318,559796,899216,433
93,940
1,634,4231,907,161
118,25829,165
7,110,970
Size of total assets$1
under$100,000
L3)2,272,564
69,321,49117,308,8296,644,020
46,4977,918,327
$100,000under
$250,000
_C4)
707,731114,531,418
21,312,43815,906,908
249,51715,823,622
63,54444,425
2,956,8175,174,614
392,2722,123,642
77,909,78056,306,169
518,102390,335
1,689,8983,354,3991,735,8751,701,697
69,321,49111,118,688
7,754,1909,462,784
33,140,958
15,372,1723,794,135
-11,321,43716,658,07015,666,338
297,912-17,583,246-22,456,559
3,903,952459,827,978449,322,666
437,833
5,025353,648107,403
31,537
515,407689,331
25,690*4,005
8,335,433
297,311176,612
4,820,8145,994,6751,365,8765,270,205
90,261,84458,096,779
563,565291,645
4,889,1624,688,9212,154,0253,951,432
114,531,41814,376,062
10,776,27710,580,74223,936,055
25,893,81011,170,56817,797,90414,813,82616,094,412
370,136-5,952,599-3,374,4654,153,407
391,556,844383,953,703
978,020
20,740450,418110,247
52,049
493,991688,175
68,466-9,404
4-731 6-31
$250,000under
$500,000AJ5
413,994146,695,227
21,893,19824,629,107
270,51723,027,059
458,005314,885
6,983,0455,396,7081,829,6917,801,923
97,734,52959,593,563
538,057190,377
9,521,9744,340,6861,981,2744,262,090
146,695,22720,116,343
13,878,32012,100,52322,913,315
32,524,9754,876,694
40,285,05715,250,69017,923,896
686,40912,169,006-1,324,9694,419,975
376,169,876367,529,355
796,743
31,344650,517
73,960
81,017
605,874678,374
89,7882,653
5,630,249
$500.000under
$1,000,000
(6)284,346
200,550,57525,551,75537,981,523
521,64032,469,879
748,057493,653
10,355,4624,815,5692,734,605
12,455,996121,765,20770,959,252
1,009,733534,413
14,707,3944,764,4682,053,2804,765,859
200,550,57528,889,432
18,958,40615,527,08421,280,264
44,805,0566,588,659
64,501,67318,829,25419,935,336
754,31822,020,002
8,698,3085,735,545
448,293,093438,284,938
1,039,374
59,583758,397150,205
43,141
705,212671,518106,974
2,1676,471,584
67

Corporation Income Tax Retums, 1994
Table 2.--Selected Balance Sheet, Income Statement, and Tax Items, by Asset Size '--Continued[All figures are estimates based on samples-money amounts are in thousands of dollars; size of total assets is in whole dollars.]
ItemTotal I
(1)Total deductions...................................... 12,774,8W,O28
Cost of goods sold 3.............................. 7,624,876,881
Compensation of officers ...................... 281,813,040S 4......
Salaries and wage . ...................... 1,124,366,115
Repairs................................................. 112,355,063
Bad debts .............................................. 67,852,016
Rent on business property .................... 220,021,860
Taxes paid ........ I ................................... 313,695,311
Interest paid .......................................... 611,155,531
Cont~butions or gifts ............................. 7,102,825
-Amordization ...... .... ........................................... -40,583,270-
Depreciation ......................................... 401,630,411
Depletion........* ............ **"* .... ---*
...... 9,423,790
Advertising ......****** .............. -* ... *"** ... -
151,457,062
Pension, profit sharing, stock bonus
and annuity plans.............................. 76,875,678Employee benefit programs.................. 160,454,207
-Net loss-, noncapital assets....... .......... - -31,642,356Other deductions .................................. 1,539,582,613
Total receipts less total deductions ....... 585,119,129Constructive taxable income
from related foreigr~corporations ...... 36,583,240
Net income (less deficit) .......................... 577,277,530Net income, total ................................... 739,502,875
-Deficit, total.-.-...'. -"-*
-*-
' :------* *
........ --162,225,345-Net i noo me (less deficit), Form 11 20-A ..... 27,466
Net i noo me (less deficit), Form 11 20-F..... -5,262,613
Net i nco me (less defi cit), Form 11 20S 2. - 73,951,5416
Statutory special deductions, total ...... 142,297,660Net operating loss deduction ................ 48,901,938
Dividends received deduction ............... 13,982,146
Public utility dividends paid deduction.. 99,426
Income subject totax .
.7........................... 493,996,239
Income tax before credits, total ............ 172,776,719Regular tax ...................................... ... 167,547,891Personal Holding Company tax ............ 12,296Recapture of investment and low-
income housing credits ..................... 54,924
Alternative minimum tax....................... 4,459,253
Environmental tax................................. 620,502
Foreign tax credit ..................................*-*
25,401,339U.S. possessions tax credit ....................... 3,792,925Orphan drug credit ..................................... 21,166
Nonconventional source fuel credit........... 592,083
General business credit............................. 4,109,836
Prior-year minimum tax credit.................... 3,339,643
Total Income tax after credits ................. 135,519,687
Footnotes at end of table.
Zero assets
(2)
198,829,884
78,258,1234,589,242
14,246,027856,927
4,432,3243,592,4123,426,780
49,856,74545,010
- 611,546-3,380,027
66,2851,632,790
521,9201,338,978
- 4,402,761-27,571,9874,849,309
12,367-5,155,50110,326,07015;481-1571 --
-25,413-5,262,613
-89,7093,257,0102,032,456
97,331
4,955,2891,748,0251,648,664
*47
43,4675,117
11,23857,849
2,836*43
16,82128,546
1,630,692
Size of total assets--Continued$1
under$100,000
(3)452,308,302
162,880,63164,092,39764,258,116
4,594,252977,"8
20,847,49015,291,4602,706,260
95,753- 427,921
6,999,50627,603
5,117,169
$100,000under
$250,000(4)
385,TT7,433184,770,21937,068,91550,986,852
3,938,482805,758
14,684,19112,668,8413,450,688
69,475518,292
7,490,81319,421
3,728,850
4,358,883 2,400,5313,661,269 3,250,655
- 598,225- - - 422,89595,373,921 59,502,5547,519,675 5,779,412
*4607,515,110
20,936,332-13,421,222- -
3,148
8,877,4202,507,5192,485,921
18,600
2,729,134500,136495,953
*1,200
5,758,67214,512,802
8,754,131-9,582
5,110,7891,965,0991,913,428
44,726
3,506,176651,607641,707
*806
1,755*50
*7,61831
*1168,047*598
483,725
3,683*17
*177155
*4249,5603,133
.638,158
$250,000under
$500,000(5)
369,976,836
204,136,52626,998,52043,309,219
3,528,5801,023,007
10,940,69811,045,6423,822,406
87,199- 454,0507,461,222
17,7923,547,633
$500,000under
$1,000,000T6)
440,113,125267,300,137
24,209,93145,108,222
4,112,6211,223,984
10,459,94912,218,0474,887,949
90,863
V -541
856-
39,4513,959,521
1,725,4203,313,341
279,85548,285,727
6,193,040
*8816,162,576
13,279,869- 7,1-17,293-
40,150
4,280,0071,642,1561,570,600
65,039
4,315,526868,588851,962
*11,257
15,453*63
*2,84018
*44315,1898,417
841,682
1,908,0833,971,928
- 407,35850,812,535
8,179,968
*2918,120,676
15,720,771-7,600,095
5,666,1501,724,2541,641,768
73,549
5,281,3041,213,8811,190,983
*1,007
20,74945
4,7964,527
*8921,47810,151
1,172,841
68

Corporation Income Tax Returns, 1994
Table 2.--Selected Balance Sheet, Income Statement, and Tax Items, by Asset Size '--Continued(All figures are estimates based on samples-money amounts are in thousands of dollars; size of total assets is in whole dollars.]
Item
Number of returns ....................................
Total assets...............................................Cash .......................................................Notes and accounts receivable..............
Less: Allowance for bad debts..........Inventories.............................................Investment in U.S. Governmentobligations.............................................Tax-exempt securities...........................Other current assets...............................Loans to stockholders ...........................Mortgage and real estate loans .............Other investments.................................Depreciable assets ................................
Less: Accumulated depredation ........Depletable assets ..................................
Less: Accumulated depletion .............Land......................................................Intangible assets ...................................
Less: Accumulated amortization ........Other assets..........................................
Total liabilities.......Accounts payable ..................................Mortgages, notes, and bonds payable
in less than 1 year..............................Other current liabilities..........................Loans from stockholders .......................Mortgages, notes, and bonds payable
in 1 year or more ................................Other liabilities .......................................Net worth ...............................................
Capital stock .....................................Paid-in or capital surplus..................Retained earnings, appropriated......Retained earnings, unappropriated..Other retained earnings (1 120S)......Less: Cost of treasury stock............
Total receipts ............................................Business receipts ..................................Interest..................................................Interest on State and localGovernment obligations .....................
Rents.....................................................Royalties ................................................Net short-term capital gain less
net long-term capital loss...................Net long-term capital gain less
net short-term capital loss ..................Net gain, noncapital assets ...................Dividends, domestic corporations .........Dividends, foreign corporations .............Other recei pts...
Footnotes at end of table.
$1,000,000under
$5,000,000
L7)
296,105622,752,583
60,171,683134,006,300
2,206,512124,084,905
3,736,1052,370,093
33,503,4859,236,8386,130,718
43,981,404327,532,533178,980,763
2,496,9541,155,168
36,849,65313,923,4535,802,878
12,873,781622,752,583
93,778,295
86,203,69054,966,58951,173,415
130,017,42130,410,184
176,202,98943,822,84574,395,844
1,835,66729,397,29440,849,01714,097,678
1,370,529,9981,341,088,721
3,557,592
245,3142,316,649
453,164
133,787
1,910,4421,825,417
398,40552,780
18,547,727
$5,000,000under
$10,000,000
L8)43,450
301,453,25625,632,14667,689,499
1,436,24763,187,415
3,295,8841,642,681
17,002,8413,063,3392,579,020
26,440,950140,876,15772,613,768
1,596,079588,923
12,959,2599,275,4814,855,1695,706,613
301,453,25643,060,900
50,201,83831,092,00714,044,222
56,167,92313,748,88293,137,48421,670,30643,332,872
630,4524,817,618
27,783,9055,097,668
622,852,479607,736,314
1,928,475
162,1281,031,846
182,818
80,238
1,152,944819,773226,219
35,1899,496,535 1
$10,000,000under
$25,000,000
L9)27,584
424,684,77130,980,915
101,240,2232,361,707
72,107,421
13,101,9785,765,188
24,386,2682,733,5655,422,839
45,395,164179,692,841
89,232,9162,881,2101,330,289
15,127,85512,409,0764,767,434
11,132,574424,684,771
56,154,583
57,096,66364,805,48813,945,544
76,264,73822,789,152
133,628,60428,143,77971,183,690
1,132,7161,629,151
37,597,6136,058,344
714,550,154692,727,035
5,083,359
439,8891,795,765
363,578
131,557
1,198,3951,250,764
254,34078,661
11,226,810
Size of total assets--Continued$25
,000,000
under$50,000,000
L1 0)11,922
420,068,45927,085,026
109,197,4432,779,594
45,577,528
$50,000,000under
$100,000,000
Mi8,221
584,488,00930,915,411
149,687,2064,070,628
46,171,853
29,735,95811,364,70922,352,843
1,796,01813,102,87259,844,758
131,693,09662,254,362
3,022,0961,540,911
10,583,07912,957,0434,142,153
12,473,010420,068,459
44,613,544
36,662,132113,188,405
6,830,314
61,644,54325,080,163
132,049,35729,685,15384,776,642
769,356-1,547,006
22,472,3414,107,129
461,844,870435,954,616
9,912,012
863,6231,381,600
505,801
199,745
1,086,938939,501282,763170,449
10,547,822
51,297,88524,783,53227,624,242
1,756,99532,007,937
104,060,178141,049,02463,849,942
4,347,2512,196,298
10,775,76420,047,371
5,736,48315,816,710
584,488,00949,307,190
37,246,545187,140,706
6,935,544
74,018,45935,427,865
194,411,70140,318,742
137,678,5211,114,2076,618,713
17,166,9378,485,419
456,152,763421,076,322
17,660,344
1,732,0681,718,848
714,369
369,803
1,146J,37O1,035,516
251,739291,874
10155509
$100,000,000under
$250,000,000
(12)
6,899
1,095,048,88947,387,125
235,983,5466,351,356
64,376,026
93,784,00761,667,47855,336,929
2,549,48072,752,932
256,230,230228,767,385100,718,564
7,773,0812,997,710
14,204,07440,945,98810,409,07633,767,316
1,095,048,88979,384,183
53,892,072330,483,991
8,272,801
136,815,19969,169,852
417,030,79185,359,908
317,028,9552,728,710
17,634,36314,328,43720,049,581
668,722,946603,561,410
34,505,617
4,197,0652,938,7161,815,275
916,590
2,222,3511,620,701
613,525856,027
15,475,669
$250,000,000or
more
(13)7,043
19,466,611,909544,837,596
3,884,707,40094,860,072
631,022,094
1,112,400,641602,966,604
1,456,768,73742,825,924
1,522,628,4025,701,661,3083,746,814,6081,625,933,172
122,871,42259,589,127
108,122,350503,732,854106,798,778
1,372,433,11919,466,611,909
1,165,356,959
1,457,874,3595,343,404,366
91,842,784
2,446,377,7373,188,238,9445,773,516,7601,817,901,2653,991,670,952
70,961,4821,398,571,015
7,677,2781,513,265,2327,195,525,5826,019,486,454
702,453,794
36,349,50067,616,16345,350,874
8,863,648
35,223,26623,086,58710,796,97928,789,991
217,508,326
69
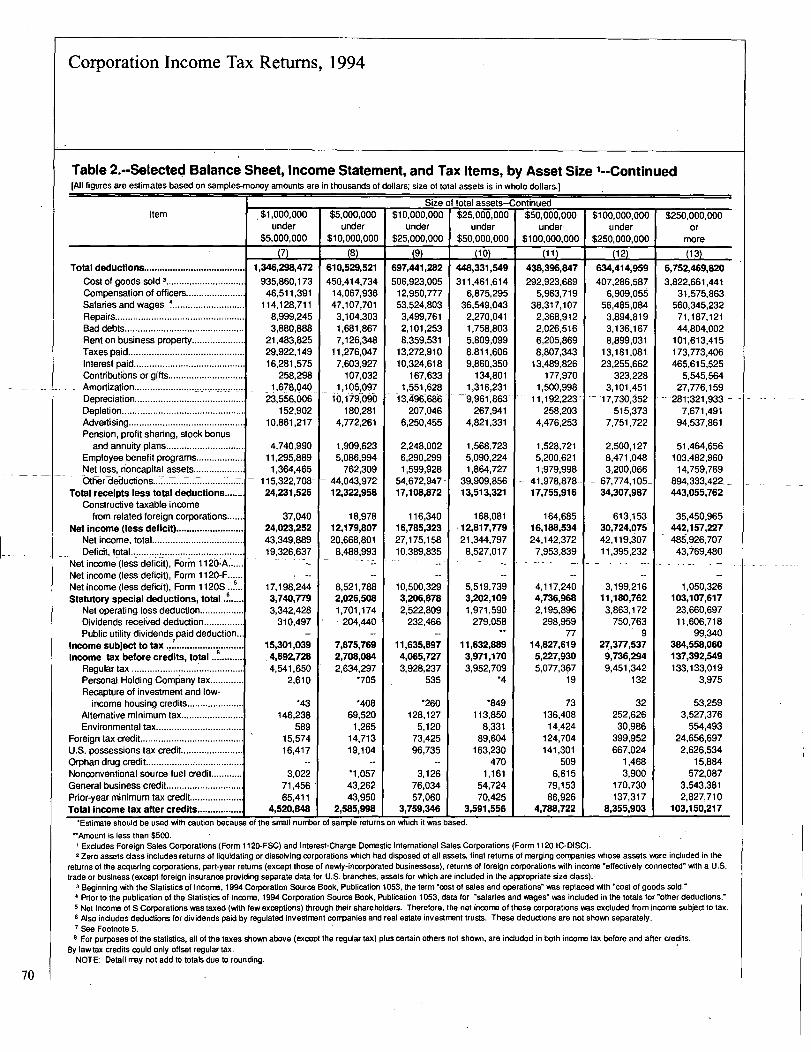
Corporation Income Tax Returns, 1994
Table 2.--Selected Balance Sheet, Income Statement, and Tax Items, by Asset Size '--Continued[All figures are estimates based on samples-money amounts are in thousands of dollars; size of total assets is in whole dollars.)
Item
Total deductions ......................................
Cost of goods sold3 ..............................
Compensation of officers ......................Salaries and wages 4.. ...........................Repairs..................................................Bad debts ..............................................Rent on business property....................Taxes paid.............................................Interest paid ...........................................Cont6buti6ns or gifts.............................Amortization ....................... . --...._._..-Depreciation..........................................Depletion...............................................Advertising ............................................Pension, profit sharing, stock bonus
and annuity plans .............................Employee benefit programs ..................Net loss, noncapital assets...................Other deductions ............................. :W ......
Total receipts less total deductions .......Constructive taxable income
from related foreign corporations ......Net Income (less deficit)..........................
Net income, total...................................Deficit,_ total .......... M .............. : ....................
Net income (less deficit), Form 11 20-A ......Net income (less deficit), Form 11 20-F ......Net income (less deficit), Form 1120S..
*5...
Statutory special deductions, total .......Net operating loss deduction.................Dividends received deduction ...............Public utility dividends paid deduction..
7Income subject to tax ..............................
.Income tax before credits, total .. .........Regular tax ...........................................Personal Holding Company tax .............Recapture of investment and low-income housing credits ......................
Alternative minimum tax........................
Environmental tax ..................................Foreign tax credit........................................U.S. possessions tax credit ........................Orphan drug credit .....................................Nonoonventional source fuel credit ............General business credit .............................Prior-year minimum tax credit ....................Total Income tax after credits.................
.$1,000,000under
$5,000,000
L7)
1,346,298,472
935,860,17346,511,391
114,128,7118,999,2453,880,888
21,483,82529,922,14916,281,575
258,2981,678,040
23,556,006152,902
10,861,217
'4 79450:::90':2
1,364,465115,322,708-24,231,526
37,04024,023,25243,349,88919,326,637
17,198,2443,740,7793,342,428
310,497-
15,301,039.49692,7284,541,650
2,610
*43146,238
58915,57416,417
--
3,02271,45665,411
4,5209848
$5,000,000under
$10,000,000
M610,529,521
450,414,73414,067,93647,107,701
3,104,3031,681,8677,126,348
11,276,0477,603,927
107,0321,105,097
lo,i~abgb180,281
4,772,261
1,109,6235,086,994
762,30944,043-.97212,322,958
18,97812,179,80720,668,801
8,488,993
8,521,7882,026,5081,701,174
204,440--
7,875,7692,70890842,634,297
*705
*40869,520
1,26514,71319,104
--
*11,05743,26243,950
2,585,998
Size of total assets-Continued$10,000,000
under$25,000,000
$25,000,000under
$50,000,000
$50,000,000under-
$100,000,000
(9)697,441,282
506,923,00512,950,77753,524,803
3,499,7612,101,2538,359,531
13,272,91010,324,618
167,6331,551,628
-13,496,666207,046
6,250,455
2,248,0026,290,2991,599,928
54,672,947 -17,108,872
116,34016,785,32327,175,15810,389,835
10,500,3293,206,8782,U2,809
232,466--
11,63598974,065,7273,928,237
535
*260128,127
5,12073,42596,735
--
3,12676,03457,060
3,7599346
(10)448,331,549
311,461,6146,875,295
36,549,0432,270,0411,758,8035,809,0998,811,6069,860,350
134,8011,316,231
--9,961,863267,941
4,821,331
1,568,7235,090,2241,864,727
-39,909,85613,513,321
168,081.12,817,77921,344,797
8,527,017
5,519,7393,202,1091,971,590
279,058
119632,8893,971,1703,952,709
-4
*849113,850
8,33189,604
163,230470
1,16154,72470,425
39591,556
0 1)438,396,847
292,923,6895,963,719
38,317,1072,368,9122,026,5166,205,8698,807,343
13,489,826177,970
1,500,99811,192 223
258:2034,476,253
1,528,7215,200,6211,979,998
- 41,978,878 -17,755,916
164,68516,188,53424,142,372
7,953,839
4,117,2404,736,9682,195,896
298,95977
14,827,6195,227,9305,077,367
19
73136,408
14,424124,704141,301
5096,615
79,15386,926
4,788,722
$100,000,000under
$250,000,000
(12)
634,414,959
407,286,5876,909,055
56,485,0843,894,8193,136,1678,899,031
13,181,08123,255,662
323,2283,101,451
17,730,352-515,373
7,751,722
2,500,1278,471,0483,200,066
67,774,105-34,307,987
613,15330,724,07542,119,210711,395,232
3,199,21611,180,762
3,863,172750,763
927,377,5379,736,2949,451,342
132
32252,626
30,986399,952667,024
1,4683,900
170,730137,317
89355,903
$250,000,000or
more
(13)6,752,469,820
3,822,661,44131,575,863
560,345,23271,187,12144,804,002
101,613,415173,773,406465,615,525
5,545,56427,776,159
281-321,933 -7',671,491
94,537,861
51,464,656103,482,960
14,759,76922894,333,4
443,055,762
35,450,965442,157,22748~,926,707
43,769,480
1,050,326103,107,617
23,660,69711,606,718
99,340384,558,060137,392,549133,133,019
3,975
53,2593,527,376
554,49324,656,6972,626,534
15,884572,087
3,543,3812,827,710
103,150,217*Estimate should be used with caution because of the small nurnber of sanple returns on which it was based.
**Amount is less than $500.Excludes Foreign Sales Corporations (Form 1120-FSC) and Interest-Charge Domestic international Sales Corporations (Form 1120 IC-DISC).Zero assets class includes returns of liquidating or dissolving corporations Mich had disposed of all assets, final returns of merging companies whose assets were included in the
returns of the acquiring corporations, part-year returns (except those of newly-inoorporated businessess), returns of foreign corporations with income "effectively connected" with a U.S.trade or business (except foreign insurance providing separate data for U.S. branches, assets for Mich are included in the appropriate size class).
3 Beginning with the Statistics of Income, 1994 Corporation Source Book, Publication 1053. the term "cost of sales and operations" vyas replaced with "cost of goods sold."4 Prior to the publication of the Statistics of Income, 1994 Corporation Source Book, Publication 1053, data for "salaries and wages" was included in the totals for "other deductions."5 Net income of S Corporations was taxed (with few exceptions) through their shareholders. Therefore, the net income of these corporations was excluded from income subject to tax.6 Aso includes deductions for dividends paid by regulated investment cornpanies and real estate investment trusts. These deductions are not shown separately.I See Footnote 5.
8 For purposes of the statistics, all of the taxes shown above (except the regular tax) plus certain others not shoym, are included in both income tax before and after credits.By lawtax credits could only offset regular tax.
NOTE: Detail may not add to totals due to rounding.
70

ForeignmControlled Domestic Corporations, 1994by James R. Hobbs
F
or Tax Year 1994, the 54,620 domestic corpora-tions each "controlled" by a foreign "person"generated $1.4 trillion of total receipts and reported
total assets amounting to $2.3 trillion. These corporations,1.3 percent of the U.S. total, accounted for 10.3 percent ofthe receipts and 10.0 percent of the assets reported on U.S.corporation income tax returns. They also represented 7.0percent of the "taxable income" and 7.4 percent of thetotal income tax after credits reported by all corporations.
The net income (less deficit) reported by foreign-controlled domestic corporations (FCDC's) for tax pur-poses under the Internal Revenue Code was $21.9 billionfor 1994. This was an increase over the $11.2 billion ofnet profits reported for 1993 [1]. Placed in context, the netincome (less deficit) reported on all corporation incometax returns increased from $498.2 billion for 1993 to$577.3 billion for 1994 [2].
Of all the FCDC's, 21,369 reported (positive) netincome for 1994, totaling $44.7 billion, a 24.5 percentincrease over the $35.9 billion of net income for 1993.The profitable companies for 1994 also reported $34.4billion of taxable income after statutory special deductions(i.e., "income subject to tax" shown in the statistics), 22.9percent higher than their taxable income for 1993. TheU.S. tax liability (i.e., "total income tax after credits") ofFCDC's was $10.1 billion, 23.5 percent greater than thatof the previous year.
For 1994, the 2,488 "large" companies (i.e., those withat least $250 million ofassets, or with at least $50 millionof receipts, or with both) accounted for most of the keyfinancial items of all FCDC's: 91.9 percent of total assets,90.4 percent of total receipts, 87.2 percent of taxableincome, and 86.2 percent of total income tax after credits.After an overview ofall FCDC's, this article focuses onthe large foreign-controlled domestic companies andcompares them on industry and age bases to large domes-tic corporations that were not controlled by foreign per-sons.
Direct Foreign Investment in the UnitedStatesDirect foreign investment in the United States can takeseveral forms, including corporations, partnerships, andeven joint ventures. Under these forms ofdirect invest-ment, the foreign investor has sufficient equity in theenterprise to control and participate iti'managing itsoperations [3]. In regard to corporations, a foreign
James R. Hobbs is a management official with the SpecialStudies and Publications Branch.
investor can either gain control ofan existing U.S.company, create a new company incorporated in theUnited States, or operate in the United States through abranch of a foreign corporation.
There are numerous factors involved in the decision ofa foreign investor to operate in the United States througheither a domestic or foreign corporation [4]. This articlefocuses on domestic corporations that are controlled by aforeign person [5]. Control is generally defined as owner-ship by any foreign person or entity (including an indi-vidual, corporation, partnership, estate, or trust), directlyor indirectly, of 50 percent or more of a U.S. corporation'svoting stock at the end of the tax year. (This is discussedin greater depth in the Data Sources and Limitationssection. Also, a description of foreign persons and anexplanation of the rules of ownership attribution are givenin the Explanation of Selected Terms section.)
This article includes two basic tables that show balancesheet, income statement, and tax items, as well as variousratios. Table I includes information for all FCDC's byselected industrial groupings and selected countries.Country information is based on the location of theowner's country of residence, incorporation, organization,creation, or administration, as reported on tax returns filedwith the Internal Revenue Service (IRS). Table 2 presentsinformation on "large" FCDC's, classified by selectedindustrial groupings, selected countries, and age of thecompanies. For comparison purposes, this table alsocontains data for large domestic corporations that were notcontrolled by foreign persons. Domestic corporations thatare not foreign controlled can file on Form 1120, U.S.Corporation Income Tax Return; Form I I20-A, U.S.Corporation Short-Form Income Tax Return; Form 1120-L, U.S. Life Insurance Company Income Tax Return; Form1120-PC, U.S. Property and Casualty Insurance CompanyIncome Tax Return; Form 1120-REIT, US. Income TaxReturnfor Real Estate Investment Trusts; and Form 1120-RIC, US. Income Tax Return for Regulated InvestmentCompanies. FCDC's can also file tax returns on Forms1120, 1120-L, I I 20-PC, I I20-REIT, and I I20-RIC, butnot on I 120-A. Because FCDC's cannot file Forms1120S, US. Income Tax Returnfor an S Corporation, andbecause S Corporations are mostly taxable income report-ing, but not taxpaying, entities (in that income is taxed tothe shareholders), these forms were excluded from the datafor domestically-controlled corporations shown in thefigures and tables of this article. Also, FCDC's cannot fileForms I I 20-F, U.S. Income Tax Return ofa ForeignCorporation. Domestically-controlled corporation datashown in this article do not include Forms I I 20-F, al-
71

Foreign-Controlled Domestic Corporations, 1994
though data for all corporation returns do include theseforms (as well as Forms I I 20S).
Foreign-Controlled Domestic Corporations
Growth of CorporationsDirect foreign investment in the United States throughforeign-controlled domestic corporations grew steadily andsubstantially during the 1985-1994 period [6]. Totalreceipts of FCDC's grew from $0.5 trillion for 1985 to$1.4 trillion for 1994, a 166.5 percent increase usingcurrent dollars. In comparison, total receipts reported onall U.S. corporation income tax returns grew from $8.4trillion for 1985 to $13.4 trillion for 1994, a 59.5 percentincrease [7]. As a result.ofthe-rapid growth rate-ofFCDC's,their share of the receipts reported on all corporate returnsincreased from 6.1 percent for 1985 to 10.3 percent for1994 (see Figure A).
The growth ofFCDC's can also bein'
easured from the-early 1970's, when a question concerning foreign owner-ship ofcompanies was first placed on the corporation- - -income tax return. For 197 1, these companies reported$39.2 billion of total receipts, just 2.1 percent of the $1.9
Figure A
trillion reported for all corporations.Figure A also shows that FCDC total receipts as a
percentage of the total receipts ofdomestic corporations(excluding Forms 1120S) increased from 6.5 percent for1985 to 12.4 percent for 1994. While the receipts ofFCDC's increased at a greater pace than did those ofdomestic corporations not foreign controlled during this10-year period, the profit margin (as measured by thepercentage of net income less deficit to total receipts) ofFCDC's was consistently lower than that of the otherdomestic corporations (see Figure 13).
Figures A and B provide a global, or first, comparisonof FCDC's to other domestic corporations. However, amore complete comparison requires that-the data take. into--account characteristics other thanjust ownership status,such as the industrial activities, sizes, and ages within thetwo groups of corporations. Later in this article, this typeofcomparison is presented for the returns of "large"corporations. ff-
There were an estimated 54,620.retums o oreign-controlled domestic corporations for 1994, a slight in-crease over the 54,001 returns for 1993. (FCDC's, like
Foreign-Controlled Domestic Corporations as a Percentage of Other Corporations, Based on Total
Receipts, Tax Years 1985-1994
Percentage
15 r
10
0
As a percentage of domestic corporations I
6.1 6.3
1985 1986 1987 1988 1989
Tax year
As a percentage of all corporations
12.4
10.3
1990 1991 1992 1993 1994
72 11 Excludes Forms 1120S, U.S. Income Tax Return for an S Corporation.
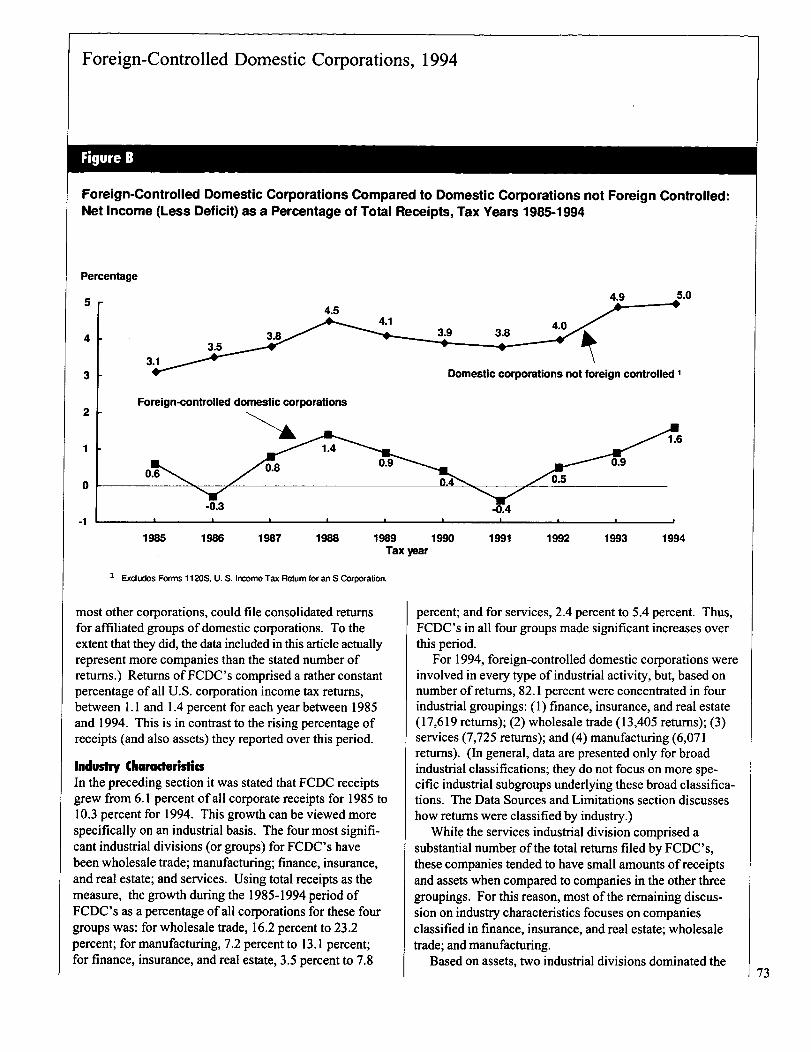
Foreign-Controlled Domestic Corporations, 1994
Figure B
Foreign-Controlled Domestic Corporations Compared to Domestic Corporations not Foreign Controlled:Net Income (Less Deficit) as a Percentage of Total Receipts, Tax Years 1985-1994
Percentage
5
4
3
2
1
0
-1
3.53.1
4.5
Foreign-controlled domestic corporations
0.6 0.8
1.40.9
-0.3
4.9
Domestic corporations not foreign controlled I
OA
-0.4
0.5
0.9
1.6
1985 1986 1987 1988 1989 1990 1991 1992 1993 1994Tax year
1 Excludes Forms 1120S, U.S. Income Tax Return for an S Corporabon.
most other corporations, could file consolidated returnsfor affiliated groups ofdomestic corporations. To theextent that they did, the data included in this article actuallyrepresent more companies than the stated number ofreturns.) Returns of FCDC's comprised a rather constantpercentage of all U.S. corporation income tax returns,between 1. 1 and 1.4 percent for each year between 1985and 1994. This is in contrast to the rising percentage ofreceipts (and also assets) they reported over this period.
industry CharaderisticsIn the preceding section it was stated that FCDC receiptsgrew from 6.1 percent ofall corporate receipts for 1985 to10.3 percent for 1994. This growth can be viewed morespecifically on an industrial basis. The four most signifi-cant industrial divisions (or groups) for FCDC's havebeen wholesale trade; manufacturing; finance, insurance,and real estate; and services. Using total receipts as themeasure, the growth during the 1985-1994 period ofFCDC's as a percentage ofall corporations for these fourgroups was: for wholesale trade, 16.2 percent to 23.2percent; for manufacturing, 7.2 percent to 13.1 percent;for finance, insurance, and real estate, 3.5 percent to 7.8
percent; and for services, 2.4 percent to 5.4 percent. Thus,FCDC's in all four groups made significant increases overthis period.
For 1994, foreign-controlled domestic corporations wereinvolved in every type of industrial activity, but, based onnumber of returns, 82.1 percent were concentrated in fourindustrial groupings: (1) finance, insurance, and real estate(17,619 returns); (2) wholesale trade (13,405 returns); (3)services (7,725 returns); and (4) manufacturing (6,071returns). (In general, data are presented only for broadindustrial classifications; they do not focus on more spe-cific industrial subgroups underlying these broad classifica-tions. The Data Sources and Limitations section discusseshow returns were classified by industry.)
While the services industrial division comprised asubstantial number of the total returns filed by FCDC's,these companies tended to have small amounts of receiptsand assets when compared to companies in the other threegroupings. For this reason, most of the remaining discus-sion on industry characteristics focuses on companiesclassified in finance, insurance, and real estate; wholesaletrade; and manufacturing.
Based on assets, two industrial divisions dominated the73
Foreign-Controlled Domestic Corporations, 1994.
74
total for 1994. Finance, insurance, and real estate ~ndmanufacturing accounted for $1.1 trillion
'and $0.7 trillion
oftotal assets, respectively, for a combined 76.5 percent ofthe $2.3 trillion of assets for all FCDC's. These twodivisions made*up a similar portion of the total assetsreported on returns of other corporations. In this respect,FCDC's closely mirrored other corporations.
Alternatively, on the basis of total receipts, manufactur-ing and wholesale trade continued to be the two primaryindustrial categories for FCDC's for 1994. Manufacturersreported $0.6 trillion ofreceipts, while wholesalers re-ported $0.4 trillion. These two groups accounted for 72.9percent of the $1.4 trillion of total receipts recorded for allFCDC's. This percentage was substantially'higher thanthe-compaYable one (42.8 percent) for other corporations-- -that filed U.S. corporation income tax returns.
Companies classified in different industries often havedifferent financial characteristics. For instance, the com-parative levels of total assets and total receipts of compa-nies primarily engaged in wholesale trade activities differsignificantly from those primarily engaged in finance,insurance, and real estate activities. FCDC wholesalersproduced large amounts of receipts with relatively smallamounts ofassets (as of the end oftheir accounting peri--ods),nesulting in $1.
-80
-of receipts for each dollar of assets
for 1994. Companies classified in finance, insurance, andreal estate reported large amounts ofassets, but relativelysmall amounts ofreceipts. These FCDC's produced only$.14 of receipts for each dollar ofassets. Other corpora-tions in these two industrial categories had similar charac~teristics.
While foreign-controlled domestic corporations ac-counted for one-tenth of the $13.4 trillion of total receiptsreported by all corporations filing U.S. income tax returnsfor 1994, these companies played disproportionately largerroles in-certain industrial groups. For instance, FCDC'sproduced very substantial parts of the total receipts re-ported for mining (30.8 percent) and wholesale trade (23.2percent). FCDC's also accounted for 13.1 percent of thereceipts reported by all manufacturing companies. Con-versely, FCDC.involvement in the agriculture, forestry,and fishing; construction; transportation and public utili-ties; retail trade; services; and finance, insurance, and realestate industrial divisions was relatively low for 1994,accounting for only 1.7, 1.9, 2.4, 3.5, 5.4, and 7.8 percents,respectively, of the receipts for all companies classified inthese categories.
While FCDC's accounted for 30.8 percent of thereceipts for all mining companies for 1994, companies inthis industrial division are not a major source of FCDC-activity. Thus, they are not a major focus of this article.
In compa:rison to the four industrial groupings shown inTable 1, mining accounted for only 1.7 percent of the totalFCDC returns for 1994, 2.6 percent of the total FCDCreceipts, and 3. 1 percent of the total FCDC assets. '
Statistics classified by industry do have certain limita-tions, which are discussed more thoroughly in the DataSources and Limitations section, below. However, a briefpoint should be made here. FCDC's accounted for 23.2percent of the receipts ofall companies classified aswholesalers. This percentage may be subject to certainlimitations. For example, certain U.S. companies (notforeign controlled) and their subsidiaries may have beeninvolved in both the manufacturing and wholesaling ofproducts and reported tax information for these activities
-on a single (consolidated) -income tax-return, which was-classified under manufacturing, rather than trade. Con-versely, many domestic companies controlled by foreigncorporations acted as wholesalers in the United States forproducts manufactured overseas by their parent, or otherrel
-ated,_ companies. These domestic companies would
have been classified in the wholesale trade industrialgrouping.
Country ChoraderiistinDomestic corporations can be controlled by "persons"
-fesident in-any -country throughout the world. However,for 1994, owners from 10 countries controlled 59.2 percentof the 54,620 domestic corporations classified as 50-percent-or-more controlled by a foreign persoln (see Table 1).(The countries represent the geographic location ofthedirect foreign owner's place ofresidence in the case ofindividuals, and place of incorporation, organization,creation, or administration in the case of other persons.Because holding companies located in a country differentfrom that of the ultimate owner may directly own the stockof U.S. affiliates, the country reported on the tax returnmay not necessarily reflect the country ofthe ultimateowner. No data on the extent ofthis potential limitationare available.) The 32,336 corporations controlled bypersons from the 10 countries accounted for the majorportion of the most significant financial items (such as,total assets, 90.4 percent; total receipts, 88.3 percent; totaltaxable, income, 83.9. percent; and, total income tax aftercredits, 89.7 percent) for all FCDC's.
Domestic corporations controlled by Japanese personshad assets of $559 billion and total receipts of $400 billionfor 1994, amounts easily larger than those for any othercountry. These assets and receipts represented 23.9 and29.2 percents of the respective totals for all FCDC's.(Companies controlled by Japanese persons also accountedfor the largest amount ofassets and receipts for each of the
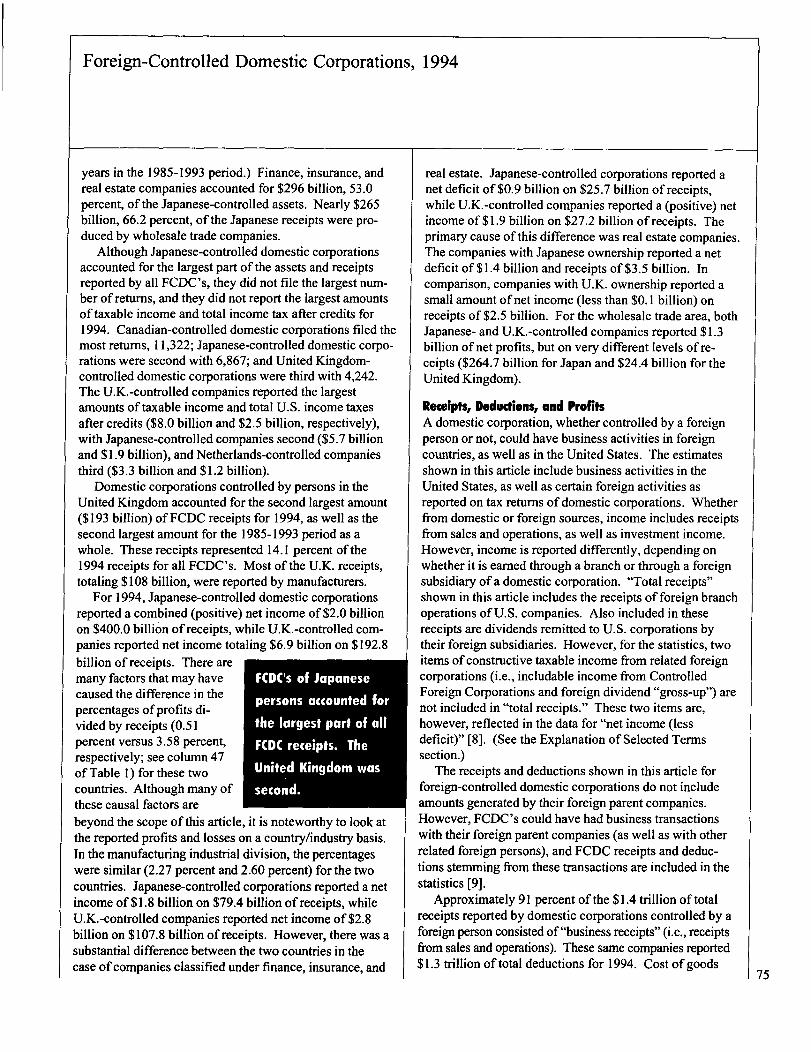
Foreign-Controlled Domestic Corporations, 1994
years in the 1985-1993 period.) Finance, insurance, andreal estate companies accounted for $296 billion, 53.0percent, of the Japanese-controlled assets. Nearly $265billion, 66.2 percent, of the Japanese receipts were pro-duced by wholesale trade companies.
Although Japanese-controlled domestic corporationsaccounted for the largest part of the assets and receiptsreported by all FCDC's, they did not file the largest num-ber ofreturns, and they did not report the largest amountsof taxable income and total income tax after credits for1994. Canadian-controlled domestic corporations filed themost returns, 11,322; Japanese-controlled domestic corpo-rations were second with 6,867; and United Kingdom-controlled domestic corporations were third with 4,242.The U.K.-controlled companies reported the largestamounts of taxable income and total U.S. income taxesafter credits ($8.0 billion and $2.5 billion, respectively),with Japanese-controlled companies second ($5.7 billionand $1.9 billion), and Netherlands-controlled companiesthird ($3.3 billion and $1.2 billion).
Domestic corporations controlled by persons in theUnited Kingdom accounted for the second largest amount($193 billion) ofFCDC receipts for 1994, as well as thesecond largest amount for the 1985-1993 period as awhole. These receipts represented 14.1 percent of the1994 receipts for all FCDC's. Most of the U.K. receipts,totaling $108 billion, were reported by manufacturers.
For 1994, Japanese-controlled domestic corporationsreported a combined (positive) net income of $2.0 billionon $400.0 billion of receipts, while U.K.-controlled com-panies reported net income totaling $6.9 billion on $192.8billion ofreceipts. There arcmany factors that may havecaused the difference in thepercentages ofprofits di-vided by receipts (0.51percent versus 3.58 percent,respectively; see column 47of Table 1) for these twocountries. Although many ofthese causal factors are
FCDC's of Japanese
persons accounted for
the largest part of all
FCDC receipts. The
United Kingdom was
second.
beyond the scope of this article, it is noteworthy to look atthe reported profits and losses on a country/industry basis.In the manufacturing industrial division, the percentageswere similar (2.27 percent and 2.60 percent) for the twocountries. Japanese-controlled corporations reported a netincome of $1.8 billion on $79.4 billion ofreceipts, whileU.K.-controlled companies reported net income of $2.8billion on $107.8 billion ofreceipts. However, there was asubstantial difference between the two countries in thecase ofcompanies classified under finance, insurance, and
real estate. Japanese-controlled corporations reported anet deficit of $0.9 billion on $25.7 billion ofreceipts,while U.K.-controlled companies reported a (positive) netincome of$1.9 billion on $27.2 billion of receipts. Theprimary cause of this difference was real estate companies.The companies with Japanese ownership reported a netdeficit of $1.4 billion and receipts of$3.5 billion. Incomparison, companies with U.K. ownership reported asmall amount ofnet income (less than $0. 1 billion) onreceipts of $2.5 billion. For the wholesale trade area, bothJapanese- and U.K.-controlled companies reported $1.3billion of net profits, but on very different levels of re-ceipts ($264.7 billion for Japan and $24.4 billion for theUnited Kingdom).
Receipts, Deductions, and ProfitsA domestic corporation, whether controlled by a foreignperson or not, could have business activities in foreigncountries, as well as in the United States. The estimatesshown in this article include business activities in theUnited States, as well as certain foreign activities asreported on tax returns of domestic corporations. Whetherfrom domestic or foreign sources, income includes receiptsfrom sales and operations, as well as investment income.However, income is reported differently, depending onwhether it is earned through a branch or through a foreignsubsidiary ofa domestic corporation. "Total receipts"shown in this article includes the receipts of foreign branchoperations ofU.S. companies. Also included in thesereceipts are dividends remitted to U.S. corporations bytheir foreign subsidiaries. However, for the statistics, twoitems ofconstructive taxable income from related foreigncorporations (i.e., includable income from ControlledForeign Corporations and foreign dividend "gross-up") arenot included in "total receipts." These two items are,however, reflected in the data for "net income (lessdeficit)" [8]. (See the Explanation ofSelected Termssection.)
The receipts and deductions shown in this article forforeign-controlled domestic corporations do not includeamounts generated by their foreign parent companies.However, FCDC's could have had business transactionswith their foreign parent companies (as well as with otherrelated foreign persons), and FCDC receipts and deduc-tions stemming from these transactions are included in thestatistics [9].
Approximately 91 percent of the $1.4 trillion of totalreceipts reported by domestic corporations controlled by aforeign person consisted of"business receipts" (i.e., receiptsfrom sales and operations). These same companies reported$1.3 trillion oftotal deductions for 1994. Cost of goods
75

Foreign-Controlled Domestic Corporations, 1994
76
sold was 67 percent of the total.It is noteworthy to look at the "gross profit" of FCDC's.
Gross profit is the difference between business receiptsand cost of goods sold. The manufacturing and wholesaletrade industrial groupings accounted for most of thereported amounts of business receipts and cost ofgoodssold. Manufacturers had substantially higher gross profitsthan did wholesalers. As shown in column 39 ofTable 1,for every dollar of business receipts, manufacturers re-ported $.69 of cost of goods sold. By comparison, whole-salers reported $.84 ofcost of goods sold for each dollarofbusiness receipts.
Total receipts less total deductions for FCDC'samounted to a-positive $21.0 billion for 1 994. This issomewhat different from. the $21.9 billion ofnet income(less deficit) reported by these companies. Total receiptsless total deductions includes all of the income "actually"(as opposed to "constructively") received by corporationsand reported on tax returns. Unlike net income (lessdeficit), total receipts less total deductions includes-non-taxable interest on State and local Government obligationsand excludes the two items ofconstructive taxable income'from related foreign corporations described herein. For1994, FCDC's received $0.7 billion oftax-exempt intereston State -and local-Government obligations- and- reported - -$1.7 billion ofconstructive taxable income.
Theprevious paragraph discussed the difference, forstatistical purposes, between total receipts less total deduc-tions and net income (less deficit). It is also important tomake a distinction between (positive) net income andtaxable income (i.e., "income subject to tax" shown in thestatistics). Because certain statutory special deductions,including the "net operating loss" deduction, were avail-able to most companies in computing their taxable income,the statistics for net income are generally larger than theamounts shown for taxable income.
Net income (less deficit) for foreign-controlled domes-tic corporations was $21.9 billion for 1994, up from the$11.2 billion for 1993. Net income (less deficit) reportedon all corporation income tax returns also increased between1993 and 1994, from $498.2 billion to $577.3 billion.
The performance of FCDC's in three of the four princi-pal industrial groups shown in Table I improved for 1994.Companies whose principal business activity was inmanufacturing reported $13.8 billion of net income (lessdeficit), a significant rise from the $
'8.4 billion of income
reported for 1993. Wholesalers also reported a substantialincrease in net income ($3.4 billion) fdr 1994, compared tothe $0.5 billion-f~r the previous year.- The services groupimproved its performance by reducing overall net lossesfrom $0.7 billion for 1993 to $0.4 billion for 1994. How-
ever, the performance of the finance, insurance, and realestate group in regard to net income decreased to $2.2billion from $2.8 billion for the previous year.
The $21.9 billion of net income (less deficit) was theresult of 21,369 corporations reporting $44.7 billion of(positive) profits and 33,251 companies reporting $22.8billion of deficits [10]. Thus, fewer than 4 out of every 10(39.1 percent) domestic corporations with foreign ownersreported a (positive) profit for 1994. In comparison, 55.3percent ofall other corporations filing U.S. income taxreturns for the same year reported a (positive) profit. Thepercentage of FCDC's reporting a profit for 1994 waswithin the range of percentages for the 1985-1993 periodas a whole, varying between 38.7 percent and 43.3 percent.Also-,- -while -the- (positive) profits of FCDC's increased - - -from $35.9 billion for 1993 to $44.7 billion for 1994, anddeficits decreased from $24.7 billion to $22.8 billion, thenumber ofFCDC's reporting profits actually decreasedbetween 1993 and 1994 (from 22,007 to 21,369), and thenumber reporting losses increased (from-3 1,994 to-33,251).
The percentage ofcompanies reporting (positive)profits varied among the different industrial groups.About half of the FCDC's classified in manufacturing
--(51.4-percent), services-(48.8 percent), and wholesale-_trade (44.2 percent) reported profits for 1994. However,
less than one-third (31.2 percent) of the companies classi-fied in finance, insurance, and real estate reported profits.Real estate companies primarily accounted for this lowpercentage, with only 3,888 of the 13,301 returns classi-fied in this industry reporting profits (29.2 percent).
Over six out of every 10 FCDC's reported a deficit for1994. Collectively, these companies had $22.8 billion indeficits, a smalld.ecrease from the $24.7 billion of deficitsreported f6r 1993. Deficits could be carried back orforward to other tax years, under prescribed rules, toreduce the taxable income of those years (see "net operat-ing loss deduction" in the Explanation of Selected Termssection).' When a company "carried back" a deficit to aprevious tax year, it could file either Form 1 120X,Amended U.S. Corporation Income Tax Return, or Form1139, Corporation Application for Tentative Refund.These forms are not included in the statistics for foreign-controlled domestic corporations. However, net operatinglosses carried forward to Tax Year 1994 from years priorto then are included in the statistics as part of the computa-tion of"income subject to tax" (discussed below).
TaxesFor 1994, foreign-'controlled domestic corporationsreported $34.4 billion of"income subject to tax" (or
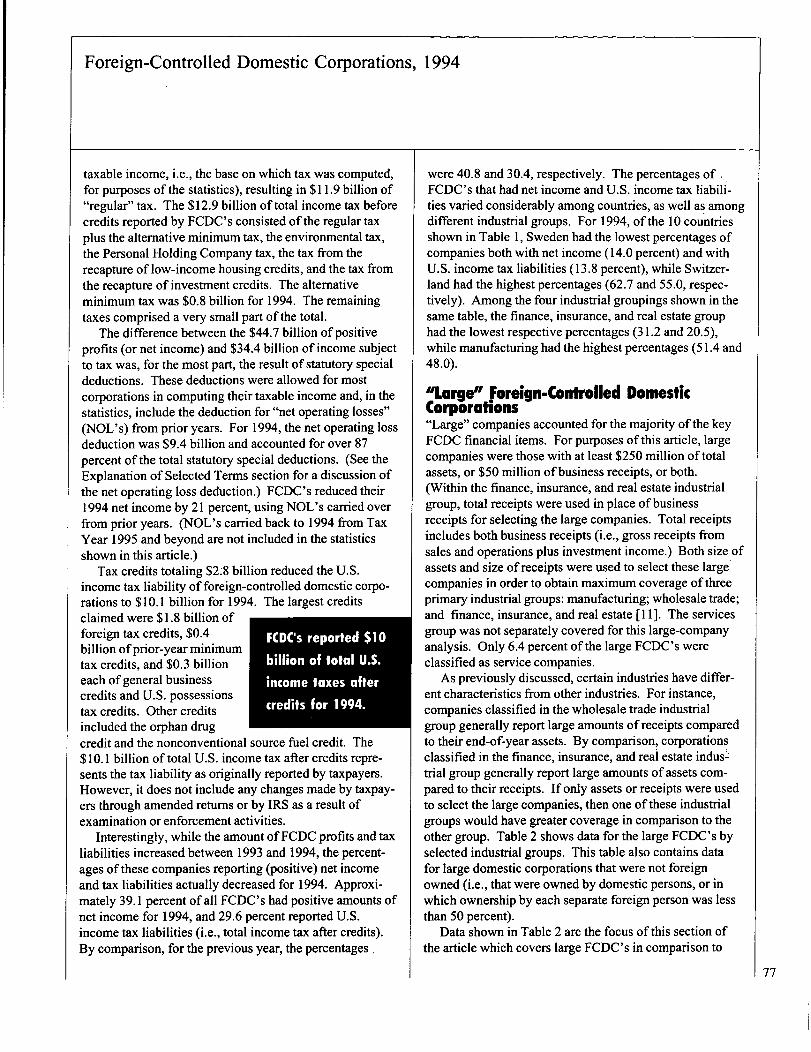
Foreign-Controlled Domestic Corporations, 1994
taxable income, i.e., the base on which tax was computed,for purposes of the statistics), resulting in $11.9 billion of"regular" tax. The $12.9 billion of total income tax beforecredits reported by FCDC's consisted of the regular taxplus the alternative minimum tax, the environmental tax,the Personal Holding Company tax, the tax from therecapture of low-income housing credits, and the tax fromthe recapture of investment credits. The alternativeminimum tax was $0.8 billion for 1994. The remainingtaxes comprised a very small part of the total.
The difference between the $44.7 billion of positiveprofits (or net income) and $34.4 billion of income subjectto tax was, for the most part, the result of statutory specialdeductions. These deductions were allowed for mostcorporations in computing their taxable income and, in thestatistics, include the deduction for "net operating losses"(NOL's) from prior years. For 1994, the net operating lossdeduction was $9.4 billion and accounted for over 87percent of the total statutory special deductions. (See theExplanation of Selected Terms section for a discussion ofthe net operating loss deduction.) FCDC's reduced their1994 net income by 21 percent, using NOL's carried overfrom prior years. (NOL's carried back to 1994 from TaxYear 1995 and beyond are not included in the statisticsshown in this article.)
Tax credits totaling $2 billion reduced the U.S.income tax liability of foreign-controlled domestic corpo-rations to $ 10. 1 billion for 1994. The largest creditsclaimed were $1.8 billion offoreign tax credits, $0.4billion ofprior-year minimumtax credits, and $0.3 billioneach ofgeneral businesscredits and U.S. possessionstax credits. Other creditsincluded the orphan drug
FCDC's reported $10
billion of total U.S.
income taxes after
credits for 1994.
credit and the nonconventional source fuel credit. The$ 10.1 billion oftotal U.S. income tax after credits repre-sents the tax liability as originally reported by taxpayers.However, it does not include any changes made by taxpay-ers through amended returns or by IRS as a result ofexamination or enforcement activities.
Interestingly, while the amount ofFCDC profits and taxliabilities increased between 1993 and 1994, the percent-ages of these companies reporting (positive) net incomeand tax liabilities actually decreased for 1994. Approxi-mately 39.1 percent ofall FCDC's had positive amounts ofnet income for 1994, and 29.6 percent reported U.S.income tax liabilities (i.e., total income tax after credits).By comparison, for the previous year, the percentages .
were 40.8 and 30.4, respectively. The percentages of .FCDC's that had net income and U.S. income tax liabili-ties varied considerably among countries, as well as amongdifferent industrial groups. For 1994, of the 10 countriesshown in Table 1, Sweden had the lowest percentages ofcompanies both with net income (14.0 percent) and withU.S. income tax liabilities (13.8 percent), while Switzer-land had the highest percentages (62.7 and 55.0, respec-tively). Among the four industrial groupings shown in thesame table, the finance, insurance, and real estate grouphad the lowest respective percentages (31.2 and 20.5),while manufacturing had the highest percentages (51.4 and48.0).
"Large foreign-Controlled DomesticCorporations"Large" companies accounted for the majority of the keyFCDC financial items. For purposes of this article, largecompanies were those with at least $250 million of totalassets, or $50 million of business receipts, or both.(Within the finance, insurance, and real estate industrialgroup, total receipts were used in place of businessreceipts for selecting the large companies. Total receiptsincludes both business receipts (i.e., gross receipts fromsales and operations plus investment income.) Both size ofassets and size ofreceipts were used to select these largecompanies in order to obtain maximum coverage of threeprimary industrial groups: manufacturing; wholesale trade;and finance, insurance, and real estate [I I]. The servicesgroup was not separately covered for this large-companyanalysis. Only 6.4 percent of the large FCDC's wereclassified as service companies.
As previously discussed, certain industries have differ-ent characteristics from other industries. For instance,companies classified in the wholesale trade industrialgroup generally report large amounts of receipts comparedto their end-of-year assets. By comparison, corporationsclassified in the finance, insurance, and real estate indus.~;trial group generally report large amounts ofassets com-pared to their receipts. Ifonly assets or receipts were usedto select the large companies, then one of these industrialgroups would have greater coverage in comparison to theother group. Table 2 shows data for the large FCDC's byselected industrial groups. This table also contains datafor large domestic corporations that were not foreignowned (i.e., that were owned by domestic persons, or inwhich ownership by each separate foreign person was lessthan 50 percent).
Data shown in Table 2 are the focus ofthis section ofthe article which covers large FCDC's in comparison to
77

Foreign-Controlled Domestic Corporations, 1994
78
other large domestic corporations. In addition to present-ing data by sele6ted industrial groups, Table 2 also pre-sents data by selected countries of the foreign owners ofthe domestic corporations, and by age ofboth the FCDC'sand the other domestic corporations. Regarding the age ofcorporations, two categories are used: "new" and "old."Each company included in the study was placed into oneof these categories based on the year of incorporationreported on the company's income tax return. Certainlimitations of the data presented by age of the corporationsare discussed later in this article.
For 1994, large companies reported 91.9 percent of thetotal assets, 90.4 percent of the total receipts, 87.2 percentof the taxable income, and 86.2 percent of the total incometax afte r credits,
.ofall
-th-i FCDC's. While accounting fbri
most of these key financial items, these 2,488 compAniescompnisedjust 4.6 percent of the number of income taxreturns filed by FCDCs.
Table 2 shows that there were 13,789 large domesticcorporations that did not have controlling foreign owners-for 1994. Large companies accounted for even less of thetotal number of income tax returns filed by domesticcorporations without foreign owners (excluding Forms1120-F and 1120S), only 0.6 percent. However, like the
-FCDC's,-the large companies comprised the majority-ofthe key financial items of this group of returns: 89.0percent of total assets, 74.9 Percent of total receipts, 86.9percent of taxable'income, and 96.4 percent of total in-come tax after credits.
Large FCDC's generally report greater profits than dothe smaller FCDC's. For 1994, large FCDC.'s reported acombined positive amount of $25.4 billion ofnet income(less deficii), while the smaller companies reported acombined loss of $3.5 billion. Later in this article, theprofitability of the large FCDC's is compared to that ofI
Iargedomestically-controlledc'orporations. This compari-son includes industry and age characteristics of the corpo-rations. It also includes country characteristics for the -FCDC's.
Industry CharaderiisticsThe industrial classification of the large companies issomewhat different as between domestic corporations thatare foreign controlled and those thatare not. For 1994,about 32.5 percent of the large domestic companieswithout foreign owners were classified in the finance,insurance, and real estate industrial -group. For the large.FCDC's, this group accounted for only 15.2 percent of thecompanies.' Conversely, large FCDC's were morecommonly classified in manufacturing (39.8 percent versus25.0 percent) and wholesale trade (26.8 percent versus
12.5 percent) compared to the large domestic companiesthat were not foreign controlled.
Table 2 shows selected items and percentages for largedomestic corporations, both foreign- and domestically-controlled. In comparing the percentages between the twogroups ofreturns, this article focuses on each of the threeindustrial groupings shown in the table, rather than on thedata for all industries. By doing so, the effect ofdifferentfinancial characteristics in different industries (previouslydiscussed) is minimized.
In each of the three industrial groupings shown in Table2, the percentage ofreturns reporting amounts ofpositivenet income was significantly less for the FCDC's than forthe domestically-controlled large companies. The smallest-differences were for manufacturers-(72.9 percent versus-81.0 percent) and wholesalers (75.1 percent versus 83.4percent). (See column 32 of the table.) The largest differ-ence was in the finance, insurance, and real estate group,with 83.0 percent of the domestically-controlled compa-nies reporting profits, while only 64.7 percent of the ._FCDC's did so. This group contained a wide variation ofbusiness activities and corresponding profits. For instance,87.4 percent ofdomestically-controlled banks and creditagencies reported profits (i.e.,, positive net income), while7 1_1 percent of their FCDC counterparts reported profits.In comparison, 57.3 percent ofdomestically-controlledreal estate companies reported profits,,while only 38.1percent of their FCDC counterparts were profitable.
Another key ratio is net income (less deficit) to totalreceipts (column 47 of Table 2). Once again, for each ofthe three industrial divisions shown in this table, domesti-cally-controlled companies reported significantly-higherpercentages than did their foreign-controlled counterparts.The' differences were: -(I) for finance, insurance, and real.~estate, 1013 percent for domestically-controlled companies,compared to 2.8 percent for FCDC's; (2) for manufactur-ing, 6.2 percent versus 2.7 percent; and (3) for wholesaletrade,,2.2 percent versus 0.8 percent.
A third method ofcomparing the profitability of*large
FCDC's to other large domestic corporations focuses onretained earnings. Column I I ofTable 2 shows the totalofunappropriated and appropriated retained earnings ofthe corporations. The amounts were reported in the end-of-year balance sheets of the.porporations' books ofaccount. They represent earnings and profits of the corpo7rations retained from normal and discontinued operationsofprevious years, as well as from "extraordinary" gainsand losses. For 1994, large FCDC's reported $7.3 billionof negative retained earnings, while other large domesticcorporations reported. $j,543.9 billion ofpositive retainedearnings. It should be noted that retained earnings are

Foreign-Controlled Domestic Corporations, 1994
components of.net worth and thus affect the ratio ofnetincome (less deficit) to net worth, which is shown incolumn 46 of Table 2.
While the differences in the ratios between domesti-cally-controlled large companies and their foreign-con-trolled counterparts for taxable income (i.e., "incomesubject to tax") compared to total receipts were substan-tial, these differences were generally somewhat smallerthan the differences discussed above for net income (lessdeficit) compared to total receipts. However, in the fi-nance, insurance, and real estate group, the differencesnarrowed substantially. The difference in net income (lessdeficit) as a percentage oftotal receipts for this group was10.3 percent for domestically-controlled companies com-pared to 2.8 percent for FCDC's. In calculating the tax-able income as a percentage of the total receipts reportedby these companies, the difference had narrowed to 6.2percent for domestically-controlled companies versus 33percent for FCDC's. This "narrowing" effect reflects tosome extent the relatively large amount ofstatutory specialdeductions claimed by domestically-controlled largecompanies classified in the finance, insurance, and realestate group.
Table 2 also includes the ratio of total income tax aftercredits to total receipts (column 54). The total income taxafter credits reported by both domestically-controlledcompanies ($107.3 billion) and by FCDC's ($8.7 billion)represents the tax liability of these companies as originallyreported on their U.S. income tax returns. However, itdoes not take into account either of the following changes:(1) amended returns filed by the corporations, or (2)adjustments made by IRS as a result ofexamination orenforcement activities. Among other reasons, corporationscould file amended returns to use carryback provisions fornet operating losses and unused foreign tax and generalbusiness credits.
In using total income tax after credits as a percentage oftotal receipts, it should also be noted that a small portionof total income tax after credits (for example, the recapturetax on investment credit) does not relate to the current-yeartotal receipts reported by corporations. However, this isnot considered to be a major limitation in using the per-centage because the regular tax and the alternative mini-mum tax represented 99 percent or more of the totalincome tax for both domestically-controlled companiesand FCDC's.
In each of the three industrial groupings shown in Table2, the percentage oftotal income tax after credits dividedby total receipts was higher for domestically-controlledcorporations than it was for FCDC's. The finance, insur-
ance, and real estate group had the highest percentages forboth domestically-controlled corporations (1.8 percent)and for FCDC's (1.2 percent). While these percentagesappear to be more similar than the percentages previouslydiscussed, the large domestically-controlled corporationsclassified in this group reported 47.2 percent more taxesafter credits than did the FCDC's when based on the samelevel of receipts. The differences in this percentage weresignificantly greater between large domestically-controlledcorporations and large FCDC's in the other two industrialgroups. The differences were: (1) for manufacturing, 1.4percent versus 0.8 percent; and (2) for wholesale trade, 0.6percent versus 0.4 percent. Thus, for manufacturing, as anexample, large domestically-controlled corporationsreported 69.9 percent more taxes after credits than did thelarge FCDC's when based on the same level of receipts.
The differences in financial characteristics ofdifferentindustries once again become evident when reviewing thepercentages shown in Table 2. For instance, when thepercentage of net income (less deficit) divided by totalreceipts (column 47) is used, the finance, insurance, andreal estate group has a substantially higher percentage (2.8percent for large FCDC's) than does the wholesale tradegroup (0.8 percent). However, when total assets is used asthe denominator in place oftotal receipts (column 45), thedifference is reversed (large FCDC's in finance, insurance,and real estate have a 0.4 percentage and those in whole-sale trade have a 1.5 percentage). Because the distributionof industrial activities is not the same for large FCDC's asit is for domestically-controlled companies, this againillustrates the importance ofcomparing domestically-controlled companies to FCDC's on an industrial basis.
Age CharacteeisficsTable 2 shows data for both large FCDC's and other largedomestic corporations by the age of the corporations."New" corporations are those with years of incorporationof 1992 and after reported on their income tax returns (forexample, in answer to Form 11 20, page 1, question Q."Old" corporations are those incorporated in 1991 andbefore, or with unknown (i.e., unreported) dates of incorp-oration.
The year of incorporation may be somewhat unreliableas an indicator of the true age ofcorporations. For ex-ample, a consolidated return may include companies whichfall into both the new and old categories. However, thereturn (including all of the financial information containedin it) was classified into just one of the categories based onthe year of incorporation of the parent company. Anotherlimitation is the case ofan old corporation reorganizing
79

Foreign-Controlled Domestic Corporations, 1994
itself and, as a result, becoming a new corporation andreporting a recent year of incorporation. Here, a newcorporation is not necessarily the same as a new business.A third limitation is that the year of incorporation is anitem which is difficult to verify during statistical process-ing because there are no other items to which it can becompared on a tax return form. Thus, it is subject togreater levels of taxpayer reporting and data entry errors.Despite these limitations, it is believed that an analysis ofthe data by age of the corporations is meaningftil. Further,there is no known bias in the accuracy of the year ofincorporation between FCDC's and other domestic corpo-rations.
- Looking at the age characteristics ofboth large FCDC's.and other large domestic corporations provides someadditional information on the attributes ofFCDC's. First,most of the large corporations were old corporations. Forthe FCDC's, 2,281 of the 2,488 large corporations wereold corporations; 91.7 percent. The other large domesticcorp6ratio ns-we-re Ver~ similar to FCDC's in this respectwith 91.4 percent being old corporations (i.e., 12,605 outof 13,789).
New companies (both FCDC's and other domesticcorporations) tend to report lower profits than do theiroldei-c6uhterparts. Looking-at net income (less-deficit)-asa percentage of total receipts,new FCDC's had a ratio of1.35 for 1994, while oldFCDC's had a ratio of 2.10.For other large domesticcorporations, the ratio was5.77 for new companies and
Nearly 92 percent of
--tht-lame FCDC's-
were "old" corpora-
tions.
6.29 for old companies. (See column 47 ofTable 2.)' 'Thus, in addition to comparing FCDC's to other domestic
corporations on the bases of industry and size, this articleuses the same age groupings for the comparisons.
There are six unique industry and age combinations ofthe large corporations shown in Table 2 by which FCDC'scan be compared to other domestic corporations. In fiveof the six, the ratio ofnet income (less deficit) to totalreceipts was substantially lower for FCDC's than it wasfor other domestic corporations. In manufacturing, newFCDC's had a ratio of 1.35, compared to 4.62 percent forother domestic corporations. Within this same industrialgroup, the ratio for old FCDC's was 2.73 and that for otherold domestic corporations was 6.25.
In the finance, insurance, and real estate group, newcorporations had ratios ofnet income (less deficit) to totalreceipts of 1.29 (FCDC's) and 13.59 (other domesticcorporations). The older corporations had ratios of2.88
(FCDC's) and 10.20 (other.domestic corporations). Dueto the diverse business activities of this group, as previ-ously mentioned, further analysis of the specific industriesmight identify additional variations not apparent from theindustrial division (or group) totals. However, this isbeyond the scope ofthis article.
For wholesalers, the older corporations had ratios of0.77 (FCDC's) and 2.31 (other domestic corporations).The one exception of the six cases is new corporationswhose primary industrial activities were classified underwholesale trade. The 66 large FCDC's in this groupreported amounts ofnet income (less deficit) equaling 1.37percent of their total receipts, while their domestically-controlled counterparts, numbering 78, reported a slightlysmallerpercentage; 1.-24-. In-the next section of this article,country detail of the large FCDC's is ~xamined.
Country CharacteristicsWithin each industrial grouping in Table 2, there are sixcountries-shown for the FCDC's. The country informationis based on the location ofthe'owner's counfry-of re§i--dence, incorporation, organization, creation, oradministration, as reported on the U.S. income tax returnsofthe foreign-controlled domestic corporations. (See theData Sources and Limitations section ofthis article for a-brief discus-siod"of the possible limitations-of the dataclassified on a country basis.) The six countries wereselected for the table based on the largest aggregatedamounts of total receipts at the "all industries" level.FCDC's controlled by persons from these six countriesaccounted for 71.5 percent of the number ofreturns, 78.5percent of the assets, and 80.0 percent of the total receiptsof the 2,488 large FCDC's.
More specifically, Japanese owners controlled 663 ofthe 2,488 large FCDC's, which was the largest portion(26.6 percent). These corporations accounted for 23.5percent of the assets and 30.0 percent of the receipts of alllarge FCDC's. Nearly three-fourths of these corporationswere eithermanufacturers or wholesalers. -
United Kingdom owners controlled the second highestnumber of large FCDC's, 301, or 12.1 percent of the total.following the United Kingdom, Canada had 257 largeFCDC's, the Netherlands had 212, Germany had 199, andFrance had 147.
FCDC's with United Kingdom owners also had thesecond largest total assets and total receipts of all largeFCDC's. These 301 corporations accounted for 16.9percent of the assets and 14.6 percent of the receipts ofalllarge FCDC's.
Within a given industrial and age grouping, domesticcorporations controlled by owners in different foreign
80

Foreign-Controlled Domestic Cotporations, 1994
Figure C U
"Large" Foreign-Contro lied Domestic Corporations Compared to Other "Large" DomesticCorporations: Net Income (Less Deficit) as a Percentage of Total Receipts, by Age of Corporationsand Selected Industrial Groupings and Countries, Tax Year 1994
Industry andage of corporations
Manufacturing:New corporations ..................Old corporations ....................
Wholesale trade:New corporations ..................Old corporations ....................
Finance, Insurance, andreal estate:New corporations ..................Old corporations....................
Domesticcorporations
notforeign
controlled'
Allcountries
Net income (less deficit) divided by total receiptsForeign-controlled domestic corporations
(1)
4.626.25
1.242.31
13.5910.20
(2)
1.352.73
1.370.77
1.292.88
(3)
1.031.60
-0.80-1.71
-8.131.00
Country
(4)
GermanyFrance
GermanyGermany
CanadaGermany
Percentage
(5)
6.153.02
7.384.67
9.667.34
Country
(6)
FranceGermany
United KingdomUnited Kingdom
NetherlandsUnited Kingdom
I Excludes Forms 11 20S, U.S. Income Tax Return for an S Corporation.2 Within each industry/age group, the foreign countries (among the six shown in Table 2, i.e., Canada, France, Germany, Japan, Netherlands, and theUnited Kingdom) with the lowest and highest peroentages are shown in columns 3 through 6.NOTES: "Large" corporations were those with total assets of $250,000,000 or more, and/or with business receipts of $50,000,000 or more (total receiptswere used in lieu of business receipts for the finance, insurance, and real estate division). "New" corporations were those with dates of incorporationbetween 1992 and 1995; "old" corporations were those with dates of incorporation prior to 1992.
countries had different levels ofprofitability. Sometimesthe differences were comparatively small, such as for oldFCDC's classified as manufacturers. The ratios ofnetincome (less deficit) to total receipts for the six countriesranged from a low of 1.60 for France to a high of 3.02 forGermany. (See Figure C.) Sometimes the differencesamong countries were comparatively large, such as for newFCDC's classified in the finance, insurance, and real estategroup. The ratios for the six countries ranged from a lowof -8.13 for Canada to a high of9.66 for the Netherlands.In this latter case, the large difference may be the result, atleast in part, ofdifferent industrial activities within thefinance, insurance, and real estate group.
For all three industrial groups shown in Figure C, therange in profitability ratios of the six countries of ownersof FCDC's was considerably greater for new corporationsthan it was for older corporations. Here, the range isconsidered to be the difference between the lowest profit-ability ratio and the highest profitability ratio within agiven industry/age group. For example, in manufacturing,the range for the new corporations was 5.12 (i.e., thedifference between 6.15 for France and 1.03 for Germany),while it was only 1.42 for the older corporations.
summalyDirect foreign investment in the United States throughFCDC's continued to grow for 1994. While total assets
Lowest percentage2 I- Highest percentage2
Percentage
reported on all U.S. corporation income tax returnsincreased by 7.5 percent over the previous year, assets ofdomestic corporations controlled by foreign personsincreased by 11.5 percent [12]. As a result, the percentageof total corporate assets accounted for by FCDC's in-creased to 10.0 percent. In addition, the share of totalcorporate receipts accounted for by FCDC's increased to10.3 percent. Between 1993 and 1994, receipts reportedby all corporations increased by 8.9 percent, while thereceipts of FCDC's increased at a faster pace, by 9.5percent.
Two industrial groupings (manufacturing and wholesaletrade) generated nearly three-fourths of the total receipts ofall FCDC's. From a country perspective, domestic corpo-rations controlled by persons in Japan had total receipts of$400 billion, 29.2 percent of the FCDC total. In addition,the United Kingdom, the Netherlands, and Germanyaccounted for 14.1, 10.7, and 9.6 percents, respectively, ofthe total.
The collective net income (less deficit) reported byforeign-controlled domestic corporations increased to$21.9 billion, compared to $11.2 billion for 1993. Thisreflects both an increase in (positive) net income (from$35.9 billion to $44.7 billion) and a decrease in deficits(from $24.7 to $22.8 billion). Total income tax aftercredits moved in the same direction as net income, increas-ing from $8.2 billion for 1993 to $ 10.1 billion for 1994. 81

Foreign-Controlled Domestic Corporations, 1994
Of the 54,620 foreign-controlled domestic corporations,2,488 "large" companies accounted for 86 percent or moreof the total amounts ofkey financial items (e.g., totalassets, total receipts, taxable income, and total income taxafter credits). In comparing these large companies to largedomestically-controlled companies on industry and age .bases, in most cases the ratios related to profitability, e.g.,net income (less deficit) compared to total receipts, weresubstantially smaller for the FCDC's. While this articlehas been able to compare the profits ofFCDC's to otherdomestic corporations on the same bases of size, industry,and age, additional research is needed to explain theremaining differences in the profitability of the two groupsofcompanies [13].
hplanation of Seleded TermsThe following are briefexplanations ofsome of the termsused in this article. For more extensive definitions, seeStatistics ofIncome--1994, Corporation Income TaxReturns [14].
Alternative Mini.mum Tax.--This tax was designed toensure that a taxpayer with substantial economic income'would not avoid significant tax liability through a legiti-mate use of exclusions, deductions, and credits. It isincluded in the statistics shown for both total income taxbefore (and after~ credits.
Attribution Rules.--In regard to domestic corporationsthat are 50 percent or more owned by one foreign "per-son," these rules provide that an individual shall be consid-ered as owning the stock of a corporation if it is owned,directly or indirectly, by or for his
'or her family. The
family of an individual includes his or her spouse, brothersand sisters, ancestors, and lineal descendants. For moreinformation on these rules, see section 267(c) of theInternal Revenue Code. However, ifa corporation isowned by two or more unrelated*persons, neither ofwhichowned 50 percent or more of the corporation, then thatcorporation was excluded from the FCDC statistics eventhough, together, these persons may have met the 50-percent-or-more ownership criterion.
Business Receipts.--These receipts'were, in general, the
gross operating receipts of the corporation reduced by thecost ofreturned goods and allowances. Some corporationsreported sales and excise taxes as part of their gross .receipts from sales (and deducted these taxes as part of"cost of goods sold" or as "taxes paid"); others reportedtheir receipts after adjustment for these taxes. Businessreceipts include rents reported as the principal businessincome by real estate operators and certain manufacturing,public utility.- trade, and service corporations. In thefinance, insurance, and real estate industries, business
receipts include such banking items as fees, commissions,trust department earnings, and service charges. Interest,the principal operating income ofbanking and savingsinstitutions, was excluded from business receipts, butincluded in the separate statistics for "interest received."Also in the finance, insurance, and real estate division,premium income of most insurance companies was in-cluded in business receipts.
Cost ofGoods Sold.--This item generally consisted ofthe direct costs incurred by corporations in producinggoods or providing services. Included were costs ofmaterials used in manufacturing; costs ofgoods purchasedfor resale; direct labor; and certain overhead expenses,such as rent, utilities, supplies, maintenance, and repairs.
-For-statistical-processing-purposes, how-ever,, certain items(such as advertising, amortization, bad debts, compensa-tion of officers, depletion, depreciation, interest paid, salesand excise taxes, and contributions to charitable organiza-tions, employee benefit programs, and pension plans)reported by taxpayers in cost ofgoods sold schedules weretra-ris-fer-red. to their respective and separate deduction- -categories. For studies prior to Tax Year 1994, "cost ofsales and operations" was used in place of this item. Foran explanation of the difference between these two items,see Statistics ofIncome--1994, Corporation Income TaxReturns.
Foreign Person.--A foreign person (or entity) is definedas a person other than a U.S. person. A U.S. personincludes: (1) a citizen or resident of the United States, (2)a domestic partnership, (3) a domestic corporation, and (4)
, any estate or trust (other than a foreign estate or trust).Section 7701 ofthe Internal Revenue Code further definesthe term, U.S. person.
Income Subject to Tax.--For most corporations, incomesubject to tax, i.e., taxable income, was defined by InternalRevenue Code section 63 and consisted of net incomeminus certain statutory special deductions. There werespecial provisions in the Code for determining the taxableincome of life insurance companies, regulated investmentcompanies, and real estate investment trusts. On Form11 20, this item was reported on page 1, line 30.
Net Income (or Deficit).--This is the difference betweentaxable receipts and the ordinary and necessary businessdeductions allowed by the Internal Revenue Code. In thisarticle, it is also referred to as either "profits" or "losses."It reflects not only actual receipts, but "constructive"receipts as well (i.e., certain income from ControlledForeign Corporations and from the foreign taxes deemedpaid on foreign dividends received). Tax-exempt intereston State and local -Government obligations-is-excluded-from this item, but is included in "total receipts." Because
82

Foreign-Controlled Domestic Corporations, 1994
certain statutory special deductions, including the netoperating loss deduction, were allowed most corporationsin computing their "taxable income" (or "income subjectto tax"), the statistics for net income are generally largerthan the amounts shown for (U.S.) "income subject to tax"(i.e., the base on which the regular income tax was com-puted). See also the discussion of the "net operating lossdeduction." On Form 1120, this item was reported onpage 1, line 28.
Net Operating Loss Deduction (7VOLD).--A statutory"net operating loss" (NOL) for a given tax year could becarried back, in general, 3 years to reduce the taxableincome of those years, and any amount of the NOL notoffset against income during that time could be carriedforward and offset against income for a period not exceed-ing 15 years. The amount of the deduction included in thestatistics, however, consists only of losses from prior yearscarried forward and actually used to reduce taxable incomefor the current (1994) tax year. Losses incurred after the1994 Tax Year and carried back to that year at a later datecould not be reported on the tax returns used for thisarticle. Net operating losses on which the 1994 deductionwas based include: (1) the excess of ordinary and neces-sary business expenses over income for previous lossyears, and (2) statutory special deductions claimed for alo~s year for dividends received and for dividends paid oncertain preferred stock ofpublic utilities (or any excess ofsuch deductions over net income).
Net Worth.--This item represented the stockholders'equity in the corporation, i.e., total assets less the claims ofcreditors. It is the net result of adding capital stock, paid-in or capital surplus, appropriated retained earnings,unappropriated retained earnings, and then subtracting thecost of treasury stock. Treasury stock is common orpreferred stock originally issued by the corporation whichhas been reacquired and held at the end of the accountingperiod by the issuing corporation.
Number ofReturns.--The data contained in this articleinclude the number of returns filed for Tax Year 1994.For expedient reasons, the number ofreturns is sometimesreferred to in this article as the number ofcorporations.However, the actual number ofcorporations may be largerthan the number ofretums because most domestic corpora-tions could elect to file consolidated income tax returns.These returns were filed by common parent corporationsand contained combined financial data of two or moreaffiliated domestic corporations meeting certain stockownership requirements. Each consolidated return wastreated for statistical purposes as a single unit. The num-ber ofreturns shown in this article represents returns of"active" corporations, i.e., those which reported any
income or deduction items. While any corporation inexistence during any portion of the taxable year wasrequired to file an income tax return (even though it mayhave been inactive, not having any income or deductions),the great majority ofreturns filed with IRS were for activecorporations.
Statutory Special Deductions.--This item was the sumof. (1) deductions for net operating losses of prior years,(2) inter-corporate dividends received deductions, (3)deductions for dividends paid on certain preferred stock ofpublic utilities, (4) deductions for dividends paid byregulated investment companies and real estate investmenttrusts, and (5) Internal Revenue Code section 857(b)(2)(E)deductions reported by real estate investment trusts. Sincethese deductions were allowed by law, in addition toordinary and necessary business deductions, they areshown in the statistics as deductions from net income. Ingeneral, net income less statutory special deductionsequals income subject to tax.
Total Assets.--This item represented those assets re-ported in the end-of-year balance sheets of the corpora-tions' books ofaccount. Total assets were net amountsafter reduction by accumulated depreciation, accumulatedamortization, accumulated depletion, and the reserve forbad debts.
Total Income Tax After Credits.--For 1994, total in-come tax was primarily comprised of the regular taximposed on corporate income subject to tax (92.5 percentof the total tax) and the alternative minimum tax (6.4percent). Some taxes included in total income tax werenot imposed directly on a corporation's income subject totax, such as the recapture tax on investment credits. Thus,a small number of corporations without net income andregular tax reported such taxes on their income tax returns.These taxes were included in the statistics for total incometax. For 1994, the credits used to reduce total income taxprimarily included the foreign tax credit (66.3 percent ofthe total credits), the prior-year minimum tax credit (14.2percent), the general business credit (9.5 percent), and theU.S. possessions tax credit (9.1 percent). The statisticsshown for this item may differ somewhat from the actualincome tax collections and the final income tax liability ofcorporations for Tax Year 1994. Adjustments could bemade to income tax returns after they were filed, whichcould affect the final tax liability. Such adjustments arenot reflected in the statistics. Adjustments could resultfrom tax examination and enforcement activities by IRS,or the use ofcarryback provisions for net operating lossesand unused foreign tax and general business credits bytaxpayers. This item is computed within the Statistics ofIncome corporate program. 83

Foreign-Controlled Domestic Corporations, 1994
84
Total Receipts.--This item includes all of the incomeactually (as opposed to constructively) received by acorporation and reported on its income tax return. Itincludes gross taxable receipts, before the deduction ofcost ofgoods sold and ordinary and necessary businessexpenses. It also includes tax-exempt interest received onState and local Government obligations. A domesticcorporation (i.e., one incorporated in the United States),whether controlled by a foreign person or not, could havebusiness activities in a foreign country, as well as in theUnited States. Thus, total receipts may include those fromforeign branch operations of the U.S. company. Also, thetotal receipts ofa domestic corporation conducting busi--ness abroad through foreign subsidiaries may includedividends remitted from those subsidiaries. This term,however, excludes certain taxable income from relatedforeign corporations that is only constructively received bythe domestic corporation. Also, the statistics for this termexclude long-term capital gains ofregulated investmentcornp- anies.-This- item is computed withirf the Statistics of -Income corporate program.
Total Receipts Less Total Deductions.--This itemdiffers from "net income (less deficit)" for statisticalTurposes in that it includes nontaxable interest received on-State-and local- Government obligations, and excludes- -- - - -constructive taxable income from related foreign corpora-tions. This item is computed within the Statistics ofIncome corporate program.
Data Sources and Limitations
SampleThe statistics for domestic corporations controlled by aforeign person are based on samples of corporation incometax returns filed primarily on Form 1120 (U.S. Corpora-tion Income Tax Return). In addition, the 1994 statisticsinclude data from the small numbers of other corporationincome tax returns filed on Forms 1120-L (U.S. LifeInsurance Company Income Tax Return), I I20-RIC (U.S.Income Tax Returnfor Regulated Investment Companies),I I20-REIT (U.S. Income Tax Return for Real EstateInvestment Trusts), and I I20-PC (U.S. Property andCasualty Insurance Company Income Tax Return). Aspreviously mentioned, FCDC's could not file Forms 11 20-F and 1120S.
Form 11 20 sampled returns were stratified based on thesize of total assets and the size of"proceeds" (which wasused as a measure of income and was the larger of theabsolute value ofnet income or deficit or the absolutevalue of"cash flow," i.e., net income plus depreciation anddepletion). Forms I I20-L, I I20-RIC, I I 20-REIT, and ,
I I 20-PC were sampled based solely on the size of totalAssets.
For 1994, the sampling rates for Forms 1 120 alone (theoverwhelming majority of the returns included in thesample) ranged from less than I percent to 100 percent. Ingeneral, Form 1120 returns with assets of$50 million ormore, or with "proceeds" of $ 10 million or more, wereselected for the study at the I 00-percent rate. For addi-tional information on the sampling rates, see Statistics ofIncome-- 1994, Corporation Income Tax Returns.
Because the data presented are estimates based onsamples, they are subject to sampling error. To properlyuse these data, the magnitude of the sampling error shouldbe known. Coefficients of variation (CV's) are used tomeasure that magnitude. For a general discussion of CV's,see the appendix to this publication. For a more detaileddiscussion of the CV's applicable to the corporationstatistics, see Statistics ofIncome--1994, CorporationIncome Tax Returns.
Nonsampling LimitationsMost of the data in this article relate to Tax Year 1994,defined to cover returns with accounting periods that .ended during the 12-month span beginning in July 1994
--and-ending-in.June 1995. - Additionally,. the sampling -.-- _fi-ame for the 1994 statistics consisted of tax returns whichposted to the IRS,Business Master File between July 1994and June 1996. As a result of the 12-month span forending accounting periods, the statistics shown in thisarticle include income received or expenses incurredduring a 23-month span. For Tax Year 1994, that spanwas from August 1993 through June 1995. Nevertheless,most of the income and expenses are, in fact, associatedwith Calendar Year 1994.
Returns were selected for this study based on taxpayers'responses to two questions that appeared on the varioustypes ofForm 1 120. The first question asked whether any"foreign person" owned, directly or, indirectly, 25 percentor more of the filing corporation's voting stock at any timeduring the tax year. If this question was answered "yes,"then a second question asked for the percentage owned[ 1 5]. If the first question was answered "yes," and thesecond question was answered with a percentage between50 and 100, then the return was included in the FCDCstatistics [16, 17]. Taxpayers sometimes incorrectlyanswered these questions, or did not answer them at all.However, prior to tabulation, corporations with largeamounts ofassets and with changes in foreign ownershipstatus between 1993 and 1994 were researched and theanswers to the questions were verified. These large corpo-rations have a dominating effect on the estimates for
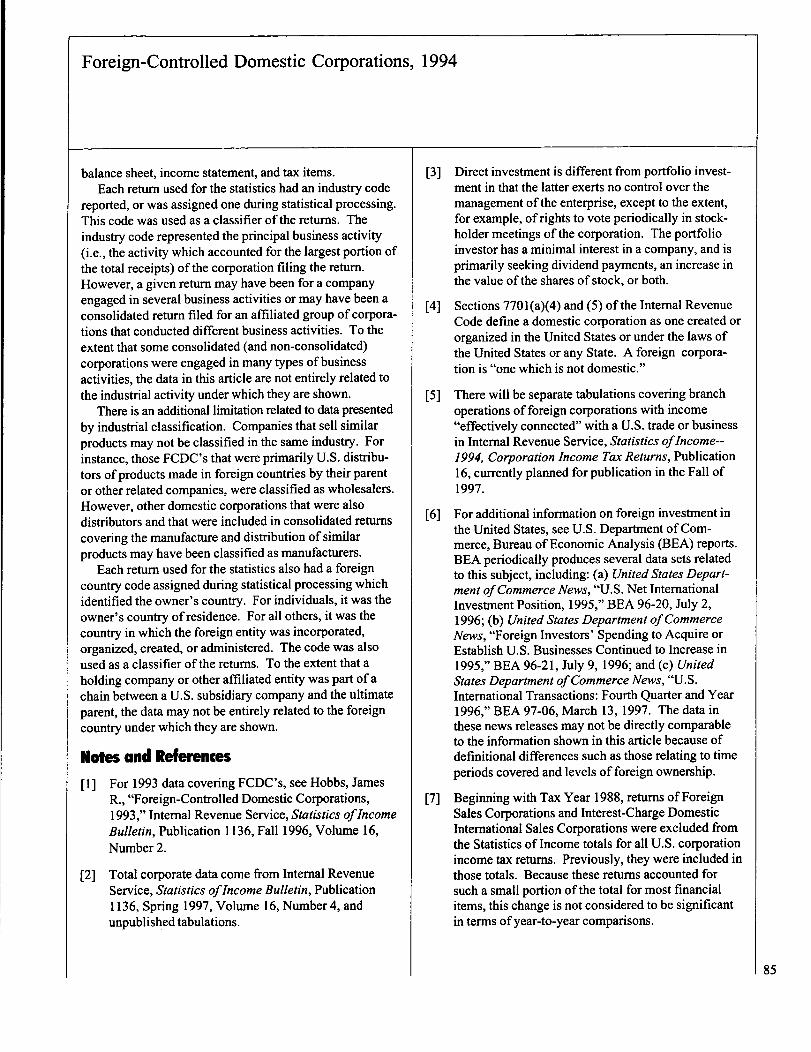
Foreign-Controlled Domestic Corporations, 1994
balance sheet, income statement, and tax items.Each return used for the statistics had an industry code
reported, or was assigned one during statistical processing.This code was used as a classifier of the returns. Theindustry code represented the principal business activity(i.e., the activity which accounted for the largest portion ofthe total receipts) of the corporation filing the return.However, a given return may have been for a companyengaged in several business activities or may have been aconsolidated return filed for an affiliated group ofcorpora-tions that conducted different business activities. To theextent that some consolidated (and non-consolidated)corporations were engaged in many types ofbusinessactivities, the data in this article are not entirely related tothe industrial activity under which they are shown.
There is an additional limitation related to data presentedby industrial classification. Companies that sell similarproducts may not be classified in the same industry. Forinstance, those FCDC's that were primarily U.S. distribu-tors of products made in foreign countries by their parentor other related companies, were classified as wholesalers.However, other domestic corporations that were alsodistributors and that were included in consolidated returnscovering the manufacture and distribution of similarproducts may have been classified as manufacturers.
Each return used for the statistics also had a foreigncountry code assigned during statistical processing whichidentified the owner's country. For individuals, it was theowner's country of residence. For all others, it was thecountry in which the foreign entity was incorporated,organized, created, or administered. The code was alsoused as a classifier of the returns. To the extent that aholding company or other affiliated entity was part ofachain between a U.S. subsidiary company and the ultimateparent, the data may not be entirely related to the foreigncountry under which they are shown.
Notes and ReFerences
[I] For 1993 data covering FCDC's, see Hobbs, JamesR., "Foreign-Controlled Domestic Corporations,1993," Internal Revenue Service, Statistics ofIncomeBulletin, Publication 1136, Fall 1996, Volume 16,Number 2.
[2] Total corporate data come from Internal RevenueService, Statistics ofIncome Bulletin, Publication1136, Spring 1997, Volume 16, Number 4, andunpublished tabulations.
[31 Direct investment is different from portfolio invest-ment in that the latter exerts no control over themanagement of the enterprise, except to the extent,for example, of rights to vote periodically in stock-holder meetings of the corporation. The portfolioinvestor has a minimal interest in a company, and isprimarily seeking dividend payments, an increase inthe value of the shares of stock, or both.
[4] Sections 7701(a)(4) and (5) ofthe Internal RevenueCode define a domestic corporation as one created ororganized in the United States or under the laws ofthe United States or any State. A foreign corpora-tion is "one which is not domestic."
[51 There will be separate tabulations covering branchoperations of foreign corporations with income"effectively connected" with a U.S. trade or businessin Internal Revenue Service, Statistics ofIncome--1994, Corporation Income Tax Returns, Publication16, currently planned for publication in the Fall of1997.
[6] For additional information on foreign investment in
[7]
the United States, see U.S. Department ofCom-merce, Bureau ofEconomic Analysis (BEA) reports.BEA periodically produces several data sets relatedto this subject, including: (a) United States Depart-ment ofCommerce News, "U.S. Net InternationalInvestment Position, 1995," BEA 96-20, July 2,1996; (b) United States Department ofCommerceNews, "Foreign Investors' Spending to Acquire orEstablish U.S. Businesses Continued to Increase in1995," BEA 96-21, July 9, 1996; and (c) UnitedStates Department ofCommerce News, "U.S.International Transactions: Fourth Quarter and Year1996," BEA 97-06, March 13, 1997. The data inthese news releases may not be directly comparableto the information shown in this article because ofdefinitional differences such as those relating to timeperiods covered and levels of foreign ownership.
Beginning with Tax Year 1988, returns ofForeignSales Corporations and Interest-Charge DomesticInternational Sales Corporations were excluded fromthe Statistics of Income totals for all U.S. corporationincome tax returns. Previously, they were included inthose totals. Because these returns accounted forsuch a small portion of the total for most financialitems, this change is not considered to be significantin terms ofyear-to-year comparisons.
85

Foreign-Controlled Domestic Corporations, 1994
[8] In general, the computation of net income (less
191
deficit) can be shown as follows:Begin With: Total Receipts
(Includes Business Receipts)Less: Total Deductions
(Includes Cost ofGoods Sold)Equals: Total Receipts Less Total DeductionsPlus: Constructive Taxable Income from Related
Foreign CorporationsLess: Tax-exempt Interest on State and Local
GovernmentObligationsEquals: Net Income (Less Deficit)
For the most recent detailed information on transac--tions-between FCDC's and their related foreign-persons, se e "Transactions Between Large Foreign-Owned Domestic Corporations and Related ForeignPersons, 1992," Internal Revenue Service, StatisticsofIncome Bulletin, Publication 1136, Fall 19§6,Volume 16, Number 2. While the above-mentionedarticle provides more complete information ontransactions between FCDC's and their relatedforeign persons, the reader may want to reviewcolumns 6 and 9 ofTables I and 2 of this article fordata on loans to and from the stockholders ofFC6US. At ihe end-of ith-e-i-r-1994 -a-c-c6untingperiods, FCDC's had $57.0 billion of outstandingloans from their stockholders, while making $15.7billion of loans to their stockholders. The principalstockholders ofFCDC's are foreign "persons,"usually foreign corporations.
[10] The 33,251 companies reporting a deficit mayinclude a small number of "break-even" companies,i.e., those whose receipts and deductions were equal.
[11] Most, ifnot all, of the large FCDC's and otherdomestic corporations were selected for this study atthe 100 percent sampling rate. Therefore, sampling
- error is not considered to be a major concern for thelarge-corporation data. A complete discussion onsampling rates is contained in Statistics ofIncome--1994, Corporation Income Tax Returns.
[12] The 11.5 percent increase between 1993 and 1994 inthe assets ofdomestic corporations controlled byfore ign persons, as well as the 7.5 percent increasefor all corporations, may overstate the actual "growthin investment." Assets are generally reported at book
value on tax returns (i.e., at the value at the time ofacquisition). The book value ofnewly-acquiredassets is generally greater than the -book value ofsimilar assets they replaced. Therefore, new corpora-tions may tend to have a greater percentage ofnewassets with greater book values. To the extent thatnew corporations comprised a different portion of.,FCDC's than they did for other companies, thecomparability of 11.5 percent to 7.5 percent (above)may be limited.
[13] See Grubert, Harry, "Another Look at the LowTaxable Income ofForeign-Controlled Companies inthe United States," unpublished manuscript, 1997.
[14] Statisti~-i~fIh-co--m--e--'1994,-C6r-p-or--aiio-nIizcom-e-Ta-i-Returns, Publication 16, is currently planned forpublication in the Fall of 1997.
15]. On Form 11 20, Page 3, Schedule K, the actual
- -questions-were: "(10) Did one -foreign person. at any-time during the tax year own, directly or indirectly, atleast 25 percent of. (a) the total voting power of all.classes ofstock of the corporation entitled to vote, or(b) the total value ofall classes of stock of the-corporation?"And "(1 Oa) If 'Yes,' enter percentageowned." There was an-additional question used forthe country distribution of these statistics, which was"(10b) If 'Yes,' enter owner's country.
[16] Returns for this study may exclude certain domesticcompanies that are effectively controlled by foreignpersons, such as public companies in which "control"may be exercised with as little as 10 to 20 percent ofthe stock holdings.
[17] Statistics of Income also compiles statistics for thedomestic corporations with 25 to 49 percent foreignownership. Ifa company Was classified as an FCDCbased on 50-percent-or-more foreign stock owner-ship, then it was not included in the 25-to-49 percentforeign ownership category, even if it had an unre-lated foreign owner with 25 to 49 percent stockownership. For, 1994, there were only 4,074 returnswhich indicated a level of foreign ownership between25 and 49 percent. These companies reported $116.5billion of assets, $65.1 billion of receipts, $2.1 billionof taxable income, and $0.6 billion oftotal incometax after credits. All of these amounts were small incomparison to data for the FCDC's.
86

Foreign-Controlled Domestic Corporations, 1994
Table 1. -- Foreign-Controlled Domestic Corporations: Selected Items and Percentages, by SelectedIndustrial Groupings and Countries[All figures are estimates based on samples -- money amounts are in millions of dollarsl
Number of returns AssetsSelected industrial groupings With With total Loans Current
and countries Total net income tax Total Inventories to liabilitiesincome after credits stockholders
(1) (2) (3) (4) (5) (6) (7)All Industries I.......................................................... 54,620 21,369 16,186 2,339,033 131,863 15,717 1,092,301
Australia ................................................................. 374 182 172 71,068 3,019 1,669 13,310Belgium .................................................................. 159 78 70 16,308 1,908 .1 5,256Canada ................................................................... 11,322 5,375 3,494 201,505 8,679 732 58,963France.................................................................... 2,381 1,168 1,068 205,475 8,984 1,680 82,642Germany................................................................. 3,339 1,374 1,274 157,439 14,013 72 69,346Japan...................................................................... 6,867 2,483 2,091 558,630 39,832 1,019 358,977Netherlands ............................................................ 1,587 854 444 307,316 10,004 1,263 103,921Sweden.................................................................. 535 75 74 29,632 2,846 -1,276 17,8"Switzerland............................................................. 1,530 959 841 187,101 7,913 280 120,394United Kingdom ...................................................... 4,242 1,893 1,460 380,134 17,738 6,581 150,116
Manufacturing I ........................................................ 6,071 3,123 2,915 653,726 64,715 1,937 198,629Australia................................................................. 33 25 25 8,892 974 -- 4,005Belgium .................................................................. *19 *15 *15 *5,524 *607 -- *710Canada................................................................... 1,573 1,022 986 65,235 5,111 *298 19,663France .................................................................... 200 122 122 48,724 5,529 *21 1 13,890Germany ................................................................. 585 369 364 61,891 9,314 36 19,138Japan ...................................................................... 991 482 461 61,819 9,775 13 24,497Netherlands............................................................ 146 87 88 135,643 5,896 *208 34,001Sweden .................................................................. 80 42 44 9,788 2,116 .8 2,949Switzerland ............................................................. 287 221 165 60,217 6,359 *260 22,506United Kingdom ...................................................... 517 307 288 134,004 11,877 849 35,370
Wholesale trade I ...................................................... 13,405 5,931 4,524 246,656 46,364 943 144,841Australia ................................................................. *49 *43 *1,564 *144 -- *295
Belgium.................................................................. 93 32 27 1,024 214 *(3) 472
Canada ................................................................... 921 528 300 7,346 1,743 *15 3,127France .................................................................... 420 205 143 4,466 870 *36 2,011Germany ................................................................. 1,156 440 416 22,194 3,202 *8 12,796Japan ...................................................
* ..... *"*"**"*"1,824 989 769 143,817 26,229 672 91,041
Netherlands ............................................................ 498 165 163 14,991 2,441 *18 6,954Sweden .................................................................. 239 14 13 2,552 643 *(3) 1,187Switzerland............................................................. 244 193 185 4,717 1,197 *14 2,429United Kingdom ...................................................... 985 653 378 17,926 2,778 *120 5,377
Finance, Insurance, and real estate I ..................... 17,619 5,503 3,618 1,135,459 2,482 12,195 669,580Australia................................................................. 131 38 29 5,204 3 1,609 3,251Belgium .................................................................. 29 24 20 3,709 (3) T) 2,360Canada................................................................... 4,724 1,812 992 105,223 573 159 30,425France.................................................................... 354 173 149 137,031 24 *1,422 62,028Germany ................................................................. 935 320 273 55,578 4 .5 31,362Japan...................................................................... 2,164 529 453 296,163 793 325 222,674Netherlands ............................................................ 258 125 75 125,983 166 *986 56,162Sweden.................................................................. 204 *10 *10 16,019 4 *1,263 13,123Switzerland ............................................................. 469 182 184 118,678 44 -5 94,416United Kingdom ...................................................... 785 305 206 168,979 422 5,404 94,208
Services I .................................................................. 7,725 3,T72 2,754 151,127 6,031 147 35,401Australia................................................................. *92 *70 *67 *36,591 *1,525 *(3) *1,603Belgium.................................................................. -4 *130 *21 .1 *103
Canada ................. 1,873 1,232 539 5,004 172 *63 1,080France ................. 517 423 407 7,319 1,082 *3 1,100Germany ............
............ ......280 138 136 3,961 110 *17 2,515
Japan .......................
860 208 184 44,313 2,139 .1 14,727Netherlands....... 323 195 58 18,357 272 *32 3,799Sweden .............
......*5 - *290 *146
Switzerland .................. ............
342 *214 *211 1,990 67 - 520United Kingdom...................................................... 713 253 226 23,664 224 *23 6,392
Footnotes at end of table.
87

Foreign-Controlled Domestic Corporations, 1994
Table 1. -- Foreign-Controlled Domestic Corporations: Selected Items and Percentages, by SelectedIndustrial Groupings and Countries - Continued[All fiqures are estimates based on samples -- money amounts are in millions of dollarsl
Noncurrent liabilities Net worth
Selected industrial groupings Loans Total Business
and countries Total from Total Retained receipts receipts
stockholders earnings
(8) (9) (10) (12) (13)
All Industries I ..................................................... 743,428 56,999 503,303 -78,013 1,369,526 1,243,386
Australia ............................................................ 28,341 903 29,417 -3,873 20,502 17,761
Belgium ............................................................. 4,203 28 6,849 2,173 18,234 17,515
Canada.............................................................. 98,040 7,362 44,502 717 110,926 99,641
France............................................................... 90,885 3,874 31,948 -9,697 89,983 78,266
Germany ........................................................... 45,227 2,293 42,866 -2,005 131,438 123,544
Japan ....................................................... 0 ........ 116,759 14,352 82,894 -30,408 400,047 368,950
Netherlands....................................................... 99,057 4,619 104,338 8,352 146,964 133,525
Sweden ............................................................. 4,907 649 6,881 -460 24,212 22,457
Switzerland ......... :.............................................. 41,447 3,821 25,260 -3,124 74,585 62,795
united Kingdom................................................. 149,235 12,293 80,784 12,880 192,840 -171,521---
Manufacturing I ................................................... 230,992 20,245 224,105 -5,831 554,382 529,544
Australia ............................................................ 2,742 *79 2,145 -1,741 8,092 7,937
Belgium ............................................................. *2,006 -- *2,808 -1,098 -5,805 *5,635
Canada.............................................................. 21,799 2,506 23,773 4,443 53,847 51,936
France ............................................................... 18,272 1,717 16,562 -6,081 40,715 38,992
....... ....................Germany - - _ - ------- . ............. 17,404 729 25,348 -512 62,984 60,410.
Japan ........................................ ......................... 17.196- --1,281 -20,126 -7,156 - 79,449 -77,806- - -
Netherlands ........................................................ 28,988 2,043 72,654 16,452 77,414 74,472
Sweden ................ ............................................ 2,518 *347 4,321 -108 12,263 12,054
Switzerland ........................................................ 24,445 2,277 13,266 -4,534 46,200 43,642
UnitedKingdorn ................................................. 73,411 7,743 25,223 -9,779 107,827, 100,962
Wholesale trade I ................................................ 59,313 5,331 42,502 -10,206 443,422 430,589
Australia......... . ..................... ! ... ..... .. ... .425 *17 *_98 1,266 -1,253. . .
Belgium............................................................. 129 *17 422 - 7 1-7011 1-676
Canada .............................................................. 2,568 609 1,651 -710 16,461 16,037
France ................................................................ 1,069 *285 1,387 -1,139 8,470 8,314
Germany .............I.............................................. 5,593 762 3,805 -1,332 34,759 33,091
Japan ................................................................ 28,474 1,507 24,301 -1,138 264,735 257,826
Netherlands ....................................................... 6,273 164 1,764 -706 21,730 21,096
Sweden............................................................. 673 *59 692 127 5,891 5,284
Switzerland ........................................................ 813 169 1,476 171 8,741 8,578
United Kingdom ................................................. 8,686 1,010 3,862 -1,299 24,357 23,109
Finance, Insurance, and real estate I ................ 334,925 21,416 130,954 -23,702 154,963 82,979
Australia............................................................ 895 33 1,058 -475 511 183
Belgium............................................................. 1,011 .9 338 -41 163 *11
Canada .............................................................. 63,700 2,431 11,098 -3,387 18,001 10,762
France ............................................................... 63,575 1,624 11,429 363 18,864 9,928
Germany ........................................................... 14,627 316 9,589 825 12,388 9,753
Japan................................................................ 52,913 8,859 20,576 -17,026 25,742 6,109
Netherlands ....................................................... 49,685 1,462 20,136 -839 21,853 14,389
Sweden............................................................. 1,347 *233 1,548 -492 4,453 3,613
Switzerland........................................................ 14,491 1,069 9,771 1,971 15,128 6,189
United Kingdom ................................................. 47,910 1,879 26,862 4,190 27,246 16,851
Services I ............................................................. 65,175 4,251 50,551 -22,097 65,223 56,364
Australia............ : ........................ : ...................... *21,661 *70 '13,327 --1,930 -7,329 *5,340
Belgium............................................................. *11 -- *16 *-47 *106 *99
Canada .............................................................. 2,880 779 1,044 -1,422 5,462 5,104
France ........................................... : ................... 5,130 *55 1,089 -1,839 3,211 2,878
Germany ........................................................... 712 *199 -304 2,885 2,560
Japan................................................................ 13,260 1,838 16,325 -3,652 15,514 13,425
Netherlands ....................................................... 8,424 *450 6,134 -5,307 8,755 6,936
Sweden............................................................. *98 .1 *46 *-40 *537 *505
Switzerland........................................................ 1,191 *209 278 -676 2,205 2,126
United Kingdom ................................................. 7,294 248 9,978 -2,977 11,554 10,411
Footnotes at end of table.
88

Foreign-Controlled Domestic Corporations, 1994
Table 1. -- Foreign-Controlled Domestic Corporations: Selected Items and Percentages, by SelectedIndustrial Groupings and Countries - Continued[All figures are estimates based on samples -- money amounts are in millions of dollarsl
Selected industrial groupingsand countries
Interestreceived 2
Totaldeductions
Costof
goodssold
Interest
paid
Taxespaid
Totalreceiptsless total
deductions(14) (15) (16) (17) (18) (19)
All Industries I ..................................................... 75,039 1,348,566 899,823 72,276 20,850 209960Australia............................................................ 2,240 20,515 12,389 2,943 304 -13Belgium............................................................. 249 17,620 13,152 441 248 614Canada .............................................................. 6,561 108,662 68,031 5,394 1,708 2,264France ............................................................... 6,476 89,173 60,980 4,129 1,244 810Germany ........................................................... 3,460 129,273 86,630 4,022 2,067 2,164Japan ................................................................ 20,686 398,181 303,765 19,785 3,451 1,866Netherlands ....................................................... 8,299 144,142 93,447 6,685 2,153 2,822Sweden ............................................................. 742 23,649 15,664 578 317 563Switzerland ........................................................ 8,506 73,407 34,980 8,996 1,474 1,178
United Kingdom................................................. 12,458 185,981 103,806 13,147 5,160 6,859Manufacturing I................................................... 8,556 541,644 365,367 20,175 9,959 12,738
Australia ............................................................ 102 8,147 6,072 207 133 -55Belgium ............................................................. *85 -5,744 *4,152 *201 *83 *61Canada .............................................................. 560 52,887 37,930 1,467 771 960France............................................................... 428 40,102 26,915 1,358 667 613
Germany ........................................................... 633 61,098 41,640 1,438 1,057 1,886Japan ................................................................ 582 77,688 62,435 1,504 953 1,761Netherlands ....................................................... 1,563 759915 55,252 2,437 1,057 1,499Sweden ............................................................. 53 11,849 8,414 205 146 413Switzerland ........................................................ 1,079 45,330 22,675 2,077 944 869
United Kingdom ................................................. 2,865 105,161 61,060 7,494 3,375 2,666Wholesale trade I ................................................ 4,416 4409139 363,243 7,654 3,512 3,283
Australia ............................................................ -6 -1,281 *941 *31 *22 *-15Belgium ............................................................. 5 1,674 1,452 13 16 27
Canada .............................................................. 113 16,311 13,380 225 144 150France............................................................... 52 8,427 6,894 90 96 43Germany........................................................... 686 35,207 26,806 1,112 332 -448
Japan................................................................ 2,515 263,456 221,422 4,194 1,501 1,279Netherlands....................................................... 262 21,398 17,031 493 163 331
Sweden............................................................. 67 5,439 4,387 90 45 452Switzerland ........................................................ 43 8,558 6,670 110 104 183
United Kingdom................................................. 320 23,134 17,530 613 318 1,222
Finance, Insurance, and real estate I................ 56,031 152,417 41,907 35,134 3,042 2,546Australia............................................................ 173 532 *96 199 18 -22Belgium ............................................................. 132 160 -- 140 *(3) 2Canada.............................................................. 5,363 17,389 5,285 2,871 252 612
France ............................................................... 5,570 18,608 9,830 2,104 279 256Germany ........................................................... 1,920 12,087 3,757 1,187 191 301Japan ................................................................ 16,766 26,650 29100 12,818 511 -908Netherlands....................................................... 5,834 21,011 6,308 2,467 385 842Sweden ............................................................. 606 4,777 -1,724 258 104 -323Switzerland ........................................................ 7,348 14,998 -2,945 6,717 270 130United Kingdom................................................. 8,436 259142 7,967 3,603 619 2,105
Services I ............................................................. 3,854 65,698 26,576 5,636 1,663 -474Australia............................................................ *1,788 *7,566 *3,398 *2,360 *60 *-237Belgium ............................................................. *6 *118 '79
.9 *1 *-13Canada.............................................................. 120 5,371 1,238 249 203 90France ............................................................... 140 3,239 800 166 90 -28Germany ........................................................... 88 2,741 1,174 58 77 144Japan ................................................................ 618 15,719 7,004 957 293 -205Netherlands....................................................... 550 8,782 3,366 922 239 -27Sweden .............................................................
.9*534 *415 *11 -4 -3
Switzerland ........................................................ 29 2,266 1,165 55 124 -61United Kingdom.................................................. . 375 11,391 4,411 564 314 163
Footnotes at end of table.
89

Foreign-Controlled Domestic Corporations, 1994
Table 1. -- Foreign-Controlled Domestic Corporations: Selected Items and Percentages, by SelectedIndustrial Groupings and Countries -- ContinuedI'All figures are estimates based on samples -- money amounts are in millions of dollarsl
Net Statutory spa ial deductions Income
Selected industrial groupings income Net Net subject
and countries (less income Deficit Total operating loss to
deficit) deduction tax
(20) (21) (22) .(23) (24) (25)
All Industries I .............. ....... 21,949 44,724 22,775 10,698 9,359 34,351
Australia............................................................ 25 826 801 121 118 705
Belgium..................... ....................................... 651 802 .151 76 69 727
Canada .............................................................. 2,223 4,233 2,010 1,289 957 2,985
France ........................ ...................................... 952 2,520 1,568 813 753 1,709
Germany ................. I ......................................... 2,163 3,754 1,590 893 759 2,907
Japan................................................... V............ 2,043 8,048 6,004 2,328 2,219 5,742
Netherlands ....................................................... 2,777 4,216 1,438 1,015 794 3,294
Sweden............................................................. 572 1,049 . 477 171 155 879
Switzerland................. . .... ............. ................. 1,199 2,281 1,082 448 375 1,892
United Kingdom ......................................... ... ... 6,912 91752 2,840 1,811 -1-509- -- 7,982
Manufacturing I ................................................... 13,821 21,368 7,547 4,803 4,072 16,641*
Australia ..... :...................................................... -41 205 246 *67 *66 139
Belgium............................................................. *61 *66 -5 *58 *58 -8
Canada .................................. ; ........................... 970 1,537 568 626 373 942
France............................................................... 754 1,711 958 551 515 1,161
Germany...... . .. . ... . ... .................................... 1,951 2,269 318 541 453 1,730- - - .
Japan ......................................................... ..- - - 1, -801 - - -3,028- 1 2271 1,127- -1,091- -1,903-
Netherlands ........................................................ 1,527 1,833 306 439 335 1,396
Sweden ............................................................. 427 475 47 39 29 436
Switzerland ........................................................ 9.04 1,554 650 295 278 1,262
United Kingdom.......t ........ ................................ 2,803 4,640 1,838 611 446 4,064
Wholesale trade I ................................................ 3,367 7,390 4,023 2,073 1,976 5,325
Australia .............................................. ......... ..... *-15 *11 *25 -8 .8 -2. .Belgium ............... a .......................................... ...
.27 33 6- '14 - -7
.....................................................Canada 150 350 200 94 93 256.........
.........................................................France 44 156 112 35 32 121......
Germany ........................................................... -4V 655 1,093 227 220 429
Japan ................................................................ 1,322 2,696 1,374 743 722 1,960
..................................................Netherlands 332 539 207 140 107 399...........................................................Sweden 452 471 19 *98 *98 *372
........Switzerland ........................................................ 183 217 34 37 36 180
United Kingdom ................................................. 1,253 1,327 75 351 338 977
Finance, Insurance, and real estate I................ 2,165 7,961 5,796 1,967 1,533*
6,223*32
.....................................................Australia -27 59 85 26 25*.......
Belgium............................................................. 2 21 18 .1 * (3) 20
.................................................Canada 560 1,196 636 259 198 941.............
..................................................France 246 370 124 152 134 221.............
Germany........................................................... 224-879
2801 291
562,171
75263
37217
2491,042
Japan..................................................................................................... V
..........Netherlands 762
,1,161 369 200 124 1,052
*.........................................................Sweden -327 *47 373 *15 *10 33
..................................................................Switzerland 118 378 260 83 *27 351
.United Kingdom ................................................. ~I,942 2,175 232 493 404 1,687
Services I ...........................................I.................. -377 2,186 2,563 609 593 1,584
.........................................................Australia *-230 *5 *235 *2 -2 *3...
Belgium ............................... : .................. : .......... *-13 -2 *14 -- - -2
................. .................................. I .....Canada 90 235 145 100 94 141.....
.....................................................France -18 104 122 14 *13 91..........
Germany........................................................... 145 183 38 *5 *3 178
Japan ................................................................ -140 648 788 78 75 570
Netherlands..................-*--*** ...... **""***
......... -24; 255 279 160 160 95*
........................................................Sweden .3 -7 *4 - 7*.....
Switzerland ........................................................ -62 M 116 *13 *13 41
United Kingdom................................................. 178. 1 503 325 157 g 153 346
Footnotes at end of table.
90

Foreign-Controlled Domestic Corporations, 1994
Table 1. -- Foreign-Controlled Domestic Corporations: Selected Items and Percentages, by SelectedIndustrial Groupings and Countries -- Continued[All figures are estimates based on samples -- money amounts are in millions of dollarsl
Income tax before credits Credits Total
Selected industrial groupings Alternative Foreign income
and countries Total Regular tax minimum Total tax tax after
tax credit credits
(26) (27) (28) (29) (30) (31)
All Industries I ..................................................... 12,858 11,900 829 2,768 1,835 10,090
Australia............................................................ 253 246 6 169 *142 84
Belgium ............................................................. 281 254 26 142 *136 139
Canada.............................................................. 1,096 1,023 69 95 20 1,001
France ............................................................... 660 590 67 159 124 501
Germany ........................................................... 1,104 1,005 96 126 56 979
Japan ................................................................ 2,232 1,990 230 371 242 1,862
Netherlands ....................................................... 1,354 1,147 128 187 128 1,167
Sweden ............................................................. 310 306 3 94 *23 216
Switzerland ........................................................ 684 656 25 103 13 581
United Kingdom ................................................. 2,903 2,781 108 380 229 2,523
Manufacturing I................................................... 6,263 5,793 369 1,527 991 4,736
Australia ............................................................ 51 *Q *2 *2 *(3) 49
Belgium ............................................................. *23 -3 *20 *(3) *(3) *23
Canada.............................................................. 366 324 40 54 .8 312
France ............................................................... 438 404 32 118 91 321
Germany ........................................................... 649 600 48 66 24 583
Japan ................................................................ 728 661 64 75 18 654
Netherlands....................................................... 639 487 77 104 63 536
Sweden ............................................................. 154 152.1 42 *18 118
Switzerland ........................................................ 460 439 19 87 -5 373
United Kingdom................................................. 1,457 1,418 31 206 90 1,251
Wholesale trade I ................................................ 2,049 1,824 216 192 55 1,857
Australia ............................................................ -2 T) *2 -- -- -2
Belgium ............................................................. *7 *7 *(3) *(3) *(3) *7
Canada.............................................................. 91 86 4 * 1 *(3) 90
France............................................................... 43 40 -3 *2 *2 41
Germany........................................................... 177 146 30 9 *1 168
Japan ................................................................ 803 677 122 67 7 736
Netherlands....................................................... 169 137 31 14 -2 155
Sweden ............................................................. .131 *130 *(3) *47 *84
Switzerland ........................................................ 64 61 *3 1 *(3) 63
United Kingdom................................................. 351 339 11 46 41 305
Finance, Insurance, and real estate I ................ 2,272 2,156 104 206 144 2,065
Australia ............................................................ 12 *11 *(3) *(3) *(3) 11
Belgium ............................................................. *7 -7 *(3) *(3) *(3) *7
Canada.............................................................. 328 324 4 14.1 314
France............................................................... 104 76 28 *37 *31 67
Germany........................................................... 98 86 12 23 *23 75
Japan................................................................ 386 362 20 58 49 328
Netherlands ....................................................... 372 368 3 6 -2 367
Sweden ............................................................. *12 *11 *1 *5 *5 *7
Switzerland ........................................................ 123 122 *1 *13 *7 110
United Kingdom ................................................. 619 589 28 17 15 602
Services 1................ ; ............................................ 584 540 42 206 189 378
Australia .............................................................1 *1 *(3)
T)*(3) .1
Belgium..............................................................1 *1 - *(3) *(3) .1
Canada .............................................................. 50 46 *4 -6 -2 44
France............................................................... 32 30 3 *(3) -- 32
Germany ........................................................... 61 61 *(3) *2 .1 59
Japan................................................................ 214 198 15 161 *158 53
Netherlands ....................................................... 39 33 7 *2 -2 37
Sweden............................................................. *2 -2 -- *(3) *(3) -2
Switzerland ........................................................ *15 *14 *(3) -2 .1 *13
United Kingdom ................................................. 131 119 1 11 30 25 100
Footnotes at end of table.
91
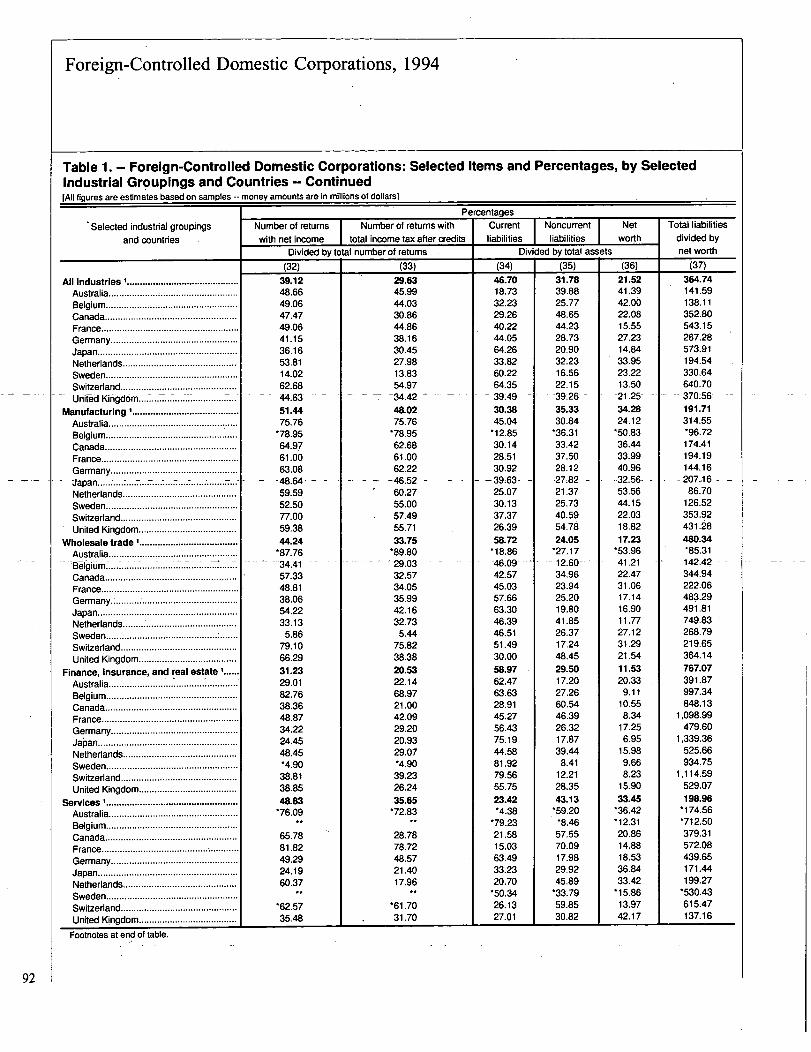
92
Foreign-Controlled Domestic Corporations, 1994
Table 1. Foreign-Contro lied Domestic Corporations: Selected Items and Percentages, by SelectedIndustrial Groupings and Countries -- Continued[All fiaures are estimates based on samples -- money amounts are in millions of dollarsl
Percentages
Selected industrial groupings Number of returns Number of returns with
I
Current Noncurrent
I
Net
I
Total liabilities
and countries with net income total income tax after credits liabilities liabilities worth divided byDivided by total number of returns Divided by total assets net worth
(32) (33) (34) (35) (36) (37)
All Industries I ........................................... 39.12 29.63 46.70 31.78 21.52 364.74Australia ................................................... 48.66 45.99 18.73 39.88 41.39 141.59
Belgium................................................... 49.06 44.03 32.23 25.77 42.00 138.11
Canada ................................................... 47.47 30.86 29.26 48.65 22.08 352.80
France ..................................................... 49.06 44.86 40.22 44.23 15-55 543.15Germany ................................................. 41.15 38.16 44.05 28.73 27.23 267.28
Japan ...................................................... 36.16 30.45 64.26 20.90 14.84 573.91
Netherlands ............................................ 53.81 27.98 33.82 32.23 33.95 194.54
Sweden................................................... 14.02 13.83 60.22 16.56 23.22 330.64
Switzerland.............. __.................... 62.68 54.97 64.35 22.15 13.50 640.70
United Kingdom .................................. ...... 44.63 -34.42 39'49 39.26 -21.25- -370
*56
Manufacturing I ......................................... 51.44 48.02 30.38 35.33 34.28 191.71
Australia............................................ ..... 75.76 75.76 45.04 30.84 24.12 314.55
Belgium................................................... *78.95 *78-95 12.85 *36.31 *50.83 *96.72
Canada ................................................... 64.97 62.68 30.14 33.42 36.44 174.41
France ..................................................... 61.00 61.00 28.51 37.50 33.99 194.19
Germany................................................. 63.08 62.22 30.92 28.12 40.96 144.16
Japan ........................................................ -48.64 -46.52 -39.63 27.82 32.56
Netherlands ............................................ 59.59 60.27 25.07 21.37 53.56 86.70
Sweden................................................... 52.50 55.00 30.13 25.73 44.15 126.52
Switzerland ............................................. 77.00 57.49 37.37 40.59 22.03 353.92
United Kingdom ...................................... 59.38 55.71 26.39 54.78 18.82 431.~B
Wholesale trade I .......7.............................. 44.24 33.75 58.72 24.05 17.23 480.34
Australia ......................... ' * * -- ------- '* , " * **87.76 *89.80 18.86 *27.17 *53.96 *85.31
7: - - ::: - -Belgium...... ..... ..... ....... .. ............................... -34.41 --29.03 -46
'09 12.60- - 41.21 142.42
Canada ................................................... 57.33 32.57 42.57 34.96 22.47 344.94
France ..................................................... 48.81 34-05 45-03 23.94 31.06 222.06
Germany................................................. 38.06 35-99 57.66 25.20 17.14 483.29
Japan ...................................................... 54.22 42.16 63.30 19.80 16.90 491.81
Netherlands ............................................ 33.13 32.73 46.39 41.85 11.77 749.83
Sweden ................................................... 5.86 5.44 46.51 26.37 27.12 268.79
Switzerland ............................................. 79.10 75.82 51.49 17.24 31.29 219.65
United kingdom ...................................... 66.29 38.38 30.00 48.45 21.54 364.14
Finance, Insurance, and real estate I ...... 31.23 20.53 58.97 29.50 11.53 767.07
Australia ......................... * ......................... 29.01 22.14 62.47 17.20 20.33 391.87
Belgium ................................................... 82.76 68.97 63.63 27.26 9.11 997.34
Canada ................................................... 38.36 21.00 28.91 60.54 10.55 848.13
France..................................................... 48.87 42.09 45.27 46.39 8.34 1,098.99
Germany................................................. 34.22 29.20 56.43 26.32 17.25 479.60
Japan...................................................... 24.45 20.93 75.19 17.87 6.95 1,339.36
Netherlands............................................ 48.45 29.07 44.58 39.44 15.98 525.66
Sweden ............... ................................... *4.90 *4.90 81.92 8.41 9.66 934.75
Switzerland ............................................. 38.81 39.23 79.56 12.21 8.23 1,114.59
United Kingdom...................................... 38.85 26.24 55.75 28.35 15.90 529.07
Services I................................................... 48.83 .35.65 23.42 43.13 33.45 198.96
Australia .................................................. *76.09 *72.83 *4.38 *59.20 *36.42 174.56
Belgium ................................................... *79.23 *8.46 12.31 *712.50
Canada ................................................... 65.78 28.78 21.58 57.55 20.86 379.31
France......................................... ........... 81.82 78.72 15.03 70.09 14.88 572.08
Germany................................................. 49.29 48.57 63.49 17.98 18.53 439.65
Japan...................................................... 24.19 21.40 33.23 29.92 36.84 171.44
Netherlands............................................ 60.37 17.96 20.70 45.89 33.42 199.27
Sweden ................................................... *50.34 *33.79 15.86 *530.43
Switzerland ............................................. *62.57 *61.70 26.13 59.85 13.97 615.47
United Kingdom...................................... 35.48 31.70 27.01 30.82 42.17 137.16
Footnotes at end of table.
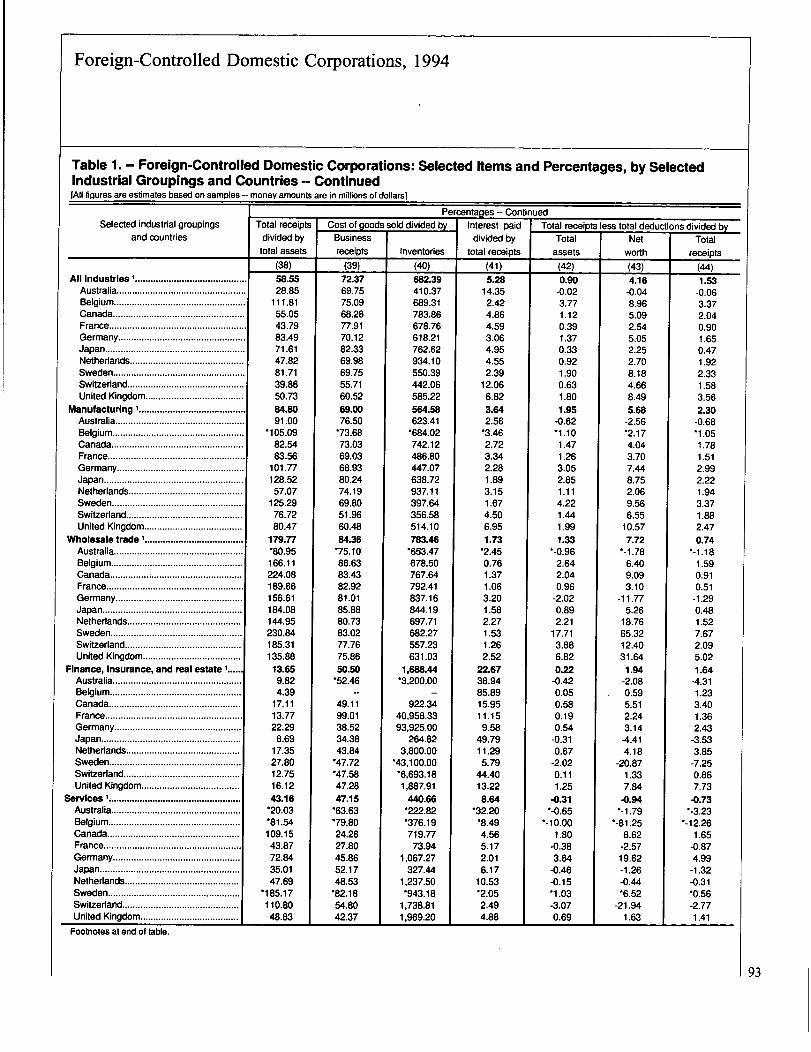
Foreign-Controlled Domestic Corporations, 1994
Table 1. - Foreign-Controlled Domestic Corporations: Selected Items and Percentages, by SelectedIndustrial Groupings and Countries - Continued[All figures are estimates based on samples -- money amounts are in millions of dollars]
Selected industrial groupingsand countries
All Industries I...........................................Australia ..................................................Belgium...................................................Canada ...................................................France .....................................................Germany .................................................Japan ......................................................Netherlands............................................Sweden ...................................................Switzerland .............................................United Kingdom......................................
Manufacturing I .........................................Australia ..................................................Belgium...................................................Canada ...................................................France .....................................................Germany .................................................Japan ......................................................Netherlands ............................................Sweden ...................................................Switzerland .............................................United Kingdom......................................
Wholesale trade I ......................................Australia..................................................Belgium ...................................................Canada ............... ; ...................................France .....................................................Germany .................................................Japan ......................................................Netherlands ............................................Sweden ...................................................Switzerland .............................................United Kingdom......................................
Finance, Insurance, and real estate I ......Australia..................................................Belgium ...................................................Canada ...................................................France ................ . ...................................Germany .................................................Japan ......................................................Netherlands ............................................Sweden ...................................................Switzerland .............................................United Kingdom......................................
Services I ...................................................Australia ..................................................Belgium...................................................Canada ...................................................France .....................................................Germany .................................................Japan ......................................................Netherlands ............................................Sweden ...................................................Switzerland .............................................United Kingdom......................................
Footnotes at end of table.
Total receiptsdivided by
total assets
(38)58.5528.85
111.8155.0543.7983.4971.6147.8281.7139.8650.7384.8091.00
*105.0982.5483.56
101.77128.52
57.07125.2976.7280.47
179.77*80.95166.11224.08189.66156.61184.08144.95230.84185.31135.8813.65
9.824.39
17.1113.7722.29
8.6917.3527.8012.7516.1243.16
*20.03*81.54109.15
43.8772.8435.0147.69
*185.17110.8048.83
Cost of goods sold divided byBusinessreceipts
(39)72.3769.7575.0968.2877.9170.1282.3369.9869.7555.7160.5269.0076.50
*73.6873.0369.0368.9380.2474.1969.8051.9660.4884.36
*75.1086.6383.4382.9281.0185.8880.7383.0277.7675.8650.50
*52.46
49.1199.0138.5234.3843.84
*47.72*47.5847.2847.15
*63.63*79.8024.2627.8045.8652.1748.53
*82.1854.8042.37
Inventories(40)682.39410.37689.31783.86678.76618.21762.62934.10550.39442.06585.22564.58623.41
*684.02742.12486.80447.07638.72937.11397.64356.58514.10783.46
*653.47678.50767.64792.41837.16844.19697.71682.27557.23631.03
1,688.44*3,200.00
922.3440,958.3393,925.00
264.823,800.00
*43,100.00*6,693.181,887.91
440.66*222.82*376.19719.77
73.941,067.27
327.441,237.50*943.18
1,738.811,969.20
Percentages - ContinuedInterest paiddivided by
total receipts
(41)5.28
14.352.424.864.593.064.954.552.39
12.066.823.642.56
*3.462.723.342.281.893.151.674.506.951.73
*2.450.761.371.063.201.582.271.531.262.52
22.6738.9485.8915.9511.159.58
49.7911.295.79
44.4013.228.64
*32.20*8.494.565.172.016.17
10.53*2.052.494.88
Total receipts less total deductiTotal
assets(42)
0.90-0.023.771.120.391.370.330.921.900.631.801.95
-0.62*1.10
1.471.263.052.851.114.221.441.991.33
*-0.962.642.040.96
-2.020.892.21
17.713.886.820.22
-0.420.050.580.190.54
-0.310.67
-2.020.111.25
-0.31*-0.65
*-10.001.80
-0.383.64
-0.46-0.15*1.03-3.070.69
Networth
(43)4.16
-0.048.965.092.545.052.252.708.184.668.495.68
-2.56*2.174.043.707.448.752.069.566.55
10.577.72
*-1.786.409.093.10
-11.775.26
18.7665.3212.4031.64
1.94-2.080.595.512.243.14
-4.414.18
-20.871.337.84
-0.94*-1.79
*-81.258.62
-2.5719.62-1.26-0.44*6.52
-21.941.63
ons divided byTotal
receipts
(44)1.53
-0.063.372.040.901.650.471.922.331.583.562.30
-0.68*1.051.781.512.992.221.943.371.882.470.74
*-1.181.590.910.51
-1.290.481.527.672.095.021.64
-4.311.233.401.362.43
-3.533.85
-7.250.867.73
-0.73*-3.23
*-12.261.65
-0.874.99
-1.32-0.31*0.56-2.771.41
93

Foreign-Controlled Domestic Corporations, 1994
Table 1. -- Foreig n-Contro lied Domestic Corporations: Selected Items and Percentages, by SelectedIndustrial Groupings and Countries -- Continued[All figures are estimates based on samples -- money amounts are in millions of dollarsl
Selected industrial groupingsand countries
All Industries I...........................................Australia ........................................ :.........Belgium ...................................................Canada ...................................................France.....................................................Germany.................................................Japan ......................................................Netherlands ............................................
Sweden ...................................................-Switzerland
'-* ........"
--'
-"**-- _"'
-"**
......United Kingdom ......................................
Manufacturing I .........................................Australia..................................................Belgium...................................................
Canada ...................................................France .....................................................
- -Germany ........ ........ ...............--... v .....Japan .......................... ...........................Netherlands ............................................Sweden ...................................................Switzerland .............................................United Kingdom......................................
Wholesale trade I ......................................
Australia .... .......*......... .......
Belgium ...................................................Canada...................................................France......................................................Germany .................................................Japan ......................................................Netherlands ............................ ! ...............
Sweden...................................................Switzerland.............................................United Kingdom ......................................
Finance, Insurance, and real estate .......
Australia..................................................
Belgium ...................................................Canada ......................... : .........................
France.....................................................Germany- ..............................................
Japan ......................................................Netherlands ............................................Sweden ...................................................Switzerland .............................................United Kingdom ......................................
Services I ...................................................Australia..................................................Belgium...................................................Canada ...................................................France .....................................................Germany .................................................Japan......................................................Netherlands............................................Sweden ...................................................Switzerland .............................. : ..............United Kingdom .......................... : ...........
Footnotes at end of table.
Totalassets
(45)
0.940.043.991.100.46,1.370.370.901.930.641.822.11
-0.46*1.101.491.55
-3.152.911.134.361.502.091.37
*-0.96-2.642.040.99
-1.970.922.21
17.713.886.990.19
-0.520.050.530.180.40
-0.300.60
-2.040.101.15
-0.25*-0.63
*_10.001.80
-0.253.66
-0.32-0.13* 1.03-3.120.75
Percentages -- ContinuedNet income (less deficit) divided by
Networth(46)4.360.089.515.002.985.052.462.668.31
-----4.758.566.17
-1.91*2.174.084.55
--7.708.952.109.886.81
11.117.92
*-1.786.409.093.17
-11.485.44
18.8265.3212.4032.44
1.65-2.550.595.052.152.34
-4.273.78
-21.121.217.23
-0.75*-1.73
*-81.258.62
-1.6519.75-0.86-0.39*6.52
-22.301.78
Totalreceipts
(47)1.600.123.572.001.061.650.511.892.36
-1.613.582.49
-0.51*1.051.801.853.102.271.973.481.962.600.76
*-1.18-1.590.910.52
-1.260.501.537.672.095.141.40
-5.281.233.111.301.81
-3.413.49
-7.340.787.13
-0.58'*-3.14*-12.26,
1.65-0.565.03
-0.90-0.27*0.56-2.811.54
Net operating lossdeduction divided by
net income
(48)20.9314.298.60
22.6129.8820.2227.5718.8314.7816.44_15.4719.06
*32.20*87.88'24.2730-1019.9636.0318.286.11
17.899.61
26.74*72.73*21.2126.5720.5133.5926.7819.85
*20.8116.5925.4719.26
*42.37*1.5416.5636.2213.2116.8110.68
*21.2.8*7.1418.5727.13
*40.00
40.0012.50*1.6411.5762.75
*24.0730.42
94

Foreign-Controlled Domestic Corporations, 1994
Table 1. -- Foreign-Controlled Domestic Corporations: Selected Items and Percentages, by SelectedIndustrial Groupings and Countries -- Continued[All figures are estimates based on samples - money amounts are in millions of dollars]
Selected industrial groupingsand countries
All Industries I ...........................................Australia ..................................................Belgium ...................................................Canada ...................................................France....................................................Germany .................................................Japan......................................................Netherlands ............................................Sweden ...................................................Switzerland.............................................United Kingdom ......................................
Manufacturing I ........................................Australia..................................................Belgium...................................................Canada ...................................................France ....................................................Germany .................................................Japan ......................................................Netherlands ............................................Sweden...................................................Switzerland .............................................United Kingdom ......................................
Wholesale trade I ......................................Australia..................................................Belgium ...................................................Canada...................................................France .....................................................Germany .................................................Japan ......................................................Netherlands ............................................Sweden .............. ....................................Switzerland .............................................United Kingdom ......................................
Finance, Insurance, and real estate I ......Australia..................................................Belgium ...................................................Canada...................................................France ....................................................Germany .................................................Japan ......................................................Netherlands............................................Sweden ...................................................Switzerland .............................................United Kingdom......................................
Services I ...................................................Australia ..................................................Belgium ...................................................Canada ...................................................France.....................................................Germany.................................................Japan......................................................Netherlands............................................Sweden ...................................................Switzerland .............................................United Kingdom......................................
Totalassets
(49)
Income subject to tax divided by
1.470.994.461.480.831.851.031.072.971.012.102.55
*1.56*0.141.442.382.803.081.034.452.103.032.16
*0.13*1.953.482.711.931.362.66
1 4.583.825.450.55
*0.61*0.540.890.160.450.350.84
*0.210.301.001.05
*0.01*1.542.821.244.491.290.52
*2.41*2.061.46
Networth(50)
6.832.40
10.616.715.356.786.933.16
12.777.499.887.43
*6.48*0.283.967.016.829.461.92
10.099.51
16.1112.53*0.24*4.7415.518.72
11.278.07
22.62*53.76
12.2025.30
4.75*3.02*5.928.481.932.605.065.22
*2.133.596.283.13
*0.02*12.50
13.518.36
24.253.491.55
*15.22*14.75
3.47
Percentagqs~niuecl
Totalreceipts
(51)2.513.443.992.691.902.211.442.243.632.544.143.00
*1.72*0.14
1.752.852.752.401.803.562.733.771.20
*0.16*1.181.561.431.230.741.84
*6.312.064.014.02
*6.26*12.27
5.231.172.014.054.81
*0.742.326.192.43
*0.04*1.892.582.836.173.671.09
*1.30*1.862.99
Total income tax after creditsTotal
assets(52)
0.430.120.850.500.240.620.330.380.730.310.660.720.55
*0.420.480.660.941.060.401.210.620.930.75
*0.13*0.681.230.920.760.511.03
*3.291.341.700.180.21
*0.190.300.050.130.110.29
*0.040.090.360.25
*(3)
*0.770.880.441.490.120.20
*0.69*0.650.42
_~___Esfimate should be used with caution because of the small number of sample returns on which it is based.
Networth
(53)2.000.292.032.251.572.282.251.123.142.303.122.112.28
*0.821.311.942.303.250.742.732.814.964.37
*0.24*11.665.452.964.423.038.79
*12.144.277.901.581.04
*2.072.830.590.781.591.82
*0.451.132.240.75
*0.01*6.254.212.948.040.320.60
*4.35*4.681.00
Not shown to avoid disclosure of information about specific corporations. However, the data are included in the appropriate totals.
includes industrial groups and/or countries, as appropriate, not specifically listed.
0.740.410.760.900.560.740.470.790.890.781.310.850.61
*0.400.580.790.930.820.690.960.811.160.42
*0.16*0.410.550.480.480.280.71
*1.430.721.251.332.15
*4.291.740.360.611.271.68
*0.160.732.210.58
*0.01*0.940.811.002.050.340.42
*0.37*0.590.87
2 Excludes interest received on State and local Government obligations.3 For money amounts, less than $500,000. For percentages, less than 0.005 percentNOTE: This table presents separate data for the 10 largest countries, based on total receipts (column 12) for 1994, at the all-industries level. 95

Foreign-Controlled Domestic Corporations, 1994
Table 2. -- "Large" Foreign-Controlled Domestic Corporations Compared to Other "Large" DomesticCorporations: Selected Items and Percentages, by Selected Industrial Groupings and Countries,and by Age of Corporationsimoney amounts are in miuions ot aoijarsi
Selected industrialgroupings, type of corporations,
age of corporations,and selected countries
All Industries':Domestic corporations not foreign controlled ....New corporations..................................................Old corporations ....................................................
Foreign-controlled domestic corporations' .........New corporations..................................................Old corporations ....................................................Selected countries:
........... ;~ ..................-Canada ............ ....................,New corporations ...............................................Old corporations .................................................
France .................................................................*
-New corporabons ...............................................Old corporations .................................................
Germany ...............................................................-New corporations......................... . ..............Old corporations................................................
Japan .......................................................... : .........
New corporations : ............................... I ......Old corporations.................................................
Netherlands...........................................................New corporabons...............................................Old corporations.................................................
United Kingdom....................................................New corporabons...............................................Old corporations.................................................
Manufacturing:Domestic corporations not foreign controlled....New'corporations ..................................................Old corporations ....................................................
Foreign-controlled domestic corporations' ........New corporations ..................................................Old corporations .... ...............................................Selected countries:Canada.................................................................New corporations ...............................................Old corporations .................................................
France ...................................................................New corpor
Iations ...............................................
Old corporations .................................................Germany ...............................................................New corporations ...............................................Old corporations .................................................
Japan ....................................................................New corporations ...............................................Old corporations .................................................
Netherlands................. .........................................New corporations ...............................................Old corporations .................................................
United Kingdom....................................................New corporations ...............................................Old corporations .................................................
Footnotes at end of table.
Total
(1)
Number of returnsWithnet
income
13,7891,183
12,6052,488
2072,281
-257-25
231147
6141199- 9190663
49614212
2219030124
277
3,446243
3,203991
64926
108109869
465
1098
101241
13229
644
60136
5131
(2)
11,102845
10,2581,743
1371,607
183-14
169100
397
1606
153454
36418143
21916
203
2,792160
2,632722
40682
856
7945
90
1696
16345
102
With totalincome tax
after credits(3)
9,732611
9,1201,787
1391,648
_185-14
171108
3105169
6-162467
36432147
22417
207
2,856159
2,697750
42708
867
7949
9;
1776
17146
107
Total
(4)
17,842,800713,311
17,129,4892,149,238
133,1012,016,137
-178,7818,118
170,663197,745
4,673193,071145,054
- 944144,110505,028
67,839437,189298,155
13,882284,27336,466
15,455347,950
3,463,87584,386
3,379,48962Z961
27,742595,219
61,7626,418
55,34547,327
1,35845,96857,409
84956,56054,602
3,52551,077
134,454679
133,775130,529
6,422124,107
Assets
Inventories
(5)
628,55322,326
606,227114,417
8,065106,352
7,063439
6,6248,0991,1946,905
11,847226
11,62036,057
2,43133,626
9,241301
8,94016,31 C1,370
14,948
251,6249,621
242,00358,840
3,17655,664
4,473296
4,1775,256
2125,0438,162
1837,9788,715
6158,1005,707
1045,603
11,336682
10,655
Loansto
stockholders(6)
29,9631,998
27,966149052
16513,888
461(3)
4611,601
(3)
1,60139(3)
- -39--903
3900
1,23737
1,2006,
1005,928
16,506326
16,1801,845
531,793
285(1)
285208
(1)208
36(1)3611(3)
1120837
172809
(3)
809
Currentliabilities
(7)
7,129,897219,472
6,910,4241,024,142
77,969946,172
52,6072,144
50,46379,749
89478,85565,186
75064,437-
339,47551,049
288,426101,068
8,95692,112
T44,6183,962
140,656
1,053,62618,598
1,035,029187,231
10,534176,697
18,5061,293
17,21313,517
28713,23017,685
69316,99221,364
1,78419,58033,544
12833,41534,202
1,135332,349
96

Foreign-Controlled Domestic Corporations, 1994
Table 2. - "Large" Foreign-Controlled Domestic Corporations Compared to Other "Large" DomesticCorporations: Selected Items and Percentages, by Selected Industrial Groupings and Countries,and by Age of Corporations -- Continued[Money amounts are in millions ot oollarsi
Selected industrial Number of returns Assets
groupings, type of corporations, With With total Loans Current
age of corporations, Total net income tax Total Inventories to liabilities
and selected countries income after credits stockholders
(1) (2) (3) (4) (5) (6) (7)
Wholesale trade:Domestic corporations not foreign controlled.... 1,723 1,437 1,434 378,196 92,211 758 210,325
New corporations .................................................. 78 51 54 15,094 4,206 372 5,429
Old corporations .................................................... 1,645 1,386 1,380 363,102 88,004 386 204,896Foreign-controlled domestic corporations'......... 666 SIX) 503 218,796 38,469 865 126,626New corporations .................................................. 66 52 52 28,210 3,316 109 9,957
Old corporations.................................................... 601 449 451 190,587 35,152 756 116,669
Selected countries:Canada .................................................................. 47 34 34 5,729 1,293 15 2,091
New corporations............................................... 7 655 117 (3) 225
Old corporations................................................. 40 5,074 1,176 15 1,866
France................................................................... 21 15 18 3,488 591 36 1,453
New corporations............................................... 638 101 (1) 440
Old corporations................................................. 2,850 491 36 1,012
Germany............................................................... 52 40 41 19,611 2,369 3 11,541
New corporations............................... 95 43 (1) 57
Old corporations ................................................. 19,516 2,326 3 11,484
Japan.................................................................... 254 193 195 135,919 24,202 671 86,183
New corporations ............................................... 20 17,307 1,816 3 6,126
Old corporations ................................................. 234 118,612 22,387 668 80,057
Netherlands ........................................................... 44 28 29 13,790 2,098 18 6,326
New corporations ............................................... 8 8 8 737 110 (3) 195
Old corporations ................................................. 36 20 21 13,053 1,988 18 6,131
United Kingdom .................................................... 35 27 25 16,024 2,324 97 4,375
New corporations ............................................... 5 6,360 500 97 1,133
Old corporations ................................................. 30 9,665 1,825 (1) 3,242
Finance, Insurance, and real estate:Domestic corporations not foreign controlled .... 4,480 3,717 2,163 11,234,574 118,141 5,428 5,251,683
New corporations .................................................. 550 456 197 424,518 1,373 1,227 167,216
Old corporations .................................................... 3,930 3,262 1,967 10,810,056 116,768 4,201 5,084,468
Foreign-controlled domestic corporations' ......... 377 244 244 1,046,353 1,372 10,956 645,033
New corporations .................................................. 30 17 17 64,257 97 (3) 54,272
Old corporations .................................................... 347 227 227 982,096 1,274 10,956 590,761
Selected countries:Canada................................................................. 38 24 24 94,493 413 8 28,015
New corporations............................................... 755 -- (3) 459
Old corporations................................................. 93,738 413 8 27,555
France................................................................... 28 20 19 134,434 -- 1,351 60,944
New corporations............................................... -- -- -- -- --
Old corporations................................................. 28 20 19 134,434 1,351 60,944
Germany ............................................................... 16 51,849 (3) 30,416
New corporations............................................... -- -- -- --
Old corporations................................................ 16 51,849 -- (3) 30,416
Japan ................................................................... 97 52 54 268,776 452 221 215,205
New corporations............................................... 11 6 6 46,853 -- (3) 43,047Old corporations................................................. 86 46 48 221,924 452 221 172,157
Netherlands ........................................................... 32 23 23 122,103 37 984 55,205
New corporations............................................... 3 3 3 9,892 -- (3) 8,256
Old corporations................................................. 29 20 20 112,211 37 984 46,949
United Kingdom .................................................... 55 45 44 162,518 369 4,984 92,756
New corporations............................. _* ...... 4 1,525 97 (3) 585
Old corporations................................................ 51 1 160,994 1 272 4,984 1 92,170
-Footnotes at end oVt-abFe-.
97

Foreign-Controlled Domestic Corporations, 1994
Table 2. -- "Large" Foreign-Controlled Domestic Corporations Compared to Other "Large" DomesticCorporations: Selected Items and Percentages, by Selected Industrial Groupings and Countries,and by Age of Corporations-Continuedtmoney amounts are in mjiiions ot ciouarsi
Selected industrial Noncurrent liabilities Net worthgroupings, type of corporations, Loans Total Business
age of corporations, Total from Total Retained receipts receipts
and selected countries stockholders earnings
(8) (9) (10) (11) (12) (13)
All Industries':Domestic corporations not foreign controlled.... 5,219,181 63,430 5,493,722 1,543,907 -7,211,689 6,112,966
New corporations .................................................. 193,895 1,204 299,944 30,260 280,936 248,371
Old corporations .................................................... 5,025,286 62,226 5,193,779 1,513,647 6,930,753 5,864,595
Foreign-controlled domestic corporations' ......... 656,237 35,257 468,860 -7,271 1,2389364 1,123,102
New corporations .................................................. 37,281 1,438 17,851 -5,539 77,7134 71,239
Old corporations .... ............................................... 618,956 33,820 451,009 -1,732 1,160,580 1,051,863
Selected countries:Ca~nada................................................... 871066- -- 4-1042 39,108 516T7 - -94,373 - -- -84-1718
New corporations ............................................... .4,420 264 1,554 -482 8,727 8,164
Old corporations ................................................. 82,646 3,778 37,554 6,159 85,646 76,553
France................................................................... 87,869 3,123 30,126 -7,433 84,569 73,443
New corporations ............................................... 4,012 (3) -233 -1,493 3,033 2,961
Old corporations ................................................. 83,857 3,123 30,359 -5,939 81,536 70,481
Germany............................................................... 41,761 1,276 38,106 -1,535 119,288 111,963
New corporations; ...7 ........... ...... .......................- ---- -32 - .(3) -163 --378- - 1,514 1,457
Old corporations ................................................. 41,730 1,276 37,944 -1,157 117,773 110,506
Japan ........................................................ ............ 85,268 7,421 80,285 -5,165 371,084 342,924
New corporations ...........: ................................. 1. 12,253 195 4,538 -101 31,091 27,242
Old corporations ................................................. 73,015 7,226 75,748 -5,064 339,994 315,681
Netherlands ........................................................... 93,644 3,073 103,443 13,308 141,471 128,702
New corporations ................... . ......................... 2,808 112 2,117 14 3,537 2,732
Old corporations .. ............. . .................................... . -90,836 - 2,961- -101,325 13j295--- 137,934- - -125,970
United Kingdom ................ : .................................... 141,917 9,540 76,869 -4,141 180,443 160,112
New corporations................. ............................. 7,559 651 3,934 -1,247 12,984 12,328
Old corporations................................................. 134,358 8,889 72,936 -2,894 167,458 147,784
Manufacturing:Domestic corporations not foreign controlled.... 1,207,524 29,034 1,202,725 617,338 2,865,518 2,653,617
New corporations.................................................. 32,458 306 33,331 6,180 80,775 78,404
Old corporations.................................................... 1,175,066 28,728 1,169,394 611,157 2,784,743 2,575,213
Foreign-controlled domestic corporations' ......... 220,407 17,811 215,323 3,279 519,596 495,912
New corporations .................................................. 9,733 666 7,475 -3,811 25,716 24,704
Old corporations.................................................... 210,674 17,145 207,848 7,090 493,880 471,208
Selected countries:Canada .................................................................. 20,364 2,068 22,892 4,735 49,417 47,601
New corporations................................................ 3,749 162 1,375 -501 4,469 3,969
Old corporations ................................................. 16,615 1,906 21,517 5,236 44,948 43,632
France ................................................................... 17,875 1,551 15,935 -5,559, 38,988 37,372
New corporations............................................... 715 (1) 356 -23 1,203 1,159
Old corporations ................................................. 17,159 1,551 15,579 -5,536 37,785 36,213
Germany ................................................................ 16,239 570 23,486 -418 57,114 54,680
New corporations............................................... 18 (1) 139 -349 1,265 1,216
Old corporations ................................................. 16,221 570 23,347 -68 55,849 53,464
Japan ..................................................................... 14,684 594 18,554 -4,448 72,740 71,285
New corporations............................................... 602 32 1,139 -167 3,654 3,542
Old corporations ................................................. 14,082 563 17,415 -4,281 .69,086 67,743
Netherlands ........................................................... 28,603 1,989 72,307 16,637 76,235 73,387
New corporations........................................... :... 331 98 220 -45 753 750
Old corporations ................................................. 28,273 1,891 72,087 16,682 75,482 72,637
United Kingdom ..................................................... 71,904 7,4313 24,423 -7,496 104,443 97,766
New corporations............................................... 2,124 301 2,445 -1,281 6,364 6,166
Old corporations ....... . ................. 69,780 1 7,1 1 21.97 -6,215 98,079 91,600
To-otnotes at end of table.
98

Foreign-Controlled Domestic Corporations, 1994
Table 2. -- "Large" Foreign-Controlled Domestic Corporations Compared to Other "Large" DomesticCorporations: Selected Items and Percentages, by Selected Industrial Groupings and Countries,and by Age of Corporations -- Continued[money amounts are in millions of aollars]
Selected industrial Noncurrent liabilities Net worthgroupings, type of corporations, Loans Total Business
age of corporations, Total from Total Retained receipts receiptsand selected countries stockholder's earnings
(8) 9) (10) (11) (12) (13)
Wholesale trade:Domestic corporations not foreign controlled.... 80,056 1,799 87,816 47,720 557,390 537,079New corporations .................................................. 4,480 476 5,186 2,678 36,313 35,932Old corporations .................................................... 75,577 1,323 82,630 45,042 521,077 501,147
Foreign-controlled domestic corporations' ......... 53,232 3,253 38,938 .2,823 393,205 381,698New corporations.................................................. 14,778 322 3,474 -159 38,748 37,578Old corporations.................................................... 38,454 2,931 35,464 -2,664 354,457 344,120Selected countries:Canada.................................................................. 2,157 385 1,481 -21 12,862 12,520New corporations............................................... 322 91 108 47 3,220 3,189Old corporations ................................................. 1,835 294 1,373 -69 9,642 9,331
France ................................................................... 782 176 1,253 -809 6,885 6,775New corporations ............................................... 18 (3) 180 -96 1,249 1,239Old corporations ................................................. 764 176 1,073 -712 5,636 5,536
Germany ................................................................ 5,143 607 2,927 -1,438 30,512 28,961New corporations ............................................... 14 (3) 24 -29 249 241Old corporations ................................................. 5,129 607 2,903 -1,409 30,263 28,720
Japan ..................................................................... 26,806 886 22,930 1,167 252,156 245,775New corporations............................................... 9,669 14 1,512 -81 23,259 22,451Old corporations................................................. 17,136 872 21,418 1,247 228,896 223,324
Netherlands ........................................................... 5,966 144 1,498 -443 19,638 19,055New corporations....... : ....................................... 380 14 162 3 847 843Old corporations ................................................. 5,586 130 1,336 -446 18,791 18,211
United Kingdom ..................................................... 8,424 913 3,226 -670 21,149 19,973New corporations................................................ 4,153 197 1,073 76 4,810 4,562Old corporations ................................................. 4,270 715 2,153 -746 16,340 15,411
Finance, Insurance, and real estate:Domestic corporations not foreign controlled.... 2,758,125 20,503 3,214,766 588,356 1,484,240 741,884New corporations................................................... 57,864 ill 199,438 12,424 54,467 29,494Old corporations .................................................... 2,710,261 20,392 3,015,327 575,933 1,429,773 712,389
Foreign-controlled domestic corporations' ......... 286,139 10,549 115,181 10,109 143,989 77,407New corporations .................................. ............... 4,946 317 5,039 -50 5,586 1,662Old corporations.................................................... 281,193 10,231 110,141 10,160 138,403 75,745Selected countries:Canada.................................................................. 57,848 1,058 8,630 1,367 16,139 9,869New corporations............................................... 242 (1) 54 -14 160 137Old corporations ................................................. 57,606 1,058 8,577 1,381 15,979 9,731
France ................................................................... 62,636 1,342 10,854 781 18,490 9,760New corporations............................................... -- -- - -- -- --Old corporations ................................................. 62,636 1,342 10,854 781 18,490 9,760
Germany ................................................................ 13,576 (3) 7,857 999 11,946 9,526New corporations ............................................... -- -- - -- -- -Old corporations ................................................. 13,576 (3) 7,857 999 11,946 9,526
Japan ..................................................................... 31,691 4,934 21,881 -771 22,865 4,746New corporations ............................................... 1,952 150 1,853 136 3,546 622Old corporations................................................. 29,739 4,784 20,028 -907 19,319 4,124
Netherlands........................................................... 47,215 367 19,682 1,611 21,229 14,034New corporations............................................... 900 (3) 736 49 735 13Old corporations................................................. 46,315 367 18,946 1,562 20,494 14,021
United Kingdom ..................................................... 45,061 816 24,702 5,899 26,394 16,426New corporations................................................ 813 117 126 -40 384 281Old corporations................................................. 44,248 698 24,575 5,939 26,010 16,146
:ootnotes at end of table.
99

Foreign-Controlled Domestic Corporations, 1994
Table 2. -- "Large" Foreign-Controlled Domestic Corporations Compared to Other "Large" DomesticCorporations: Selected Items and Percentages, by Selected Industrial Groupings and Countries,and by Age of Corporations - Continuedimoney amounts are in miiijons ot (joiiarsi
Selected industrialgroupings, type of corporations,
age of corporations,and selected countries
Interestreceived 2
Totaldeductions
costof
goodssold
Interestpaid
Taxespaid
Totalreceiptsless total
deductions
(14) (15) (16) (17) (18) (19)
All Industries':Domestic corporations not foreign controlled....... 639,364 6,757,683 3,887,866 415,314 186,170 454,006New corporations..................................................... 19,514 263,359 155,471 13,757 7,311 17,577
Old corporations ....................................................... 619,850 6,494,324 3,732,395 401,557 178,859 436,429
Foreign-controlled domestic corporations' ............ 71,426 1,213,821 817,843 66,943 17,923 24,543
-New corporations..................................................... 4,540 76,800 51,797 4,512 919 984
Old corporations ....................................................... 66,885 1,137,022 766,046 62,431 17,004 23,559- Selected countries,Canada...................................................................... 6,184 92,057 58,907 4,761 1,329 2,316
New corporations ...................................................
251 8,664 5,283 471 182 63!
Old corporations ......... : ............. I............................ 5,933 83,393 53,624 4,290 1,146 2,254
France ...................................................................... 6,315 83,717 58,103 3,945 1,117 853
New corporations ................................................... 15 3,000 2,355 52 22 33
Old corporations.................................................... 6,300 80,717 55,748 3,894 1,095 819
--Germany .............. . ... ...... . ... . ................. . ....... _ 3,298-
117,510 78,328 3,787-
1,837- -
1,777--New corporations .................................................. 8 1,564 1,160 24 39 11
Old corporations .................................................... 3,289 116,007 77,228 3,763 1,798 1,767
Japan ........................................................................ 19,397 367,017 284,610 18,017 2,832 4,067
New corporations .................................................. 3,200 30,891 21,007 2,586 200 199
Old corporations .................................................... 16,196 336,126 263,603 15,431 2,633 3,868
Netherlands .............................................................. 8,105 138,461 90,399 16,369 2,002 3,011
-New-corporations .................................................. .. .. 563 3,330 1,591 514 58 207
Old corporations..! ................................................. 7,543 135,131 88,808 5,855 1,944 2,804
United Kingdom ....................................................... 12,230 173,688 97,485 12,779 4,831 6,755
New corporations.................................................. 265 12,418 7,701 505 186 566
Old corporations .................................................... 11,965 161,270 89,784 12,275 4,644 6,189
Manufacturing:Domestic corporations not foreign controlled....... 62,754 2,711,125 1,794,467 95,572 75,622 154,394
New corporations..................................................... 758 77,139 53,546 2,164 1,501 3,637
Old corporations....................................................... 61,996 2,633,986 1,740,921 93,407 74,121 150,757
Foreign-controlled domestic corporations'............ 8,355 506,843 341,258 19,450 9,280 12,753
New corporations................................ : .................... 382 25,394 16,247 935 460 322
Old corporations....................................................... 7,973 481,449 325,011 18,514 8,820 12,431
Selected countries:Canada ..................................................................... 543 48,417 34,840 1,398 694 1,000
New corporations.................................................. 225 4,422 1,500 443 155 47
Old corporations ..................................................... 318 43,995 33,340 955 539 953
France...................................................................... 420 38,450 25,801 1,321 631 538
New corporations.................................................. 5 1,129 855 38 14 74
Old corporations .................................................... 415 37,321 24,946 1,284 617 464
Germany .................................................................. 611 55,480 37,582 1,347 933 1,634
New corporations.................................................. 2 1,253 891 12 38 13
Old corporations .................................................... 609 54,227 36,691 1,335 895 1,622
Japan....................................................................... 544 70,717 57,454 1,330 .840 2,023
New corporations.................................................. 59 3,544 2,908 101 35 110
Old corporations .................................................... 484 67,173 54,546 1,229 805 1,913
Netherlands .............................................................. 1,539 74,700 54,458 2,401 1,038 1,534
New corporations.................................................. 2 727 514 13 12 26
Old corporations .................................................... 1,537 73,974 53,944 2,388 1,026 1,508
United Kingdom ........................................................ 2,832 101,855 58,937 7,423 3,304 2,588
New oorporations..................................***** .... *
75 6,264 3,722 198 83 99
Old corporations .................................................... 2,757 95,590 55,215 7,225 3,221 1 2,489
-Fo-otnotes at end-of table.
100
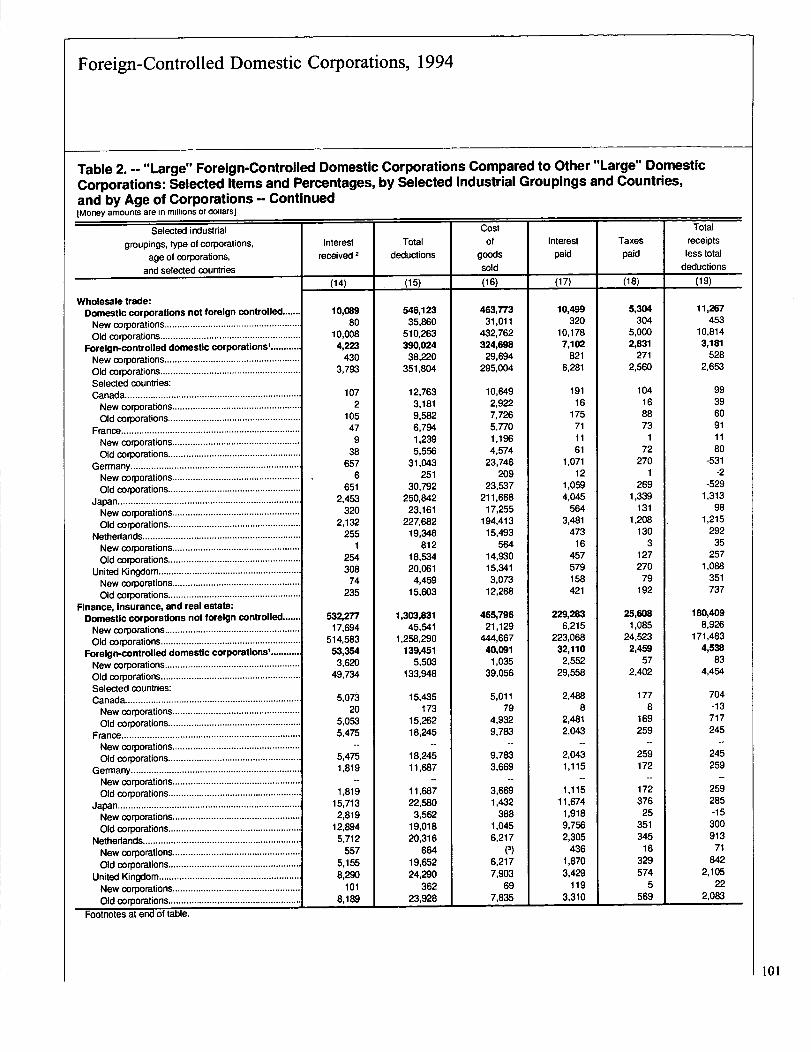
Foreign-Controlled Domestic Cotporations, 1994
Table 2. -- "Large" Foreign-Controlled Domestic Corporations Compared to Other "Large" DomesticCorporations: Selected Items and Percentages, by Selected Industrial Groupings and Countries,and by Age of Corporations -- Continuedimoney amounts are in miiiions ot conarsi
Selected industrial
groupings, type of corporations,age of corporations,
and selected countries
Interestreceived 2
Totaldeductions
Costof
goodssold
Interest
paid
Taxespaid
Totalreceiptsless total
deductions
(14) (15) (16) (17) (18) (19)
Wholesale trade:Domestic corporations not foreign controlled....... 10,089 546,123 463,773 10,499 5,304 11,267
New corporations ..................................................... 80 35,860 31,011 320 304 453
Old corporations....................................................... 10,008 510,263 432,762 10,178 5,000 10,814
Foreign-controlled domestic corporations' ............ 4,223 390,024 324,698 7,102 2,831 3,181
New corporations ..................................................... 430 38,220 29,694 821 271 528
Old corporations....................................................... 3,793 351,804 295,004 6,281 2,560 2,653
Selected countries:Canada .................................................................... 107 12,763 10,649 191 104 99
New corporations.............................. *-*-----
2 3,181 2,922 16 16 39
Old corporations.................................................... 105 9,582 7,726 175 88 60
France ...................................................................... 47 6,794 5,770 71 73 91
New corporations.................................................. 9 1,239 1,196 11 1 11
Old corporations.................................................... 38 5,556 4,574 61 72 80
Germany .................................................................. 657 31,043 23,746 1,071 270 -531
New corporations.................................................. 6 251 209 12 1 -2
Old corporations.................................................... 651 30,792 23,537 1,059 269 -529
Japan....................................................................... 2,453 250,842 211,668 4,045 1,339 1,313
New corporations.................................................. 320 23,161 17,255 564 131 98
Old corporations.................................................... 2,132 227,682 194,413 3,481 1,208 1,215
Netherlands.............................................................. 255 19,346 15,493 473 130 292
New corporations.................................................. 1 812 564 16 3 35
Old corporations.................................................... 254 18"4 14,930 457 127 257
United Kingdom....................................................... 308 20,061 15,341 579 270 1,088
New corporations.................................................. 74 4,459 3,073 158 79 351
Old corporations.................................................... 235 15,603 12,268 421 192 737
Finance, Insurance, and real estate:Domestic corporations not foreign controlled....... 53Z277 19303,831 465,796 229,283 25,608 180,409
New corporations ..................................................... 17,694 45,541 21,129 6,215 1,085 8,926
Old corporations ....................................................... 514,583 1,258,290 444,667 223,068 24,523 171,483
Foreign-controlled domestic corporations' ............ 53,354 139,451 40,091 32,110 2,459 4,538
New corporations ..................................................... 3,620 5,503 1,035 2,552 57 83
Old corporations ....................................................... 49,734 1 33,948 39,056 29,558 2,402 4,454
Selected countries:Canada.................................................................... 5,073 15,435 5,011 2,488 177 704
New corporations................................ --*..... **"**
20 173 79 8 8 -13
Old corporations.................................................... 5,053 15,262 4,932 2,481 169 717
France ...................................................................... 5,475 18,245 9,783 2,043 259 245
New corporations..................................................Old corporations....................................................
-
5,475
--18,245
-
9,783
--2,043
-
259
--
245
Germany .................................................................. 1,819 11,687 3,669 1,115 172 259
New corporations.................................................. -- - -- -- -- --
Old corporations.................................................... 1,819 11,687 3,669 1,115 172 259
Japan....................................................................... 15,713 22,580 1,432 11,674 376 285
New corporations .................................................. 2,819 3,562 388 1,918 25 -15
Old corporations.................................................... 12,894 19,018 1,045 9,756 351 300
Netherlands.............................................................. 5,712 20,316 6,217 2,305 345 913
New corporations .................................................. 557 664 (3) 436 16 71
Old corporations.................................................... 5,155 19,652 6,217 1,870 329 842
United Kingdom........................................................ 8,290 24,290 7,903 3,429 574 2,105
New corporations .................................................. 101 362 69 119 5 22
Old corporations.................................................... 8,189 1 23,928 1 7,835 3,310 1 569 2,083
-Fo-otnotes at end of table.
101

Foreign-Controlled Domestic Cofporations, 1994 -
Table 2. -- "Large" Foreign-Controlled Domestic Corporations Compared to Other "Large" DomesticCorporations: Selected Items and Percentages, by Selected Industrial Groupings and Countries,and by Age of Corporations -- Continuedtmoney amounts are in millions of aollars]
Selected industrial Net Statutory special deductions Income
groupings, toe of corporations, income Net Net subject
age of corporations, (less income Deficit Total operating loss to
and selected countries deficit) . deduction tax
(20) (21) (22) (23) (24) (25)
All Industries':Domestic corporations not foreign controlled ....... 451,985 494,959 4Z975, 101,718 2Z142 396,018New corporations ... : ................................................. 16,216 19,457 3,241 7,145 1,329 12,442
Old corporations ....................................................... 435,769 475,502 39,733 94,573 20,813 383,576
Foreign-controlled domesticcorporations' ............ 25,425 38,171 12,747, 8,513 7,306'
29,960
New corporations ...........................7 ..... **... ***"*"*** ...
1,051 1,95~ 904 375 300 1,594Old corporations ....................................................... 24,374 36,217 11,843 8,138 7,007 28,367Selected countries:Canada...-.-..--
. ........... ....... .........
---2,276 3;1 34 -- 858 -- 859- 580 -2,309 - -
New corporabons.................................................. 62 113 51 16 12 101Old corporations .................................................... 2,214 3,021 808 843 568 2,208
France...................................................................... 997 2,119 1,123 707 660 1,415
New corporations.................................................. 44 125 82 4 3 122
Old corporations .................................................... 953 1,994 1,041 703 657 1,293
Germany.................................................................. 1,716 2,984 1,268 750 620
New corporations.................................................. - --I 1 -39-- - 29 _(3) (3) 39
Old corporations .................................................... 1,705 2,945 1,239 749 620 2,240
Japan .................*............................... : ...................... 4,250 6,809 2,559 1,843 1,752 4,986
New corporations .................................................. 203 396 194 103 100 293
Old corporations .................. 7-'-**- .................... 4,047 6,413 2,366 1,740 1,652 4,693
Netherlands............................................................... 2,965 3,897 932 870 656 3,118
New corporations .................................................. 212 217 6 50 46 167
.......... ;............ ................Old corporations 2,753--- --3,679- 926--- 820- 610--- ---2,952
United Kingdom...'** .... ---** ..... --
: ....................... 6,795 8,966 2,171 1,604 1,311 7,401
New corporations .................................................. 604 679 76 102 76 578
Old corporations .................................................... 6,192 8,287 2,095 1,503 1,235 6,824
Manufacturing:Domestic corporations not foreign co
.ntrolled....... 177,896 190,527 IZ631 13,107 6,361 177,128
New corporations...... : ..............................*****'** ......
3,731 4,709 978 351 259 4,362
Old corporations...................................................... 174,165 185,818 11,653 12,756 6,102 173,366
Foreign-controlled domestic corporations' ........... 13,835 19,475 5,640 4,218 3,510 15,331
New corporations..: .................................................. 347 774 427 116 91 . 662
Old corporations....................................................... 13,488 18,701 5,213 4,102 3,419 14,669
Selected countries:Canada .................................................................... 1,010 1,346 336 598 347 778
New corporations .................................................. 47 70 23 8 5 66
Old corporations .................................................... 963 1,275 312 590 342 712
France ...................................................................... 678 1,540 863 500 475 1,041
New corporations.................................................. 74 115 40 4 3. Ill
Old corporations .................................................... 604 1,426 822 496 472 930
Germany .............. :................................................... 1,700 1,907 206 482 396 1,426
New corporations.................................................. 13 39 26 (3) (3) 39
Old corporations .................................................... 1,688, 1,867 180 481 395 1,388
Japan ........................................................................ 2,062 2,708 646 949 921 1,760
New corporations.................................................. 115 143 28 20 20 123
Old corporations.................................................... 1,947 2,565 618 930 901 1,637
Netherlands.............................................................. 1,562 1,780 218 409 305 1,374
New corporations.................................................. 26 32 6 21 ~21 11
Old corporations .................................................... 1,536 1,748 212 389 284 1,362
United Kingdom ....................................................... 2,724 4,411 1,688 555 391 3,891
New corporations.................................................. 99 150 51 31 12 120
Old corporations .............................................. 2,624 4,261 1,637 524 379 3,771
Footnotes at end of table.
102
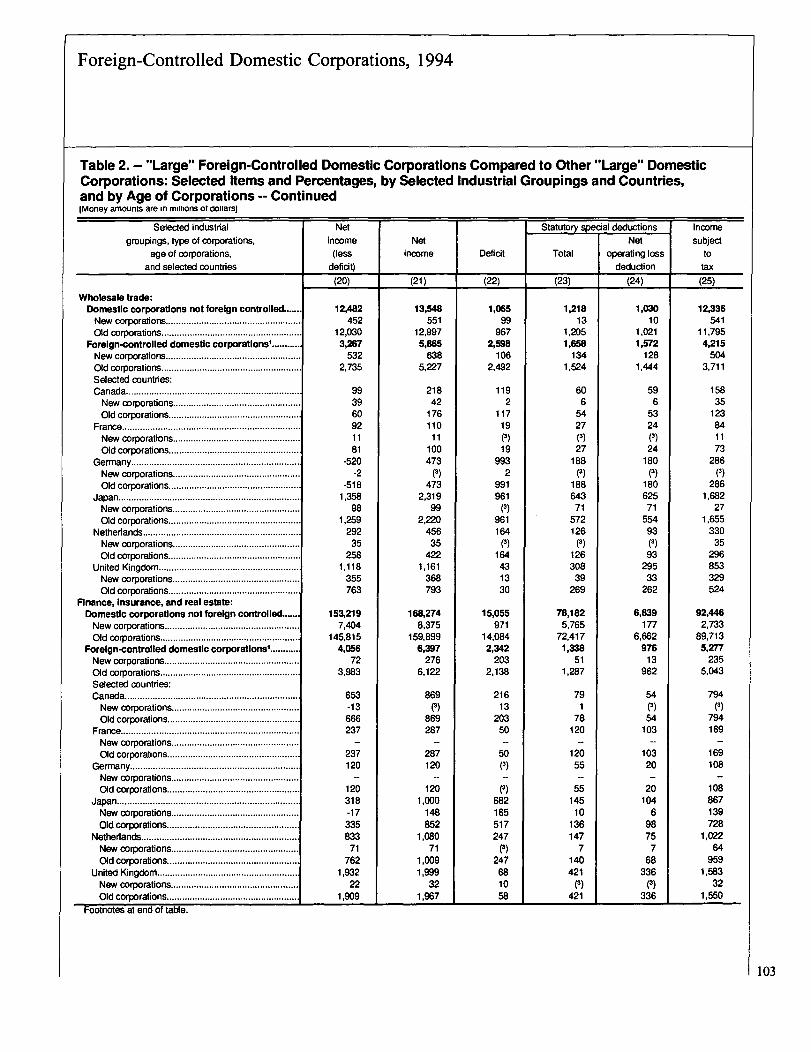
Foreign-Controlled Domestic Corporations, 1994
Table 2. - "Large" Foreign-Controlled Domestic Corporations Compared to Other "Large" DomesticCorporations: Selected Items and Percentages, by Selected Industrial Groupings and Countries,and by Age of Corporations -- ContinuedImoney amounts are in miiijons or ooiiarsi
Selected industrial Net Statutory special deductions Incomegroupings, type of corporations, income Net Net subject
age of corporations, (less income Deficit Total operating loss toand selected countries deficit) deduction tax
(20) (21) (22) (23) (24) (25)
Wholesale trade:Domestic corporations not foreign controlled....... 12,482 13,50 1,065 1,218 1,030 12w336New corporations ..................................................... 452 551 99 13 10 541Old corporations....................................................... 12,030 12,997 967 1,205 1,021 11,795
Foreign-controlled domestic corporations'............ 3,267 5,865 2,598 1,658 1,572 4,215New corporations ..................................................... 532 638 106 134 128 504(Did corporations ....................................................... 2,735 5,227 2,492 1,524 1,444 3,711Selected countries:Canada .................................................................... 99 218 119 60 59 158New corporations.................................................. 39 42 2 6 6 35Old corporations .................................................... 60 176 117 54 53 123
France ...................................................................... 92 110 19 27 24 84New corporations.................................................. 11 11 (3)
(3) (1) 11
Old corporations .................................................... 81 100 19 27 24 73
Germany .................................................................. -520 473 993 188 180 286
New corporations .................................................. -2 M 2 (3)(3) (3)
Old corporations.................................................... -518 473 991 188 180 286
Japan ....................................................................... 1,358 2,319 961 643 625 1,682New corporations .................................................. 98 99 (3) 71 71 27
Old corporations.................................................... 1,259 2,220 961 572 554 1,655Netherlands .............................................................. 292 456 164 126 93 330
New corporations .................................................. 35 35 (3) (3) (3) 35
Old corporations.................................................... 258 422 164 126 93 296
United Kingdom....................................................... 1,118 1,161 43 308 295 853New corporations .................................................. 355 368 13 39 33 329
Old corporations.................................................... 763 793 30 269 262 524
Finance, Insurance, and real estate:Domestic corporations not foreign controlled....... 153,219 168,274 15,055 78,182 6,839 92,446New corporations ..................................................... 7,404 8,375 971 5,765 177 2,733Old corporations....................................................... 145,815 159,899 14,084 72,417 6,662 89,713
Foreign-controlled domestic corporations' ............ 4,056 6,397 2,342 1,338 976 5,277New corporations ..................................................... 72 276 203 51 13 235
Old corporations....................................................... 3,983 6,122 2,138 1,287 962 5,043Selected countries:Canada ..................................................................... 653 869 216 79 54 794
New corporations.................................................. -13 (3) 13 1 (3)(1)
Old corporations .................................................... 666 869 203 78 54 794
France ...................................................................... 237 287 50 120 103 169.New corporations .................................................. - -- -- - - --
Old corporations .................................................... 237 287 50 120 103 169
Germany .................................................................. 120 120 (3) 55 20 108
New corporations .................................................. - - -
Old corporations .................................................... 120 120 (3) 55 20 108Japan ....................................................................... 318 1,000 682 145 104 867
New corporations .................................................. -17 148 165 10 6 139
Old corporations.................................................... 335 852 517 136 98 728
Netherlands............................................................. 833 1,080 247 147 75 1,022New corporations .................................................. 71 71 P) 7 7 64Old corporations.................................................... 762 1,009 247 140 68 959
United Kingdom ....................................................... 1,932 1,999 68 421 336 1,583New corporations.................................................. 22 32 10 (3) (3) 32
Old corporations.................................................... 19909 1 1,967 1 58 421 336 19550
Footnotes at end of table.
103

Foreign-Controlled Domestic Corporations, .1994
Table 2. -- "Large" Forei§n-Ibblinlrolled Do.m6stic-Corporations Compared,to Other "Large" Domestic
Corporations': Seleicted-Itetris and Percentages, by Selected Industrial Groupings and Countries,and by Age of Corporations - Continued,imoney amounts are in minions or oollarsi
Selected industrial Income tax before credits Credits Total
groupings, type of corporations, Alternative Foreign income
age of corporations, Total Regular tax minimum Total tax tax after
and selected countries tax credit credits
(26) (27) (28) (29) (30) (31)
All Industries':Domestic corporations not foreign controlled........ 140,623 136,961 3,139 33,305 23,211 107,319
New corporations ......................... ......4,679 4,338 322 830 337 3,849
Old corporations ........................................... I ............. 135,944 1132,611~ 2,816 32,475 22,875 103,469
Foreign-controlled domestic corporations'............. 11,334 10,451 757 2,641 1,766 8,694
New corporations ....................................................... 631 5515 71 99 74 532
Old corporations ........................................................ 10,703 9,896 686 2,542 1,693 8,162
Selected countries:--Canada. 860- 804- - 52- -81- ----14- -778--
New corporations ....................... : ................... ....... 37 35 1 (3) (3) 36
Old corporations........................ ........................ 823 769 51, 81 14 742
France................................................. 558 492 63 156 123 403
New corporations .................................................... 43 42 (3) 1 1 42
Old corporations ..................................................... 516 450 63 155 122 361
Germany.................................................................... 889 794 92 104 40 785
New corporations .................................................... - _114- - 13- (3) (1) . 14
Old corporations ..................................................... 875 781 92 104 40 771
Japan .......................................................................... 1,958 1,737 210 343 223 1,616
New corporations .................................................... 158 102 54 14 13 145
Old corporations .................................. : .................. 1,poo 1,635 157 329 210 1,471
Netherlands............................................................... 1,292 1,088 125, 183 125 .1,109
New corporations .....................: .............................. 62 58 4 5 57
Old corporations ....... ...... .......... -----1-,230- - _11,00- ---122- ___178 _1211- _1,052--_
United Kingdom......................................................... 2,702 2,587 101 353 219 2,349
New corporations .................................................... 214 202 11 49 45 165
Old corporations .............................................. **** ....2,488 2,385 90 .304 174 2,184
acturing:Mi8nuif,Domestic corporations not foreign controlled ........ 63,421 62,125 1,030 23,046 16,678 40,375
......N!ew corpo~ations............................. : ................ 1,561 1,522 34 349 .99 1,212
.Old corporations ................................: ......
61,860 60,603 996 22,697 16,578 39,164
Foreign-controlled domestic corporations' ............. 5,796 5,350 346 .1,491 986 4,305
New corporations. .............................................. ....... 246 231 14 37 17 209
Old corporations .................... ........................... : ........ 5,549 5,119 332 1,453 968 4,096
Selected countries:Canada.................................
:.................................... 310 270 39 52 8 258
New corporations................................................... 23 23 (3) (3) (3) 23
ions ...................... 7..................... I ........Old corporal 287 247 38 52 8 .235
'France ........... 396 663 31 116 90 280
New corporations .......................................... ......... 39 -39 (3) 39
Old corporations ........................ : ............................ 357 324 31 116 90 .241
Germany.................................................................... 545 497 46 61 24 484
New corporations ....................: ....... *** ... *"***... **"*'**'
'14 13 (3)(3) (3) 14
Old corporations ..................................................... 531 484 46 61 24 470
Japan ......................................................................... 671 613 54 72 17 599
New corporations ..........................................* ... *****'
44 43 (3) 4 4 39
Old corporations ..................................................... 627 570 54 68 13 559
Netherlands.........
631 479 76 104 63 527
New corporations.................................................... 7 4 3 - 7
Old corporations ............................................ ........ 624 476 72 104 63, 520
United Kingdom ......................................................... 1,397 1,360 29 191 87.' 1,206
ions....................................................New corporal
1
51 42 9 4 3 . 47
'Old corporations ...... ; ........ ...................... ****........ *** 1 1,346 1,318 _1 21 187 85 1,159
-Fo-otnotes at end of table.
104-

Foreign-Controlled Domestic Corporations, 1994
Table 2. -- "Large" Foreign-Controlled Domestic Corporations Compared to Other "Large" DomesticCorporations: Selected Items and Percentages, by Selected Industrial Groupings and Countries,and by Age of Corporations -- Continued[money amounts are in mimons ot cioiiarsi
Selected industrial Income tax before credits Credits Totalgroupings, type of corporations, Alternative Foreign income
age of corporations, Total Regular tax minimum Total tax tax after
and selected countries tax credit credits
(26) (27) (28) (29) (30) (31)
Wholesale trade:Domestic corporations not foreign controlled ........ 4,343 4,292 37 878 750 3,465New corporations ...................................................... 191 188 2 13 10 178Old corporations ........................................................ 4,152 4,104 35 865 740 3,287
Foreign-controlled domestic corporations' ............. 1,682 1,464 209 176 48 1,506New corporations ....................................................... 231 175 54 14 12 216Old corporations ........................................................ 1,452 1,289 155 162 37 1,289
Selected countries:Canada ...................................................................... 59 54 3 (3) (3) 58New corporations ................................................... 13 12 1 -- -- 13Old corporations ..................................................... 45 42 3 (3)
(3) 45France ....................................................................... 31 29 3 2 2 30New corporations .................................................... 4 4 -- 1 1 3Old corporations ..................................................... 28 25 3 1 1 27
Germany.................................................................... 129 99 29 8 (3) 121New corporations ................................................... (3) (3)
(3)(3) (3) (3)
Old corporations..................................................... 129 99 29 8 (3) 121Japan ......................................................................... 709 585 121 59 4 650New corporations .................................................... 63 9 53 (3) (3) 63
Old corporations..................................................... 646 576 67 59 4 587
Netherlands ............................................................... 146 115 30 11 (3) 135
New corporations................................................... 12 12 - (3) (3) 12Old corporations ..................................................... 134 103 30 11 (3) 123
United Kingdom ......................................................... 310 298 10 45 41 265
New corporations.................................................... 116 115 (3) 13 11 102
Old corporations ..................................................... 194 183 10 31 30 163Finance, insurance, and real estate:
Domestic corporations not foreign controlled ........ 31,464 30,909 522 4,607 3,484 26,856
New corporations....................................................... 980 951 24 32 7 948
Old corporations ........................................................ 30,484 29,958 498 4,576 3,477 25,908Foreign-controlled domestic corporations' ............. 1,940 1,843 87 171 114 1,769New corporations....................................................... 84 82 (3) 10 9 75
Old corporations ........................................................ 1,856 1,761 87 162 105 1,694
Selected countries:Canada...................................................................... 280 278 1 14 1 266New corporations .................................................... (3)
(1)(3) - -- (3)
Old corporations..................................................... 280 278 1 14 1 266
France ....................................................................... 86 59 27 37 31 49
New corporations .................................................... -- -- -- -- -- --
Old corporations..................................................... 86 59 27 37 31 49Germany .................................................................... 48 37 11 8 8 40New corporations ................................................... -- - -- - -- --
Old corporations..................................................... 48 37 11 8 8 40
Japan......................................................................... 319 303 13 55 47 264
New corporations .................................................... 50 48 (1) 10 9 41Old corporations..................................................... 268 254 13 46 38 223
Netherlands ...........................................***-*-*****--
362 357 3 5 2 357New corporations .................................................... 22 22 - -- -- 22Old corporations..................................................... 340 335 3 5 2 334
United Kingdom ......................................................... 582 554 26 11 10 570New corporations.................................................... I 1 11 -- -- -- 11Old corporations ..................................................... 570 542 26 11 10 559
Footnotes at end of table.
105

Foreign-Controlled Domestic Corporations, 1994..
Table 2. - "Large" Foreign-Controlled Domestic Corporations Compared to Other "Large" DomesticCorporations: Selected Items and Percentages, by Selected Industrial Groupings and Countries,and by Age of Corporations - Continuedimoney amounts are in millions of dollars]
Percentaaes
groupings, type of corporations, Number of returns Number of returns with Current . Noncurrent
I
Net Total liabilities
age of corporations, with net inc;me total income tax after credits lia fli i liabilitic worth- divided by
and selected countries Divided by total number of returns Divided by total assets net worth
(32) (33) (34) (35) (36) (37)
All Industries':Domestic corporations not foreign controlled 80.51 70.58 39.96 29.25 30.79 224.79
New corporations ................................................... 71.43 51.65 30.77 27.18 42.05 137.81
Old corporations ..................................................... 81.38 72.35 40.34 29.34 30.32 229.81
Foreign-controlled domestic corporations' .......... 70.06 71.82 47.65- 30.53 21.82 358.40
New corporations ................................................... 66.18 67.15 58.58 28.01 13.41 645.62
Old corporations ...................................................... 70.45 72.25 46.93 30.70 22.37 347.03
Selected countries:Canada....... 71.21 71.98- - 29.43- 48.70- -21-.87-- -357,15
New corporations ................................................ 56.00 56.00 26.41 54.45 19.14 422.39
Old corporations ..................................................1 73.16 74.03 29.57 48.43 22.00 354.45
France .................................................................... 68.03 73.47 40.33 44.44 15.23 556.39
New corporations ................................................ 50.00 50.00 19.13. 85.85 -4.99 -2,105.58
Old corporations .................................................. 68.79 74.47 40.84 43.43 15.72 535.96
Germany...................................................... 80.40 84.92 44.94 28.79 26.27 280.66
New corporations .......... .... .... ....................... 66.67- 66.67- 79.45 -3.39- 17.27 - 479.75
Old corporations .................................................. 80.53 85.26 44.71 28.96 26.33 279.80
Japan ...................................................................... 68.48 70.44 67.22 16.88 15.90 529.04
New corporations ....... ...: ..................................... 73.47 73.47 75.25 18.06 6.69 1,394.93
Old corporations .................................................. 68.08 70.36 65.97 16.70 17.33 477.16
Netherlands ..... ; ...................................................... 67.45 69.34 33.90 31.41 34.69 188.23
Newcorporations ................................................ 64.52 20.23 15.25 555.69
-Old corporations ....................... .... ............... ...... .............. . --- - 32.40- ____31.95 35.64.- _180.56-
United Kingdom ...................................................... 72.76 74.42 39.80 39.05 21.15 372.76
Newcorporations ................... ;............................ 66.67 70.83 25.64 48.91 25.45 292.86
Old corporations .................................................. 73.29 74.73 40.42 38.61 20.96 377.06
Manufacturing:Domestic corporations not foreign controlled 81.02 82.88 30.42 34.86 34.72 18&00
New corporations................................................... 65.84 65.43 22.04 38.46 39.50 153.18
Old corporations.............................................* ..... **
82.17 84.20 30.63 34.77 34.60 188.99
F6reign-controlled domestic corporations' .......... 72.86 75.68 30.06 35.38 34.56 189.31
New corporations................................................... 62.50 65.63 37.97 35.08 26.94 271.13
Old corporations..................................................... 73.65 76.46 29.69 35.39 34.92 186.37
Selected countries:Canada ................................................................... 78.70 79.63 29.96 32.97 37.06 .169.80
New corporations ................................................ 60.00 70.00 20.15 58.41 21.42 366.69
Old corporations .................................................. 80.61 80.61 31.10 30.02 38.88 157.22
France ................... ................................................ 65.22 71.01 28.56 37.77 33.67 197.00
New corporations ................................................ 21.13 52.65 26.22 281.46
Old corporations .................................................. 28.78 37.33 33.89 195.06
Germany ................................................................. 82.57 88.07 30.81 28.29 40.91 144.44
New corporations ................................................ 81.63 2.12 16.37 511.51
Old corporations .................................................. 30.04 28.68 41.28 142.26
Japan...................................................................... 70.12 73.44 39.13 26.89 33.98 194.29
New corporations ................................................ 46.15 46.15 50.61 17.08 32.31 209.48
Old corporations .................................................. 71.18 74.67 38.33 27.57 34.10 193.29
Netherlands............................................................ 70.31 71.88 24.95 21.27 53.78 85.95
Newcorporations; ................................................ 18.85 48.75 32.40 208.64
Old corporations .................................................. 24.98 21.13 53.89 85.57
United Kingdom ...................................................... 75.00 78.68 26.20 55.09 18.71 434.45
New corporations ................................................ 28.85 33.07 38.07 162.66
Old corporations .................................................. 26.07 56.23 17.71 , 464.67
Ro-otnotes at end of table.
106

Foreign-Controlled Domestic Corporations, 1994
Table 2. -- "Large" Foreign-Controlled Domestic Corporations Compared to Other "Large" DomesticCorporations: Selected Items and Percentages, by Selected Industrial Groupings and Countries,and by Age of Corporations -- ContinuedtMoney amounts are in miiiions ot cioiiarsl
Selected industrialgroupings, type of corporations, Number of returns I Number of returns with Current Noncurrent
I
Net
I
Total liabilitiesage of corporations, with net income I total income tax after credits liabiliti liabilities worth divided by
and selected countries Divided by total number of returns Divided by total assets net worth
(32) (33) (34) (35) (36) (37)
Wholesale trade:Domestic corporations not foreign controlled ..... 83.40 83.23 55.61 21.17 23.22 330.67New corporations................................................... 65.38 69.23 35.97 29.68 34.36 191.07Old corporations..................................................... 84.26 83.89 56.43 20.81 22.76 339.43
Foreign-controlled domestic corporations' .......... 75.08 75.53 57.87 24.33 17.80 461.91
New corporations................................................... 78.79 78.79 35.30 52.39 12.31 712.00
Old corporations .................................................... 74.71 75.04 61.22 20.18 18.61 437.41Selected countries:Canada................................................................... 72.34 72.34 36.50 37.65 25.85 286.83
New corporations ................................................ 34.35 49.16 16.49 506.48
Old corporations .................................................. 36.78 36.16 27.06 269.56
France.................................................................... 71.43 85.71 41.66 22.42 35.92 178.37New corporations ................................................ 68.97 2.82 28.21 254.44
Old corporations.................................................. 35.51 26.81 37.65 165.52Germany................................................................ 76-92 78.85 58.85 26.23 14.93 570.00New corporations ................................................ 60.00 14.74 25.26 295.83
Old corporations.................................................. 58.84 26.28 14.87 572.27
Japan...................................................................... 75.98 76.77 63.41 19.72 16.87 492.76New corporations ................................................ 35.40 55.87 8.74 1,044.64
Old corporations.................................................. 67.49 14.45 18.06 453.79Netherlands........................................................... 63.64 65.91 45.87 43.26 10.86 820.56
New corporations ................................................ 100.00 100.00 26.46 51.56 21.98 354.94
Old corporations.................................................. 55.56 58.33 46.97 42.79 10.24 877.02
United Kingdom...................................................... 77.14 71.43 27.30 52.57 20.13 396.75New corporations ................................................ 17.81 6530
'16.87 492.64
Old corporations.................................................. 33.54 44.18 22.28 348.91
Finance, Insurance, and real estate-Domestic corporations not foreign controlled..... 82.97 4EL28 46.75 24.55 28.61 249.16
New corporations ................................................... 82.91 35.82 39.39 13.63 46.98 112.86Old corporations ..................................................... 83.00 50.05 47.03 25.07 27.89 258.50
Foreign-controlled domestic corporations' .......... 64-72 64.72 61.65 27.35 11.01 808.44
New corporations ................................................... 56-67 56.67 84.46 7.70 7.84 1,175.19
Old corporations .................................................... 65-42 65.42 60.15 28.63 11.21 791.67Selected countries:Canada................................................................... 63.16 63.16 29.65 61.22 9.13 994.94
New corporations ................................................ 60.79 32.05 7.15 1,298.15
Old corporations.................................................. 29.40 61.45 9.15 992.90
France.................................................................... 71.43 67.86 45.33 46.59 8.07 1,138.57New corporations ................................................ - -- - -- - -
Old corporations.................................................. 71-43 67.86 45.33 46.59 8.07 1,138.57
Germany................................................................. 58.66 26.18 15.15 559-91New corporations ................................................ - -- - -
Old corporations .................................................. 58.66 26.18 15.15 559.91Japan..................................................................... 53.61 55.67 80.07 11.79 8.14 1,128.36New corporations ................................................ 54-55 54.55 91.88 4.17 3.95 2,428.44
Old corporations................................................. 53.49 55.81 77.57 13.40 9.02 1,008.07Netherlands............................................................ 71.88 71.88 45.21 38.67 16.12 520.37New corporations ................................................ 100.00 100.00 83.46 9.10 7.44 1,244.02
Old corporations.................................................. 68.97 68.97 41.84 41.27 16.88 492.26
United Kingdom...................................................... 81.82 80.00 57.07 27.73 15.20 557.92
New corporations ................................................ 38.36 53.31 8.26 1,109.52
Old oorporafions;................................................... 57.25 , 27.48 , 15.26 555.11
Foatnotes at end of table.
Perc tages
107
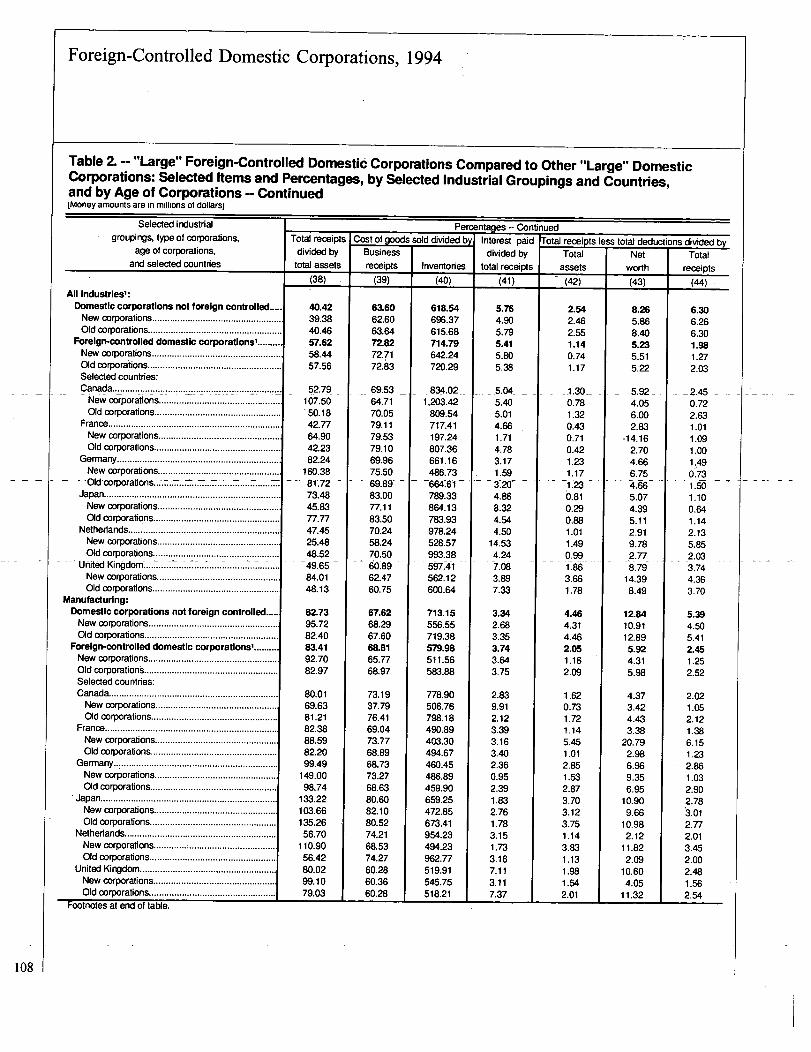
Foreign-Controlled Domestic Corporations, 1994
Table 2. -- "Large" Foreign-Controlled Domestic Corporations Compared to Other "Large" DomesticCorporations: Selected Items and Percentages, by Selected Industrial Groupings and Countries,and by Age of Corporations -- Continued[money amounts are in millions ot dollarsl
Selected industrialgroupirigs, type of corporations,
age of corporations,and selected countries
All Industries':Domestic corporations not foreign controlledNew corporations...................................................Old corporations.....................................................
Foreign-controlled domestic corporations'.........New corporations ...................................................Old corporations .....................................................Selected countries:Canada. . ....... . .. . ..................................................New corporations................................................Old corporations ..................................................
France....................................................................New corporations................................................Old corporations ..................................................
Germany .................................................................New corporations ................................................-Old corporations..... .......................................-..
Japan......................................................................New corporations................................................Old corporations ..................................................
Netheriands............................................................New corporations................................................Old corporations ..................................................
United Kingdom_._..........New corporations .................................................
Old corporations..................................................Manufacturing:Domestic corporations not foreign controlledNew corporations ...................................................Old corporations.....................................................
Foreign-controlled domestic corporations' ..........New corporations...................................................Old corporations.....................................................Selected countries:Canada ...................................................................New corporations ................................................Old corporations ..................................................
France ....................................................................New corporations................................................Old corporations ............................... ..................
Germany., ..............................................................New corporations................................................Old corporations ..................................................
Japan.....................................................................New corporations ................................................Old corporations..................................................
Netherlands ............................................................New corporations............. 4 ...................................Old corporations..................................................
United Kingdom ......................................................New corporations.................................................Old corporations .................................................. 1
Footnotes at end of tabig'
Total receiptsdivided by
total assets(38)
40.4239.3840.4657.6258.4457.56
52.79107.5050.1842.7764.9042.2382.24
160.3881.7273.4845.8377.7747.4525.4848.5249.6584.0148.13
82.7395.7282.4083.4192.7082.97
80.0169.6381.2182.3888.5982.2099.49
149.0098.74
133.22103.66135.26
56.70110.90
56.4280.0299.1079.03
Cost of goods sold divided byBusinessreceipts
(39)
6&6062.6063-6472.8272.7172.63
Inventories(40)
618.54696.37615.68714.79642.24720.29
69.5364.7170.0579.1179.5379.1069.9675.5069.89-83.0077.1183.5070.2458.2470.5060.8962.4760.75
67.6268.2967.6068.8165.7768.97
73.1937.7976.4169.0473.7768.8968.7373.2768.6380.6082.1080.5274.2168.5374.2760.2860.3660.28
834.021,203.42
809.54717.41197.24807.36661.16486.73
-664-.61789.33864.13783.93978.24528.57993.38597.41562.12600.64
713.15556.55719.38579.98511.56583.88
778.90506.76798.18490.89403.30494.67460.45486.89459.90659.25472M673.41954.23494.23962.77519.91545.75518.21
Percentages - ConfinuedInterest paid
divided bytotal receipts
(41)
5.764.905.795.415.805.38
Total receipts le total deductiTotal
assets(42)
2.542.462.551.140.741.17
5.045.405.014.661.714.783.171.593.204.868.324.544.50
14.534.247.083.897.33
3.342.683.353.743.643.75
2.839.912.123.393.163.402.360.952.391.832.761.783.151.733.167.113.117.37
-1.30-0.781.320.430.710.421.231.171.230.810.290.881.011.490.991.863.661.78
4.464.314.462.051.162.09
1.620.731.721.145.451.012.851.532.873.703.123.751.143.831.131.981.542.01
Networth(43)
8.265.868.405.235.515.22
5.92--4.056.002.83
-14.162.704.666.754.665.074.395.112.919.782.778.79
14.398.49
12.8410.9112.89
5.924.315.98
4.373.424.433.38
20.792.986.969.356.95
10.909.66
10.982.12
11.822.09
10.604.05
11.32
ons divided bTotal
receipts(44)
6.306.266.301.981.272.03
-2.450.722.631.011.091.001.490.731.501.100.641.142.135.852.033.744.363.70
5.394.505.412.451.252.52
2.021.052.121.386.151.232.861.032.902.78'3.012.772.013.452.002.481.562.54
108
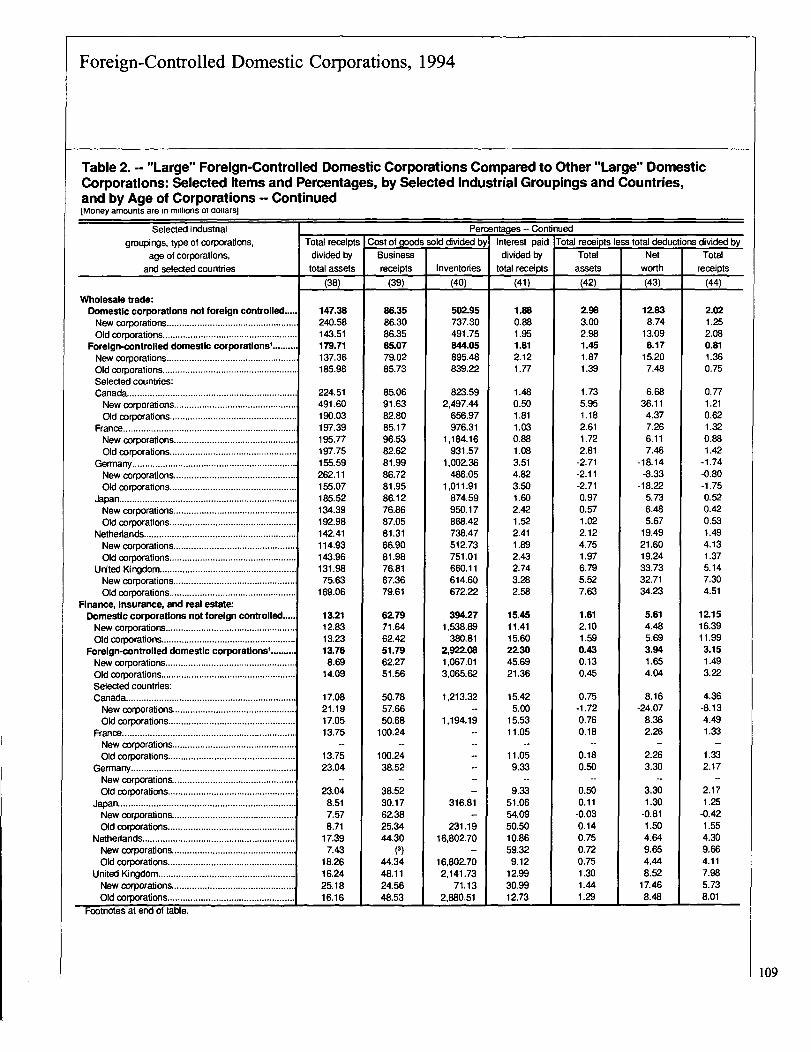
Foreign-Controlled Domestic Corporations, 1994
Table 2. -- "Large" Foreign-Controlled Domestic Corporations Compared to Other "Large" DomesticCorporations: Selected Items and Percentages, by Selected Industrial Groupings and Countries,and by Age of Corporations -- Continuedtivioney amounts are in mii1ions or aoiiars]
Selected industrial
groupings, type of corporations,age of corporations,
and selected countries
Wholesale trade:Domestic corporations not foreign controlledNew corporations...................................................Old corporations.....................................................
Foreign-controlled domestic corporations' ..........New corporations ...................................................Old corporations.....................................................Selected countries:Canada...................................................................New corporations .................................................Old corporations..................................................
France.....................................................................New corporations .................................................ad corporations..................................................
Germany.................................................................New corporations .................................................Old corporations..................................................
Japan ......................................................................New corporations.................................................Old corporations..................................................
Netherlands............................................................New corporations................................................Old corporations..................................................
United Kingdom......................................................New corporations................................................
Old corporations..................................................Finance, Insurance, and real estate.Domesticcorporations not foreign controlledNew corporations ...................................................Old corporations.....................................................
Foreign-controlled domestic corporations' ..........New corporations...................................................Old oorporations ....................................................Selected countries:Canada ...................................................................New corporations ................................................
Old corporations..................................................France....................................................................New corporations................................................Old corporations..................................................
Germany.................................................................New corporations................................................Old corporations..................................................
Japan ......................................................................
New corporations................................................Old corporations..................................................
Netherlands............................................................New corporations................................................Old corporations..................................................
United Kingdom ......................................................New corporations................................................Old corporations ..................................................
Footnotes at end of table.
Total receiptsdivided by
total assets
(38)
147.38240.58143.51179.71137.36185.98
224.51491.60190.03197.39195.77197.75155.59262.11155.07185.52134.39192.98142.41114.93143.96131.9875.63
169.06
112112.8313.2313.76
8.6914.09
17.0821.1917.0513.75
13.7523.04
23.048.517.578.71
17.397.43
18.2616.2425.1816.16
Cost of goods sold divided byBusiness Ireceipts
(39)
86.3586.3086.358&0779.0285.73
Inventories(40)
502.95737.30491.75844.05895.48839.22
85.0691.6382.8085.1796.5382.6281.9986.7281.9586.1276.8687.0581.3166.9081.9876.8167.3679.61
62-7971.64624251.7962.2751.56
50.7857.6650.68
100.24
100.2438.52
38.5230.1762.3825.3444.30
(3)
44.3448.1124.5648.53
823.592,497.44
656.97976.31
1,184.16931.57
1,002.36486-05
1,011.91874.59950.17868.42738.47512.73751.01660.11614.60672.22
394.271,538.89
380.812,922.081,067.013,065.62
1,213.32
1,194.19
316.81
231.1916,802.70
16,802.702,141.73
71.132,880.51
Percentages - ContinuedInterest paid
divided bytotal receipts
(41)
1.880.881.951.812.121.77
[Total receipts less total deductiTotal
assets(42)
2.983.002.981.451.871.39
1.480.501.811.030.881.083.514.823.501.602.421.522.411.892.432.743.282.58
15.4511.4115.6022.3045.6921.36
15.425.00
15.5311.05
11.059.33
9.3351.0654.0950.5010.8659.32
9.1212.9930.9912.73
1.735.951.182.611.722.81
-2.71-2.11-2.710.970.571.022.124.751.976.795.527.63
1.612.101.590.430.130.45
0.75-1.720.760.18
0.180.50
0.500.11
-0.030.140.750.720.751.301.441.29
Networth
(43)
12.838.74
13.098.17
15.207.48
6.6836.11
4.377.266.117.46
-18.14-8.33
-18.225.736.485.67
19.4921.6019.2433.7332.7134.23
5.614.485.693.941.654.04
8.16-24.07
8.362.26
2.263.30
3.301.30
-0.811.504.649.654.448.52
17.468.48
ons divided byTotal
receipts(44)
2.021.252.080.811.360.75
0.771.210.621.320.881.42
-1.74-0.80-1.750.520.420.531.494.131.375.147.304.51
12.1516.3911.99
3.151.493.22
4.36-8.134.491.33
1.332.17
2.171.25
-0.421.554.309.664.117.985.738.01
109

Foreign-Controlled Domestic Corporations, 1994
Table 2. - "Large" Foreign-Controlled Domestic Corporations Compared to Other "Large,, DomesticCorporations: Selected Items and Percentages, by Selected Industrial Groupings and Countries,and by Age of Corporations -- Continuedimoney amounts are in millions or dollars)
Selected industriaJgroupings, type of corporabons,
age of corporations,and selected countries
All Industries':Domestic corporations not foreign controlled..................New corporations................................................................Old corporations ..................................................................
Foreign-controlled domestic corporations' .......................New corporations................................................................Old corporations..................................................................Selected countries:
- - -Canada ..............................................................................New corporations .............................................................Old corporafions...............................................................
France .................................................................................New corporations ..............................................................'Old corporations ...............................................................Germany .......................................................................New corporations ........;--------- ----------Old corporations...............................................................
Japan...................................................................................New corporations .................................................... :.........Old corporations................................................................
Netherlands ..........................................................................New corporations ..............................................................Old corporafions...............................................................
United Kingdom...................................... :............................New corporations .............................................................Old corporafions ........................ ......................................
Manufacturing:Domestic corporations not foreign controlled..................New corporations ................................................................Old corporations..................................................................
Foreign--controlled domestic corporations'.......................New corporations.................................................................Old corporations..................................................................Selected countries:Canada................................................................................New corporations..............................................................Old corporations ................................................................
France.................................................................................New corporations.............................................................Old corporations...............................................................
Germany..............................................................................New corporations ..............................................................Old corporations ...............................................................
Japan ...................................................................................New corporations .............................................................Old corporations ...............................................................
Netherlands .........................................................................New corporations.............................................................Old corporafions...............................................................
United Kingdom ...................................................................New corporations ..............................................................Old corporations ...............................................................
Footnotes at end of table-.
Totalassets
(45)
2.532.272.541.180.791.21
-1-.27---0.761.300.500.940.491.181.171.180.840.300.930.991.530.971.873.911.78
5.144.425.152.221.252.27
1.640.731.741.435.451.312.961.532.983.783.263.811.163.831.152.091.542.11
Percentages -- ContinuedNet income (less deficit) divided by
Networth
(46)
8.235.418.395.425.895.40
Totalreceipts
(47)
6.275.776.292.051.352.10
5.82--3.995.903.31
-18.883.144.50
- 6.754.495.294.475.342.87
10.01-.2.72- -
8.8415.358.49
14.7911.1914.896.434.646.49
4.413.424.484.25
20.793.887.249.357.23
11.1110.1011.182.16
11.822.13
11.154.05
11.94
2;410.712.591.181.451.171.440.731.451.150.651.192.105.99
--2.00-3.774.653.70
6.214.626.252.661.352.73
2.041.052.141.746.151.602.981.033.022.833.152.822.053.452.032.611.562.68
Net operating lossdeduction dhAded by
net income
(48)
4.476.834.38
19.1415.3519.35
18,51-
10.6218.8031.152.40
32.9520.78_ (3)_
21.0525.7325.2525.7616.8321.20
----16.58
14.62
11.1914.90
3.345.503.28
18.0211.7618.28
25.787.14
26.8230.84
2.6133.10
20.77(3)
21.1634.0113.9935.1317.1365.6316.258.868.008.89
110
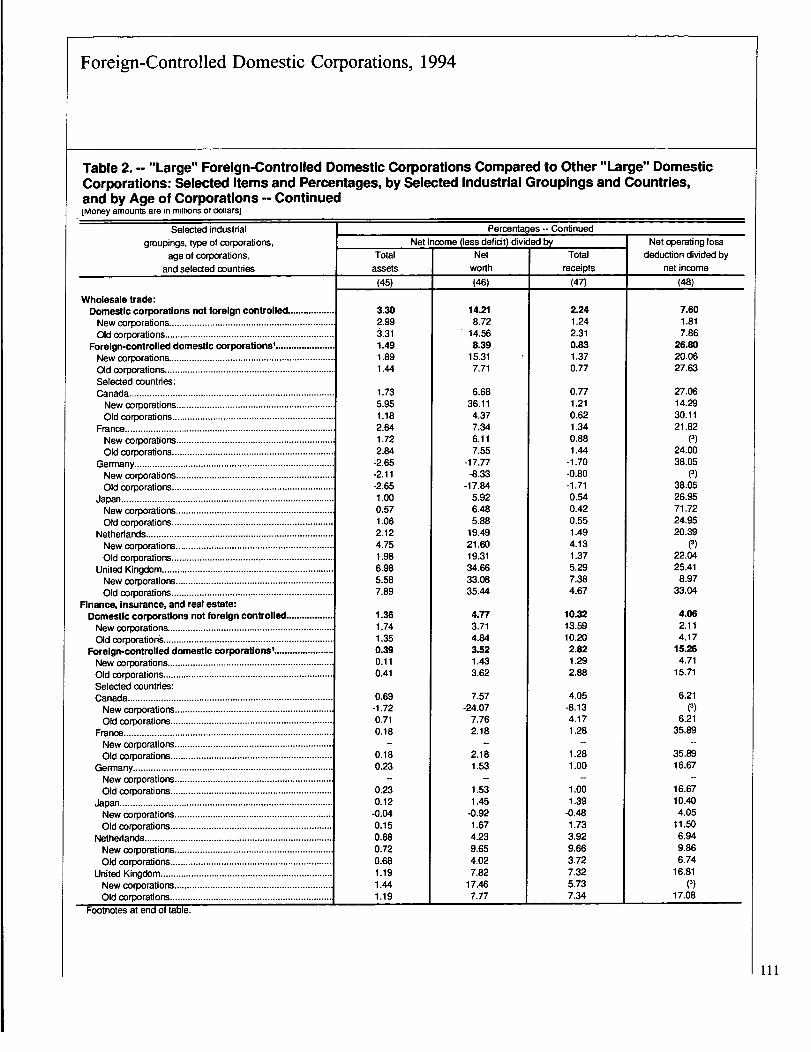
Foreign-Controlled Domestic Corporations, 1994
Table 2. -- "Large" Foreign-Controlled Domestic Corporations Compared to Other "Large" DomesticCorporations: Selected Items and Percentages, by Selected Industrial Groupings and Countries,and by Age of Corporations -- ContinuedtMoney amounts are in miiiions or conarsi
Selected industrialgroupings, type of corporations,
age of corporationsand selected countries
Wholesale trade:Domestic corporations not foreign controlled..................New corporations................................................................Old corporations ..................................................................
Foreign-controlled domestic corporations'.......................New corporations ................................................................Old corporations ..................................................................Selected countries:Canada ................................................................................New corporations..............................................................Old corporations...............................................................
France .................................................................................New corporations..............................................................Old corporations ...............................................................
Germany..............................................................................New corporations..............................................................Old corporations ...............................................................
Japan ...................................................................................New corporations.............................................................Old corporations ...............................................................
Netherlands .........................................................................New corporations .............................................................Old corporations ...............................................................
United Kingdom ...................................................................New corporations .............. ..............................................Old corporations ...............................................................
Finance, Insurance, and real estate:
Domestic corporations not foreign controlled..................New corporations................................................................Old corporations ..................................................................
Foreign-controlled domestic corporations' .......................New corporations................................................................Old corporations ..................................................................Selected countries:Canada ................................................................................New corporations.............................................................
Old corporations ...............................................................
France .................................................................................
New corporations.............................................................
Old corporations ...............................................................
Germany ..............................................................................New corporations.............................................................Old corporations ...............................................................
Japan ...................................................................................New corporations.............................................................Old corporations ...............................................................
Netherlands .........................................................................New corporations .............................................................Old corporations ...............................................................
United Kingdom...................................................................New corporations .............................................................Old corporations ...............................................................
Footnotes at end of table.
Totalassets
(45)
3.302.99~.311.491.891.44
1.735.951.182.641.722.84
-2.65-2.11-2.651.000.571.062.124.751.986.985.587.89
1.361.741.350.390.110.41
0.69-1.720.710.18
0.180.23
0.230.12
-0.040.150.680.720.681.191.441.19
Percentages -- ContinuedNet income (less deficit) divided by
Networth(46)
14.218.72
14.568.39
15.317.71
6.6836.11
4.377.346.117.55
-17.77-8.33
-17.845.926.485.88
19.4921.6019.3134.6633.0835.44
4.773.714.843.521.433.62
7.57-24.07
7.762.18
2.181.53
1.531.45
-0.921.674.239.654.027.82
17.467.77
Totalreceipts
(47)
2.241.242.310.831.370.77
0.771.210.621.340.881.44
-1.70-0.80-1.710.540.420.551.494.131.375.297.384.67
10.3213.5910.20
2.821.292.88
4.05-8.134.171.28
1.281.00
1.001.39
-0.481.733.929.663.727.325.737.34
Net operating lossdeduction divided by
net income
(48)
7.601.817.86
26.8020.0627.63
27.0614.2930.1121.82
(3)
24.00
38.05(3)
38.0526.9571.7224.9520.39
(3)
22.0425.418.97
33.04
4.062.114.17
15.264.71
15.71
6.21(3)
6.2135.89
35.891 6.67
16.6710.40
4.0511.50
6.949.866.74
16.81(3)
17.08
III
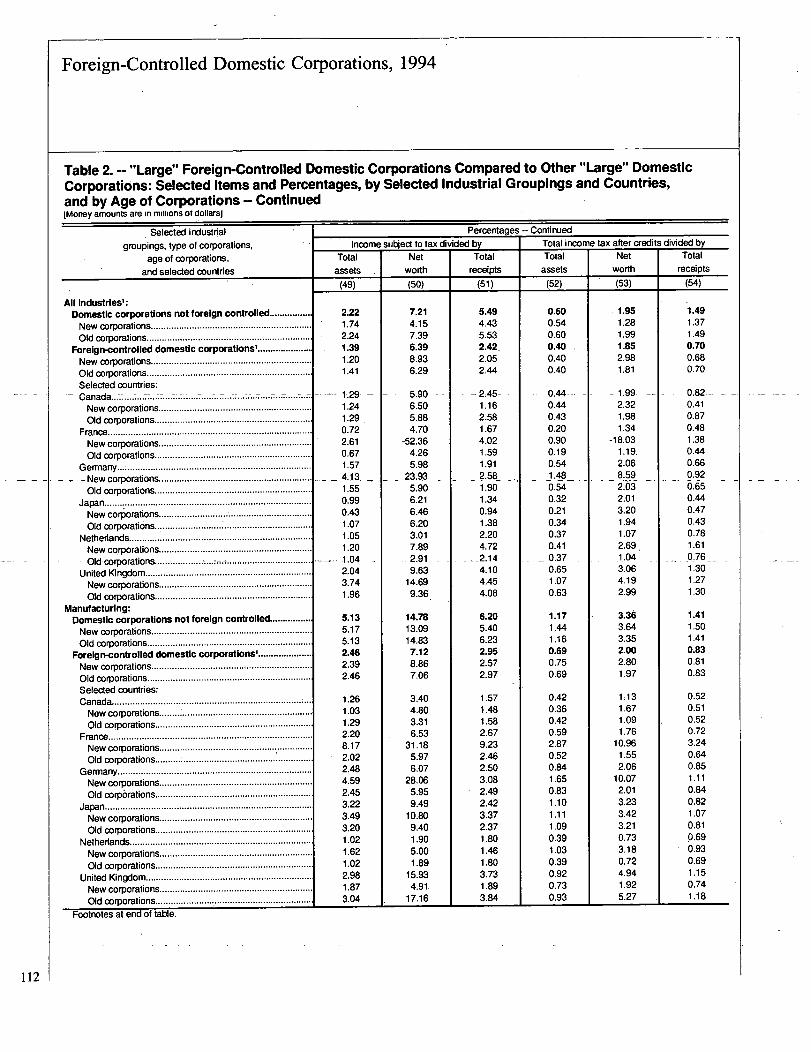
Foreign-Controlled Domestic Corporations, 1994
Table 2. -- "Large" Foreign-Controlled Domestic Corporations Compared to Other "Large" DomesticCorporations: Selected Items and Percentages, by Selected Industrial Groupings and Countries,and by Age of Corporations -- Continued[money amounts are in miuions ot aoiiarsi
.. Selected industrialgroupings, type of corporations,
age of corporations,and selected countries
All Industries':Domestic corporations not foreign controlled.................New corporations...............................................................Old corporations ................................................................
Foreign-controlled domestic corporations'.....................New corporations...............................................................Old corporations ................................................................Selected countries:Canacla...-.-....
..........*............ . ........... . .New corporations............................................................Old corporations..............................................................
France ................................................................................Newcorporations............................................................Old corporations.............................................................
Germany...~ ........................................................................Newcorporations............................................................Old corporations.............................................................
Japan....... ........New corporations.............................................................Old corporations.............................................................
Netherlands .......................................................................New corporations............................................................Old corporations............................ ................... ;..................
United Kingdom .................................................................New corporations............................................................Old corporations.............................................................
Manufacturing:Domestic corporations not foreign controlled................New corporations ...............................................................Old corporations ................................................................
Foreign-controlled domestic corporations' .....................New corporations ...............................................................Old corporations .... ........................................ ..................Selected countries:Canada........................... ...
:New corporations .........Old corporations .............................................................
France...............................................................................New corporations .............................................................Old corporations .......... : ..................................................
Germany............................................................................New corporations ............................................................Old corporations .............................................................
Japan .................................................................................New corporations ............................................................Old corporations .............................................................
Netherlands.......................................................................New corporations ............................................................Old corporations .............................................................
United Kingdom .................................................................New corporations ............................................................
Footnotes at end Ff"table.Old corporations .............................................................
Percentages ContinuedIncome subject to tax divided by
Totalassets
Networth
Totalreceipts
(49)
i221.742.241.391.201.41
1.291.241.290.722.610.671.574.131.550.990.431.071.051.201.04-2.043.741.96
5.135.175.132.462.392.46
1.261.031.292.208.172.022.484.592.453.223.493.201.021.621.022.981.873.04
(50)
7.214.157.396.398.936.29
5.906.505.884.70
-52.364.265.98
23.935.906.216.466.203.017.89
9.6314.699.36
14.7813.0914.837.128.867.06
3.404.803.316.53
31.185.976.07
28.065.959.49
10.809.401.905.001.89
15.934.91
17.16
(51)
5.494.435.532.42.2.052.44
Total income tax after creditTotal
assets(52)
0.600.540.600.400.400.40
-2.45-1.162.581.674.021.591.912.581.901.340.941.382.204.72
--2.144.104.454.08
6.205.406.232.952.572.97
1.571.481.582.679.232.462.503.082.492.423.372.371.801.461.803.731.893.84
0.44-0.440.430.200.900.190.541.48_0.540.320.210.340.370.410.370.651.070.63
1.171.441.160.690.750.69
0.420.360.420.592.870.520.841.650.831.101.111.090.391.030.390.920.730.93
Networth(53)
1.951.281.991.852.981.81
1.992.321.981.34
-18.031.19.2.068 59.2.032.013.201.941.072.69.-1.04-3.064.192.99
3.363.643.352.002.801.97
1.131.671.091.76
10.961.552.06
10.072.013.233.423.210.733.180.724.941.925.27
1.491.371.490.700.680.70
0.82--0.410.870.481.380.440.660.920.650.440.470.430.781.61
_-0.761.301.271.30
1.411.501.410.830.810.83
0.520.510.520.723.240.640.851.110.840.821.070.810.690.930.691.150.741.18
112
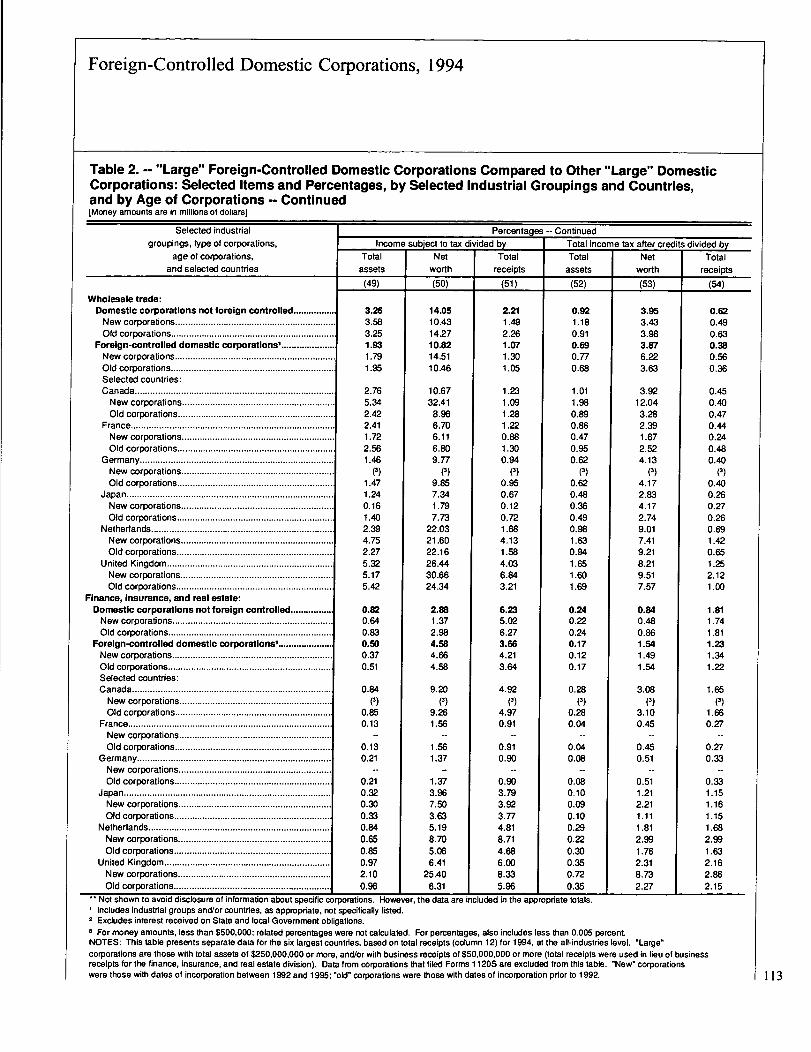
Foreign-Controlled Domestic Corporations, 1994
Table 2. -- "Large" Foreign-Controlled Domestic Corporations Compared to Other "Large" DomesticCorporations: Selected Items and Percentages, by Selected Industrial Groupings and Countries,and by Age of Corporations -- Continuedimoney amounts are in millions ot dollarsi
Selected industrialgroupings, type of corporations,
age of corporations,and selected countries
Wholesale trade:Domestic corporations not foreign controlled.................New corporations ...............................................................Old corporations ................................................................
Foreign-controlled domestic corporations' ....................New corporations ...............................................................Old corporations................................................................Selected countries:Canada..............................................................................New corporations ............................................................Old corporations ..............................................................
France................................................................................New corporations ............................................................Old corporations .............................................................
Germany ............................................................................New corporations............................................................Old corporations .............................................................
Japan .................................................................................New corporations ............................................................Old corporations .............................................................
Netherlands .......................................................................New corporations ............................................................Old corporations ..............................................................
United Kingdom .................................................................New corporations ............................................................Old corporations.............................................................
Finance, Insurance, and real estate:Domestic corporations not foreign controlled.................New corporations ...............................................................Old corporations.................................................................
Foreign-controlled domestic corporations' .................. ...New corporations...............................................................Old corporations................................................................Selected countries:Canada ..............................................................................New corporations ............................................................Old corporations .............................................................
France................................................................................New corporations ............................................................Old corporations .............................................................
Germany ............................................................................New corporations ............................................................Old corporations .............................................................
Japan .................................................................................New corporations ............................................................Old corporations .............................................................
Netherlands .......................................................................New corporations ............................................................Old corporations ..............................................................
United Kingdom .................................................................New corporations ............................................................Old corporations ..............................................................
Percentages -- ContinuedIncome subject to tax divided by
Totalassets
Networth
Totalreceipts
(49)
3.263.583.251.931.791.95
2.765.342.422.411.722.561.46
(1)1.471.240.161.402.394.752.275.325.175.42
0.820.640.830.500.370.51
0.84M
0.850.13
0.130.21
0.210.320.300.330.840.650.850.972.100.96
(50)
14.0510.4314.2710.8214.5110.46
10.6732.418.966.706.116.809.77
(1)9.857.341.797.73
22.0321.6022.1626A430.6624.34
2.881.372.984.584.664.58
9.20(3)
9.261.56
1.561.37
1.373.967.503.635.198.705.066.41
25.406.31
(51)
2.211.492.261.071.301.05
Total income tax after creditTotal
assets(52)
0.921.180.910.690.770.68
1.231.091.281.220.881.300.94
(1)0.950.670.120.721.684.131.584.036.843.21
6.235.026.273.664.213.64
4.92(1)
4.970.91
0.910.90
0.903.793.923.774.818.714.686.008.335.96
1.01
1.980.89
0.860.47
0.95
0.62(3)
0.620.480.360.490.981.630.941.651.601.69
0.240.220.240.170.120.17
0.28(3)
0.280.04
0.040.08
0.080.100.090.100.290.220.300.350.720.35
Networth
(53)
3.953.433.983.876.223.63
3.9212.043.282.391.672.524.13
(1)4.172.834.172.749.017.419.218.219.517.57
0.840.480.861.541.491.54
3.08(3)
3.100.45
0.450.51
0.511.212.211.111.812.991.762.318.732.27
divided byTotal
receipts(54)
0.620.490.630.380.560.36
0.450.400.470.440.240.480.40
(3)
0.400.260.270.260.691.420.651.252.121.00
1.811.741.811.231.341.22
1.65
M1.660.27
0270.33
0.331.151.161.151.682.991.632.162.862.15
Not shown to avoid disclosure of information about specific corporations. However, the data are included in the appropriate totals.Includes industrial groups andlor countries, as appropriate, not specifically listed.
2 Excludes interest received on State and local Government obligations.3 For money amounts, less than $500,000; related percentages were not calculated. For percentages, also includes less than 0.005 percent.NOTES: This table presents separate data for the six largest countries, based on total receipts (column 12) for 1994, at the all-industries level. "Large"corporations are those with total assets of $250,000,000 or more, and/or with business receipts of $50,000,000 or more (total receipts were used in lieu of businessreceipts for the finance, insurance, and real estate division). Data from corporations that filed Forms 1120S are excluded from this table. "New" corporationswere those with dates of incorporation between 1992 and 1995; "old" corporations were those with dates of incorporation prior to 1992. 113