corporate taxation and fdi within the eu25 amina lahrèche-révil cepii 2nd euroframe conference on...
TRANSCRIPT

Corporate taxation and FDI within the EU25
Amina Lahrèche-RévilCEPII
2nd EUROFRAME Conference on Economic Policy Issues in the European Union
Vienna, Friday 3 June 2005
What do we know?• Traditional tax competition literature
– Increasing integration pressure on tax policies– Small countries more prone to tax competition– Race to the bottom ? EU enlargement context
• Imperfect competition– Trade costs + scale economies home bias, higher
taxes in the largest countries (Haufler & Wooton, 1999)
– Agglomeration economies agglomeration rents, tax competition = limit pricing (Baldwin & Krugman, 2004)
Do tax differentials really affect FDI?
The enlarged EU
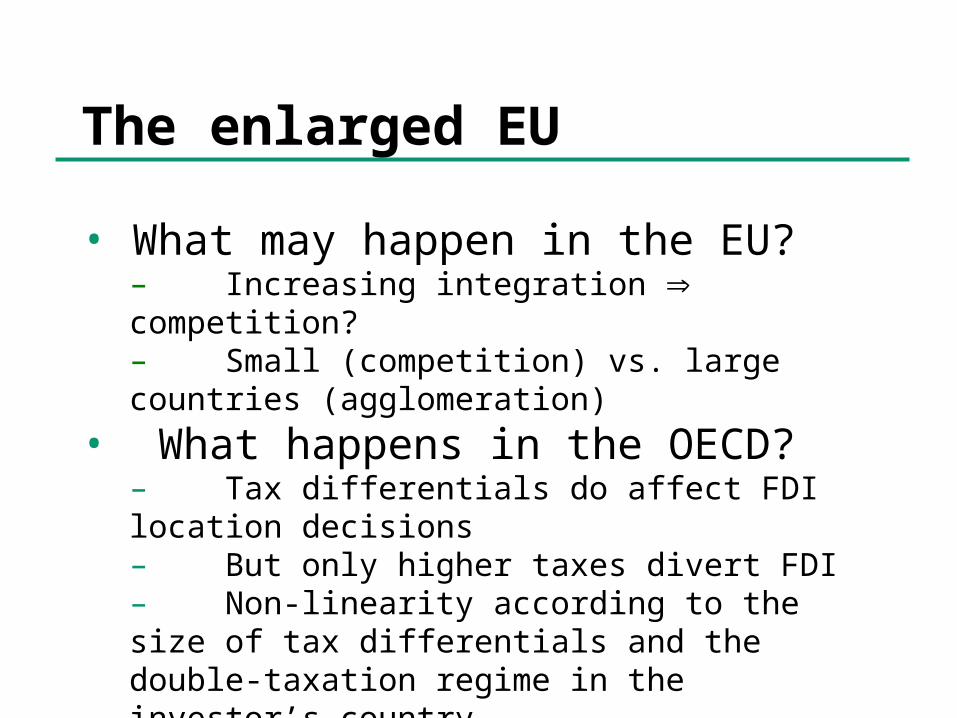
• What may happen in the EU?– Increasing integration competition?– Small (competition) vs. large countries (agglomeration)
• What happens in the OECD?– Tax differentials do affect FDI location decisions– But only higher taxes divert FDI– Non-linearity according to the size of tax differentials and the double-taxation regime in the investor’s country.– Competition from third countries

Outline
Stylized factsEconometric methodologyResultsConclusion
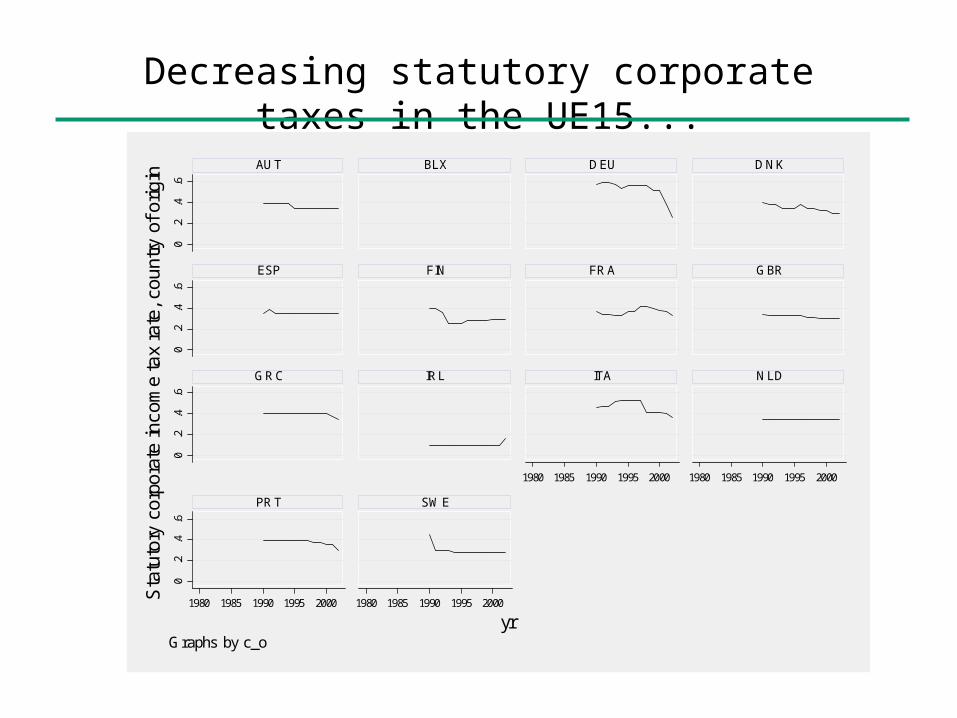
Decreasing statutory corporate taxes in the UE15...
0.2
.4.6
0.2
.4.6
0.2
.4.6
0.2
.4.6
1980 1985 1990 1995 2000 1980 1985 1990 1995 2000
1980 1985 1990 1995 2000 1980 1985 1990 1995 2000
AUT BLX DEU DNK
ESP FIN FRA GBR
GRC IRL ITA NLD
PRT SWE
Sta
tuto
ry c
orpo
rate
inco
me
tax
rate
, cou
ntry
of o
rigin
yrGraphs by c_o

… and in the NEM
.2.3
.4.5
.2.3
.4.5
.2.3
.4.5
1980 1985 1990 1995 2000
1980 1985 1990 1995 2000 1980 1985 1990 1995 2000
CZE EST HUN
LTU LVA POL
SVK SVN
Sta
tuto
ry c
orpo
rate
inco
me
tax
rate
, cou
ntry
of o
rigin
yrGraphs by c_o
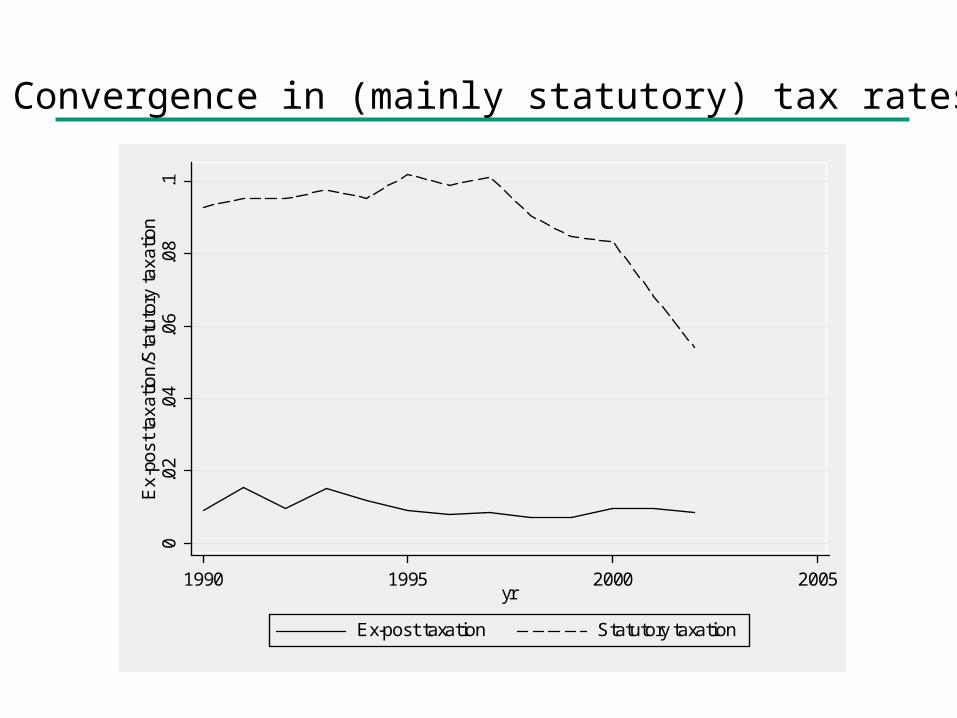
Convergence in (mainly statutory) tax rates
0.0
2.0
4.0
6.0
8.1
Ex-
post
taxa
tion/
Sta
tuto
ry ta
xatio
n
1990 1995 2000 2005yr
Ex-post taxation Statutory taxation
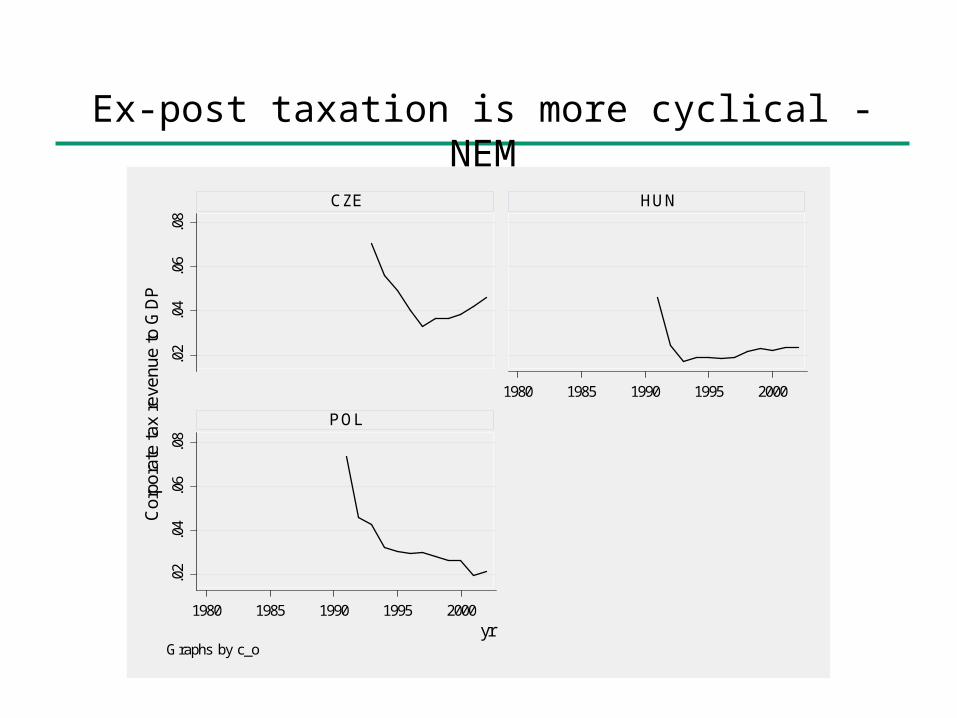
Ex-post taxation is more cyclical - NEM
.02
.04
.06
.08
.02
.04
.06
.08
1980 1985 1990 1995 2000
1980 1985 1990 1995 2000
CZE HUN
POL
Co
rpor
ate
tax
rev
enu
e to
GD
P
yrGraphs by c_o
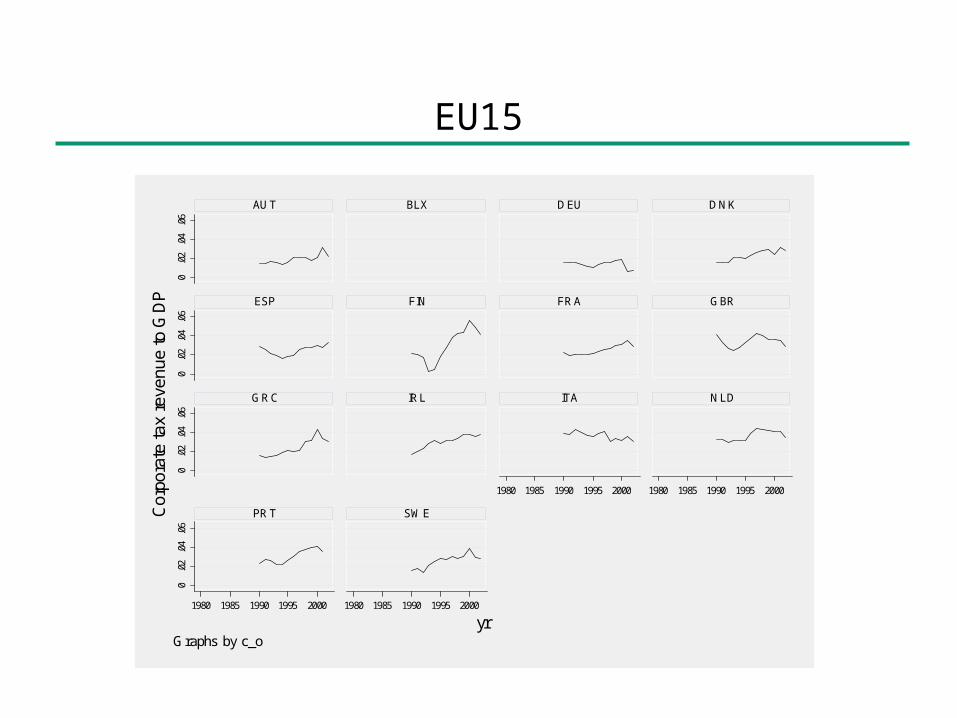
EU15
0.0
2.0
4.0
60
.02
.04
.06
0.0
2.0
4.0
60
.02
.04
.06
1980 1985 1990 1995 2000 1980 1985 1990 1995 2000
1980 1985 1990 1995 2000 1980 1985 1990 1995 2000
AUT BLX DEU DNK
ESP FIN FRA GBR
GRC IRL ITA NLD
PRT SWECor
pora
te ta
x re
venu
e to
GD
P
yrGraphs by c_o
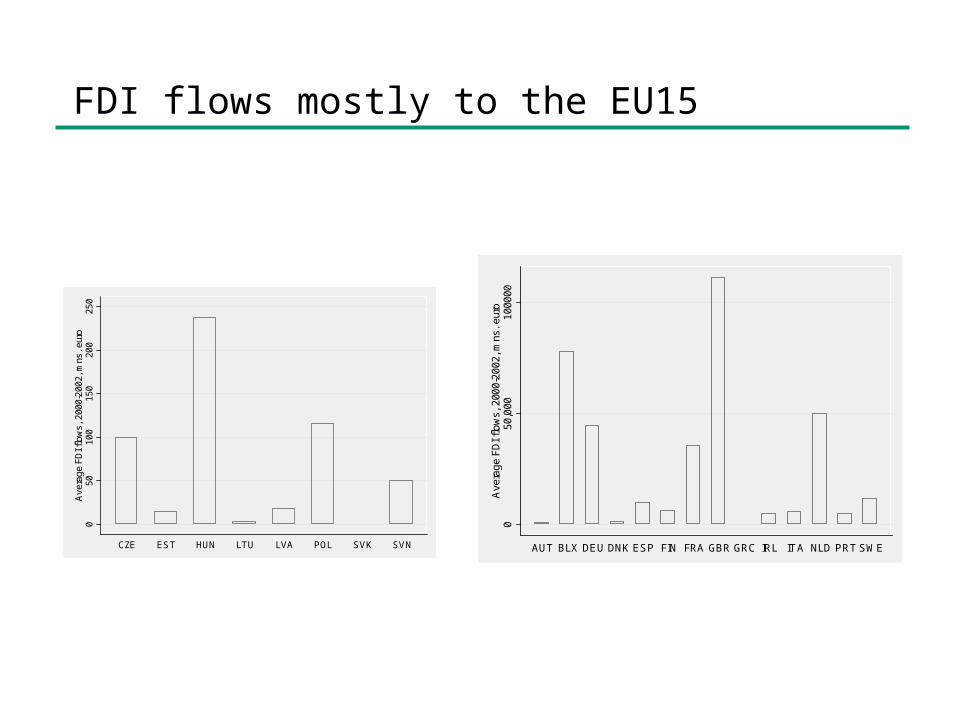
FDI flows mostly to the EU150
5010
015
020
025
0A
vera
ge F
DI f
low
s, 2
000-
2002
, mns
. eur
o
CZE EST HUN LTU LVA POL SVK SVN
05
0,00
01
0000
0A
ver
age
FD
I fl
ow
s,
200
0-2
002
, mns
. eur
o
AUT BLX DEU DNK ESP FIN FRA GBR GRC IRL ITA NLD PRT SWE
Empirical analysisTheoretical foundations
tax = cost FDI should reactBut
Transfer pricing and intra-firm debt profit locationTiebout (1956): taxation and public-goods provisionMarkusen (1995): structural determinants > taxationHigh tax = high pre-tax returnImperfect competition: taxes = location rents
Empirical literatureSemi-: -3.3/-4.0, high variance (De Mooij & Ederveen, 2003)
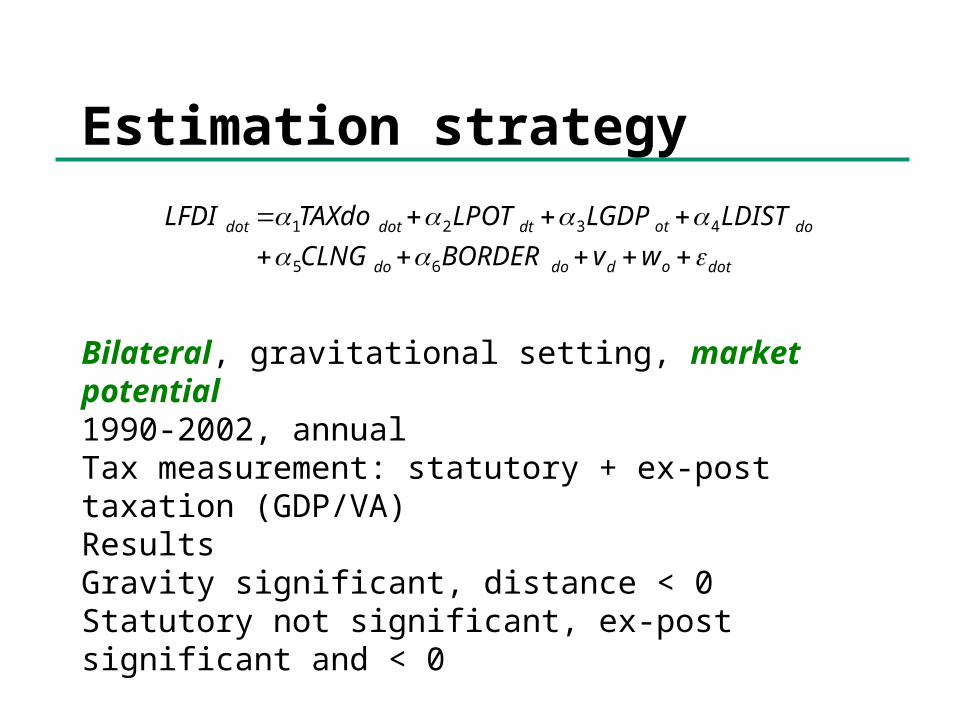
Estimation strategy
Bilateral, gravitational setting, market potential1990-2002, annualTax measurement: statutory + ex-post taxation (GDP/VA)ResultsGravity significant, distance < 0Statutory not significant, ex-post significant and < 0
dotoddodo
dootdtdotdot
wvBORDERCLNG
LDISTLGDPLPOTTAXdoLFDI
65
4321
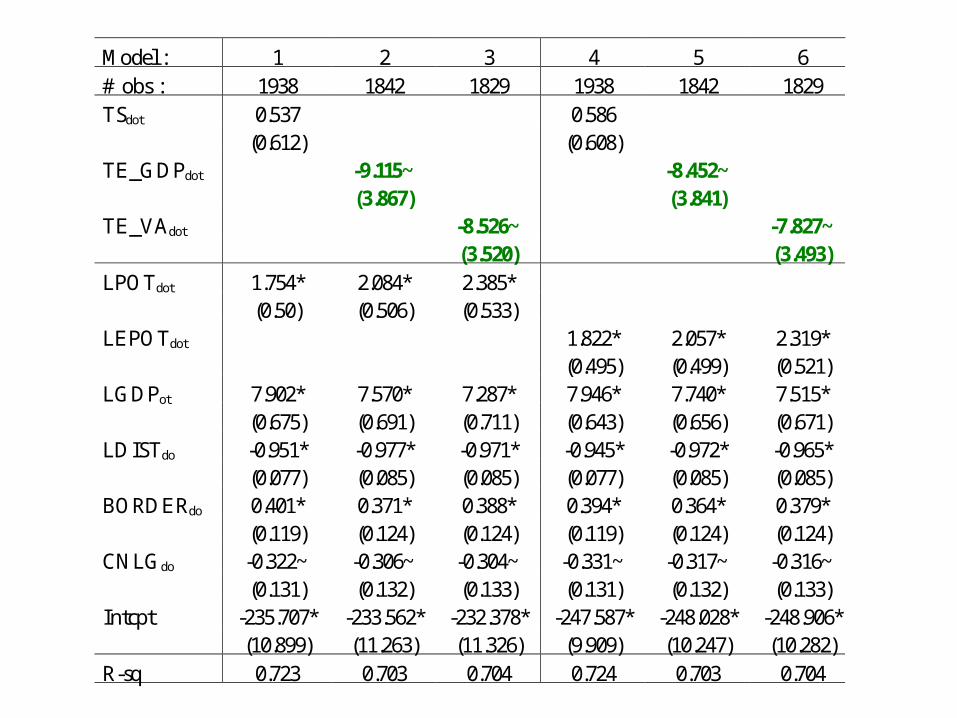
Model : 1 2 3 4 5 6# obs : 1938 1842 1829 1938 1842 1829TSdot 0.537 0.586
(0.612) (0.608)TE_GDPdot -9.115~ -8.452~
(3.867) (3.841)TE_VAdot -8.526~ -7.827~
(3.520) (3.493)LPOTdot 1.754* 2.084* 2.385*
(0.50) (0.506) (0.533)LEPOTdot 1.822* 2.057* 2.319*
(0.495) (0.499) (0.521)LGDPot 7.902* 7.570* 7.287* 7.946* 7.740* 7.515*
(0.675) (0.691) (0.711) (0.643) (0.656) (0.671)LDISTdo -0.951* -0.977* -0.971* -0.945* -0.972* -0.965*
(0.077) (0.085) (0.085) (0.077) (0.085) (0.085)BORDERdo 0.401* 0.371* 0.388* 0.394* 0.364* 0.379*
(0.119) (0.124) (0.124) (0.119) (0.124) (0.124)CNLGdo -0.322~ -0.306~ -0.304~ -0.331~ -0.317~ -0.316~
(0.131) (0.132) (0.133) (0.131) (0.132) (0.133)Intcpt -235.707* -233.562* -232.378* -247.587* -248.028* -248.906*
(10.899) (11.263) (11.326) (9.909) (10.247) (10.282)R-sq 0.723 0.703 0.704 0.724 0.703 0.704
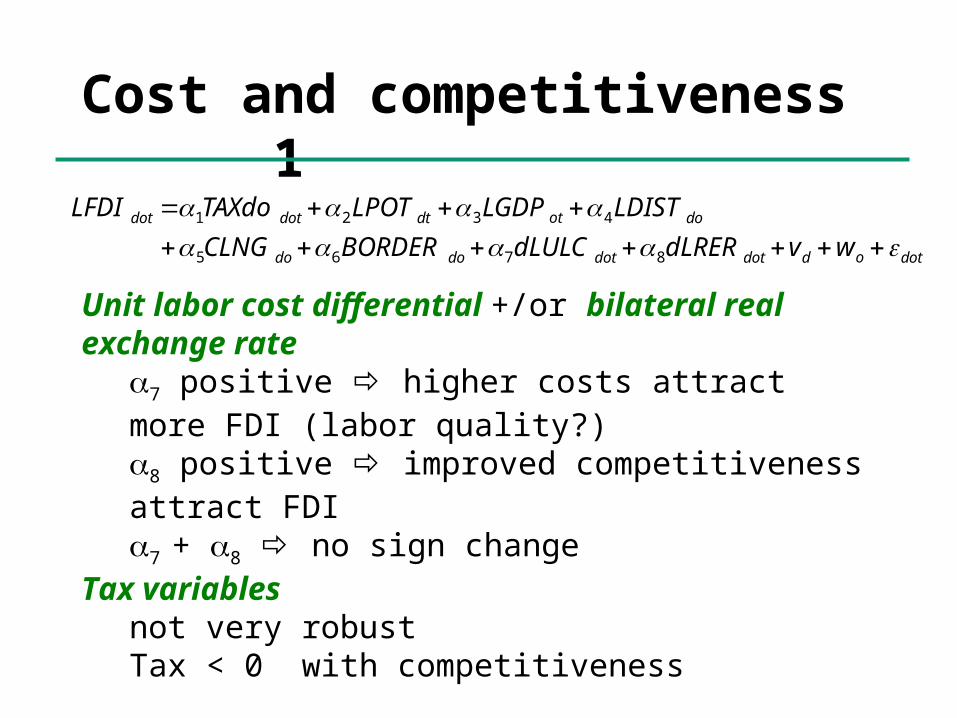
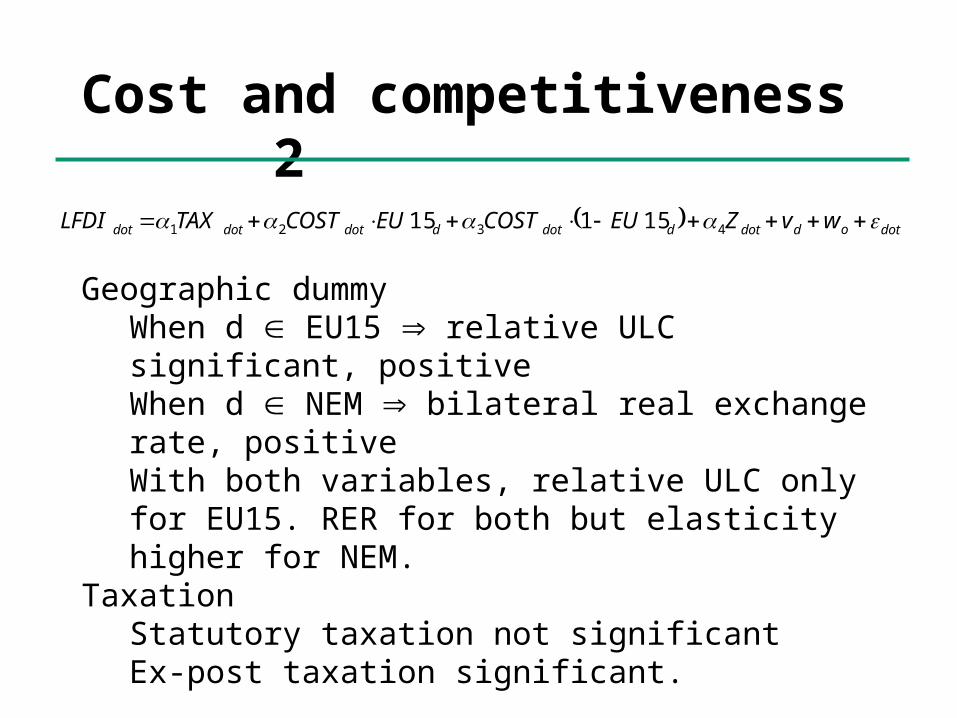
Cost and competitiveness1
Unit labor cost differential +/or bilateral real exchange rate
7 positive higher costs attract more FDI (labor quality?)8 positive improved competitiveness attract FDI7 + 8 no sign change
Tax variablesnot very robustTax < 0 with competitiveness
dotoddotdotdodo
dootdtdotdot
wvdLRERdLULCBORDERCLNG
LDISTLGDPLPOTTAXdoLFDI
8765
4321
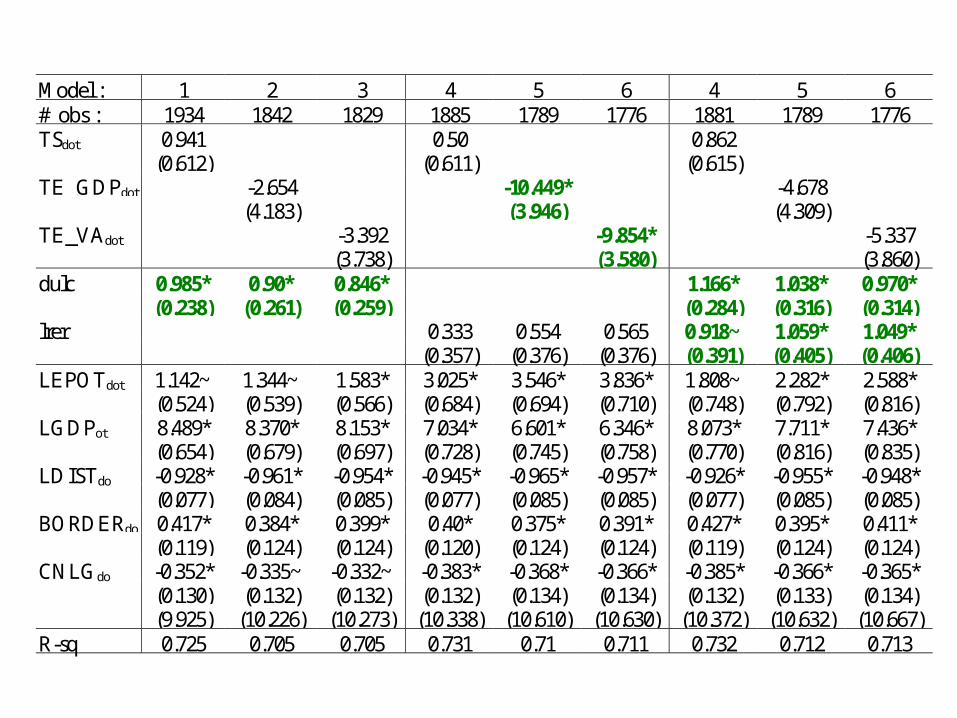
Model : 1 2 3 4 5 6 4 5 6# obs : 1934 1842 1829 1885 1789 1776 1881 1789 1776TSdot 0.941 0.50 0.862
(0.612) (0.611) (0.615)TE_GDPdot -2.654 -10.449* -4.678
(4.183) (3.946) (4.309)TE_VAdot -3.392 -9.854* -5.337
(3.738) (3.580) (3.860)dulc 0.985* 0.90* 0.846* 1.166* 1.038* 0.970*
(0.238) (0.261) (0.259) (0.284) (0.316) (0.314)lrer 0.333 0.554 0.565 0.918~ 1.059* 1.049*
(0.357) (0.376) (0.376) (0.391) (0.405) (0.406)LEPOTdot 1.142~ 1.344~ 1.583* 3.025* 3.546* 3.836* 1.808~ 2.282* 2.588*
(0.524) (0.539) (0.566) (0.684) (0.694) (0.710) (0.748) (0.792) (0.816)LGDPot 8.489* 8.370* 8.153* 7.034* 6.601* 6.346* 8.073* 7.711* 7.436*
(0.654) (0.679) (0.697) (0.728) (0.745) (0.758) (0.770) (0.816) (0.835)LDISTdo -0.928* -0.961* -0.954* -0.945* -0.965* -0.957* -0.926* -0.955* -0.948*
(0.077) (0.084) (0.085) (0.077) (0.085) (0.085) (0.077) (0.085) (0.085)BORDERdo 0.417* 0.384* 0.399* 0.40* 0.375* 0.391* 0.427* 0.395* 0.411*
(0.119) (0.124) (0.124) (0.120) (0.124) (0.124) (0.119) (0.124) (0.124)CNLGdo -0.352* -0.335~ -0.332~ -0.383* -0.368* -0.366* -0.385* -0.366* -0.365*
(0.130) (0.132) (0.132) (0.132) (0.134) (0.134) (0.132) (0.133) (0.134)(9.925) (10.226) (10.273) (10.338) (10.610) (10.630) (10.372) (10.632) (10.667)
R-sq 0.725 0.705 0.705 0.731 0.71 0.711 0.732 0.712 0.713
Cost and competitiveness2
Geographic dummyWhen d EU15 relative ULC significant, positiveWhen d NEM bilateral real exchange rate, positiveWith both variables, relative ULC only for EU15. RER for both but elasticity higher for NEM.
TaxationStatutory taxation not significantEx-post taxation significant.
dotoddotddotddotdotdot wvZEUCOSTEUCOSTTAXLFDI 4321 15115
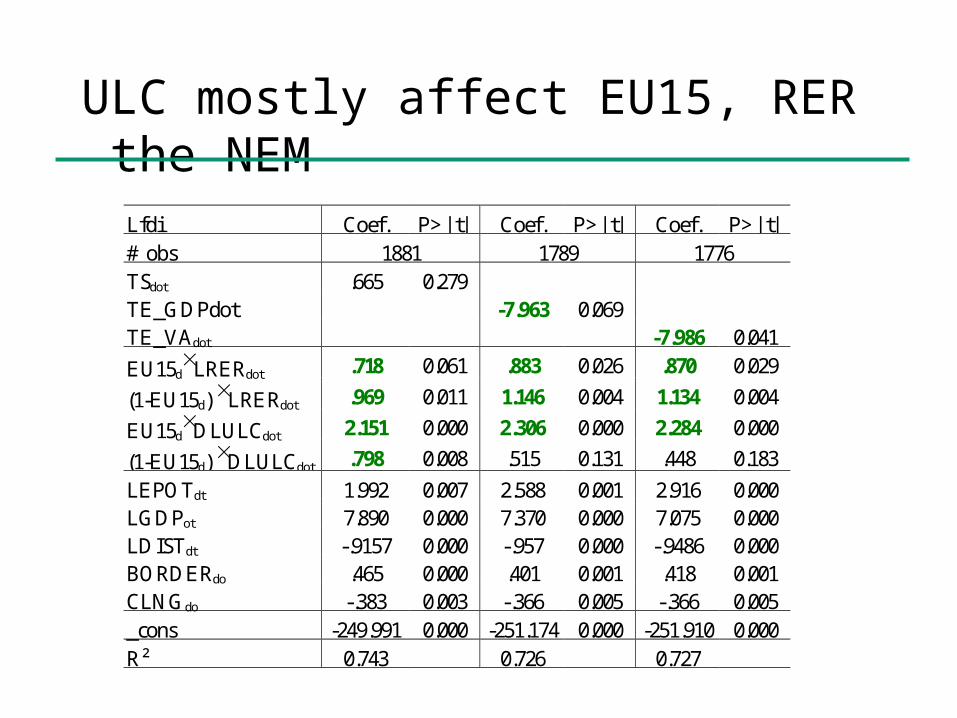
Lfdi Coef. P>| t| Coef. P>| t| Coef. P>| t|# obs 1881 1789 1776TSdot .665 0.279TE_GDPdot -7.963 0.069TE_VAdot -7.986 0.041
EU15dLRERdot .718 0.061 .883 0.026 .870 0.029
(1-EU15d) LRERdot .969 0.011 1.146 0.004 1.134 0.004
EU15dDLULCdot 2.151 0.000 2.306 0.000 2.284 0.000
(1-EU15d) DLULCdot .798 0.008 .515 0.131 .448 0.183
LEPOTdt 1.992 0.007 2.588 0.001 2.916 0.000LGDPot 7.890 0.000 7.370 0.000 7.075 0.000LDISTdt -.9157 0.000 -.957 0.000 -.9486 0.000BORDERdo .465 0.000 .401 0.001 .418 0.001CLNGdo -.383 0.003 -.366 0.005 -.366 0.005_cons -249.991 0.000 -251.174 0.000 -251.910 0.000R² 0.743 0.726 0.727
ULC mostly affect EU15, RER the NEM

Taxation only impacts FDI in the EU15...
lfdi Coef. P>| t| Coef, P>| t| Coef, P>| t|# obs. 1881 1789 1776EU15d
TSdot 0,96 0,143(1-EU15d) TSdot -0,01 0,987EU15d
TE_GDPdot -8,75 0,083(1-EU15d) TE_GDPdot -6,67 0,267EU15d
TE_VAdot -8,56 0,058(1-EU15d) TE_VAdot -7,07 0,182EU15d LRERdot 0,69 0,075 0,88 0,027 0,87 0,029(1- EU15d)LRERdot 0,94 0,014 1,14 0,004 1,13 0,005EU15d LULCdot 2,05 0,000 2,32 0,000 2,29 0,000(1- EU15d)LULCdot 0,76 0,012 0,55 0,127 0,48 0,179LEPOTdt 2,00 0,006 2,57 0,001 2,90 0,000LGDPot 7,89 0,000 7,38 0,000 7,08 0,000LDISTdt -0,93 0,000 -0,96 0,000 -0,95 0,000BORDERdo 0,46 0,000 0,40 0,001 0,42 0,001CLNGdo -0,39 0,003 -0,36 0,005 -0,36 0,005_cons -250,27 0,000 -250,78 0,000 -251,59 0,000R² 0.744 0.726 0.727
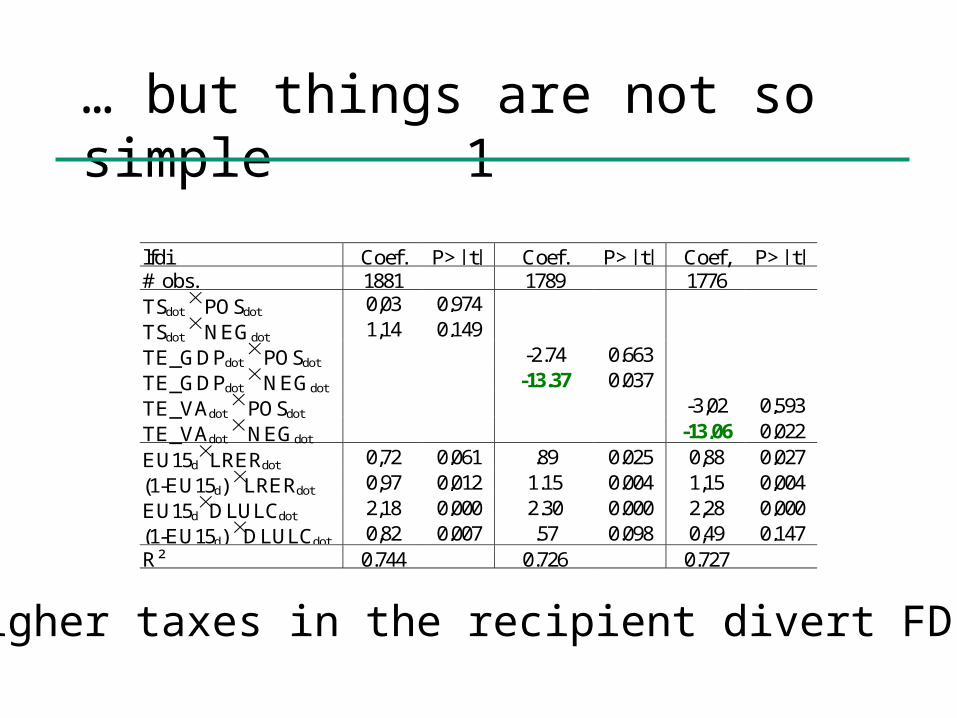
… but things are not so simple 1
lfdi Coef. P>| t| Coef. P>| t| Coef, P>| t|# obs. 1881 1789 1776TSdot POSdot 0,03 0,974TSdot NEGdot 1,14 0,149TE_GDPdot POSdot -2.74 0.663TE_GDPdot NEGdot -13.37 0.037TE_VAdot POSdot -3,02 0,593TE_VAdot NEGdot -13,06 0,022EU15d
LRERdot 0,72 0,061 .89 0.025 0,88 0,027(1-EU15d) LRERdot 0,97 0,012 1.15 0.004 1,15 0,004EU15d
DLULCdot 2,18 0,000 2.30 0.000 2,28 0,000(1-EU15d) DLULCdot 0,82 0,007 .57 0.098 0,49 0,147R² 0.744 0.726 0.727
Higher taxes in the recipient divert FDI
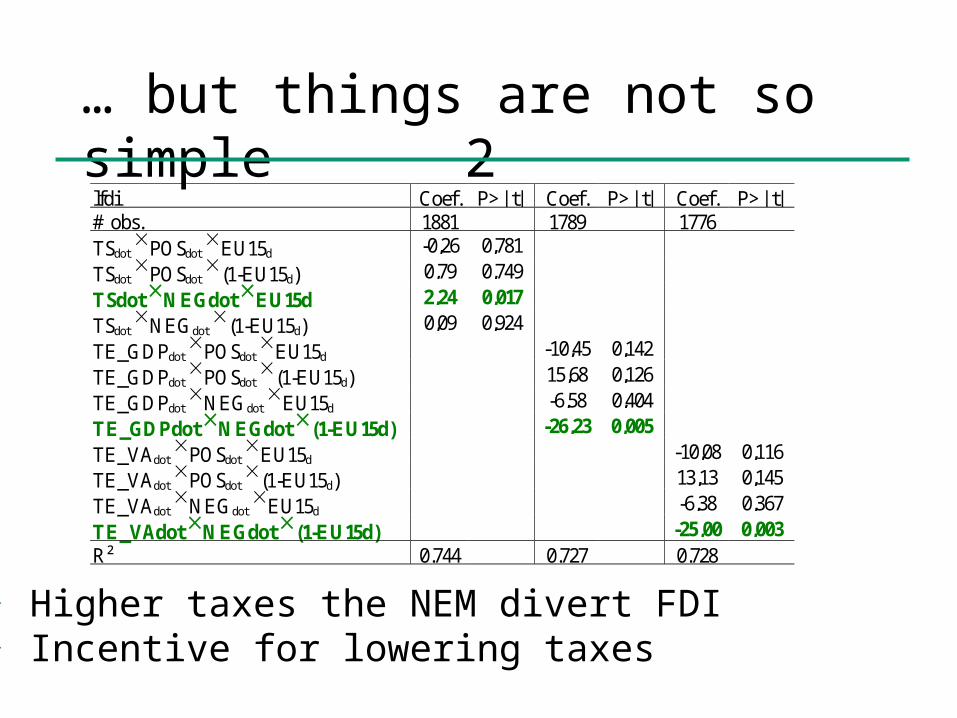
… but things are not so simple 2lfdi Coef. P>| t| Coef. P>| t| Coef. P>| t|# obs. 1881 1789 1776TSdot POSdot EU15d -0,26 0,781TSdot POSdot (1-EU15d) 0,79 0,749TSdot NEGdot EU15d 2,24 0,017TSdot NEGdot (1-EU15d) 0,09 0,924TE_GDPdot POSdot EU15d -10,45 0,142TE_GDPdot POSdot (1-EU15d) 15,68 0,126TE_GDPdot NEGdot EU15d -6,58 0,404TE_GDPdot NEGdot (1-EU15d) -26,23 0,005TE_VAdot POSdot EU15d -10,08 0,116TE_VAdot POSdot (1-EU15d) 13,13 0,145TE_VAdot NEGdot EU15d -6,38 0,367TE_VAdot NEGdot (1-EU15d) -25,00 0,003R² 0.744 0.727 0.728
Higher taxes the NEM divert FDI Incentive for lowering taxes
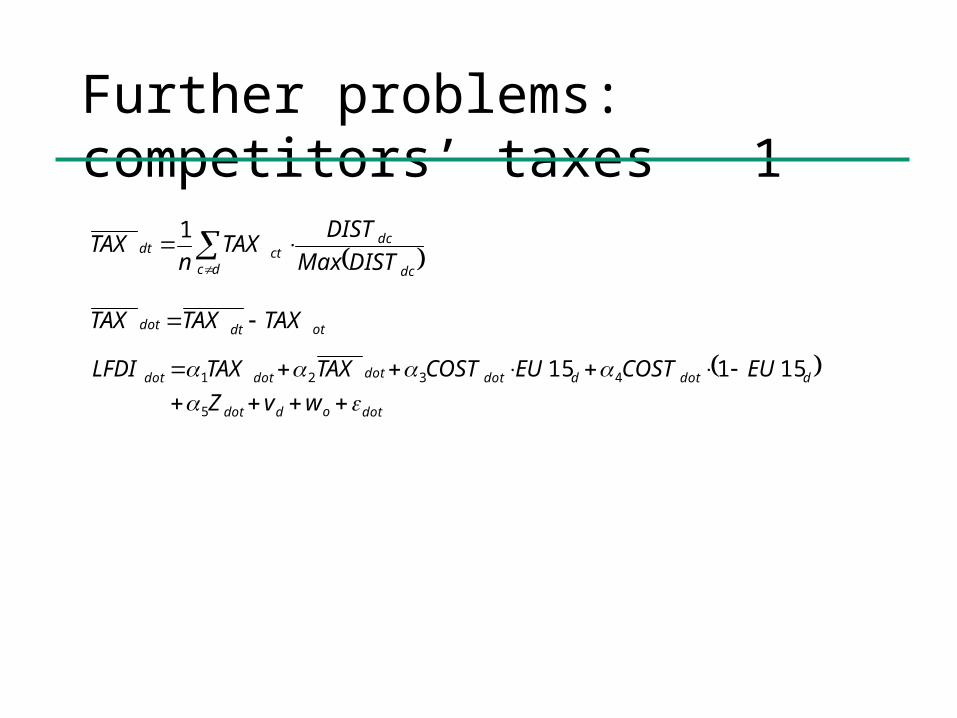
Further problems: competitors’ taxes 1
dc dc
dcctdt
DISTMaxDIST
TAXn
TAX1
otdtdot TAXTAXTAX
dotoddot
ddotddotdotdotdot
wvZ
EUCOSTEUCOSTTAXTAXLFDI
5
4321 15115
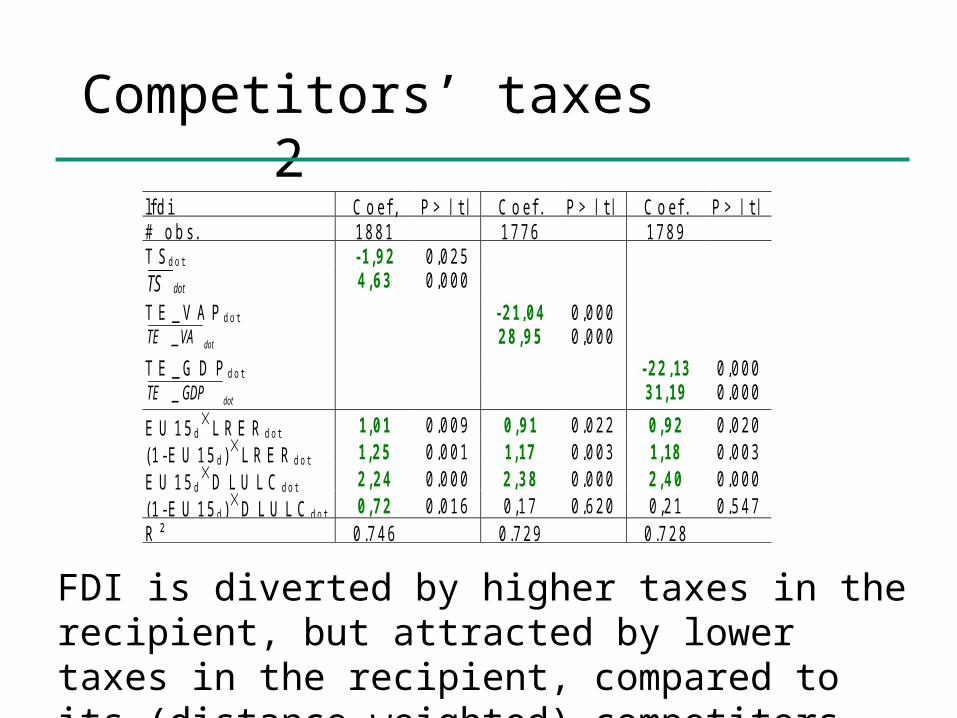
Competitors’ taxes2
lf d i C o ef , P > | t| C o ef . P > | t| C o ef . P > | t|# o b s. 18 81 17 76 17 89T S d o t -1,92 0 ,0 25
dotTS 4,63 0 ,0 00
T E _ V A P d o t -21,04 0 ,0 00
dotVATE _ 28,95 0 ,0 00
T E _ G D P d o t -22,13 0 ,0 00
dotGDPTE _ 31,19 0 ,0 00
E U 1 5 dL R E R d o t 1,01 0 ,0 09 0,91 0 ,0 22 0,92 0 ,0 20
(1 - E U 15 d )L R E R d o t 1,25 0 ,0 01 1,17 0 ,0 03 1,18 0 ,0 03E U 1 5 d
D L U L C d o t 2,24 0 ,0 00 2,38 0 ,0 00 2,40 0 ,0 00(1 - E U 15 d )D L U L C d o t 0,72 0 ,0 16 0 ,1 7 0 ,6 20 0 ,2 1 0 ,5 47R ² 0 .7 46 0 .7 29 0 .7 28
FDI is diverted by higher taxes in the recipient, but attracted by lower taxes in the recipient, compared to its (distance-weighted) competitors
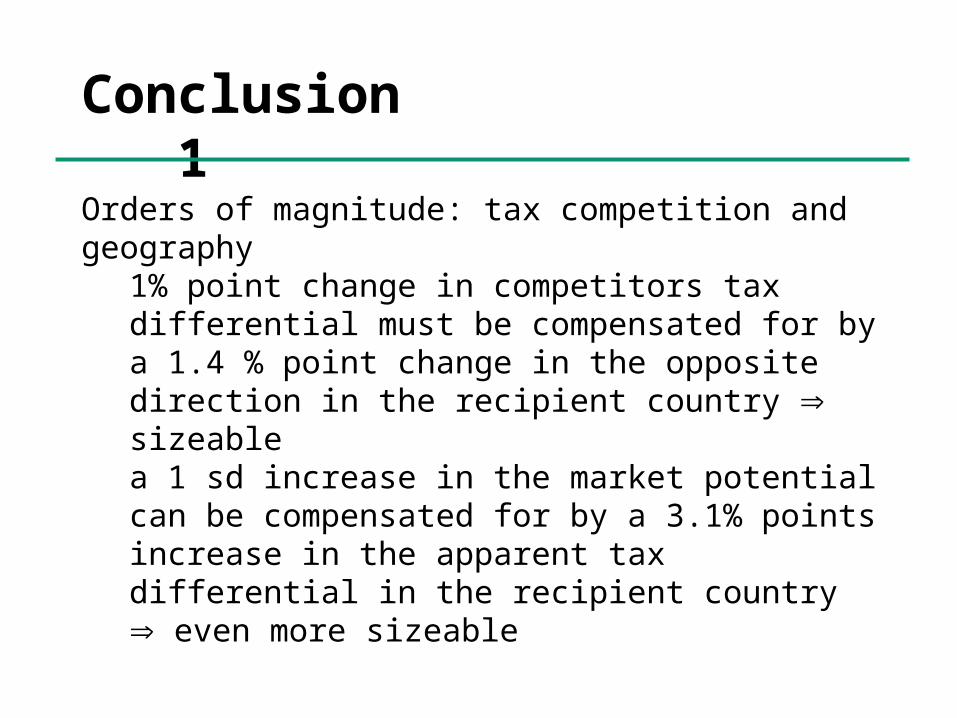
Conclusion1
Orders of magnitude: tax competition and geography
1% point change in competitors tax differential must be compensated for by a 1.4 % point change in the opposite direction in the recipient country sizeablea 1 sd increase in the market potential can be compensated for by a 3.1% points increase in the apparent tax differential in the recipient country even more sizeable