corporate sponsored senior projects 2016 day booklet... · we are pleased to provide this booklet...
TRANSCRIPT

Corporate SponSored
Senior projectS
program
partnerS day2016
IntroductIon
We are pleased to provide this booklet highlighting our fifth year of the corporate Sponsored Senior project program (cSSpp). also included in the booklet are a selected group of this year’s capstone projects from our student teams in computer engineering and electrical engineering working on faculty/student initiated projects.
Students who have participated in our corporate Sponsored program have been provided with a unique opportunity to experience working on real-world projects that involve design, budgets, deadlines, teamwork and reviews with their corporate team mentor. they have come away with a sense of professionalism and pride in their work, learned challenging skills, experienced entrepreneurship and been introduced to the many implications of intellectual property.
throughout this academic year, the students have interacted with their teammates, some have made visits to their corporate sponsor’s worksite and all have solved problems that arose along the way. our students take great pride in their completed projects and all they have accomplished during their time at Uc Santa cruz and the Baskin School of engineering.
We also take great pride in what the students have accomplished. We are very grateful to our corporate sponsors for their willingness to sponsor this year-long program, mentor our students and provide them with challenging projects to work on. and we are very thankful for our wonderful students, who have enriched our lives through their energy, intellect and determination.
Joseph p. Konopelski
deanBaskin School of engineering
2

2
We would like to acknowledge and thank the faculty, teaching assistants, and staff who have been so instrumental in the Corporate Sponsored Senior Project Program:
SenIor deSIgn Faculty
tela FavaloroLecturer, electrical engineering
pat manteydirector, corporate Sponsored Senior project program and associate dean for industry programs
david mundayLecturer, computer engineering
Stephen peterSenSenior Lecturer, electrical engineering
linda werneradjunct professor, computer Science
acknowledgementS
teachIng aSSIStantS
patriCK ayerS teaching assistant
daniel Favateaching assistant
amir pourShaFieeteaching assistant
KongpoSh Sapru
teaching assistant
Program StaFF
tim BenSCh
director of corporate development
liSa CoSCarelliSpecial agreements officer
tim guStaFSonBSoe technical Lead/BSoe Webmaster
angelina gutierrezprogram coordinator/executive assistant, dean’s office
3
liv haSSettassociate campus counsel
FranK howleySenior director of corporate development
JoSeph KonopelSKidean, Baskin School of engineering
maureen mCleandirector of resource planning and Management
ChriStian monnet development engineer, Baskin engineering Lab Support
lynne Sheehannetwork administrator, Facilities/Machine room
anna StuartSenior Budget analyst
BoB vitaledirector of Laboratories and Facilities

SPonSorS
SpeciaL thankS to our sponsors for your generous support of our corporate Sponsored Senior projects program.
your time, experience, and financial support were beneficial to our students and the success of their Senior design projects.
4

5
Capstone Project
Altera is a manufacturer of FPGAs, which was recently acquired by Intel. Currently, Altera is creating a platform for their FPGAs that relieves the CPU of intense computation. The platform contains accelerator modules that can perform computations, such as Fast Fourier Transform (FFT). Inputs for the FFT are routed to the FPGA through PCIe, and the Direct Memory Access (DMA) controller inside the platform routes it accordingly. The goal of our project is to simplify the platform so that the platform uses less FPGA resources. The simplified platform entails us to use the AVF accelerator interface, which is simpler when compared to the original accelerator interface.
Abstract
The first step was to research and analyze each existing platform with their corresponding accelerator. The Virtuoso platform held the FFT accelerator and was the first of the two. Using Virtuoso, a greater understanding of the overall platform was achieved along with the Avalon Streaming interface used with FFT. The NEC lookup demo, the second platform, held the vSwitch DDR3 accelerator that utilized DDR3 RAM, which we modified to use shared RAM resources. Understanding of the existing platform was critical in beginning to design our simplified platform. The goal was to reduce the complexity and only keep what was necessary for operation of the accelerators, as well as to incorporate the AVF accelerator slot interface.
Approach
In order to redesign the platform, we implemented three major modifications in the current design: simplified the platform, added off-chip memory functionality, and created a shared CSR Interface.
Overview
David Munday, Colleen Clare, Marcin Siebert, Abdel Rabi
Acknowledgments
AnalysisTo analyze our design, we will compare and contrast (1) the data transfer performance and (2) the amount of resource usage between Virtuoso Platform, the original design, and our simplified platform. 1. We will test for 40Gb/s data transfers from virtual
machine to FPGA by writing an application for the VM that calculates the time elapsed when sending data to the FPGA. We expect the bandwidth of our simplified design to be comparable to Virtuoso.
2. We will compare the resource usage between the Virtuoso platform and our platform by analyzing the analysis and synthesis resources reports generated by Quartus. The analysis and synthesis resources reports will inform us the amount of LUTs (Lookup Tables), RAM, IP cores, etc. were used in the designs. We expect our simplified design will use less resources than the original design.
Results
ConclusionFPGA virtualization is an exciting, new technology that can change the way CPUs operate by offloading common, intense calculations onto accelerators that are programmed onto FPGAs. As a result, servers with this capability can service their visitors at a much faster rate.
Altera FPGA VirtualizationOscar Guevara, Amy Huang, Aaron Ramirez, Vivian Tong
Original Design
Platform Simplification- We updated the accelerator interface with simple
slot definition, which includes interfaces for TX/RX (data transfers), CSR (configuration), IRQ (interrupts), and MPFE (memory transactions).
- We optimized out modules that are not needed in the simple slot definition. Modules include:- Data Switch module,- Accelerator Library module wrapper, and- Multiplexers on the top level.
- By simplifying the platform, we will have less resource utilization than the original platform.
Memory Path- We updated memory path from accelerator to
off-chip. - Instead of memory transactions going
through Accelerator Management & Monitoring, we created a direct connection from each individual accelerator to Off-chip Memory.
- In order to allow each accelerator to have a direct connection to Off-chip Memory, we incorporated 4 to 1 arbiter in Off-chip Memory module to select between which accelerator gets access to memory.
CSR Interface- We created a shared host and virtual machine
configuration interface port by incorporating 2 to 1 arbiter to select between the configuration buses.
- To identify between host and virtual machine configuration, we set a “privileged” bit to the host bus.
Simplified Design Our design will (1) meet performance and resource utilization requirements, (2) run three different accelerators with (3) with the simple slot interface, and (4) have the platform be as simplified as possible.1. We expect 40Gb/s bandwidth ingress on the FPGA and
less resource utilization than the original design.2. It will be able to run three accelerators: FFT, vSwitch
DDR3, and Diffie Hellman.3. We have updated the accelerator interfaces to match the
simple slot definition. The simple slot interface entails data transfer (TX/RX), configuration (CSR), interrupts (IRQ), and memory (MPFE) interfaces.
4. We removed modules that will not be needed by accelerators with simple slot interfaces.

6
Capstone Project
We have developed an application to facilitate the workflow of healthcare professionals managing workers’ compensation insurance claims. Through the use of the OpenEars and PocketSphinx plugins for iOS and Android respectively, we allow users to verbally log notes of their activities with their clients. Firebase is used as the backend service to provide robust and secure synchronization of our database.
Abstract
● Research available open-source offline voice recognition software for iOS and Android.
● Use Firebase as backend service to store the notes the users take when interacting with a client.
● Create intuitive workflow for EK Health professionals to manage multiple cases simultaneously.
● Follow mobile interface standards for both Android and iOS, while keeping the design similar enough between platforms that switching from one to another is simple.
● Ensure that voice recognition works while offline, and that data stored offline is backed up on the server when the connection is available once again.
● Keep locally-stored data and that which is passed to the server confidential.
● Keep within the boundaries of what claim information we are legally allowed to access.
Approach
The workflow of the application is pictured below. The login screen requests user credentials, and upon successful authentication, the user is taken to the claim list. Tap on a claim to transition to a detailed view that shows the notes and contacts regarding that claim.
EK Voice Workflow Diagram
● Dr. Linda Werner, faculty advisor, UCSC ● Dr. Paulo Franca, Chief Technology Officer, DataCare Corporation● Alex Embrey, Software Engineer, DataCare Corporation● Kongposh Sapru, Graduate Teaching Assistant, UCSC● Robin Singh, team member for winter quarter, UCSC
Acknowledgments
Results● A fully-functioning application for both the iOS and
Android platforms which is designed to the specifications.● An application that is easy to use and aesthetically
pleasing.● An application that provides both offline and online
speech-to-text translation.● An application that communicates via JSON files to
Firebase.● The iOS application provides security of access via
thumbprint recognition.
ConclusionBy creating a voice module plugin with offline storage capabilities as a mobile application for EK Health, we hope to help healthcare professionals work in any physical location, with or without network connectivity. We have created an application with a modular design, allowing software engineers at DataCare to easily enhance the application when improved offline voice modules are available in the open-source community.
EK VoiceGeorge Azpeitia, Marcos Chabolla, Kalpana Chinnappan, Lou George, Octavio Rodriguez, Venkata Karthik Thota
DataCare Server
Push
PullFirebase
EK Voice Architecture
Future● Usability testing with healthcare professionals in the
field is needed.● Use live data from the DataCare server instead of the
test data we have been using.● Ensure data being sent to both Firebase and the
DataCare server is coming from a verified source.Firebase
Push
Pull
Technologies Used● Git - For project version control● Open Source Libraries - SwiftyJSON,
PagingMenuController, and FoldingCell● Xcode - iOS Development Environment● Android Studio - Android Development Environment● Sphinx - Speech-to-Text API for Android, allows for
offline and online capabilities.● OpenEars - Speech-to-Text API for iOS, allows for
offline and online capabilities● Swift - iOS backend language.● Java - Android backend language.● Firebase - Cloud-based storage which allows for
secure data synchronization between the application and DataCare servers.
● Slack - Team communication tool.
The mobile application is directly connected to the Firebase database and will automatically synchronize the information persistently when connected to internet and synchronize immediately when Internet is available. DataCare engineers can pull from Firebase fetching the updated case information and push data to Firebase to keep case information synchronized.
NOTES DETAIL
Swipe
ADD NOTEEXPANDED CONTACT
CLIENT LIST CONTACT LIST NOTES LIST

7
Capstone Project
Key: Value
t
Overview
Carson Gross, Project Mentor, Guidewire Software Inc.
Kongposh Sapru, Graduate Teaching Assistant, UCSC
Professor Linda Werner, Faculty Advisor, UCSC
*Ashley Rocha was a team member for Winter 2016.
Acknowledgments
Alvaro Gomez, Curtis Liew, Remington Maxwell, Sachin
Patel, Ashley Rocha*, Michael Stirchak
<type> ::=
<core_types> |
<array_type> |
<enum_type> |
<struct_type> |
<core_types> ::=
'"@string"' |
'"@boolean"' |
'"@date"' |
'"@uri"' |
'"@int"' |
'"@number"' |
'"*"'
<array_type> ::=
'[' <type> ']'
<enum_type> ::=
'[' <string> ','
<string> <strings> ']'
<strings> ::=
'' |
',' <string> <strings>
<struct_type> ::=
'{' <props> '}'
<props> ::=
<prop> |
<prop> ',' <props>
<prop> ::=
<string> ':' <type>
JSchema GrammarJSchema Tools
Usage
JSON
JSON → JSchema Transformer
Key: Value
JSchema
JSchema → Java Transformer
JSchema → JavaScript Transformer
parse()
toJSON()
validate(strict)
JavaScript Object
parse()
toJSON()
get()
set()
Java Object
The growth of the Internet has resulted in the daily transaction of vast amounts of data, often in
convoluted and unintuitive formats. Examples of such complexity can be found in even basic JSON
documents, where huge amounts of disparate data types can be packed together. Although JSON is the
most common format for browser/server data transfers, it is often difficult to manipulate JSON data
depending on the user's framework. Even worse, JSON documents are analyzed differently when used
by different frameworks. As online commerce continues to grow, dealing with these documents becomes
increasingly unavoidable. To that end, we have developed code generation tools for an implemented
schema that is cross-platform and homoiconic with its corresponding JSON document. These features
work to generalize and simplify the use of JSON documents in software development.
For full specifications of JSchema, visit jschema.org.
Java Example
JavaScript Example
JSON Example
AbstractThe purpose of this project was to develop reference
implementations for a specification designed for use
with JSON documents. The specification, JSchema, is a
subset of the JSON grammar that allows developers to
express data models in a way that is clear and strongly
typed. With this existing specification as our base, we
implemented code generation tools that transform an
input JSchema document into properly formatted code
that reflects the data model of the JSchema. These
code generators were written in JavaScript so that they
could be hosted online. Finally, we developed a
transformer to create valid JSchema documents from
raw JSON files to help developers adopt JSchema as
quickly as possible.
Approach
For the Java generator, we created a parser that loops
through the JSchema values and returns the
corresponding Java type (See JSchema Grammar).
Because Java is strongly-typed, a validation method
was unnecessary.
For the JavaScript generator, the JSchema values were
parsed similarly, but a validation method was necessary
because JavaScript is dynamically-typed.
The JSON-to-JSchema transformer analyzed the value
types in the JSON and returned the correct JSchema.
There is also an option for the user to decide if a value
of type array is an enum type.
The JSON-to-JSchema transformer are hosted online at
jschema.org/tools; the Java code generator is published
using Spark Java.
Development Processes
Slack Asana Hangouts
Java
Javascript
Nashorn JS IntelliJ IDEA
GitHub
JUnit
End to End TestsAgile Scrum

8
Capstone Project
The objectives of this project are to assemble andbenchmark a functional RDMA based network protocolstack for implementing NVMe over Fabrics. NVMe overFabrics is a standardized solution for efficient access tofabric attached non-volatile memory [1]. The stackprovides high throughput transfers with low CPUutilization to be ported to Hewlett Packard Enterprise’s3Par storage systems. To benchmark the servers, wecreated a custom test suite that determined read andwrite performance. From the results, we conclude thiswill eliminate the network stack as a bottleneck inaccessing remote NVMe storage.
Abstract
Functional Protocol Stack
Results Testing MethodologyTest suite:● FIO and the ib_send_* family of commands run by
Python benchmarking framework● Data results were automatically parsed and output to
CSV files, allowing for easy graph creation.● FIO was used to test nbdX and local ramdisk
sequential and random read/write speeds, collected in the form of IOPS, bandwidth, and transfer latency.
● A ramdisk was used on the server to emulate a fast storage device because we did not have access to a suitable NVMe SSD.
Data gathered:● Bandwidth/Latency of RoCE connection● Bandwidth/Latency/IOPS of nbdX device and local
ramdisk
NVMe Over FabricsJohn Gemignani, Coy Humphrey, Eric Litvinsky,
Jayden Navarro, Alice Yu, Kevin Cheng⃰
nbdX
Accelio
RoCE v2 (RDMA over Converged Ethernet)
Converged Ethernet
HP FDR Ethernet Card/Infiniband QSFP+ Interface
We would like to thank:● Samuel Fineberg, Ph.D., Distinguished Technologist,
Storage Chief Technologist Office at Hewlett Packard Enterprise
● Dr. Linda Werner, Ph.D., Faculty Advisor, UCSC● Daniel Fava, Graduate Teaching Assistant, UCSC● Hewlett Packard Enterprise for the hardware and
support provided⃰ Participated in the first half of the project
Acknowledgments
ConclusionThrough our benchmarking, we have found that the current nbdX technology was able to perform well compared to a local ramdisk in terms of IOPS, throughput, and latency. In terms of overall use, we found nbdX to suffer from many of the pitfalls that are commonly seen in emerging technologies, such as stability issues and a lack of edge case handling. A new driver is due to be released in the coming months by the NVMe over Fabrics Consortium, and is foreseen to replace the current nbdX software. The new driver is expected to improve the reliability of the technology. With increased stability from the new driver; Accelio supported networks should benefit from lower CPU utilization, faster data transfers, and lower latency compared to their non-RDMA equivalent infrastructures.
We believe that the current technology shows promise in terms of its ideal benchmarking results. We were impressed by the achieved IOPS, bandwidth, and consistently low CPU utilization (< 25%). With the advent of faster NVMe attached SSD; Accelio based data-center network technologies should be able to support transfers at near local PCIe throughput and latency, eliminating the current network bottleneck.
Analysis
Graph 1: nbdX was able to yield > 250,000 4K IOPS on 32, 64, and 128 IO depths. Compared to the ~100,000 4K IOPS of NVMe attached drives, the network stack will not be the IOPS bottleneck for remote transfers.
Graph 2: On large block sizes, nbdX performed close to our maximum link speed (37 Gb/s). Compared to the ~8.0 Gb/s transfer speeds of NVMe attached drives, the network stack will not be the throughput bottleneck for remote transfers.
Graph 3: For the tested block sizes and IO depths, nbdX performed within the expected latency range of remote transfer protocols.
■ Network block device over Accelioframework
■ Presented as a regular storage block device on the local system
■ Pre-specification version of NVMe over Fabrics
■ Library for high-performance asynchronous IO using RDMA
■ Provides Zero-copy data delivery■ Designed for multi-core CPUs and
multi-threaded applications
■ Remote Direct Memory Access (RDMA) is capable of allowing server to server data movement management with minimal CPU involvement
■ Provides a lossless connection on top of the Ethernet protocol by implementing the Data center bridging enhancements (DCB) to the Ethernet standard.
■ Bridges, converges, and controls the flow of multiple classes of traffic over an Ethernet network
■ Hardware support for RDMA■ Interconnect system for the I/O ports
that supports 40Gb Ethernet
[1] SNIA Ethernet Storage Forum http://www.snia.org/sites/default/files/ESF/NVMe_Under_Hood_12_15_Final2.pdf
References
050000
100000150000200000250000300000
4K Block Size 32K Block Size 64K Block Size 128K Block Size
IOPS
IOPS
1 IO Depth32 IO Depth64 IO Depth128 IO Depth
05
10152025303540
4K Block Size 32K Block Size 64K Block Size 128K Block Size
Read
Ban
dwid
th (i
n G
b/s)
Bandwidth
1 IO Depth32 IO Depth64 IO Depth128 IO DepthLink Speed
02468
10121416
4K Block Size 32K Block Size 64K Block Size 128K Block Size
Read
Lat
ency
Avg
(ms)
Latency
1 IO Depth32 IO Depth64 IO Depth128 IO Depth

9
Capstone Project
In modern distributed computing systems, data processing performance are bounded by the I/O bandwidth rather than CPU performance. As a complementary solution to developing lower latency and higher bandwidth communication channels between compute and storage, data can also be compressed before being sent on these channels to improve the apparent bandwidth. Although software compression algorithms may be used to encode data, a hardware compression algorithm can provide a relative speedup in compression time or even a decrease in power consumption in comparison. Our project makes use of Xilinx ZC706 Board with Zynq System On Chip, where an ARM processor and FPGA are integrated together. With this is we are able to establish a “Zero Copy” operation, where our processor is not required to waste cycles copying data from one memory area to another. This is done by letting the processor send the starting addresses of the data to be compressed to the FPGA, and the data is then sent directly to the destination memory location. The FPGA also provides the ability to create quick hardware prototypes for our compression algorithms, which isn’t doable on an ASIC.
Abstract
The first couple weeks of this project was dedicated to researching an algorithm that would be best for our project as well as something that was interesting to the group. After weeks of researching, we felt that LZ4 and DEFLATE were the best candidates to implement for our project. Ultimately, DEFLATE was chosen due to its good balance between compression speed with decent compression ratio. LZ4 had a very fast compression, but its compression ratio was not very impressive. We also chose DEFLATE because it is used in GZIP compression which is a very well known compression format. DEFLATE is a compression algorithm that was first designed by Phil Katz in the early 90’s. This compression algorithm combines two other algorithms to better optimize the compression ratio, LZ77 and Huffman coding. It first uses the LZ77 compression algorithm to compress the file character before sending it to the Huffman Coding algorithm which will also compress the LZ77 compressed characters. Figure 1 shows a general flow of the compression algorithm.
Both LZ77 and Huffman Coding are pipelined in our design such that as characters are compressed by LZ77, they are immediately sent to Huffman for compression.
Approach
Overview
We would like to thank the following individuals for their supervision and support:
Our mentors David A. Munday and Patrick Ayers from UC Santa Cruz
Our advisors Vincent Lee, Jon Lexau, Navaneeth Jamadagni, Ji Eun Jang, and Hesam Moghadam of the Oracle Corporation
Acknowledgments
Analysis Our design needs the following benchmarks for analysis:
• Compression Time
• Compression Ratio
• Power Consumption
To obtain a benchmark for the compression time, the amount of clock cycles passed during our compression would need to be counted. This is done by creating a counter that increments by one every clock cycle. Taking this counter value and multiplying it by our period will give us our compression time. The compression ratio is taken by dividing the compressed file size, in bytes, and dividing it by the original file size, where a smaller ratio means more compression. Lastly, the power is determined by the Vivado IDE, as a power estimate is given once our design has been fully implemented.
Results In order to see how our compression measures up, we used files from Calgary Corpus, which is the standard to see how efficient compression is. In the process of putting our compression engine together, we noticed that our theoretical simulation times for compressions of the following files were as follows in Table 1.
We know that our compression engine takes an average of 6 cycles per each character to be output as compressed output. We are running the above results at a frequency of 100Mhz.
Conclusion Our design will be able to show that a “Zero Copy” compression engine is obtainable using the Zynq architecture. Data addresses will be sent to our DELATE compression engine, characters will be read into the engine, and data will be sent into a shared memory. The FPGA has proven to be a useful prototyping tool when testing hardware designs, as many iterations of our compression design can be implemented and tested whenever we need to.
Oracle FPGA Compression Reynaldo Fajardo · Nirmal Murugesan · Steven Santiago
Figure 1: General Flow of the DEFLATE Compression
Files Size (kB) Simulation Time (s) book1 768.8 0.046
bib 111.3 0.007 pic 513.2 0.030
news 377.1 0.023 obj2 246.8 0.015
paper1 53.2 0.003 paper4 13.3 0.0008
LZ77 Compression
LZ77 compression is a dictionary based algorithm that has two tables. Essentially, characters are fed one a time into the look ahead buffer which then searches the 1024 byte dictionary to see if there is a match for the character. The dictionary will then return all the locations of where there is a match and it will start to extend the search to see if there is a multiple character match in the dictionary since the minimum match must be at least three characters and no more than ten characters. If the extended match is less then 3 characters, or if there was no match at all, then character are stored into the dictionary and are then sent to Huffman Compression. If there was a successful match of three characters or more, the match will be “compressed” in the form of <length,distance> where length is how many characters to match and distance is how far back in the dictionary to jump. Figure 2 is an example of how the length and distance are stored.
The compression is then sent to the Huffman Compression, where it will wait before being sent to DDR. The LZ77 compressed values will not be compressed by Huffman, only the values that were not compressed by LZ77 will be compressed by Huffman. Figure 3 is the top level block diagram for the LZ77 compression.
Huffman Compression
Huffman is a form of variable length encoding that analyzes the character’s frequency and through this a tree is created with various nodes as the characters that appear in the stream. The way the tree is created is that it starts off with the two least frequent characters as the first branches of a single node. This will indicate that these letters will have their last bit encoded as a ‘0’ or ‘1’. These two character frequencies are then added together and the next least frequent character from the analyzed character frequency table is added to the tree in the same manner. This process is continued until all the characters are encoded into this tree. Our implementation has a static Huffman tree which is built into the Huffman module in a RAM. Figure 4 shows an example of a simple Huffman Tree with its unique Huffman encodings.
DEFLATE Compression
Deflate essentially combines LZ77 compression and Huffman compression and send it off to DDR to store in memory. Figure 5 is a top level block diagram of the entire DEFLATE compression.
Figure 2: LZ77 jump and distance example
Figure 3: LZ77 Top Level Block Diagram
Table 1: Simulation times for Calgary Corpus Files
Figure 4: Huffman Tree example
Figure 5: DEFLATE Top Level Block Diagram

10
Capstone Project
Digital Enhanced Cordless Telecommunications (DECT) is a radio protocol used to establish wireless communication between a headset and a base in a cordless phone system. It is employed by Plantronics products due to its ability to handle heavy phone traffic and maintain a reliable connection. To ensure the quality in Plantronics DECT products, all units are tested during production before they reach the consumers.
During production, the RF signals are tested to ensure they are within the DECT specification. Currently, Plantronics uses a testing system called the CMD60. However, this instrument was developed over 20 years ago, and units fail frequently.
We developed a replacement system to analyze the RF parameters of DECT units. Because these tests are run in a production setting, the system must be fast, accurate, and easy to use.
Abstract
The test system we developed will be used in a production setting, and will test thousands of units per day. This requires the tests to be fast and accurate. Plantronics’ main programming environment for test system development is LabVIEW, therefore we used it to develop our test and control software.
This system requires an analog-to-digital converter that can capture high-frequency RF signals and process them quickly. We explored two instruments, the real time Spectrum Analyzer 306 (RSA 306) developed by Tektronix, and the NI Digitizer 5133 developed by National Instruments.
We developed two systems, one to work with each instrument to evaluate the performance between both systems.
Approach
The radio of the device under test (DUT) must be tested for both transmit and receive quality. Additionally, we must test the clock frequency of the DUTs processor. We must develop the following transmit tests:
● Frequency offset: ensures signal is on the correct channel.
● Power test: tests the signal strength. ● Frequency deviation: test that the signal is being
modulated correctly. ● Frequency drift test: checks that the signal is stable.
Overview
Warren Kruth, Luis Garcia and Rick Frier from Plantronics for being helpful sponsors throughout the project. Prof. Steven Petersen and T.A. Amir Pourshafiee for support and advice on engineering processes. Photo credits: Fig. 1: https://www.keisokuki-world.jp/, Fig. 2: http://sine.ni.com/, Fig. 3: https://www.plantronics.com
Acknowledgments
Analysis/Results To test our systems, we wrote an automatic data collecting program to continuously test data. This program records a data point for each test, cycling through all channels and all power levels. We used this to collect a large pool of data to evaluate our system accuracy and test time. This way we could confirm our system operates correctly for all test configurations.
From our data collection, we averaged our data points and quantified our results for both the RSA 306 and Digitizer system. We also gathered data samples from the CMD60. Below are our results, which were taken on DECT channel 5 at medium high power.
During initial testing, the RSA306 system results were slightly more comparable to the CMD60 than the Digitizer system for the modulation deviation and offset measurements. The NI Digitizer yielded more reliable power measurements. The results for the frequency drift test were inconclusive, as this measurements varies with time for all systems. However, both systems took measurements that were very similar to those from the CMD60. These tests were done using a Plantronics DECT base, which is a non-ideal DUT. Further testing using a signal generator that can output DECT signals will further confirm the accuracy of both systems.
We developed two systems, one that uses RSA306 and another that user NI Digitizer 5133. Our systems use the NI Digitizer/RSA 306 to digitize the RF data from the DUT, which is sent to the PC and processed to make test measurements. We wrote our control software sets the DUT to the correct DECT settings, controls the NI Digitizer/RSA 306 and other peripheral hardware, and runs test software to compute the test measurements. Our block diagram is shown in Fig. 4.
Conclusion In conclusion, we have developed two reliable replacements for the CMD60. More measurements with an ideal DUT are required to further analyze the accuracy of both systems. However, our initial test trials give us confidence that our systems will give desirable results, using both an ideal signal generator and Plantronics base units as DUTs.
DECT Radio Tester Replacement Sierra Catelani, Yoo Hwan Cho, Felipe Contreras, Tyler Condon,
Matthew Henry, Juliana Hernandez, Maria Hovanessian, Sergio Lopez, Khant Zaw
● The RSA 306 captures data at a very fast rate which is useful for capturing fast RF signals. It has internalized hardware to capture signals at high frequency ranges. ● The digitized data from
the RSA 306 is processed in Signal-Vu, a strong signal processing program that has RF measurement capabilities.
● The NI Digitizer is directly compatible with LabVIEW, The making it easy to interface with our test software.. ● It samples at 100MS/s,
which is not fast enough to capture the 1.9GHz signal. The signal must first be passed through a down-conversion stage. We set it to 5MHz to get 20 sample points per bit.
Fig. 1 - RSA 306 Fig. 2 – NI Digitizer
DUT: Device under test. DECT Headset or Base unit
Golden Radio: Device used to measure BER.
RF Interface Board: Maintains communication between DUT and Golden Radio for the bit error rate (BER) to measure the DUT’s receiver quality. The board attenuates signals coming from the Golden Radio, to test if the DUT can receive low power signals.
Down Converter: Converts the DECT signals to 5MHz. PC controls the board to keep the signal at 5MHz.
RF Capture Instrument: (NI Digitizer/RSA306) Captures and Digitizes DECT signals. Controlled by Data Processing Software.
Test Software: Controls NI Scope/Signal-Vu to collect data points and compute test measurements.
Data Processing Program: (NI Scope/SignalVU) Controls the NI Digitizer/RSA 306 to capture and process the digitized DECT signal. Transmits data points to test software to compute RF measurements.
DECT is used to transfer audio information between a headset and base unit. There are 10 channels designated to the DECT protocol, operating near 1.9GHz. Our system must be able to test the unit on any of these channels. The DUT can output signals at to capture various strengths, so the system must be able to analyze various power levels.
Frequency Counter: Used to measure clock frequency of DUT.
The Tests The DECT Device Under Test (DUT)
The System
Control Software 1. DUT is set to the correct DECT channel
and power level, specified by the user. 2. Hardware is calibrated to run tests
correctly: 3. Test software is run.
4. Once results are available, they are displayed on the screen.
Fig. 4 – Block diagram of the NI Digitizer/RSA306 system.
Fig. 3 – Device under test (DUT)

10 11

12
Capstone Project
The Seagate Kinetic Open Storage project is an open source project that hopes to provide an easy solution to storing data. A kinetic device is essentially a hard drive attached to a microprocessor with ethernet connectivity. Using a key--value pair, a client, via an ethernet connects can store their data as an object to a kinetic device.
Currently there are two areas that the kinetic project can be expanded. The current Kinetic implementation only stores data on one file location. This is fine for one hard drive, however there are many cases where one cpu stores data on multiple hard drives for performance reasons as well as to increase reliability. Kinetic also does not have a consumer friendly way of storing data. Currently storage requests are done through either java or python methods where the key and the value must be defined by the user. Most users do not know coding languages so they may have issues storing their data on a kinetic based server. Our group decided to provide solutions for both of these in order to make Kinetic more robust and user friendly. One half of our team has been working on expanding Kinetic to work with more than one hard drive, while the other half will be working on providing a user friendly solution to storing data on a Kinetic storage server.
AbstractControllerDynamo Ring •LevelDB instance of each hard drive •Hashable to locations on the ring •Stored to closes DB on ring clockwise •Easy to add instances once implementedHinted Handoff •Protects against drive failures •Transient drive failuresKinetic API
User InterfaceObject Fragmentation •Supports files larger than 1MB •1 MB hunks of byte arrays/buffers •Needs key to rebuildJSON and RESTful Web •Dictionary format •Organizes fragmentation chunks with keysKey Schema • user.filename.iteration •If Master key JSON file gets to big, create a like linked list of master keys
Approach
Overview
The team wants to thank Timothy Feldman, Chiaming Yang, and James Devore from Seagate for providing us with guidance on Kinetic. We would also like to thank Patrick Mantey for being the project mentor and helping us complete the project.
Acknowledgments
ConclusionWe were able to develop a application to optimize to use of Seagates Kinetic device and API, allowing users to see over to code and use the device and archival storage. Meanwhile our controller team developed a means of sorting data over multiple Kinetic devices.
Seagate Kinetic Storage DeviceJustin Bates, Ben D’Costa, Lovejit Mundi,Rahul Patel, Jason Zhao, Weibin Zhong
Kinetic API
PUT GET DELETE
Options:delete -
syncdelete - async
Options:getPrevious
getNextgetRangeget - sync
get - async
Options:putForcedput - sync
put - async
Technologies
Web Application
Kinetic Benefits● Performance - Eliminates a significant amount of drive I/O that moves no data but rather represents metadata and
file system-related overhead
● Scalability - Optimized for explosive-growth, scale-out data centers
● Simplicity - APIs are designed to enable rapid integration into a wide variety of storage software applications
● TCO - Lower Capital Expenditure, Labor, Power consumption, and Uptime/technician error
● Security - Authentication, Integrity, Authorization,Transport Layer Security(TLS)

12 13
Capstone Project
In the solar power world, companies run high-voltage, high-current systems in excess of a megawatt. There are many places in between a solar panel and the power grid where a connection can fail. A failed connection under these circumstances can create an arc that continuously builds up and is capable of burning down entire buildings. To compensate for this, many balance-of-system companies have been trying to create an arc-fault detection and circuit interruption device, which detects if a connection has failed, and shuts the system off accordingly. We have teamed up with the engineers at SolarBOS to design this board.
Abstract
To solve this problem, we utilized methods of digital signal processing, filtering, and various detection algorithms. We made use of CAD Tools for board design, using Eagle specifically. We decided on using Microchip’s PIC32, the XC32 compiler, and their MPLabX IDE to code the microcontroller.
Approach
Overview
We would like to give our sincerest thanks to SolarBOS, without whom this project would not have been possible, and who have provided us with the tremendous support and freedom needed to create the best product possible. We also wish to mention our faculty representatives, Stephen Petersen and Amir Pourshafiee, as well as anyone else involved in making the entire UCSC Senior Design Project program a success.
Acknowledgments
Analysis A digital signal processing algorithm constantly gathers, processes, and analyzes the data from the system in order to detect arc-faults, which the microcontroller then responds to by interrupting the faulty connection by flipping a contactor, interrupting the entire circuit. It then waits until a technician checks and resets the connection, then reactivates the contactor to allow power to continue flowing. This process happens autonomously, allowing for a solar installation to be protected at every hour of every day, while technicians can look at the collected data and diagnostics to determine which systems are most at-risk.
Using several diodes in a bridge rectifier configuration to allow for reverse-polarity operation, as well as other diodes providing further protection from voltage surges, it is capable of operating in a wide range of electrical configurations while simultaneously protecting itself, and what it is connected to, from harm.
By utilizing additional storage in the form of a removable SD card, the resulting design allows for data to be stored in a large and rewritable flash memory that persists even in the event of a system power loss.
Results When installed in a system, the AFCI board can monitor for arc-faults and interrupt the circuit as needed. It is capable of being programmed conventionally at the factory, while a technician in the field can access important functionality quickly and efficiently by making use of the onboard interface. It can be programmed either via direct computer connection, or by using a bootloader installed on a USB flash memory stick, thanks to its USB On-The-Go hardware.
Future versions of the board will also have room to expand without having to undergo major core design revisions due to the layout and number of excess GPIO pins, which can accommodate several new modules using the existing microcontroller.
Currently future plans include options to add wireless capabilities, eliminating the need to run miles of wires for 2-wire monitoring. Wireless also adds the possibility of programming wirelessly from a phone.
Conclusion SolarBOS now has a functioning arc-fault detection and circuit interruption board that not only shuts down the system when an arc fault is detected, it also provides various additional features that provide added value and utility to customers and technicians. The board is only a small part of an installation’s size and cost, yet serves to protect the whole system.
The board contains many auxillary features to make the installer’s and technicians lives much simpler. The OLED/Rotary Encoder interface allows easy configuration, similar to a modern car radio. The board also contains monitoring data on the SD card, in case an engineer was wondering what exactly were the conditions when the board tripped.
SolarBOS AFCI Board Alina Armour, Nick DiPietro, Tyler Nepote,
Joseph Parsons, Mariette Souppe
Filtering (2) The noise signal then goes through an anti-aliasing filter. This filter is set to filter out any signals above 100kHz, which is the noise range we sample at to reduce cross talk from the inverter and other systems on a solar setup. This is the second step in the arc detection process.
Detection Algorithms (4) After the various monitoring and processing tasks are ran, the board then starts analyzing the data in an attempt to detect an arc. Present and previous current and noise data are run through a series of algorithms which mainly deal with differences between the data just collected, and previously collected data. To detect an arc on a solar system, it is fairly challenging, since normally one would attempt to detect the arc using just high noise measurements, however on a solar system this can be anything from an inverter to a cloud passing over. So these algorithms look for the lack of certain conditions, such as conditions that signify a cloud combined with conditions that look like an arc. If all these conditions are met, a flag is raised in the software, the relay is tripped, and the contactor is shut off which shuts off the entire circuit, stopping the arc.
Digital Signal Processing (3) Digital signal processing is necessary to convert the data collected by the board sensors into the Fourier Domain. The data is windowed using the Hann Windowing Method and then the Fast Fourier Transform algorithm is computed. These processed signals are then used in a series of detection algorithms. This is the third step of the arc detection process.
PIC32 A new microcontroller was selected for the board. The previous micro controller had limitations in memory and speed. The PIC32 was chosen for its improvements in these areas as well as its low cost and expandability for possible future additions to the board.
Board Design By using a four-layer board, the physical dimensions and number of vias were able to be reduced, while every ground and power pin has a dedicated connection to its corresponding copper plane with a minimized trace length.
Development Board Selection To bide the time between obtaining our own board from a manufacturer, we decided to use a PIC32 Development board, more specifically, the Digilent Uno32 Development Board together with a Pickit 3 to program it. This board has an FTDI Chip to USB converter for easy setup of terminal use, and access to almost all of the PIC’s various ports and special pins.
Current Monitoring (1) After the current goes through the fuseholders, the current reading is picked up by a Hall Effect LEM Sensor. We use this data in both our detection algorithms and to report data to an online monitoring site (Below).
Noise Monitoring (1) Here the two positive current signals go through a current transducer. This is an AC signal current transducer, yet the positive current signals coming from the solar panel are DC signals. Any ripple (noise) in the DC signal is picked up by the current transducer. This is the first step in the arc detection process.
Contactor Relay We use a 24V powered relay to switch the contactor (Pictured Right) on or off. The contactor controls the entire power flow of the solar system and will break the entire flow of electricity.
Modbus Communication To push monitored data to a server, we use the modbus communication protocol. This is a 2-wire with shield connector. We use modbus to communicate with a data acquisition unit (Pictured Left), which samples all the modbus modules on its circuit. It will then push all that data up to a server through ethernet.

14
Capstone Project
Haxe is an open source toolkit based on a modern, high level, strictly typed programming language which makes it possible to compile to multiple platforms, and emit code in multiple languages. The main purpose of this project is to add functionality to the Haxe C++ Debugger, allowing users to set breakpoints within nested expressions, in the style of Java’s JDB. This functionality was also implemented in the IntelliJ IDEA plugin for Haxe.
The outcome of this project is additional functionality currently not present in any other open source C++ debugger. Additionally, the IDE plugin offers features unavailable in other IDE debuggers. Completing the task required writing additions to the Haxe compiler and C++ debugger. To showcase the value of the language, a Haxe application was created with the ability to be run on multiple platforms.
Abstract
Haxe, Java, C++HXCPP − Module that transpiles Haxe to C++HXCPP-Debugger − Module that supplies the Command Line Interface for debuggingOCaml − The language of the Haxe CompilerIntelliJ IDEA − Multiplatform IDEIntelliJ Plugin SDK − SDK for extending InteiliJ IDEAGithub − A web-based Git repository hosting serviceScrum − Agile software development methodology
Technologies andMethodologies
There are three layers to the command-line implementation of this debugger (shown to the right), all of which have been modified: the Haxe compiler (Haxe), the Haxe C++ library (hxcpp), and the Haxe C++ debugger library (hxcpp-debugger).
When targeted to C++ and with debug options specified, the Haxe compiler will embed macros denoting the Haxe source line number of the next instruction into the emitted C++ code. This will be used by the debugger to inform the user of the current location of execution and to allow the user to specify a breakpoint.
We deciphered the OCaml source of the Haxe compiler and identified the point in which the macro was emitted. The macro itself then had to be changed to set both the stack frame’s line number and column number. Additionally, a column number field was added to the stack frame data structure. Every function that had a line number as a parameter was given a column number as well.
Architecture
Conclusion● Haxe’s C++ debugger can now set breakpoints on
both line numbers and column numbers● Both IntelliJ and command-line interfaces available● Breakpoints can now be set on any function in a line● Users can run execution to either the next line or the
next expression in a line, removing guesswork and adding a higher degree of control
● These improvements allow users to debug more efficiently and to gain a higher understanding of their program’s execution
Acknowledgments● Alfred Barberena, TiVo● Eric Bishton, TiVo● Bryan Ischo, TiVo● Srikanth Ganapavarapu, TiVo● Linda Werner, Ph.D., UCSC ● Daniel Fava, UCSC
Haxe Compiler/DebuggerRyan Coley, John Hynes, Sean McGrath,
Tim Mertogul, Michael Vincent
Implementation
HAXE
Thread 0 stopped in Queens.main() at Queens.hx:5:5.1: [Queens.hx] $ > break 35:11Breakpoint 1 set and enabled.2: [Queens.hx] $ > break 37Breakpoint 2 set and enabled.3: [Queens.hx] $ > continueThread 0 stopped in Queens.main() at Queens.hx:35:11.4: [Queens.hx] $ > nextLineQueens.hx:35: 5Thread 0 stopped in Queens.main() at Queens.hx:36:5.5: [Queens.hx] $ > continueThread 0 stopped in Queens.main() at Queens.hx:37:19.6: [Queens.hx] $ > whereThread 0 (stopped in breakpoint 2):* 0 : Queens.main() at Queens.hx:37:197: [Queens.hx] $ > list all breakpointsNumber | E/d | M | Description1 E Queens.hx:35:112 E Queens.hx:37
The Haxe compiler builds a Haxe C++ application using hxcpp. When the debug flag is specified, the application will run alongside a debugger thread, which controls the flow of execution. IntelliJ and the command line debugger interact with the program via the haxe plugin and hxcpp-debugger module, respectively.
The hxcpp-debugger also provides some of the functionality necessary for the IntelliJ-hxcpp bridge JavaProtocol, to relay execution and debugging information between the two.
Command-line Debugger
Once column number functionality was implemented, we added the logic necessary to allow Haxe to break on column numbers. The function responsible for this was modified to check for both a column number and line number match when returning a breakpoint. With this change, not only are users able to break on nested functions, but also step through nested functions as well. This is demonstrated in the upper-right-hand figure showing an example of a command-line debugger run Note that current positions and breakpoints are denoted in the format of <line number>:<column number>. The final feature we implemented was a change to the ‘next’ command, giving users the option to run execution to the next line of instruction.
The next phase of the project was to bring this ability to break on nested functions within IntelliJ IDEA (shown above). This primarily involved modifying the protocol bridge between the debugger thread and the IDE, requiring the addition of similar column number references which corresponded to the changes we had made to hxcpp-debugger. With these changes it is now possible to set a breakpoint at the beginning of any nested expression within IntelliJ (shown above). When this option is selected, execution will run to either the next set breakpoint, or to the position of the cursor.

14 15
Capstone Project
ResultsThe UI Builder consists of a series of views that constitute
the main functionality. The functionality of the UI Builder canbe described by looking at its views.● List of Forms: An interactive directory of all created forms. ● Editor: Allows for creation and editing of forms. Its grouping
ability and custom Form Elements allows for scalability.● Preview: Shows the creator the final results so that they
can see what their users will be seeing.● Runtime: Allows users to fill out or answer forms that have
been created with the Editor view of the UI Builder.● Grid of Results: Gives creators a grid of all of the data
collected from users that have filled out a specified form.● Individual Results: Allows creators to view data collected
by an individual user's results.
OverviewThe UI Builder is an easy to use tool that helps create interactive forms or interfaces using a set of pre-built form
fields. Our project includes the ability to extend the list of pre-built form fields using Custom Form Elements by following a predefined convention. In addition to custom elements, the grouping feature of our UI Builder makes it even easier to consolidate similar data. This flexibility is what makes the UI Builder extensive and ideal for many different scenarios. We are able to track multiple types of information in one form through our grouping feature. Our grouping feature allows managers to collect private data as well as secondary information from the same form.
Suppose a company is holding a conference, and needs to gather information from attendees for planning purposes. This information can range anywhere from confidential to public workshop information. In this scenario, managers can create a new form and use the grouping feature to group the confidential information separately from the workshop preferences. Managers can use Custom Form Elements, preloaded by administrators, to create custom fields that better fit the company’s needs (e.g. an employee name and ID autofill that pulls data from a corporate directory). The participants can then fill out the form from their computer or mobile device. All submitted results can be viewed by managers through the Grid of Results page where they can also navigate to single responses in the Individual Results Page.
AbstractFor this project we designed and implemented a dynamic UI
generator called the UI Builder. The UI Builder allows users to dynamically create interactive and fully functional forms.
Our project consists of building a full stack Web based application for form creation, management, submission, and result visualization. The project is built for three types of users: Administrators, Managers, and Employees. The administrators can add backend support, and have the ability to create custom Form Elements. Managers can create and edit forms through a flexible environment. Employees can fill out the forms that were created after which the managers can view the collected results. The project consists of 6 different views to support this functionality: List of Forms, Editor, Preview, Runtime, Grid of Results, and Individual Results.
ApproachWe defined the required pages and the elements we would
need for this project and created prototypes for them. We used AngularJS for this because it simplifies the development and testing of web pages.
The UI Builder is structured into a series of groups that consists of Form Elements, such as Text boxes, Checkboxes, Radio Groups, Dropdowns, and Likert Scales. These elements can be expanded by a convention that we created. This enables the creation of custom Form Elements by the administrators. Custom Form Elements allow administrators to create an HTML Template for display, a JSON file for the schema structure, and an HTML template for editing the element. Our code can then import these files automatically and add them to the list of Form Elements that are available in the Editor.
A Form Group can consist of any number of Form Elements. When a Form Group is selected it can be customized even further by allowing the user to add, delete, or edit any of its Form Elements.
Our backend component consists of a NodeJS server that communicates with MongoDB and MySQL as our non-relational and relational databases respectively. This ensures the UI Builder’s long term scalability in regards to database connectivity.
For the frontend, we use AngularJS as our framework because it is well supported and extensively documented. It is also ideal for validation and two-way data binding, which are two key requirements for our project.
AcknowledgmentsDarren Hwang: Principal UI Engineer, Xactly Corporation
Anil Kona: Senior Director of Engineering, Xactly Corporation
Daniel Fava: Graduate Teaching Assistant, UCSC
Dr. Linda Werner: Faculty Advisor, UCSC
Future Work● External web services link: Enables users to connect to
external web pages and import data for the forms.● Pre-created form templates: Templates will have common
questions or fillable fields so that managers can have a standard starting point.
Dynamic UI Builder Justin Barros, Brighton Keslin, Allen Liou,
Christopher Peck, Oscar Pinedo, Shrey Valia
The Editor view allows managers to view and edit the forms that they create.
The Runtime view allows employees to fill out forms that managers have created.
The data flow and structure for our backend. Workflow of the webapp.
Technologies Used● AngularJS: An Open-source web application framework that
provides a model-view-controller architecture. We used it to structure the behavior of our different web pages.
● NodeJS: Open-source software designed to create servers that run Javascript applications. We used it to connect our web pages to the database.
● Express: A REST development language built into NodeJS. We used it to create our middleware API seamlessly connecting the user to the database.
● MongoDB: A non-relational database. We used it to demonstrate the ability to work with non-relational databases.
● MySQL: An Open-source relational database system. We used it to demonstrate that our web app could connect and communicate with a relational database
● HTML5: A markup language used to create web pages. We used it to create the structure of the different views.
● CSS: A language that describes the appearance of a web page. We used it to style all of the views.
● Bootstrap: A library of CSS that provides features to customize a web page. We used it define the look of all of the views
● Scrum: An agile software development framework. We used it to structure our approach to project management.
● Jira: A program that provides bug and issue tracking. We used it as our scrum board to keep track of our task and user stories.The List of Forms view allows the user to view the
created forms, and fill the assigned forms.

16
e are very pleased to include posters for the Senior design projects that were done without industry sponsors.
Some of these projects were instigated and/or sponsored by research at the Baskin School while others were
created by students with the assistance of faculty mentors and tas.
We have selected four of these projects for presentation in the program, and all were invited to display their posters
that summarize their projects.
Bolt m2 electric motorbike
Smart energy analytic disaggregation Systems platform
Sluglife
rotonrotaryrocket (see insert)
w
16 17
Capstone Project
Abstract
Approach
Overview
We would like to thanks Professor Steven Peterson, as well as our T.A. Amir Pourshafiee, for their advice and support throughout this project. Thanks also to Dr. Nathan Jauvtis and the Bolt Motorbikes team for their support, and for allowing us to work on this project.
Acknowledgments
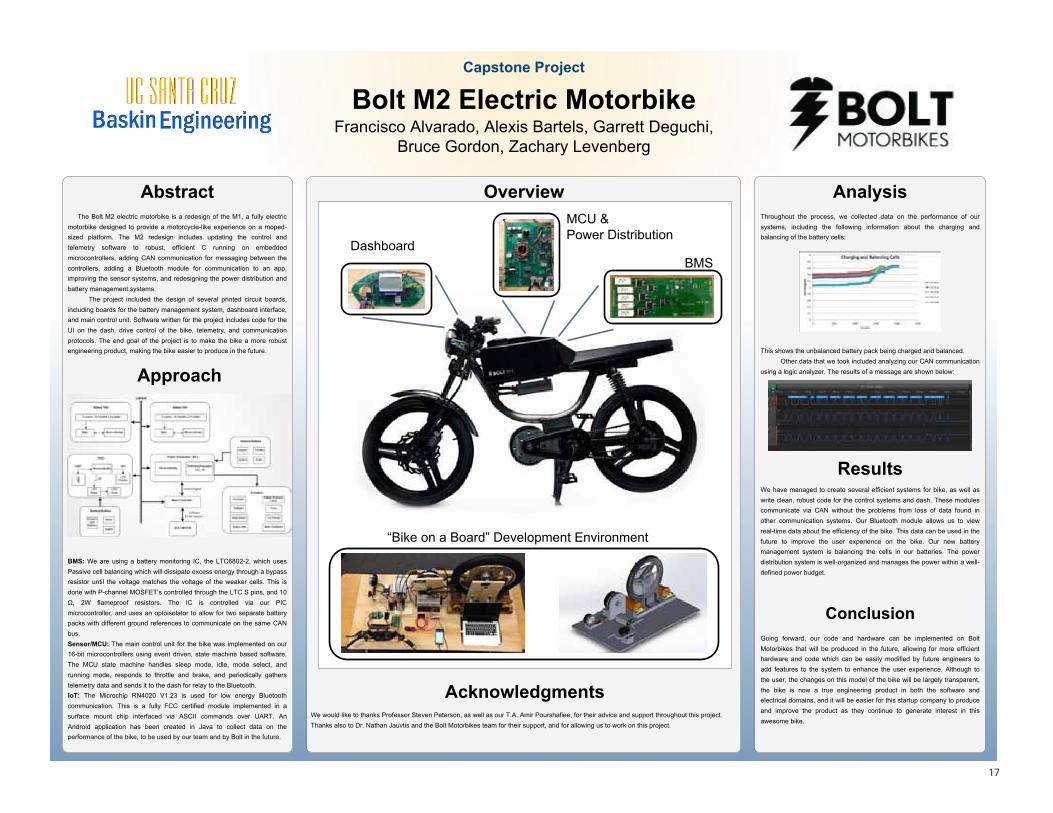
Analysis Throughout the process, we collected data on the performance of our systems, including the following information about the charging and balancing of the battery cells:
This shows the unbalanced battery pack being charged and balanced. Other data that we took included analyzing our CAN communication
using a logic analyzer. The results of a message are shown below:
Results We have managed to create several efficient systems for bike, as well as write clean, robust code for the control systems and dash. These modules communicate via CAN without the problems from loss of data found in other communication systems. Our Bluetooth module allows us to view real-time data about the efficiency of the bike. This data can be used in the future to improve the user experience on the bike. Our new battery management system is balancing the cells in our batteries. The power distribution system is well-organized and manages the power within a well-defined power budget.
Conclusion Going forward, our code and hardware can be implemented on Bolt Motorbikes that will be produced in the future, allowing for more efficient hardware and code which can be easily modified by future engineers to add features to the system to enhance the user experience. Although to the user, the changes on this model of the bike will be largely transparent, the bike is now a true engineering product in both the software and electrical domains, and it will be easier for this startup company to produce and improve the product as they continue to generate interest in this awesome bike.
Bolt M2 Electric Motorbike Francisco Alvarado, Alexis Bartels, Garrett Deguchi,
Bruce Gordon, Zachary Levenberg
The Bolt M2 electric motorbike is a redesign of the M1, a fully electric motorbike designed to provide a motorcycle-like experience on a moped-sized platform. The M2 redesign includes updating the control and telemetry software to robust, efficient C running on embedded microcontrollers, adding CAN communication for messaging between the controllers, adding a Bluetooth module for communication to an app, improving the sensor systems, and redesigning the power distribution and battery management systems.
The project included the design of several printed circuit boards, including boards for the battery management system, dashboard interface, and main control unit. Software written for the project includes code for the UI on the dash, drive control of the bike, telemetry, and communication protocols. The end goal of the project is to make the bike a more robust engineering product, making the bike easier to produce in the future.
BMS: We are using a battery monitoring IC, the LTC6802-2, which uses Passive cell balancing which will dissipate excess energy through a bypass resistor until the voltage matches the voltage of the weaker cells. This is done with P-channel MOSFET’s controlled through the LTC S pins, and 10 Ω, 2W flameproof resistors. The IC is controlled via our PIC microcontroller, and uses an optoisolator to allow for two separate battery packs with different ground references to communicate on the same CAN bus. Sensor/MCU: The main control unit for the bike was implemented on our 16-bit microcontrollers using event driven, state machine based software. The MCU state machine handles sleep mode, idle, mode select, and running mode, responds to throttle and brake, and periodically gathers telemetry data and sends it to the dash for relay to the Bluetooth. IoT: The Microchip RN4020 V1.23 is used for low energy Bluetooth communication. This is a fully FCC certified module implemented in a surface mount chip interfaced via ASCII commands over UART. An Android application has been created in Java to collect data on the performance of the bike, to be used by our team and by Bolt in the future.
Dashboard
MCU & Power Distribution
BMS
“Bike on a Board” Development Environment

18
Capstone Project
ImplementationWe were tasked with integrating predictive capabilities into the existing SEADS system, which only collected data. To do this, we implemented a classification component that allows using any amount of different disaggregation algorithms to judge and compare their effectiveness. To do this we abstracted the gathering of training data to a base classifier class. This approach provides a common interface to the database that makes creating new classifiers much simpler. The classifiers are all implemented in python, and one of them uses scikit-learn’s RandomForestModel to make predictions. An arbitrary time frame, supplied by the user requesting disaggregated data, is used to query the raw data and select data in that time frame. These data are used as input to the RandomForestModel. Multiple appliances running at once are converted into a single bitstring by the base classifier to classify, allowing our data to be used with almost any machine learning technique.
The predictions that the SEADS-P provides are available via a public API. By providing a start and end time, SEADS-P will respond with a vector of currently running appliances and their energy usage in that time. These requests are routed through a request layer that sends the requests to the classification component for processing. In addition to predictions of appliances running, total power, voltage, and current values for every second between a start and end time are available from the API. These values can also be downsampled arbitrarily using the API.
The front facing web dashboard and PR site are created using Django, a python based web app framework. This takes care of user details and associations between users and their SEADS hardware. The dashboard shows a line graph of current energy usage, as well as a bar graph of daily energy usage for the past week. The time series data is presented in a graph that allows the user to click and drag over a date range to label a period of time with a set of appliances that were running during that period. When the user does this, the label is sent to the server to use for training the models. The graphs are implemented using a library built on top of d3.js called C3. C3 provides an interface that abstracts away the minutia of d3.js to easily create visually appealing representations of data. Cross origin requests to the prediction REST API is handled at the client layer. This allows the dashboard to directly request data from the server using the prediction REST API, speeding up loading and response time.
AbstractOutside of their monthly utility bill, most people do not have a strong grasp on the specifics of their electricity consumption. With time-of-use metering and confusing pricing tiers, managing that cost is not a simple task. SEADS Platform(SEADS-P) is a consumer-friendly platform designed to de-obfuscate household electricity usage so that users can see what appliances are consuming the most energy, and empower consumers to make educated decisions about electricity usage. We use a Non-Intrusive Load Monitoring (NILM) system to detect the user’s power consumption. The SEADS device monitors the aggregate electrical signal of the entire household. SEADS-Platform collects this aggregate data and uses machine learning to disaggregate it into separate signals per appliance. The user can view this information through our web dashboard. Our platform also calculates the cost of the electricity use of each appliance.
Architecture
The SEADS platform allows integration with established disaggregation algorithms and provides a common interface for testing them against one another.
Overview
Ali Adabi, Patrick Mantey, the Center for Information Technology Research in the Interest of Society (CITRIS)CENSEPS, UCSOLAR, and NSF for supporting this project. This work is a capstone project for the Senior Design courses under the supervision of Professor Linda Werner.
Acknowledgments
ConclusionSEADS-P allows for prediction and classification of power data. It also stores historical power usage in our database. The technologies assembled in our application create a scalable, extensible architecture that lends itself to improvements of the predictive algorithms we use. As the system grows it could be adapted to disaggregate energy loads of large office buildings or other commercial structures.
Dealing with power fluctuations is a vital part of the Intelligent Energy Management System (IEMS), but SEADS-P focuses on optimizing electricity usage in individual houses. Installing the SEADS device to monitor power usage has the potential to save considerable amounts of money and energy in the long term. In the short term it helps balance a grid that is becoming increasingly powered by intermittent renewable energy sources.
IEMS already handles optimization on the macro scale, but efficiency on the micro scale has yet to be tackled in a convincing way. If everyone could efficiently control their power usage in their homes, we could save millions of dollars in electricity every year while effectively combating the inherent fluctuations in power due to renewable energy sources. Eliminating waste is a great way to help the environment as well.
SEADS-P is an innovative and game-changing way to integrate renewable energy into our daily lives, and is part of the path to a clean and sustainable future.
Ramin Ebrahimi, Ian Lofgren, Colin Peter, Nikita Sokolnikov
SEADS consumer appThe SEADS consumer app has two components, the mobile application and web dashboard.
IEMS SYSTEM
Sensors
Individual Loads &
State
Weather Solar/Wind Output
Grid Grid Output
Generator Generator Output
Gen
erat
ion
SEADS
Solar/Wind Analytics
Grid Analytics
Generator Analytics
Rule Based Decision Tree
Optimization
User Behavior Prediction
User Interaction Front End
Load Control
Generation Control
User Preferences &
Constraints User Model User
Analytics
Decision Support
Analytics
Load & Ambient
Condition
Load
User
Stor
age
Battery Analytics
Battery Battery
Modeling
Inputs Intermediate output
Automated Control
Battery Control
Appliance Categories
IEMS: Intelligent Energy Management System
Smart Energy Analytic Disaggregation Systems - Platform: An end to end system for energy monitoring of home appliances
Dashboard
TechnologiesThe website was developed using Django, a Python-driven web framework. Django makes it easy for programmers to build database-driven web applications. This made our front-end and back-end easy to implement, as Django handles both conveniently.
Heroku handles all of the build steps necessary for deployment, leaving the developers only responsible for development. Heroku automatically deploys the latest version to the cloud ensuring an always up-to-date website.
PostgreSQL, a relational database engine, was used as the back-end for the Django web application as well as the data store for the time-series data.
Most of our backend codebase was written in Python. It allowed us to create the system quickly, and easily make changes requested by the client.
D3 is a JavaScript library for producing dynamic, interactive data visualizations in web browsers. D3 was used for all of the website’s data visualization.
Disaggregation
SEADS Deviceaggregate data
Database
Classification layer
WebserverInterface
for commun-ication
SEADS-P
Web Dashboard
user requests currently running appliances or aggregate power/energy data
user labels a period of time with the appliances running in that period
Travis CI is an automated building and testing system. Every commit that we pushed to the server got built and tested with Travis, and we immediately knew when test coverage was decreased, or when tests/the build failed.
Scikit-learn is a Python machine learning library with support for many classifiers. We use its RandomForestModel for classifying electrical data.
disaggregate/ aggregate data
aggregate datadata labels
aggregate data/ labels
disaggregate data
data labels
18 19
SlugLife Raquel Abrams, Ivan Alvarado, Jose Guzman, Ahmadullah Tokhi, Michael Young
JACK BASKIN SCHOOL OF ENGINEERINGCapstone Project
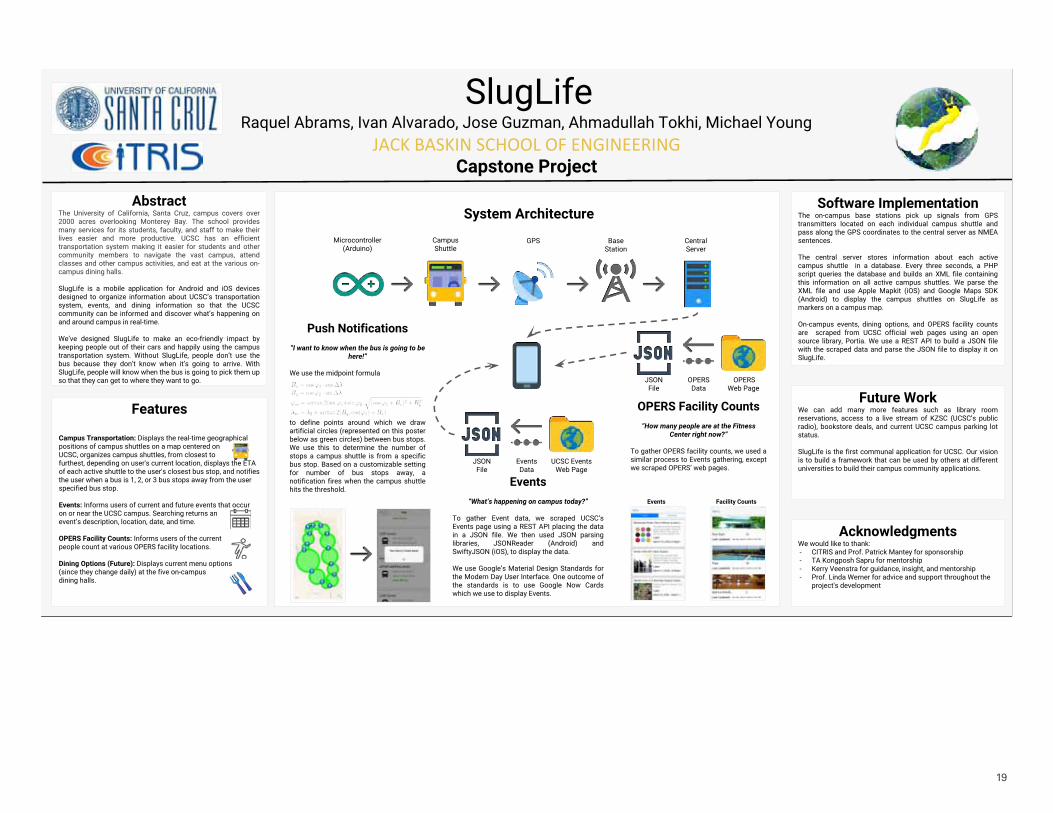
AbstractThe University of California, Santa Cruz, campus covers over 2000 acres overlooking Monterey Bay. The school provides many services for its students, faculty, and staff to make their lives easier and more productive. UCSC has an efficient transportation system making it easier for students and other community members to navigate the vast campus, attend classes and other campus activities, and eat at the various on-campus dining halls.
SlugLife is a mobile application for Android and iOS devices designed to organize information about UCSC’s transportation system, events, and dining information so that the UCSC community can be informed and discover what’s happening on and around campus in real-time.
We’ve designed SlugLife to make an eco-friendly impact by keeping people out of their cars and happily using the campus transportation system. Without SlugLife, people don’t use the bus because they don’t know when it’s going to arrive. With SlugLife, people will know when the bus is going to pick them up so that they can get to where they want to go.
Software ImplementationThe on-campus base stations pick up signals from GPS transmitters located on each individual campus shuttle and pass along the GPS coordinates to the central server as NMEA sentences.
The central server stores information about each active campus shuttle in a database. Every three seconds, a PHP script queries the database and builds an XML file containing this information on all active campus shuttles. We parse the XML file and use Apple Mapkit (iOS) and Google Maps SDK (Android) to display the campus shuttles on SlugLife as markers on a campus map.
On-campus events, dining options, and OPERS facility counts are scraped from UCSC official web pages using an open source library, Portia. We use a REST API to build a JSON file with the scraped data and parse the JSON file to display it on SlugLife.
System Framework
Features
Campus Transportation: Displays the real-time geographical positions of campus shuttles on a map centered on UCSC, organizes campus shuttles, from closest to furthest, depending on user's current location, displays the ETA of each active shuttle to the user's closest bus stop, and notifies the user when a bus is 1, 2, or 3 bus stops away from the user specified bus stop.
Events: Informs users of current and future events that occur on or near the UCSC campus. Searching returns an event’s description, location, date, and time.
OPERS Facility Counts: Informs users of the current people count at various OPERS facility locations.
Dining Options (Future): Displays current menu options (since they change daily) at the five on-campus dining halls.
CentralServer
Microcontroller(Arduino)
Campus Shuttle
GPS BaseStation
Push Notifications“I want to know when the bus is going to be
here!”
We use the midpoint formula
to define points around which we draw artificial circles (represented on this poster below as green circles) between bus stops. We use this to determine the number of stops a campus shuttle is from a specific bus stop. Based on a customizable setting for number of bus stops away, a notification fires when the campus shuttle hits the threshold.
Future WorkWe can add many more features such as library room reservations, access to a live stream of KZSC (UCSC’s public radio), bookstore deals, and current UCSC campus parking lot status.
SlugLife is the first communal application for UCSC. Our vision is to build a framework that can be used by others at different universities to build their campus community applications.
AcknowledgmentsWe would like to thank:- CITRIS and Prof. Patrick Mantey for sponsorship - TA Kongposh Sapru for mentorship- Kerry Veenstra for guidance, insight, and mentorship- Prof. Linda Werner for advice and support throughout the
project's development
Events“What’s happening on campus today?”
To gather Event data, we scraped UCSC’s Events page using a REST API placing the data in a JSON file. We then used JSON parsing libraries, JSONReader (Android) and SwiftyJSON (iOS), to display the data.
We use Google’s Material Design Standards for the Modern Day User Interface. One outcome of the standards is to use Google Now Cards which we use to display Events.
OPERS Facility Counts“How many people are at the Fitness
Center right now?”
To gather OPERS facility counts, we used a similar process to Events gathering, except we scraped OPERS’ web pages.
OPERSWeb Page
OPERSData
JSONFile
System Architecture
UCSC EventsWeb Page
EventsData
JSONFile
Events Facility Counts

contact US:
patrick manteyassociate dean, industry programs
citriS campus directordirector of iti
jack Baskin endowed professor, computer [email protected]
tim Benschdirector of corporate development
Frank howleySenior director of corporate development
Visit our website: csspp.soe.ucsc.edu
join us on Facebook: facebook.com/BaskinSchoolofengineering