corporate social responsibility and firm’s … · corporate social responsibility and firm’s...
TRANSCRIPT
Corporate Social Responsibility and Firm’s Transparency: Evidence from the
Canadian Market
This version: 15 January 2016
Ahmed Marhfor
Université du Québec en Abitibi-Témiscamingue
Email: [email protected]
Kais Bouslah
School of Management, University of St Andrews
Email: [email protected]
Bouchra M’Zali
École des sciences de la gestion, Université du Québec à Montréal,
AICRI, CRSDD-ESG-UQAM.
Email: [email protected]

Corporate Social Responsibility and Firm’s Transparency: Evidence from the
Canadian Market
This version: 15 January 2016
Abstract
In this article, we examine the association between Canadian firms’ transparency and
their corporate social responsibility (CSR) engagement. In particular, we empirically
explore whether CSR affects the amount of firm’s future earnings information that is
reflected in current stock prices. We consider that more transparent firms can “bring the
future forward” so that their current stock prices track and reflect more information about
future earnings. Most of our findings indicate that the relationship between CSR and
firm’s transparency is not statistically significant. One potential explanation of this
neutral association is that Canadian firms already benefit from a richer information
environment. Overall, our study suggests that managers do not use CSR as a mechanism
that advances their careers or other personal agenda.
Keywords: Corporate social responsibility, firm’s transparency, stock price
informativeness, stakeholders’ theory, agency theory.
JEL Classification: G34; M14

1. INTRODUCTION
Two facts demonstrate the relevance of the concept of Corporate Social
Responsibility (CSR) to both the academic and business world. First, firms increasingly
undertake a range of CSR activities, and communicate these activities through their
website as well as through annual reports or specific CSR reports. Second, the emergence
of a market for CSR ratings where various independent agencies, such as Sustainalytics,
MSCI ESG STATS (formerly KLD), Bloomberg, and Thomson Reuters ASSET4
evaluate firms based on their social performance (SP). The latter can be defined as “a
business organization’s configuration of principles of social responsibility, processes of
social responsiveness, and policies, programs, and observable outcomes as they relate to
the firm’s societal relationships” (Wood, 1991, p.693).
In this paper, we investigate the relation between CSR and firm’s transparency as
measured by stock price informativeness. In particular, we try to answer the following
question: does higher firm’s social performance (SP) means more or less informed stock
pricing? Following Jo & Kim (2007), we define socially responsible firms as firms that
encourage extensive voluntary disclosure and value ethical financial reporting (e.g., more
conservative earnings management instead of aggressive earnings management). While
most of CSR studies focus on the relation between CSR engagement and firm’s financial
performance, the consequences of CSR on firm’s transparency-increasing disclosures
have received less attention (Chui et al. 2012). We try to address this deficiency in the
literature by providing a valuable setting that directly examines the association between
CSR and firm’s transparency. Our analysis is important because many theoretical and
empirical papers show that inadequate disclosure together with asymmetric information

1
can lead to market failures. Indeed, many financial scandals (e.g., Enron, WorldCom,
Parmalat) and the recent financial crisis have raised serious concerns about unethical
behaviors in financial reporting and asymmetric information problems. If CSR helps
firms’ implement ethical and extensive reporting practices, then we can say that CSR
engagement plays an important role in financial markets. Otherwise, CSR activities do
not necessarily result in more responsible behavior.
Our proxy of firm’s transparency (stock price informativeness) is derived from the
accounting literature (Collins et al., 1994; Gelb & Zarowin, 2002; Lundholm & Myers,
2002; Durnev et al., 2003). It is based on the intuition that firm’s current stock return is
determined by the unexpected current earnings and the change in expectations about
future earnings. In our tests, we consider that more transparent firms can “bring the
future forward” so that their current returns track and reflect more information about
future earnings (Lundholm & Myers, 2002). Further, we argue that if CSR activities
improve transparency, firm’s social engagement should contribute to impound more
future earnings information into current returns. Put differently, the extent to which
firm’s future earnings are reflected in current stock prices should differ based on firm’s
CSR engagement. Therefore, if CSR increases firm’s transparency and reduces
information asymmetry, high CSR firms should be priced more correctly relative to low
CSR firms.
In the CSR literature, two main opposing views regarding the relationship between
CSR and stock price and/or firm performance have been proposed. The first view (e.g.,
Freeman, 1984; Jo & Harjoto, 2011, 2012) suggests a positive relationship between the
two concepts based either on the stakeholder theory or the resources based theory (slack
2
resources theory). The second view (e.g., Friedman 1970; Barnea & Rubin, 2010)
suggests a negative relationship between the two concepts based on either the
neoclassical economic theory or the agency theory. Some scholars also argue that it is
possible that there is no association between the two concepts (Ullmann, 1985,
McWilliams & Siegel, 2001). Unfortunately, the empirical evidence regarding the
relation between CSR and firm performance or stock price is mixed as is the evidence
regarding the relation between CSR and the profitability of socially responsible
investment (SRI) funds (Deng et al., 2013).
Our study contributes to this literature in two different ways. First, to the best of our
knowledge, our intuitive approach that was initially developed in the accounting literature
is applied for the first time in the CSR literature. Our findings should then contribute to a
better understanding of the link between CSR and stock price informativeness. As
suggested earlier, we focus on firm’s transparency because the recent 2008-2009 global
financial crisis showed that the dissemination of transparent information is inadequate. In
fact, we argue that high transparency is crucial if firms are to be held accountable for
their actions.
Second, most papers in the literature involve indirect approaches focusing on indirect
measures of firm’s transparency (e.g., analyst coverage, recommendations, and forecasts
accuracy). In our paper, we use a direct measure of firm’s transparency that relies on
fundamental data and test its relation with firm’s CSR choice. We argue that if CSR
activities increase transparency, firm’s social engagement should contribute to keep stock
prices in line with firm’s fundamentals (firm’s earnings). We consider that high
3
transparency is associated with more information about firm’s future earnings being
impounded in current stock prices, in accordance with a growing literature (Gelb &
Zarowin, 2002; Lundholm & Myers, 2002; Durnev et al. 2003).
Some of our findings provide weak evidence suggesting that firm’s CSR engagement
that addresses social issues such as community, employees, customers, and contractors is
positively linked to firm’s transparency. Such findings support the stakeholder theory
and/or the resources based theory (slack resources theory). However, most of the results
indicate a neutral association between CSR and firm’s transparency, which suggests that
CSR activities have no impact on firm’s transparency. As stressed by Cormier & Magnan
(2013), firm’s disclosure practices and total market information are complex
phenomenon that cannot be explained by a single theory. In fact, the expected positive
relation between CSR and stock price informativeness has to be nuanced. For instance, a
firm’s commitment to improve its disclosure policies can alter the incentives for other
market participants (e.g., financial analysts) to collect and trade on private information.
Therefore, we argue that any additional disclosure linked to CSR engagement could drive
out private information acquisition, resulting in an ambiguous impact on total information
in the market. Another potential explanation of the absence of any relationship between
CSR and firm’s transparency is that Canadian firms already benefit from a richer
information environment and that CSR choice is more linked to other advantages (e.g.,
high exposure, stock liquidity, and prestige). Overall, it appears that Canadian firms’
managers do not use CSR opportunistically to extract private benefits.
The remainder of the paper is organized as follows. Section 2 reviews prior literature
and develops our main hypothesis. In sections 3, we explain the measurement of firm’s
4
transparency and our research design. Section 4 describes the data and sample selection.
Section 5 presents our core evidence on the relation between CSR engagement and firm’s
transparency. Section 6 concludes.
2. LITERATURE REVIEW AND HYPOTHESES DEVELOPMENT
2.1 The theory of information asymmetry reduction
Firm’s transparency is aimed at reducing information asymmetry and providing a
clear view to stakeholders about firm’s long-term prospects. As Cui et al. (2012), we
argue that the empirical relation between CSR and firm’s transparency is pivotal because
asymmetric information problems can adversely affect the market equilibrium (Akerlof,
1970; Jensen & Meckling, 1976). The latter is a driving factor for the well-being of
communities and people. As suggested by many authors, where there is asymmetric
information, there is an incentive for managers to engage in strategic behavior (e.g.,
entrenchment strategy) or unethical activities (e.g., aggressive earnings management).
Such activities can generate important market failures (e.g., the recent financial crisis).
Ultimately, firm’s shareholders and other stakeholders can be affected negatively due to
lack of private information.
To address this fundamental problem, ethical and transparent disclosures (mandatory
and voluntary) can help bring managers’ interests in line with investors’ and other
stakeholders’ interests (Healy & Palepu, 2001; Verrecchia, 2001). In our study, we
consider firm’s disclosure practices as an important aspect of the overall discipline of
CSR. We argue that socially responsible disclosures can be considered as a
communication mechanism with stakeholders that goes above and beyond what is legally
required of a firm (mandatory disclosure). Overall, as suggested by Harjoto & Jo (2011,

5
p.351): “CSR is an extension of firm’s efforts to foster effective corporate governance,
ensuring firm’s sustainability via sound business practices that promote accountability
and transparency”.
2.2 The theory of CSR engagement
To date, CSR remains a debatable concept both theoretically and empirically (Carroll,
1998; Van Marrewijk, 2003; Whitehouse, 2006; Freeman & Hasnaoui, 2011; Harjoto &
Jo; 2011; Ioannou & Serafeim, 2012). In general, the foundation of CSR is the
acknowledgement that firms have responsibilities that go above and beyond what is
legally and financially required of a firm (Freeman & Hasnaoui, 2011; Jo & Harjoto,
2012). As noted by Whitehouse (2006), academics continue to debate the content and
meaning of CSR, whereas companies, in particular larger ones, appear to have found
common ground upon which they have constructed elaborate CSR policies and practices.
Also investors appear to have found common ground upon which they integrate CSR in
investment decisions and ownership practices. The latter movement is better illustrated
by the acronym ESG or environmental (E), social (S) and Governance (G) issues where
investors integrate ESG information along with financial information (risk and return)
into investment decisions and ownership policies.1
Unfortunately, there is no such consensus among academics regarding CSR. For
instance, CSR empirical studies do not agree on a common definition of CSR, e.g.,
should we include corporate governance within CSR or consider it as a separate element
(Hess, 2008)? Several CSR studies treat corporate governance as a separate concept and
include only social and environmental criteria in CSR (e.g., Harjoto & Jo, 2011; Jo &
1 For example, the Principles for Responsible Investment (PRI) were developed by a group of institutional
investors reflecting the increasing relevance of ESG issues to investment practices.
http://www.unpri.org/about-pri/the-six-principles/.
6
Harjoto, 2012; Ioannou & Serafeim, 2012). In this study, corporate governance is
considered within CSR along with social and environmental criteria. In fact, major rating
firms, such as Sustainalytics, MSCI ESG STATS, Bloomberg, and Thomson Reuters
ASSET4 define CSR as E, S and G issues. This is also the definition adopted by socially
responsible investors (e.g., major institutional investors who signed the PRI principles).2
The theory of CSR engagement proposes two main opposing views regarding the
benefits of CSR choice and the relationship between CSR and stock price and/or firm
performance. The first view suggests many benefits linked to CSR activities (e.g., higher
reputation, lower cost of capital, long-term economic success) and predicts a positive
relationship between CSR and financial performance based either on the stakeholder
theory or the resources based theory (slack resources theory). The second view considers
CSR as a costly activity and predicts a negative relationship between the 2 concepts
based on either the neoclassical economic theory or the agency theory. Some scholars
also argue that it is possible that there is no association between the 2 concepts due to
several reasons, e.g., CSR is not priced in financial markets, CSR measurement problems
and/or omitted variables that affect both concepts (Ullmann, 1985, McWilliams & Siegel,
2001, Jo & Harjoto, 2012).
2.3 CSR as a transparency-increasing or decreasing mechanism
There is a growing empirical literature on the relation between CSR and firm’s
information environment. Jo & Kim (2007) show that high firm’s transparency (e.g.,
frequent and persistent disclosures) reduces information asymmetry and discourages
unethical earnings manipulation. Cui et al. (2012) document a negative association
between CSR and information asymmetry. In the same line of reasoning, Gelb &
2 This is not the aim of this paper to provide a review of the CSR concept.
7
Strawser (2001) argue that socially responsible firms provide more informative and/or
extensive disclosures in comparison to firms that engage less in socially responsible
activities. Other studies suggest that CSR may improve firm’s information environment
through high analyst coverage (Hong & Kacperczyk, 2009) and low analyst forecasts
errors and dispersion (Dhaliwal et al. 2011; Cormier et al. 2013; 2014).
On the other hand, some scholars (e.g., Hemingway & Maclagan, 2004) conjecture
that companies engage in CSR to cover up corporate misbehaviour. For instance, some
studies findings (e.g., Petrovits, 2006; Prior el al. 2008) indicate that CSR choice is
positively correlated to earnings management.
Theoretically, there is no universally agreed-upon rationale behind the relation
between firm’s information environment and CSR engagement (Harjoto & Jo, 2012). The
neoclassical economic theory (Jensen, 2002), also referred to the stakeholder expense
view (Deng et al., 2013), considers CSR as an additional cost that could put the firm at a
competitive disadvantage which reduces firm’s profitability and share price. The
neoclassical economic theory suggests that CSR investments result in a wealth transfer
from shareholders to other stakeholders (Deng et al., 2013). For example, the firm could
adopt a stringent monitoring system not required by the existing laws and not
implemented by competitors. This costly monitoring system from shareholders' point of
view could benefit other stakeholders, e.g., social interest groups. In short, the
neoclassical economic theory suggests that CSR investments should be undertaken if and
only if they benefits shareholders in the first place. It follows that any CSR activities that
do not benefit shareholders is regarded as a waste a firm’s scarce resources. This
argument implies that the financial market penalizes firms for overinvesting in CSR

8
activities (Jo & Harjoto, 2012; Deng et al., 2013). In sum, based on this theory, firms’
may undertake CSR activities not because they maximize shareholders’ welfare (less
asymmetric information), but because they are beneficial to other stakeholders. Hence,
we should expect a negative association between CSR and firm’s transparency.
Another theory (the agency theory) perceives CSR investments as a managerial rent-
seeking behavior which takes place at the expense of both shareholders and other
stakeholders. Here managers undertake CSR investments in order to advance their
careers, develop entrenchments strategies, or promote their personal interests at the
expense of all stakeholders, including shareholders (Deng et al., 2013). For example,
some CSR activities may be driven primarily by managerial utility considerations, such
as satisfaction of some personal imperative of the manager (Ioannou & Serafeim, 2012).
Barnea & Rubin (2010) argue that firm’s insiders tend to overinvest in CSR because
doing so provides private benefits, e.g., it allows managers to build reputation as good
social citizens (empire building approach). Cespa & Cestone (2007) argue that CEOs
have an interest in engaging in CSR activities because such engagement may generate
support from some shareholders and stakeholders activists, and ultimately reduce the
probability of CEO turnover (entrenchment strategy). Hence, we expect CSR to be
negatively associated with firm’s transparency if CSR engagement is driven primarily by
managerial utility considerations.
In the same line of reasoning, some firms may try to portray themselves as good
citizens when in fact they may be poor social performers. The concern is that
“greenwashing” and sometimes “disinformation” may become a management tool that
promotes firm’s image and maximize its value. Thus, if the greenwashing argument is
9
correct, we should expect a gap between CSR claims and actual practices. In other words,
CSR claims should be simply a firm’s rhetoric and cannot be viewed as an extension of
firm’s efforts to promote transparency. Hence, we should not expect managers to go one
step further to improve firm’s transparency. In addition, greenwashing may push
managers to disclose only some aspects of firm’s information (positive aspects) without
full disclosure of negative information. Therefore, the greenwashing argument implies
that CSR should be negatively related to firm’s transparency.
Both the neoclassical economic theory and the agency theory suggest a negative
relation between CSR and firm’s transparency. In fact, if non-performing CEOs are using
CSR to avoid replacement, increase their job security, or to build their own reputation as
good social citizens, then firm’s transparency (stock price informativeness) will be
negatively related to CSR because of the agency costs induced by CSR investments and
mismanagement of firm’s resources. Further, we argue that transparency is crucial if non-
performing CEOs are to be held accountable for their actions. This reasoning leads to the
following hypothesis:
Hypothesis 1: Based on the neoclassical economic theory and/or the agency
theory, there is a negative relation between CSR and firm’s
transparency.
In contrast to the above arguments, the stakeholder theory, also referred to the
stakeholder value maximization view (e.g., Deng et al., 2013) or the conflict-resolution
hypothesis (Jo & Harjoto, 2012), suggests a positive relation between CSR and firm’s
transparency. The stakeholder theory conceptualizes the firm as a nexus of contracts
between firm’s owners (shareholders) and other stakeholders (Deng et al., 2013). There
are 2 types of contracts: explicit (e.g., wage contracts for employees, debt contracts for

10
banks and debtholders) and implicit (e.g., promises of job security for employees,
environmental protection for interest groups, high product quality for customers). The
explicit contracts are consistent with the well-established contract theory in finance. What
is new with the stakeholder theory is the addition of the set of implicit contracts which
are nebulous and not-legally binding because firms can default on their implicit
commitment without being sued by the affected stakeholders (Deng et al., 2013).
According to the stakeholder theory, high (low) CSR firms are less (more) likely to
default on their commitments associated with the implicit contracts. Consequently,
stakeholders of high (low) CSR firms are more (less) willing to contribute resources and
efforts to the firm and accept less favorable explicit contracts, e.g., in difficult periods
(Deng et al., 2013). Hence, the interests of shareholders are more aligned with those of
other stakeholders for high CSR firms compared to low CSR firms because high CSR
firms will enjoy higher reputation and support for their operations (Deng et al., 2013).
Based on the stakeholder theory, CSR can also be considered as a process that helps
mitigate conflicts of interest between insiders, shareholders and non-investing
stakeholders (Jensen 2002; Harjoto & Jo, 2011; Jo & Harjoto, 2012). This conflict-
resolution hypothesis suggests that managers use CSR to resolve conflicts among
stakeholders and act in the best interests of their shareholders. This is consistent with
strategic CSR. Baron (2001) distinguishes three motivations that firms may have when
undertaking CSR activities: strategic CSR, normative CSR (e.g., CSR motivated by
normative principles such as altruism) or defensive CSR as a response to threats
(pressures) from external groups such as social or environmental activists. “The term
“strategic CSR” is used to refer to a profit-maximizing strategy that some may view as
11
socially responsible” (Baron, 2001, p. 8). Jo & Harjoto (2012, p.56) summarize the
strategic CSR as follows: “Stakeholder theory predicts that managers conduct CSR to
fulfill their moral, ethical, and social duties for their stakeholders and strategically
achieve corporate goals for their shareholders”. For example, some companies,
especially those that operate in highly competitive industries, can use CSR as an
additional product attribute to attract more consumers and increase their profits (Servaes
& Tamayo, 2013). Similarly, firms can use CSR as a signaling device, e.g., as a means of
differentiation from competitors in a market where quality is difficult to observe. Fisman
et al. (2006) suggest a signaling model where firms managed by socially concerned
managers use philanthropy as a signal of the quality of their products and their concern
for the consumer. The quality-signaling strategy should be more beneficial in high
competitive industries (Servaes & Tamayo, 2013). It should also help firms, who also
care about social welfare, differentiate themselves from firms that are purely profit
oriented. The basic rationale behind the signaling theory is that managers’ of high-quality
firms engage in CSR to signal their private information about firm’s future prospects in a
way that is too costly for low-quality firms to replicate (e.g., Bhattacharya, 1979; John &
Williams 1985). In summary, the stakeholder theory predicts that firms with higher CSR
will be perceived as being more transparent compared to firms with low CSR because
CSR reduces agency costs and conflict of interest between managers, shareholders and
non-investing stakeholders. Hence, we expect CSR to be positively related to firm’s
transparency.
In addition to the stakeholder theory, the resources based theory (slack resources
theory) also predicts a positive relation between CSR and firm’s transparency. Eccles et

12
al. (2011) show that CSR is the result of the utilization of the firm’s slack resources, and
not an integral part of the firm’s business model or its corporate culture. The resource
based view of the firm suggests that firms can build a competitive advantage such as a
good reputation as well as a unique relational capital with key stakeholders through CSR
investments (Hart, 1995; Russo & Fouts, 1997; Qiu et al., 2014). Hart (1995) shows that
an improved environmental performance confers a competitive advantage to the firm
through securing and enhancing social legitimacy. Russo & Fouts (1997) argue that an
improved environmental performance (e.g., a proactive environmental policy) allow the
firm to develop a competitive advantage through the positive effects of a good reputation
for leadership in environmental affairs. Qiu et al. (2014) examine the relation between a
firm's environmental (E) and social (S) disclosure scores (from Bloomberg and Thomson
Reuters Asset4 databases) and its profitability and stock price using a sample of listed
UK firms. Their results suggest that more profitable firms, those with financial resource
slack, have the ability and the willingness to invest in CSR, particularly S.
The prediction of the stakeholder theory and slack resources theory is consistent with
the work of Fuller & Jensen (2002) who argue that managers must work to make their
organizations more transparent to investors and to the markets. They prescribe some
recommendations that managers should follow in order for the stock price to be close to
the business intrinsic value (e.g., more informed pricing). Here we mention three
recommendations that are closely related to our work. First, managers must confront
capital markets with courage and conviction. Managers must not collude with analysts’
expectations that don’t fit with their own expectations. For example, they must decline to
bow to analysts’ desires for highly predictable earnings. Second, managers must be

13
forthright and promise only those results they have a legitimate prospect of delivering,
and be clear about the risk and uncertainties involved. Finally, managers should address
the unexplained part of their firm’s share price not directly related to observable cash
flows, and have the willingness to tell the markets frankly when they see their stock price
as overvalued. The above arguments lead to the following hypothesis:
Hypothesis 2: Based on the stakeholder theory and/or slack resources theory,
there is a positive relation between CSR and firm’s transparency.
14
3. EMPIRICAL METHODOLOGY
Our proxy of firm’s transparency (stock price informativeness) is based on Collins et
al. (1994), Gelb & Zarowin (2002), Lundholm & Myers (2002), and Durnev et al. (2003).
These authors argue that firm annual return at time (t) is determined by the unexpected
earnings at time (t) and the change in expectations about future earnings (t+i) between (t-
1) and (t) (see equation 1 for more details). As suggested by Lundholm & Myers (2002),
transparent firms can “bring the future forward” so that their current returns track and
reflect more information about future earnings. In this paper, we investigate how CSR
engagement affects the amount of future earnings information that is reflected in current
stock return. If CSR activities improve transparency, we should expect a significant
positive relation between firm’s CSR scores and the amount of future earnings news
reflected in current returns.
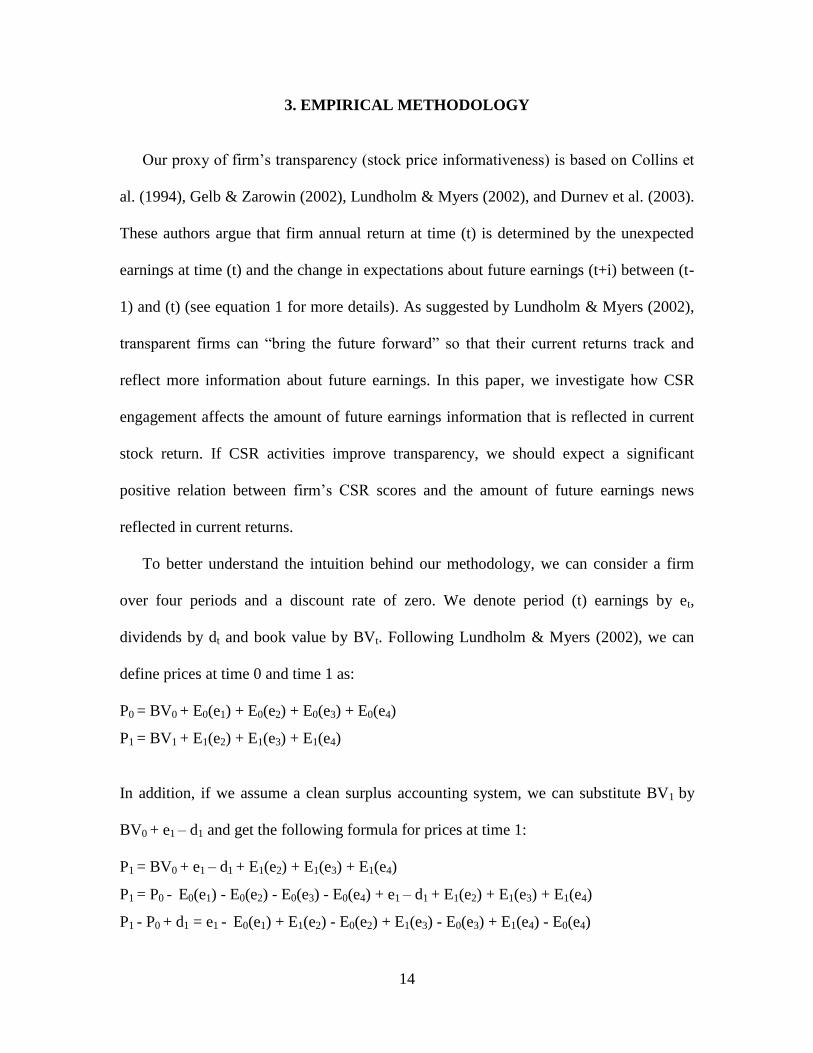
To better understand the intuition behind our methodology, we can consider a firm
over four periods and a discount rate of zero. We denote period (t) earnings by et,
dividends by dt and book value by BVt. Following Lundholm & Myers (2002), we can
define prices at time 0 and time 1 as:
P0 = BV0 + E0(e1) + E0(e2) + E0(e3) + E0(e4)
P1 = BV1 + E1(e2) + E1(e3) + E1(e4)
In addition, if we assume a clean surplus accounting system, we can substitute BV1 by
BV0 + e1 – d1 and get the following formula for prices at time 1:
P1 = BV0 + e1 – d1 + E1(e2) + E1(e3) + E1(e4)
P1 = P0 - E0(e1) - E0(e2) - E0(e3) - E0(e4) + e1 – d1 + E1(e2) + E1(e3) + E1(e4)
P1 - P0 + d1 = e1 - E0(e1) + E1(e2) - E0(e2) + E1(e3) - E0(e3) + E1(e4) - E0(e4)
15
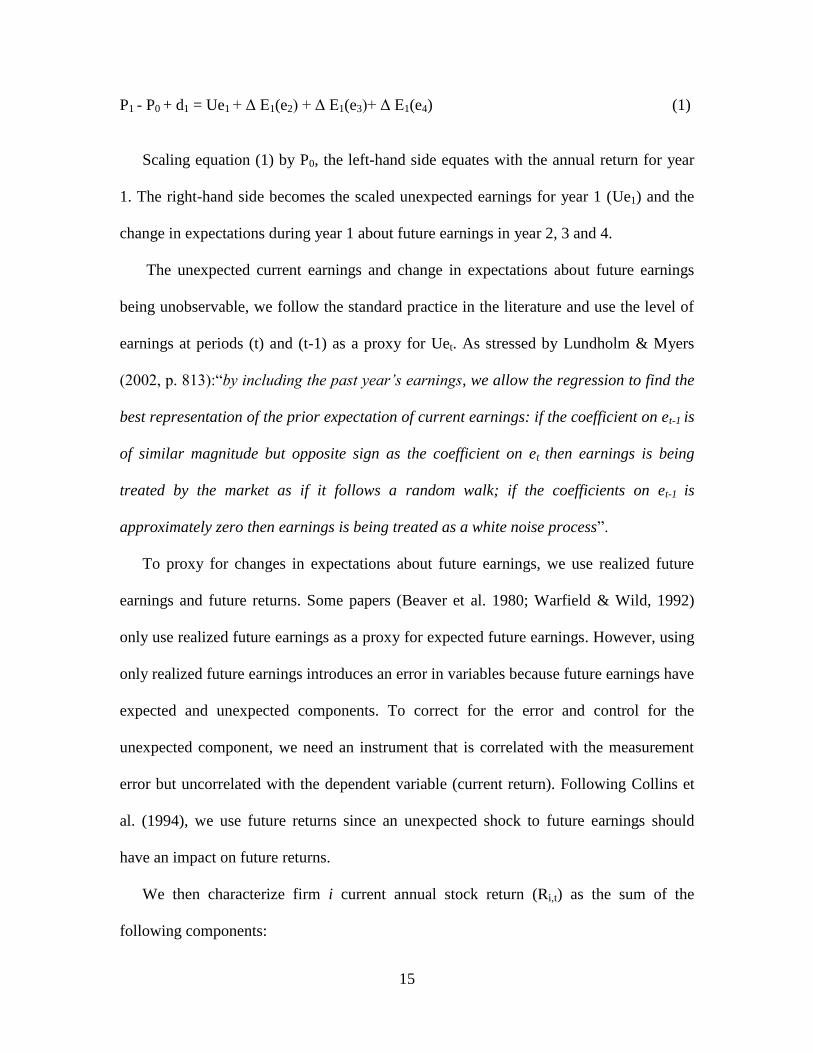
P1 - P0 + d1 = Ue1 + Δ E1(e2) + Δ E1(e3)+ Δ E1(e4) (1)
Scaling equation (1) by P0, the left-hand side equates with the annual return for year
1. The right-hand side becomes the scaled unexpected earnings for year 1 (Ue1) and the
change in expectations during year 1 about future earnings in year 2, 3 and 4.
The unexpected current earnings and change in expectations about future earnings
being unobservable, we follow the standard practice in the literature and use the level of
earnings at periods (t) and (t-1) as a proxy for Uet. As stressed by Lundholm & Myers
(2002, p. 813):“by including the past year’s earnings, we allow the regression to find the
best representation of the prior expectation of current earnings: if the coefficient on et-1 is
of similar magnitude but opposite sign as the coefficient on et then earnings is being
treated by the market as if it follows a random walk; if the coefficients on et-1 is
approximately zero then earnings is being treated as a white noise process”.
To proxy for changes in expectations about future earnings, we use realized future
earnings and future returns. Some papers (Beaver et al. 1980; Warfield & Wild, 1992)
only use realized future earnings as a proxy for expected future earnings. However, using
only realized future earnings introduces an error in variables because future earnings have
expected and unexpected components. To correct for the error and control for the
unexpected component, we need an instrument that is correlated with the measurement
error but uncorrelated with the dependent variable (current return). Following Collins et
al. (1994), we use future returns since an unexpected shock to future earnings should
have an impact on future returns.
We then characterize firm i current annual stock return (Ri,t) as the sum of the
following components:
16
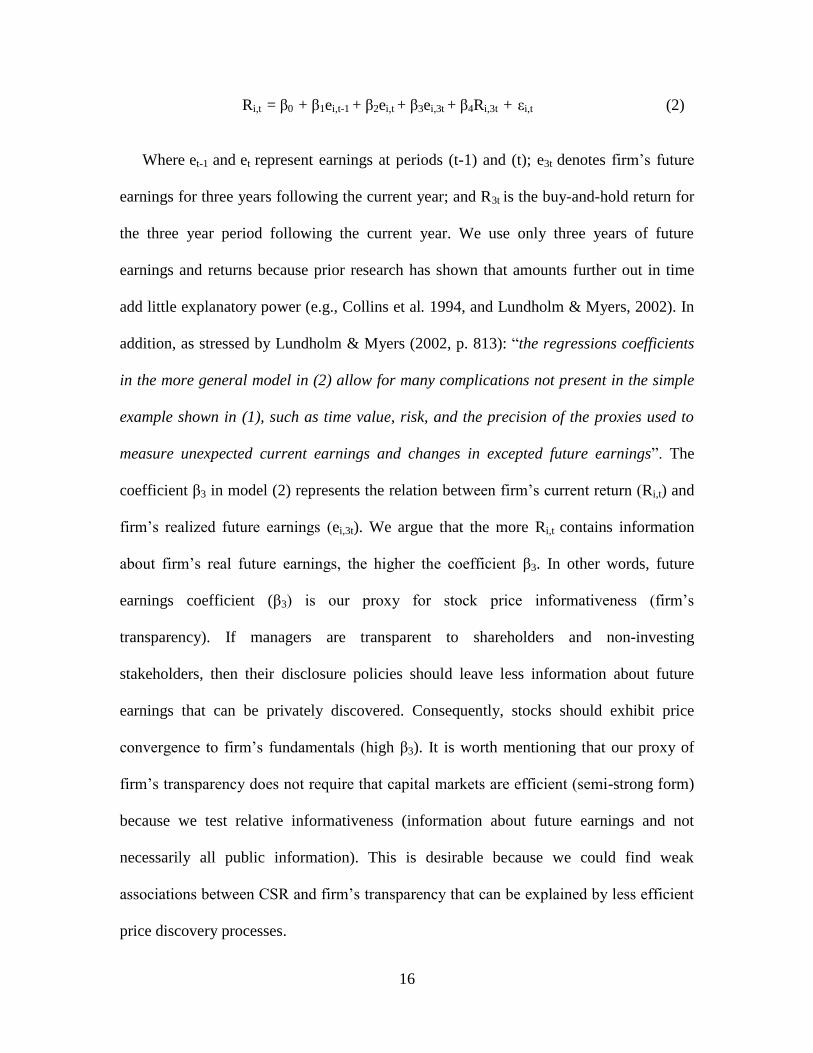
Ri,t = β0 + β1ei,t-1 + β2ei,t + β3ei,3t + β4Ri,3t + εi,t (2)
Where et-1 and et represent earnings at periods (t-1) and (t); e3t denotes firm’s future
earnings for three years following the current year; and R3t is the buy-and-hold return for
the three year period following the current year. We use only three years of future
earnings and returns because prior research has shown that amounts further out in time
add little explanatory power (e.g., Collins et al. 1994, and Lundholm & Myers, 2002). In
addition, as stressed by Lundholm & Myers (2002, p. 813): “the regressions coefficients
in the more general model in (2) allow for many complications not present in the simple
example shown in (1), such as time value, risk, and the precision of the proxies used to
measure unexpected current earnings and changes in excepted future earnings”. The
coefficient β3 in model (2) represents the relation between firm’s current return (Ri,t) and
firm’s realized future earnings (ei,3t). We argue that the more Ri,t contains information
about firm’s real future earnings, the higher the coefficient β3. In other words, future
earnings coefficient (β3) is our proxy for stock price informativeness (firm’s
transparency). If managers are transparent to shareholders and non-investing
stakeholders, then their disclosure policies should leave less information about future
earnings that can be privately discovered. Consequently, stocks should exhibit price
convergence to firm’s fundamentals (high β3). It is worth mentioning that our proxy of
firm’s transparency does not require that capital markets are efficient (semi-strong form)
because we test relative informativeness (information about future earnings and not
necessarily all public information). This is desirable because we could find weak
associations between CSR and firm’s transparency that can be explained by less efficient
price discovery processes.
17
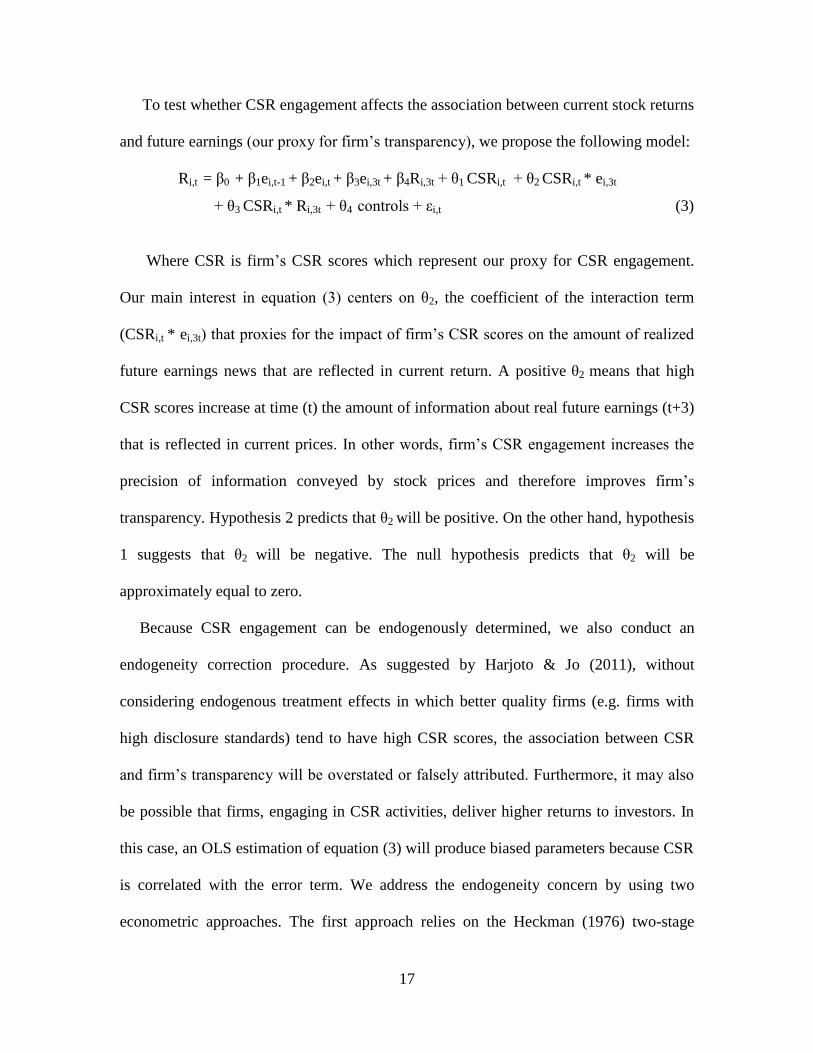
To test whether CSR engagement affects the association between current stock returns
and future earnings (our proxy for firm’s transparency), we propose the following model:
Ri,t = β0 + β1ei,t-1 + β2ei,t + β3ei,3t + β4Ri,3t + θ1 CSRi,t + θ2 CSRi,t * ei,3t
+ θ3 CSRi,t * Ri,3t + θ4 controls + εi,t (3)
Where CSR is firm’s CSR scores which represent our proxy for CSR engagement.
Our main interest in equation (3) centers on θ2, the coefficient of the interaction term
(CSRi,t * ei,3t) that proxies for the impact of firm’s CSR scores on the amount of realized
future earnings news that are reflected in current return. A positive θ2 means that high
CSR scores increase at time (t) the amount of information about real future earnings (t+3)
that is reflected in current prices. In other words, firm’s CSR engagement increases the
precision of information conveyed by stock prices and therefore improves firm’s
transparency. Hypothesis 2 predicts that θ2 will be positive. On the other hand, hypothesis
1 suggests that θ2 will be negative. The null hypothesis predicts that θ2 will be
approximately equal to zero.
Because CSR engagement can be endogenously determined, we also conduct an
endogeneity correction procedure. As suggested by Harjoto & Jo (2011), without
considering endogenous treatment effects in which better quality firms (e.g. firms with
high disclosure standards) tend to have high CSR scores, the association between CSR
and firm’s transparency will be overstated or falsely attributed. Furthermore, it may also
be possible that firms, engaging in CSR activities, deliver higher returns to investors. In
this case, an OLS estimation of equation (3) will produce biased parameters because CSR
is correlated with the error term. We address the endogeneity concern by using two
econometric approaches. The first approach relies on the Heckman (1976) two-stage

18
procedure. In the first stage, we rely on a probit analysis of the firm’s probability to
engage in CSR activities. In fact, we follow prior studies and consider that firm’s
governance structure and characteristics may lead to CSR engagement. For instance,
Harjoto & Jo (2011) find that independent boards and analyst coverage are positively
related to the choice of CSR. As suggested by many studies (e.g. Knyazeva 2007; Yu
2008), financial analysts can monitor managers by scrutinizing financial statements and
rising questions when they interact with them. This monitoring role may increase the
likelihood of managers opting for CSR engagement. In the same line of reasoning, board
independence can also be considered as an important monitoring mechanism that
influences the behavior of firm’s managers. Independent boards may help align managers
with stakeholders and ultimately increase CSR involvement. Furthermore, according to
Harjoto & Jo (2011, p.51): “CSR involvement is, on average, more common among
larger firms, more leveraged firms, and more profitable firms”. Hence, we model the
CSR choice as follow (first-stage):
Ui = Wi γ + υi (CSR engagement equation) (4)
Engagementi = 1 if Ui > 0 ; 0 otherwise
Where Ui is an unobserved latent variable (utility of firm i to engage in CSR activities)
and Wi is a set of variables that affect the CSR choice (firm’s governance structure and
characteristics). We don’t observe Ui. All we observe is a dichotomous variable
Engagementi with the value of one if the firm has high CSR scores (scores above the
sample median CSR score) and 0 otherwise. The estimated parameters of equation 4 are
used to calculate the inverse Mills’ ratio, which is then included as an additional
explanatory variable in the OLS estimation of equation 3 (second-stage estimation).
19
The second approach is the instrumental variables (IV) methodology. Following prior
studies (e.g., Harjoto & Jo, 2001, 2012), we use firm age (FIRMAGE) as an instrumental
variable. We also use geographic location, which is measured as the average CSR score
of the surrounding firms in the same province (e.g., Ontario), as an additional instrument
in the first-stage regression. In our case, FIRMAGE and the average CSR score are
highly correlated with CSR, but uncorrelated with Ri,t. The more highly correlated the
instruments with CSR, the more precise our estimates will be. The instrumental variables
(IV) regression is estimated using the two-step efficient generalized method of moments
(GMM) which generates efficient estimates of the coefficients and consistent estimates of
the standard errors that are robust to the presence of arbitrary heteroskedasticity and
clustering by firm.
4. DATA AND SAMPLE SELECTION
Our initial sample consists of the 125 Canadian firms covered by Sustainalytics
database during the years 2004-2009. After merging Sustainalytics database with
Datastream, our final sample includes 111 firms. All financial variables (e.g. stock return,
earnings, size, and leverage) are obtained from Datastream.
Sustainalytics ratings of Canadian firms are based on data gathered from a range of
sources, both internal and external to the firm. Ratings are determined through extensive
detailed research, including review of internal documents (company reporting), external
documents (e.g., media reports, NGO reports, industry publications), interviews (e.g.,
solicitation of company feedback), analysis by experienced analysts, and peer review by
sector specialists. Sustainalytics approach assesses sustainability policies, management

20
systems and performance outcomes related to environment (E), social (S), and
governance (G) issues using industry-specific indicators.3
For each E, S, and G dimension, several indicators are used to assess each company.
Examples of indicators within the E dimension include environmental policy, percentage
of ISO 14001 certified sites and suppliers, targets and programs to reduce air emissions,
and environmental fines and penalties. Examples of indicators within the S dimension
include the percentage of ISO 9000 certified sites, product recalls, philanthropic
activities, diversity in the workforce, lay-offs and job cuts, monitoring systems to ensure
compliance, and controversies over freedom of association and child/forced labour.
Examples of indicators within the G dimension include a separate position for chairman
of board and CEO, number (%) of independent directors in the Board, directors' and/or
CEO's remuneration/compensation, variable remuneration linked to sustainability
performance, and formal policy on corruption and money laundering.
Sustainalytics database provides company performance scores on E, S, and G
dimensions (three sub-scores: E, S, and G score) as well as CSR total score (ESG overall
score). The CSR total score is created for each company by multiplying the weights of
each sub-score with the sub-scores and adding them up. All CSR ratings range from 0 to
100. A higher score indicates a strong and detailed CSR engagement. In our empirical
analysis, we use these four CSR scores.
The CSR rating frequency is not uniform through years or firms. For example, only 5
firms are rated in 2004, whereas 110 firms are rated in 2009. Also, the rating is done
twice in 2005 (March and November), in seven months in 2006 (Jan, Feb, April, August,
Sep, Nov and Dec), almost every month in 2007 and 2008, and only once in 2009
3 See Sustainalytics website for more details (http://www.sustainalytics.com/research-methodology).
21
(January). Since the financial variables are available yearly, we need to construct annual
CSR scores. For each year and firm, we compute the average CSR score as the average
value of all available monthly ratings.
To control for industry, we include industry dummies in our regressions. We classify
industries based on the 10 industry groups of the FTSE Industry Classification
Benchmark (ICB): Oil & Gas (20.91% of the sample), Basic Materials (23.64%),
Industrials (8.18%), Telecommunications (3.64%), Health Care (1.82%), Consumer
Services (12.73%), Consumer Goods (3.64%), Utilities (2.73%), Financials (17.27%),
and Technology (5.45%).4 We also include year dummy variables in our regressions in
order to control for general market conditions.
5. EMPIRICAL RESULTS
Table 1 reports summary statistics for our sample. We present the mean, median,
minimum value, maximum value, standard deviation, and the number of observations.
Returns for firm i at time t (Rt) are the buy-and-hold returns for the 12 months period
starting at the beginning of the fiscal year. Future returns (R3t) are the buy-and-hold
returns for the three years period following year (t). We define firm’s earnings as net
income before extraordinary items divided by the market value of equity. Future earnings
(e3t) are the sum of earnings for the three years following year (t).5 Since Sustainalytics
definition and measurement of CSR includes three dimensions (E, S, and G), we use in
our analysis CSR total scores (overall scores or TS) and individual scores (sub-scores:
4 The geographical location of our sample firms is as follows: Alberta (26.36% of the sample), British
Columbia (13.64%), Manitoba (1.82%), Newfoundland (0.91%), Ontario (36.36%), Quebec (18.18%), and
Saskatchewan (1.82%). Note that one firm is located in the US (Illinois). 5 For robustness, we also use income before interest, taxes, depreciation and amortization (EBITDA),
divided by the market value of equity. However, our main findings remain unchanged.
22
ES, SS and GS, respectively) of each dimension. The average (median) CSR total score is
54.492 (53.5). The S and E sub-scores are much lower suggesting that firm’s total scores
are pulled downward by these two subcategories. Finally, the mean (median) G score is
82.109 (83.72).
[Insert Table 1 about here]
Table 2 shows the correlations between our main variables. As expected, the CSR
total score is highly and significantly correlated with all three sub-scores (e.g. Pearson
coefficient is 0.8567 between TS and SS). On the other hand, correlations between S, E,
and G sub-scores are much lower (e.g., Pearson coefficient is 0.1543 between ES and
GS). As suggested earlier, our empirical goal is to investigate whether CSR engagement
(high CSR scores) allows stock prices to reflect more information about future earnings.
If this hypothesis is correct, CSR scores should correlate positively with firm’s future
earnings. The positive and non-significant correlations between our CSR scores and (e3t)
do not confirm this hypothesis. However, we argue that our tests are best performed using
a multivariate regression analysis because the univariate findings do not account for a
variety of factors known to affect the return-future earnings relation. Our correlation
analysis also indicates that future returns (R3t) are not significantly correlated with
current returns (Rt) but are significantly correlated with (e3t), consistent with Collins et al.
(1994) and Lundholm & Myers (2002). As suggested by Lundholm & Myers (2002, p.
822): “future returns should not influence the regression results except through their role
as a proxy for the measurement error in future earnings”. Finally, the correlations
between R3t, et, et-1 and e3t are not excessive, suggesting that multicollinearity should not
be an issue in our multivariate analysis.

23
[Insert Table 2 about here]
Table 3 reports the primary empirical tests of equation (3). We present our findings
without control variables (model 1-4) and with a variety of controls variables (model 5-
8). In the literature, earnings timeliness (the speed with which earnings information is
reflected in stock prices) and firm size have been shown to be significantly related to
current and future earnings response coefficients. Hence, we suggest using the percentage
growth in firm’s assets and firm size as control variables in equation (3). The purpose is
to control for observed variations in future earnings–current return relation that are likely
due to causes other than CSR engagement. After controlling for these factors, our
empirical measure should reflect firm’s transparency (stock price informativeness). In
fact, we argue that firms with high expected growth should exhibit a strong relation
between current returns and future earnings in comparison to mature firms, all else equal.
The intuition behind this idea is that future earnings will be considered as a better
measure of value creation for firms’ with high growth opportunities, but a less relevant
measure for mature firms. We define growth as the percentage growth in firm’s assets
from year t-2 to year t. Size might also be an important omitted variable because Freeman
(1987) and Collins & Kothari (1989) find that returns of larger firms impound earnings
on a more timely basis than returns of smaller firms. To measure firm’s size, we use the
natural logarithm of market capitalization. We also include market-to-book (M/B) ratio,
leverage and stock liquidity into equation (3) to control for differences in returns arising
from these factors. Note that the results of estimations with control variables are similar
to those without control variables, suggesting that the inclusion of such variables does not
alter our main conclusions.
24
[Insert Table 3 about here]
For all models, we run OLS estimations with year and industry fixed effects. Standard
errors are adjusted for both heteroskedasticity and clustering at the firm level. We focus
on the coefficients of the interaction variable (CSRi,t * future earnings) because we intend
to examine whether high CSR scores impact the return-future earnings association. If
CSR engagement is associated with stock returns reflecting more information about
future earnings, we should have a positive and significant θ2. Model 1 and 5 of Table 3
present coefficients and test statistics from estimations using CSR total scores. The
remaining models examine the association between CSR and firm’s transparency using
scores of each of the three dimensions covered by Sustainalytics (SS, ES, and GS). Our
estimations reveal two important findings. First, strong CSR engagement exerts an
insignificant effect on current return-future earnings association (firm’s transparency). In
fact, θ2 is not significant in seven of the eight estimations presented in Table3. Second,
only model 4 findings indicate a positive association between firm’s social scores and
firm’s transparency (our coefficient of interest is positive (0.0244) and significant at 5%
level). Model 4 social scores are based on indicators linked to firm’s employees (e.g.,
formal policies on elimination of discrimination, freedom of association, health and
safety, and diversity in the workplace), contractors & supply chain, customers (e.g.,
product safety), society & community (e.g., controversies over local communities and
activities in sensitive countries), and philanthropy. It appears that an increase of
involvement in the social category (higher SS) is followed by an increase in firm’s
transparency. On the other hand, an improvement in other categories (E and G) has no
impact on firm’s transparency.
25
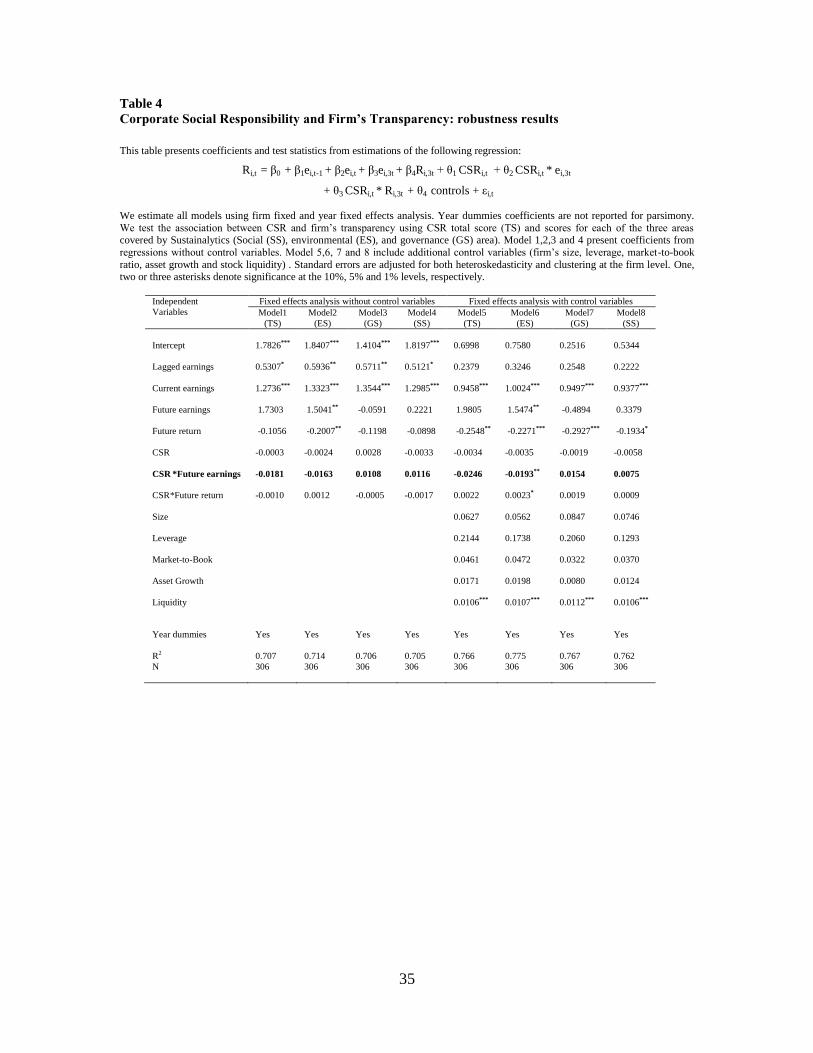
We also check the robustness of our primary results in several ways. First, we re-
estimate equation (3) using firm-fixed effects instead of OLS estimation (see Table 4 for
more details). The purpose is to control for unobserved time-invariant firm
characteristics. When we capture time-invariant heterogeneity (firm-fixed effects), our
coefficient of interest (θ2) becomes insignificant in the case of social scores. The
remaining results are similar to those reported in Table 3. Again, an increase in CSR
involvement does not make firm’s information environment more transparent.
[Insert Table 4 about here]
Second, we use the two-stage Heckman procedure to mitigate self-selection concerns.
The findings (see Table 5 for more details) suggest that firms with high CSR total scores
are more transparent in comparison to firms with low scores. In addition, high scores in
the S dimension improve firm’s transparency while an increase of involvement in G and
E dimensions has no effect on firm’s transparency. So far, there is weak evidence
indicating that one CSR dimension (S dimension) plays an important role in improving
firm’s transparency. This implies that CSR engagement linked to firm’s employees,
customers, communities, contractors and philanthropy can be considered as an extension
of firm’s efforts that promote high transparency. On the other hand, CSR engagement in
E and G dimensions does not necessarily result in high transparency or more informed
stock pricing.
[Insert Table 5 about here]
Third, we use the IV method to address other sources of endogeneity. We report the
findings of such analysis in Table 6. Again, the impact of CSR activities on the return-
26
future earnings association remains insignificant, suggesting a neutral relation between
CSR and firm’s transparency.
[Insert Table 6 about here]
6. CONCLUSION
In this paper, we propose to apply a new empirical methodology for the first time in
the CSR literature, which we hope will contribute to a better understanding of the
association between CSR engagement and firm’s transparency. We analyse a sample of
Canadian firms covered by Sustainalytics database during the 2004-2009 period along the
three CSR issues: environment (E), social (S), and governance (G).
We show that CSR involvement can improve firm’s transparency in certain
circumstances, while it has no impact on firm’s information environment in most cases.
In fact, there is some weak evidence suggesting that the social (S) dimension (e.g.,
community, employees, customers, and contractors) plays a significant positive role in
improving firm’s transparency. Overall, our results suggest that firm’s CSR engagement,
in particular for E and G issues, has no impact on firm’s transparency. The neutral
association between CSR and firm’s transparency is not an indicator that Canadian firms’
disclosure policies are inadequate or unethical. For instance, a firm’s commitment to
increase disclosure can alter the incentives for other market participants (e.g., financial
analysts) to collect and trade on private information. Therefore, we argue that any
additional disclosure linked to CSR engagement could drive out private information
acquisition, resulting in an ambiguous impact on total information in the market. It is also
plausible that Canadian firms already benefit from a richer information environment and
that CSR engagement is more oriented to benefit from advantages linked to higher

27
exposure, stock liquidity, and prestige. Further, many papers (e.g., Dhaliwal et al. 2011;
Cormier et al. 2013, 2014) show that CSR engagement expands the set of market
participants (e.g., institutional investors and financial analysts) who collect private
information about firm’s future prospects. If the presence of analysts and institutional
investors may attract more noise trading to the stock instead of private information, this
will reduce the content of relevant information in stock prices even when firms increase
their disclosure, which may result in an ambiguous impact on total information in the
market. Overall, the neutral and the absence of a negative relationship between CSR and
firm’s transparency indicates that Canadian firms’ managers do not use CSR
opportunistically to extract private benefits.
Our work suggests several avenues for future research. First, it seems important to
explore the different channels available for dissemination of CSR activities. We argue
that it is relevant to examine the impact of each dimension separately. Results based on
combined scores could be different from those based on individual scores. Second, some
of our results show that firms having high S scores are considered more credible and
transparent, while those having high E and G scores do not enjoy such benefits. It might
be fruitful to explore in future research the mechanisms underlying such differences in
the market participants’ perceptions of the S dimension relative to the E and G
dimensions. Finally, the present analysis can be extended internationally because it is
possible to witness cross-country variations in the relationship between CSR and firm’s
transparency based on differences in institutional and cultural factors.
28
REFERENCES
Akerlof, G. 1970. The market for ‘lemons’: qualitative uncertainty and the market mechanism.
Quarterly Journal of Economics 85, 488-500
Barnea, A., & Rubin, A. 2010. Corporate social responsibility as a conflict between shareholders.
Journal of Business Ethics 97, 71-86.
Baron, D. P. 2001. Private politics, corporate social responsibility, and integrated strategy.
Journal of Economics & Management Strategy 10, 7-45.
Beaver, W., Lambert, R., & Mosse, D. 1980. The information content of security prices. Journal
of Accounting and Economics 2, 3-28.
Bhattacharya, S. 1979. Imperfect information, dividend policy and ‘bird in the hand’ fallacy. Bell
Journal of Economics 10, 259-270.
Carroll, A.B. 1998. The four faces of corporate citizenship. Business and Society Review 100, 1-
7.
Cespa, G., & Cestone, G. 2007. Corporate social responsibility and managerial entrenchment.
Journal of Economics and Management Strategy 16, 741-771.
Collins, D.W., Khotari, S.P. 1989. An analysis of intertemporal and cross-sectional determinants
of earnings response coefficients. Journal of Accounting and Economics 11, 143-181.
Collins, D. W., Khotari, S.P., Shanken, J., & Sloan, R.G. 1994. The lack of timeliness and noise
as explanations for the low contemporaneous returns-earnings association. Journal of
Accounting and Economics 18, 289-324.
Cormier, D., & Magnan, M. 2013. The economic relevance of environmental disclosure and its
impact on corporate legitimacy: an empirical investigation. Business Strategy and the
Environement
29
Cormier, D., & Magnan, M. 2014. The impact of social responsibility disclosure and governance
on financial analysts’ information environement. Corporate Governance: The
International Journal of Effective Board Performance 14, 467-484
Cui, J., Jo, H., & Na, H. 2012. Does corporate social responsibility reduce information
asymmetry? Working paper. Korea University.
Dhaliwal, D., Li, O., Zhang, A., & Yang, Y. 2011. Voluntary nonfinancial disclosure and the
cost of equity capital: the initiations of corporate social responsibility reporting. The
Accounting Review 86, 59-10.
Deng, X., Kang, J., & Low, B. S. 2013. Corporate social responsibility and stakeholder value
maximization: Evidence from mergers Journal of Financial Economics 110, 87-109.
Durnev, A., Morck, R., Yeung, B., & Zarowin, P. 2003. Does greater firm-specific return
variation mean more or less informed stock pricing? Journal of Accounting Research 41,
797–836.
Eccles, R., Ioannou, I., & Serafeim, G. 2011. The impact of a culture of sustainability on
corporate behavior and performance, Harvard Business School and NBER Working
Paper Series.
Fisman, R., Heal, G., & Nair, V.B. 2006. A model of corporate philanthropy. Working paper,
Columbia University, New York.
Freeman, R. 1984. Strategic management: a stakeholder approach. Massachusetts: Pitman
Publishing Inc.
Freeman, R. 1987. The association between accounting earnings and security returns for large
and small firms. Journal of Accounting and Economics 9, 195-228.
Freeman, T., & Hasnaoui, A. 2011. The meaning of corporate social responsibility: the vision of
four nations. Journal of Business Ethics 100, 419-443

30
Friedman, M. 1970. The social responsibility of business is to increase its profits. New York
Times, 122-126.
Fuller, J., & Jensen, M. 2002. Just say no to Wall street: Courageous CEOs are putting a stop to
the earnings game and we will all be better off for it. Journal of Applied Corporate
Finance, 14, 41–46.
Gelb, D, & Strawser, J.A. 2001. Corporate social responsibility and financial disclosures: an
alternative explanation for increased disclosure. Journal of Business Ethics 33, 1-13
Gelb, D., & Zarowin, P. 2002. Corporate disclosure policy and the informativeness of stock
prices. Review of Accounting Studies 7, 33-52.
Harjoto, M., & Jo, H. 2011. Corporate governance and CSR nexus. Journal of Business Ethics
100, 45-67.
Healy, P.M., & Palepu, K.G. 2001. Information asymmetry, corporate disclosure, and the capital
markets: a review of the empirical disclosure literature. Journal of Accounting and
Economics 31, 405-440.
Hemingway, C., & Maclagan, P. 2004. Managers’ personal values as drivers of corporate social
responsibility. Journal of Business Ethics 50, 33-44.
Jensen, M., & Meckling, W. 1976. Theory of the firm, managerial behavior, agency costs and
ownership structure. Journal of Financial Economics 3, 305-360.
Jo, H., & Harjoto, M. 2012. The causal effect of corporate governance on corporate social
responsibility. Journal of Business Ethics 106, 53-72.
Jo, H., & Kim, Y. 2007. Ethics and disclosure: a study of the financial performance of firms in
the seasoned equity offerings market. Journal of Business Ethics 80, 855-878.
John, K., & Williams, J. 1985. Dividends, dilution and taxes: a signalling equilibrium. Journal of
Finance 40, 1053-1070.

31
Hart, S. L. 1995. A natural resource based view of the firm. Academy of Management Review,
20, 986-1014.
Hess, D. 2008. The three pillars of corporate social reporting as new governance regulation:
disclosure, dialogue, and development. Business Ethics Quarterly 18, 447-482.
Hong, H., & Kacperzyk, M. 2009. The price of sin: the effects of social norms on markets.
Journal of Financial Economics 93, 15-36.
Ioannou, I. & Serafeim, G. 2012. What drives corporate social performance? The role of nation-
level institutions. Journal of International Business Studies, 1-31.
Jensen, M. 2002. Value maximization, stakeholder theory, and the corporate objective function.
Business Ethics Quarterly, 12, 235–256.
Knyazeva, D., 2007. Corporate governance, analyst following, and firm behavior. Working
paper, New York University.
Lundholm, R., & Myers, L.A. 2002. Bringing the future forward: The effect of disclosure on the
returns-earnings relation. Journal of Accounting Research 40, 809-839.
McWilliams, A. & Siegel, D. 2001. Corporate Social Responsibility: A Theory of the Firm
Perspective. Academy of Management Review, 26, 117-127.
Petrovits, C. 2006. Corporate-sponsored foundations and earnings management. Journal of
Accounting and Economics 41, 335-361.
Prior, D., Surroca, J., & Tribo, J. 2008. Are socially responsible managers really ethical?
Exploring the relationship between earnings management and corporate social
responsibility. Corporate Governance 16, 160-177.
Qiu, Y., Shaukat, A. & Tharyan, R. 2014. Environmental and Social Disclosures: Link with
Corporate Financial Performance. British Accounting Review,
DOI:10.1016/j.bar.2014.10.007
32
Russo, M. V., & Fouts, P. A. 1997. A resource-based perspective on corporate environmental
performance and profitability. Academy of Management Journal, 40, 534-559.
Servaes, H., & Tamayo, A. 2013. The impact of corporate social responsibility on firm value: the
role of customer awareness. Management Science 59, 1045-1061.
Ullmann, A. 1985. Data in search of a theory: A critical examination of the relationships among
social performance, social disclosure, and economic performance. Academy of
Management Review, 10, 540-577.
Van Marrewijk, M. 2003. Concepts and definitions of CSR and corporate sustainability:
Between agency and communion. Journal of Business Ethics 44, 95-105.
Verrecchia, R. 2001. Essays on disclosure. Journal of Accounting and Economics 32, 97-180.
Warfield, T.D., & Wild, J.J. 1992. Accounting recognition and the relevance of earnings as an
explanatory variable for returns. The Accounting Review 67, 821-842.
Whitehouse, L. 2006. Corporate social responsibility: Views from the frontline. Journal of
Business Ethics 63, 279-296.
Wood, D. J. 1991. Corporate social performance revisited. Academy of Management Review 16,
691–718.
Yu, F.2008. Analyst coverage and earnings management. Journal of Financial Economics 88,
245-271.

33
Table 1: Descriptive Statistics
This table presents descriptive statistics for the sample between years 2004 and 2009. Current return for year (t) (Rt) is the fiscal-year-end adjusted share price, plus the adjusted dividends, all divided by the adjusted price at the end of the previous fiscal year (t-1).
Future return (R3t) is the buy-and-hold return for the three-year period following the current year (for years t+1, t+2 and t+3).
Lagged earnings (et-1) is net income before extraordinary items for year (t-1) divided by the market value of equity at the beginning of the firm’s fiscal year. Current earnings (et) is net income before extraordinary items for year (t) divided by the market value of
equity at the beginning of the firm’s fiscal year. Future earnings (e3t) is the sum of earnings for the three years following the current
year (for years t+1, t+2 and t+3). Market value of equity is the share price times the previous year number of shares outstanding. Total
Score represents CSR ratings (CSR performance). Such score is based on assessments of corporate activities in three different areas:
social, governance, and environmental practices. For robustness, we also use separately CSR scores for each area. Size is the
logarithm of the market capitalization. Leverage is long term debt plus short term debt, all divided by total assets. Market-to-Book
(M/B) is the market to book ratio. Asset growth is total assets at the end of year (t+2) minus total assets at the end of year (t), all
divided by total assets at the end of year (t).Liquidity is defined as trading volume divided by the number of shares outstanding.
All financial variables are winsorized at the 1% and 99% levels.
Variables Mean median Min Max Std dev N
Current return (Rt)
Future return (R3t)
Lagged Earnings (et-1)
Current earnings (et)
Future earnings (e3t)
Total Score (TS)
Environmental Score (ES)
Social Score (SS)
Governance Score (GS)
Size
Leverage
Market-to-Book (M/B) ratio
Asset Growth
Liquidity
1.2322
1.8135
0.0639
0.0625
0.3034
54.492
39.487
48.240
82.109
15.446
0.2161
2.6046
0.6028
18.946
1.1806
1.5198
0.0672
0.0672
0.2497
53.5
38.3
47.54
83.72
15.504
0.2051
2.2163
0.2823
13.343
0.2139
0.1650
-0.4346
-0.4117
-1.7037
34.8
13.63
30.62
32.165
11.410
0
0.2483
-0.6059
0.5315
3.8550
8.3243
0.5258
0.4957
2.9682
77.10
84.1
70.7166
98.47
17.963
0.6278
10.843
11.996
112.86
0.5206
1.3441
0.1175
0.1144
0.5175
7.4325
11.456
8.4699
9.4472
1.3251
0.1541
1.7089
1.4974
19.342
1061
876
978
1065
737
365
365
365
365
1176
1194
1174
974
1173
Table 2: Pearson Correlations
This table presents the correlations between variables. The sample period is from 2004 to 2009.
Rt R3t et-1 et e3t TS ES SS GS
Rt 1.0000 -0.0213 0.1925* 0.2946* 0.2135* 0.0618 0.0415 0.0826 -0.0099
R3t -0.0213 1.0000 -0.0043 0.1482* 0.5311* -0.0055 0.0577 -0.0147 -0.0404 et-1 0.1925* -0.0043 1.0000 0.3400* 0.1311 0.0632 -0.0214 0.0809 0.0641
et 0.2946 * 0.1482* 0.3400* 1.0000 0.3995* 0.0737 -0.0456 0.1128 0.0748
e3t 0.2135* 0.5311* 0.1311 0.3995* 1.0000 0.0934 0.0842 0.0728 0.0013
TS 0.0618 -0.0055 0.0632 0.0737 0.0934 1.0000 0.7731* 0.8567* 0.5794* ES 0.0415 0.0577 -0.0214 -0.0456 0.0842 0.7731* 1.0000 0.5097* 0.1543
SS 0.0826 -0.0147 0.0809 0.1128 0.0728 0.8567* 0.5097* 1.0000 0.4332* GS -0.0099 -0.0404 0.0641 0.0748 0.0013 0.5794* 0.1543 0.4332* 1.0000
* Significant at 1 % level

34
Table 3
Corporate Social Responsibility and Firm’s Transparency: primary results
This table presents coefficients and test statistics from estimations of the following regression:
Ri,t = β0 + β1ei,t-1 + β2ei,t + β3ei,3t + β4Ri,3t + θ1 CSRi,t + θ2 CSRi,t * ei,3t
+ θ3 CSRi,t * Ri,3t + θ4 controls + εi,t
We estimate all models using Ordinary Least Square (OLS) regressions with year and industry fixed effects. Year and industry
dummies coefficients are not reported for parsimony. We test the association between CSR and firm’s transparency using CSR total score (TS) and scores for each of the three areas covered by Sustainalytics (social (SS), environmental (ES), and governance (GS)
area). Model 1,2,3 and 4 present coefficients from regressions without control variables. Model 5,6, 7 and 8 include additional control
variables (firm’s size, leverage, market-to-book ratio, asset growth and stock liquidity) . Standard errors are adjusted for both heteroskedasticity and clustering at the firm level. One, two or three asterisks denote significance at the 10%, 5% and 1% levels,
respectively.
Independent
Variables
OLS without control variables OLS with control variables
Model1
(TS)
Model2
(ES)
Model3
(GS)
Model4
(SS)
Model5
(TS)
Model6
(ES)
Model7
(GS)
Model8
(SS)
Intercept
Lagged earnings
Current earnings
Future earnings
Future return
CSR
CSR *Future earnings
CSR*Future return
Size
Leverage
Market-to-Book
Asset Growth
Liquidity
Industry dummies
Year dummies
R2
N
1.5036***
0.3128*
0.8345***
-0.0348
0.0470
-0.0024
0.0089
-0.0032
Yes
Yes
0.683
306
1.5388***
0.2929
0.7822***
0.5882*
-0.0927
-0.0024
-0.0034
-0.0006
Yes
Yes
0.682
306
1.3575***
0.3239*
0.8737***
-0.4684
-0.0072
-0.0004
0.0111
-0.0013
Yes
Yes
0.677
306
1.5614***
0.2916
0.9165***
-0.6813
0.0257
-0.0046
0.0244**
-0.0034
Yes
Yes
0.688
306
0.6364*
0.1390
0.5289***
0.7698
-0.0116
0.0008
-0.0077
-0.0019
0.0407
-0.2898*
0.0509**
0.0268*
0.0028***
Yes
Yes
0.738
306
0.7511***
0.1408
0.5316**
0.6843**
-0.1084**
-0.0009
-0.0076
0.0000
0.0400
-0.2827
0.0514**
0.0276*
0.0028***
Yes
Yes
0.739
306
0.5995
0.1662
0.6119**
0.2803
-0.0356
0.0022
0.0009
-0.0010
0.0301
-0.2991*
0.0566***
0.0269*
0.0028***
Yes
Yes
0.735
306
0.7742**
0.1506
0.6052***
-0.2076
-0.0101
-0.0030
0.0124
-0.0024
0.0417
-0.2889*
0.0470**
0.0192
0.0029***
Yes
Yes
0.740
306
35
Table 4
Corporate Social Responsibility and Firm’s Transparency: robustness results
This table presents coefficients and test statistics from estimations of the following regression:
Ri,t = β0 + β1ei,t-1 + β2ei,t + β3ei,3t + β4Ri,3t + θ1 CSRi,t + θ2 CSRi,t * ei,3t
+ θ3 CSRi,t * Ri,3t + θ4 controls + εi,t
We estimate all models using firm fixed and year fixed effects analysis. Year dummies coefficients are not reported for parsimony.
We test the association between CSR and firm’s transparency using CSR total score (TS) and scores for each of the three areas covered by Sustainalytics (Social (SS), environmental (ES), and governance (GS) area). Model 1,2,3 and 4 present coefficients from
regressions without control variables. Model 5,6, 7 and 8 include additional control variables (firm’s size, leverage, market-to-book
ratio, asset growth and stock liquidity) . Standard errors are adjusted for both heteroskedasticity and clustering at the firm level. One, two or three asterisks denote significance at the 10%, 5% and 1% levels, respectively.
Independent
Variables
Fixed effects analysis without control variables Fixed effects analysis with control variables
Model1
(TS)
Model2
(ES)
Model3
(GS)
Model4
(SS)
Model5
(TS)
Model6
(ES)
Model7
(GS)
Model8
(SS)
Intercept
Lagged earnings
Current earnings
Future earnings
Future return
CSR
CSR *Future earnings
CSR*Future return
Size
Leverage
Market-to-Book
Asset Growth
Liquidity
Year dummies
R2
N
1.7826***
0.5307*
1.2736***
1.7303
-0.1056
-0.0003
-0.0181
-0.0010
Yes
0.707
306
1.8407***
0.5936**
1.3323***
1.5041**
-0.2007**
-0.0024
-0.0163
0.0012
Yes
0.714
306
1.4104***
0.5711**
1.3544***
-0.0591
-0.1198
0.0028
0.0108
-0.0005
Yes
0.706
306
1.8197***
0.5121*
1.2985***
0.2221
-0.0898
-0.0033
0.0116
-0.0017
Yes
0.705
306
0.6998
0.2379
0.9458***
1.9805
-0.2548**
-0.0034
-0.0246
0.0022
0.0627
0.2144
0.0461
0.0171
0.0106***
Yes
0.766
306
0.7580
0.3246
1.0024***
1.5474**
-0.2271***
-0.0035
-0.0193**
0.0023*
0.0562
0.1738
0.0472
0.0198
0.0107***
Yes
0.775
306
0.2516
0.2548
0.9497***
-0.4894
-0.2927***
-0.0019
0.0154
0.0019
0.0847
0.2060
0.0322
0.0080
0.0112***
Yes
0.767
306
0.5344
0.2222
0.9377***
0.3379
-0.1934*
-0.0058
0.0075
0.0009
0.0746
0.1293
0.0370
0.0124
0.0106***
Yes
0.762
306

Table 5
Corporate Social Responsibility and Firm’s Transparency: self-selection bias estimation This table reports the results of the Heckman (1979) two-stage procedure. In the first stage, we present the coefficient estimates from a
probit model explaining the determinants of CSR engagement. We consider that firm’s governance structure (e.g. Independent boards (INBOARDS) and analyst coverage) may lead to CSR engagement. NA, in the first stage equation, is the number of analysts
following the firm. We also consider firm’s characteristics (size, leverage, market-to-book, and ROA). The dependent variable is a
dichotomous variable that takes the value of 1 if firm’s social ratings are above the sample median and 0 otherwise. Model 1 reports results from regressions using CSR total score (TS). Model 2, 3 and 4 present results from estimations using social scores (SS),
environmental scores (ES) and governance scores (GS), respectively. In the second stage, we estimate our main equation with control
variables (firm’s size, leverage, market-to-book ratio, asset growth and stock liquidity). Standard errors are adjusted for both heteroskedasticity and clustering at the firm level. One, two or three asterisks denote significance at the 10%, 5% and 1% levels,
respectively.
First stage
Dependent variable
(CSR dummy)
Model 1
Probit
(TS)
Model 2
Probit
(SS)
Model 3
Probit
(ES)
Model 4
Probit
(GS)
Second Stage
Dependent variable
(Return)
Model 1
(TS)
Model 2
(SS)
Model 3
(ES)
Model 4
(GS)
Intercept
Log(1+NA)
INBOARDS
Size
Leverage
Market-to-Book
ROA
0.2625
0.0388
1.9125*
0.3353***
1.1931
-0.248***
0.7851
-12.79***
-0.7020
3.2670***
0.8075***
0.7811
-0.1396**
-1.5619
1.2777
0.9625**
0.3186
0.1915
3.1500**
-0.429***
2.0304
-4.175*
0.5961
0.7404
0.1822
0.5018
-0.2703**
2.1222
Intercept
Lagged earnings
Current earnings
Future earnings
Future return
CSR
CSR*future earnings
CSR*Future return
Size
Leverage
Market-to-Book
Asset Growth
Liquidity
Mills
Industry dummies
Year dummies
Wald chi2
p-value Wald chi2 N
0.8872
0.1653
1.3236***
-7.4218***
0.1588
-0.0233**
0.1330***
-0.0051
0.0801**
0.0133
0.0216
0.0147
0.0028***
-0.0126
Yes
Yes
489.6
0
247
1.0579
0.2659
1.6669***
-3.6505**
0.3426
-0.0044
0.0737***
-0.0086
-0.0008
-0.3189
0.0799***
0.0261
0.0025**
-0.1277
Yes
Yes
556.8
0
246
-0.1068
0.0865
1.4026***
0.2200
-0.0169
0.0022
0.0026
-0.0032
0.0556
-0.6553*
0.0595*
0.0240
0.00035***
-0.0818
Yes
Yes
489.6
0
247
-2.7026
0.0040
1.5715***
4.1248
0.7980
0.0158
-0.0405
-0.0103
0.1126*
-0.0086
0.0289
0.0139
0.0026
0.3919
Yes
Yes
178.6
0
247

37
Table 6
Corporate Social Responsibility and Firm’s Transparency: Instrumental Variable approach This Table presents the results of the Instrumental variable methodology that addresses endogeneity concerns on the impact of CSR engagement on firm’s transparency. One, two or three asterisks denote significance at the 10%, 5% and 1% levels, respectively.
Independent
Variables
Model1
(TS)
Model2
(ES)
Model3
(GS)
Model4
(SS)
Intercept
Lagged earnings
Current earnings
Future earnings
Future return
CSR
CSR*Future earnings
CSR*Future return
Size
Leverage
Market-to-Book
Asset Growth
Liquidity
Year dummies
N
P value of Hansen
statistic
-2.226
0.347
0.495
3.146
0.982
0.055
-0.047
-0.021
-0.015
-0.128
0.070**
0.041
0.000
Yes
296
0.544
0.4607
0.2061
0.640**
0.540
-0.267
-0.011
-0.003
0.004
0.027
0.004
0.052***
0.027*
0.001
Yes
296
0.458
-2.263
0.246
0.640**
2.890
0.631
0.031
-0.030
-0.009
0.006
-0.065
0.074*
0.038
0.000
Yes
296
0.347
21.78
-2.722
2.752
-19.87
-9.366
-0.542
0.409
0.195
0.322
-0.435
0.078
-0.220
0.016
Yes
296
0.993