corporate social capital and firm performance - optimice · between particular aspects of corporate...
TRANSCRIPT

1
Presented at the 2008 Academy of Management Conference, Anaheim, August
Corporate Social Capital and Firm Performance
Dr. Laurence Lock Lee
Optimice Pty Ltd and
Economics and Business Faculty
University of Sydney
Abstract
Traditional corporate social capital formulations have been based on a firm’s positioning within
its network of market place alliances. This paper extends this model by incorporating firm status
attributes of intellectual capital and corporate reputation into an integrated model for corporate
social capital. An empirical study of some 155 firms in the global Information Technology sector
was conducted, exploring the linkage between elements of corporate social capital and firm
performance. A key contribution of this research is the specificity of the linkages identified
between particular aspects of corporate social capital and firm performance. The results find that
money matters, with financial soundness being the most predictive corporate social capital
element for firm performance. Beyond financial soundness, a firm’s market network centrality
and human capital were significant predictors. For large or profitable firms, centrality was found
to be a liability and internal capital an asset, in terms of firm performance. In contrast, for small
or loss making firms the opposite is true, where centrality is an asset and internal capital a
liability. Additionally, the direction of influence of centrality could change depending on which
performance measure is used.
Key Words: Corporate Social Capital, Intellectual Capital, Corporate Reputation
2
Introduction
Leenders and Gabbay (1999) raised the awareness of Corporate Social Capital (CSC), focusing
on concepts, theories and the application of social capital to business. CSC is often associated
with the network of inter-firm alliances or joint ventures. The business press coverage of such
activity is escalating exponentially, with more than 80,000 articles reporting on the topic in the
past year, a rate of over 200 per day1. Around 20% of this activity is in the information
technology sector. With most organizations claiming a multitude of alliances, markets can no
longer be characterized by individual buyers and sellers. The macro view of markets now consists
of a complex web of inter-organizational activity. A firm’s ability to leverage its position or build
its social capital within a complex web of market actors, is likely to have a significant influence
on its overall performance.
Several researchers have identified linkages between joint venture performance and firm
performance (Stuart, 2000; Das, Sen & Sengupt, 1998; Baum & Calabrese, 2000; Tsai, 2001).
However, limiting the formulation of CSC to structural alliance network positioning is
potentially understating its influence. This has been acknowledged by some authors in referring
to this type of formulation as “structural aspects of social capital” (Borgatti, Jones and Everett,
1998), leaving room for richer interpretations. This paper develops a concept for CSC which
moves beyond the structural aspects. This richer model of CSC adds a “connectionist” view of
firm ties (Borgatti and Foster, 2003), whereby ties are seen as more than bridges between firms,
but also identify firm attributes that act as attractors for tie formation. Podolny (2001) identifies
such ties as pipes and prisms and explores the value of the status of actors in exploiting market
1 Factiva search on “Joint Venture” activity for the calendar year 2007.

3
place structural holes (Burt, 1992). A firm’s status is seen as a potential signal of the underlying
quality of a firm’s products or services, leading to various economic benefits (Podolny, 1993).
Podolny formulates a firm’s status in terms of the nature of its network connections only
(Bonacich, 1987). But status is likely to be comprised of many more attributes than the nature of
a firm’s current alliance ties. For example, Lin’s (1982) theory of instrumental action speaks of
attributes like wealth, status and power placing actors within a social hierarchy, dictating the
level of access to social resources. In this research, a firm’s status within the social structure of
the market is developed as a firm’s absorptive capacity, intellectual capital and its corporate
reputation.
This research addresses what impact a firm’s CSC has on its overall performance. A new
integrated model for CSC is developed to help understand what elements of CSC can be
exercised in improving firm performance. This research makes use of advanced content analysis
techniques, applied across an extensive range of business publications, to enable a richer
interpretation of CSC across a sample of some 155 firms in the global IT services sector. The
contribution this research aims to make is to firstly add to the much needed pool of empirical
research required to substantiate or otherwise the rich suite of theories that have been developed
around social capital, in particular, at the organizational level. Secondly, by building a bridge to
the intellectual / intangible asset management field, the research aims to contribute an
understanding of the role CSC plays in a firm’s intangible asset performance.
Firm performance is measured by Return on Investment (ROI), Total Shareholder Return (TSR)
and market to book values (measured as Tobins Q). The results show that wealth matters when it
comes to good CSC and good performance, with financial soundness being a significant predictor

4
of firm performance for all performance measures. Other CSC elements which influence firm
performance include centrality, absorptive capacity, human capital and internal capital. The size,
profitability and IT industry sub sector is seen as important in determining CSC’s influence on
performance. However, a management paradox exists for certain elements where the direction of
influence changes depending on firm circumstances. Centrality is found to mostly be a liability
and internal capital an asset for large or profitable firms, in influencing performance. For small or
loss making firms the opposite is found with centrality proving an asset and internal capital a
liability in terms of performance. The direction of influence for centrality swings between being a
liability when predicting ROI, to an asset when predicting market measures like Tobins Q.
Section 2 provides context from the literature from which the formulation of CSC is derived.
Numerous normative studies propose a link between CSC and firm performance, but there is a
paucity of empirical work directly linking CSC and specific performance metrics like return on
investment, and shareholder return. Section 3 provides the research questions being addressed
and subsequent hypotheses formulation. An innovative suite of methods have been assembled
along with the development of an integrated model of CSC, to test the research hypotheses, and is
described in section 3. The methods are drawn from the fields of social network analysis, content
analysis and traditional multivariate statistical analyses. Section 5 provides the results of the
analysis and the specific hypotheses test results. Post hoc analyses results are also reported. A
discussion is provided in section 6 on the relevance of the results obtained in terms of its
contribution to the research themes for social capital, intellectual or intangible capital and
corporate reputation. The potential impact on management practice in leveraging CSC for firm
performance is also discussed. Finally, potential limitations of the research and suggestions for
future research are offered.

5
1. Corporate Social Capital
CSC has been defined as “the set of resources, tangible or virtual, that accrue to a corporate
player through the player’s social relationships, facilitating the attainment of goals” (Leenders
and Gabbay, 1999, p3). The breadth of current CSC definitions leaves ample room for a variety
of conceptual formulations. In this research a wide net has been deliberately cast to incorporate
complementary business constructs that arguably provide a more complete construct for CSC,
beyond formulations that are limited to network structural positioning. This review initially
explores the business concepts that are potential contributors to CSC. This is followed by a
review of selected empirical research studies.
The alliance literature mostly focuses on “the single deal”, however, the sheer growth in the
number of alliances being formed will naturally lead to discussions of “alliance networks”,
beyond simple partnerships (Dyer & Nobeoka, 2000; Gulati, Nohria, & Zaheer, 2000; Uzzi,
1997). The social capital available to firms within a network will depend on how they identify
and execute network connections as well as how attractive they are as potential partners. Social
networks become valuable conduits for information and knowledge flows, providing access to
new opportunities, but over-embeddedness can also be constraints on independent action (Portes,
1998; Uzzi, 1997). Social capital becomes even more important in uncertain environments
(Gulati & Gargiulo, 1999), when firms fall back to their trusted partners, whom they typically
have some history with (Gulati et al., 2000; McCutcheon & Stuart, 2000). The choice of network
partners is most influenced by a prior contact or experience (Gulati, 1995).
A connection between social capital and intellectual capital has been argued by several authors
(McElroy, 2002; Nahapiet & Ghoshal, 1998; Pomeda, Moreno, Rivera, & Martil, 2002).

6
Intellectual Capital has commonly been decomposed into the three basic components of external
capital, internal capital and human capital (Stewart, 1997; Sveiby, 1997). External Capital is
defined as the intangible contributions of customers, suppliers and partners to the firm. Internal
Capital refers to the internal systems, patents, organisational structures and Human Capital as the
skills, competencies and education of the firm’s staff.
While social capital proponents are arguing for its inclusion in formulations of intellectual capital
(McElroy, 2002; Pomeda et al., 2002), the current research views intellectual capital as a
contributor to CSC: human capital as an actor’s human competence attributes that attract the
actor into social networks; external capital is relationships with external stakeholders and internal
capital as the network structures that exist inside the organisation. In effect, intellectual capital is
being positioned as a component of firm “status” as described by Podolny (1993).
Corporate reputation is introduced here as a firm status attribute, and therefore social capital
contributor. While corporate reputation has largely been developed within the marketing
literature (Brown & Perry, 1994; Dollinger, Golden, & Saxton, 1997; Fombrun & Shanley,
1990), one could argue that reputations, like social capital, are measured or assessed by external
actors. As such, reputations are socially constructed and therefore deserve to be considered as a
form of social capital, operating in the market place.
Empirical Studies Linking Social Capital Elements to Firm Performance
This review has purposefully cast a broad net across the literatures of social networks, intellectual
capital and corporate reputation for studying the links between CSC elements and firm

7
performance. Despite the breadth of the literature covered, empirical studies specifically linking
CSC to firm performance are scarce.
One line of investigation of the benefits of alliances is seen as the actual announcement. It has
been found that the announcement itself can provide abnormal positive movements in share price,
especially for technology based alliances (Chan, Kensinger, Keown, & Martin, 1997; Das, Sen,
& Sengupta, 1998). Whether this benefit is sustained post announcement or whether the
accounting benefits like ROI are also achieved is still a point of contention. Florin, Lubatkin et
al.(2003) investigate firm performance pre- and post IPO. From a sample of 275 ventures, they
find that social capital does leverage other firm resources to achieve a sustainable competitive
advantage.
The semiconductor and biotechnology industry sectors have been popular areas for exploring
interorganisational alliance effects. These sectors are seen as emerging growth sectors with high
levels of alliance activity. For these studies, growth in revenue, staff members or R&D spending
are the firm performance measures of interest. The independent variables tested varied from
partner attributes like age, experience, revenue, patents, innovativeness and diversity, to
centrality and crowding (Baum, Calabrese, & Silverman, 2000; Podolny, Stuart, & Hannan,
1996; Stuart, 2000). These studies were largely interested in how start-up firms could enhance
their growth prospects by partnering with larger, more experienced firms. The studies focused on
the social capital of the potential partners, more so than the firms themselves.
Koka & Prescott (2002) examined the impact of social capital on information dimensions of
volume, diversity and richness. Using the Steel industry as an example they were able to show

8
that different dimensions of social capital impacts performance differentially. Like some of the
previous studies, firm performance was limited to sales performance.
The corporate reputation literature is built on the premise that corporate reputation is tightly
linked to firm performance. The empirical studies however are mostly focused on what attributes
of a firm contribute to its reputation. In this case firm performance measures like ROA, earnings,
sales, book values, advertising, size are used as predictors of corporate reputation, rather than the
reverse (Brown & Perry, 1994; Fombrun & Shanley, 1990).
The most common intangibles included as independent variables are advertising and R&D
expenditure, measures that are available for some sectors in the Compustat data base. While the
studies find that these intangible factors do have an influence on share values (Bond & Cummins,
2003; Chauvin & Hirschey, 1993), Bond and Cummins find that they fall far short of explaining
the growing market to book gap. The accounting research has only been able to include limited
constructs for intangible assets, mostly being R&D and advertising (Chauvin & Hirschey, 1993;
Lev, 2001). No relational or external capital attributes are included and therefore are incomplete
for a comprehensive study of intangibles and social capital.
In summary, the empirical research around CSC and firm performance is somewhat limited.
Several studies have focused on single firm performance measures which only partially describe
a firm’s overall performance. The selection of independent variables is varied, but no single study
provides a comprehensive treatment of social capital. If it is measured at all it is limited to a
structural measure with a small selection of additional attributes like absorptive capacity,
experience, age, diversity and trust. The development of an integrated model for social capital

9
that assesses the impact on a comprehensive suite of firm performance measures is the gap in the
literature that this research addresses.
2. Research Questions and Hypotheses Development
The empirical research literature has looked at a variety of firm performance measures. In most
cases only a single performance measure is used, which does not provide a balanced perspective
of a firm’s overall performance. For this research firm performance measures are: return on
investment; Tobins Q (a market to book value measure); and total shareholder return are used.
Sales performance is used as a control variable for firm size.
The research questions being addressed here are:
1. What impact does CSC have on overall firm performance?
2. To what extent do the sub-elements of CSC contribute or detract from firm performance?
The hypotheses addressing these questions are built up through an integrated model of CSC as
shown in Figure .
Insert Figure 1 about here
The base of the formulation is structural social capital which is comprised of alliance networks
centrality and absorptive capacity, which is included to cater for the ability to absorb new
knowledge from alliances (Tsai, 2001). The qualitative (non structural) elements of social capital
are conceptualized as human and internal capital. The addition of network centrality to qualitative
social capital provides a conceptual formulation for intellectual capital (Sveiby, 1997). Corporate
reputation can be conceptualised as intellectual capital with the addition of financial soundness.
Collectively the concepts of network centrality, absorptive capacity, internal capital, human
capital and financial soundness can be incorporated into an integrated model for CSC.
10
From this model of CSC a set of hypotheses are now developed. The first construct is a firm’s
network centrality, measured by its positioning within the market’s network of alliances, versus
firm performance. The hypothesis is that a firm’s centrality can be viewed as a significant
intangible asset for the firm. Intellectual capital researchers refer to external capital (Sveiby,
1997) or relationship capital (Marr & Chatzkel, 2004; Roos & Roos, 1997), but not specifically
centrality. Additionally, the hypothesis relating firm centrality to performance is inferred by social
network researchers (Baker, 1990; Burt, 1992; Tsai, 2001) and will be tested empirically here.
H1: Centrality is positively associated with Firm Performance
The second construct adds absorptive capacity, which is operationalised as R&D intensity
(Cohen & Levinthal, 1990; Tsai, 2001), to centrality and provides a richer concept, labeled here
as “structural social capital”. Absorptive capacity takes into account a firm’s capacity to absorb
knowledge or information from an alliance partner. The hypothesis below suggests absorptive
capacity can predict overall firm performance:
H2: Absorptive capacity is positively associated with Firm Performance
The third construct uses elements from the intellectual capital model (Sveiby, 1997) to come up
with an enriched version of an intellectual capital construct. The Sveiby model decomposes
intellectual capital into components of external capital, internal capital and human capital. For
this research, centrality is used in place of the “external capital” element in Sveiby’s intellectual
capital model on the basis of conceptual equivalence, in that they both focus on a firm’s external
relationships. A number of authors have proposed that a firm’s intellectual capital predicts firm
performance (Sveiby, 1997; Stewart, 1997; Lev, 2001). The other elements of intellectual capital

11
are also reported separately in the literature. The relationship between human and social capital is
argued by Coleman (1988). Pennings, Lee & VanWitteloostuijn (1998) identify the importance of
both social and human capital on firm survival. The following hypothesis proposes the
relationship between human capital and firm performance.
H3: Human capital is positively associated with Firm Performance
The fourth construct, internal, or organisational capital, has also been related to the competitive
advantage of the firm (Martin-de-Castro, Navas-Lopez, Lopez-Saez, & Alama-Salazar, 2006). A
fourth hypothesis is therefore proposed to test this proposition empirically:
H4: Internal Capital is positively associated with Firm Performance
The fifth construct introduces financial soundness together with intellectual capital to come up
with a representation of corporate reputation. Several authors have developed theories linking
corporate reputation, to firm performance (Fombrun & Shanley, 1990; Hall, 1992). The elements
of centrality, internal and human capital are to be tested in H1, H3 and H4. Therefore the final
component of corporate reputation is tested in H5 below:
H5: Financial soundness is positively associated with Firm Performance
Figure 2 summarises the linkage between the research model and the proposed hypotheses.
Insert Figure 2 about here
The ovals represent latent variables which are manifested in the observed or measured variables
identified in the rectangles. The dotted connection between centrality and external capital
identifies the potential redundancy between these elements from a conceptual perspective. The

12
hypotheses are shown linking the measured variables, being the elements of CSC, with the three
firm performance measures of ROI, TSR and Tobins Q.
3. Research Methods
This section provides a description of the research methods employed to test the hypotheses
identified in the previous section. Included is a rationale for selecting the IT services sector. Also
the data sources and sampling approach used are described. Finally, the analytical techniques
employed are followed by the specific variables definitions.
The empirical research has been focused on a single market sector, the global information
technology (IT) sector of firms listed on the US stock exchange (GICS code 45). The rationale
for the selection is both for reasons of scope management, but also for the “high intangible”
characteristics of this sector. Given that CSC incorporates largely intangible elements, the
selection of a sector high in intangibles is more likely to provide a comprehensive source of data
from which to conduct the research. It is also an industry rich with alliance activity, providing a
good data source for the study of network patterns in the market place (Hagedoorn &
Schakenraad, 1992; Knoke, Yang, & Granados, 2002).
Three key commercial data sources have been used in this research. The Computer Wire
contracts data base provides more than 10 years of data on major contracts signed in the IT sector
world wide. Factiva is a Dow Jones and Reuters company which provides global news and
business information through on-line sources. Finally, the Compustat financial data base is
considered a primary source of financial data for publicly listed US companies.

13
The sampling period selected for this research ranges from 1st January 2001 to 31
st December
2004. This period was purposely chosen to avoid the extreme market valuation changes of the so
called dotcom boom and bust. Panel data was created by pooling each of the separate year cases
into a single sample of 624 cases. The Factiva news sources were updated on a daily basis during
this period. The Computer Wire transaction data base records the date of the transaction, the size
of the contract, the client, the prime supplier and subcontractors. The Compustat financial data
base contains data of differing periodicity depending on the factor selected. The financial data
drawn to calculate attributes for financial soundness, Tobins Q and total shareholder return are
calculated on a calendar year basis.
Four analytical techniques were used: social network analysis, content analysis, financial analysis
and multivariate statistical analysis. To establish a measure of centrality for a firm, a network
representation of the market was developed using alliance data mined from commercially
available data sources. Content analysis of the Factiva and Computer Wire data bases was used to
develop the networked representation of the IT Services market place.
An eigenvector centrality index measure (Bonacich, 1987) was used for calculating centrality in
the market place. Degree centrality, designed to identify those firms who are most connected in
the market place, is another popular centrality measure. The eigenvector measure is a prestige
measure identifying those firms connected to the most connected firms. The use of this centrality
measure was motivated from pilot studies that indicated that firms connected to multiple and
highly connected systems integration firms, having significantly higher market to book
valuations i.e. an inferred prestige effect. This measure has also been used by Podolny (1993) as
14
a measure of a firm’s status in the market place. The pilot studies also indicated a high
correlation between degree centrality and eigenvector centrality for the data set used, therefore
either centrality measure would have sufficed. The eigenvector centrality measure was
calculated using the UCINET software (Borgatti, Everett, & Freeman, 2002).
Content analysis (CA) is a popular method for systematically developing quantitative
descriptions from textual information (Neuendorf, 2001). Prior uses of CA to assess intellectual
capital strengths of firms has been limited to self reported content like annual reports (Guthrie &
Petty, 2000) or the limited coverage that market analyst reports can provide (Arvidsson, 2004).
Using the Factiva news source and computer assisted content analysis, this research significantly
broadens the base data from which intellectual capital elements were identified. The ability to
search across a large range of business publications from analyst reports to general news articles
provided a larger data source for the content analysis, representing the views of a much broader
range of reporters. It also now makes it feasible to analyse many firms and whole market sectors
using CA.
The technique is typically based on identifying and counting concepts that exist within the text, to
test hypotheses developed as part of a quantitative research activity. A coding scheme was
developed for each variable. Pilot studies were undertaken to develop the coding scheme for each
variable. For internal and human capital measures the following mapping was made between the
formulations offered by Guthrie and Petty, 2000 and pre-defined Factiva taxonomy terms as
shown below:
Inset Table 1 about here

15
The centrality of a firm was determined using the network of joint venture relationships identified
by the number of unique articles linking firms that are categorized under the “Joint Venture”
Factiva taxonomy term. The number of unique joint venture announcements was used as strength
of relationship proxy.
The concept of social capital liabilities was introduced through identifying negative stories as
well as positive and neutral stories. An index was developed which weights negative stories at
twice that of positive or neutral stories (i.e. the index is equal to the number of positive or neutral
articles minus the number of negative articles times 2). The indexing scheme was based on the
greater perceived impact of negative news as opposed to positive news on stock prices (De Gieij
& Marquering, 2004; Dean & Faff, 2004). In identifying negative stories to create the index, the
coding scheme has typical themes which would constitute a negative story. For human capital,
typical themes would be layoffs or senior management moves.
Financial soundness is a measure of a firm’s financial robustness i.e. its ability to sustain an
adequate financial performance in the face of potentially unanticipated events like a sudden
market downturn or natural disasters. Financial soundness was operationalised through the use of
Altman’s Z score (Eidleman, 1995), a proven method for prediction of business failure. Altman’s
Z score is calculated as:
Z = 1.2* X1 + 1.4*X2 + 3.3*X3 + 0.6*X4 + 1.0*X5;
Where:
X1 = Working Capital/Total Assets
X2 = Retained Earnings/Total Assets
X3 = EBIT/Total Assets

16
X4 = Market Value of Equity/Book Value of Debt
X5 = Sales/Total Assets
This measure was initially designed to assess the potential for a firm to become insolvent or
bankrupt in the short to medium term. The measure has been chosen for the simplicity of
calculation from readily available data, and its popularity as a financial soundness measure.
Financial metrics were used to identify firm performance measures and intangible asset
performance. Firm performance was operationalised through a selection of several measures:
Return on Investment (%); Total Shareholder Return (%); and Tobins Q (ratio).
Intangible asset performance was operationalised as a market to book value estimate known as
Tobins Q. Tobins Q uses replacement values of assets to represent book values in place of the
traditional historic book values. As replacement values are not commonly assessed, an
approximation for Tobins Q was used (Chung & Pruitt, 1994) and was calculated as:
Tobins Q = (Market Value + Preferred Stock Liquidation Value + Total Debt) / Total Assets.
Multiple regression analysis was used to identify the explanatory power of CSC for the selected
firm performance measures, at each level of the CSC formulation. This stepwise analysis is
aimed at identifying the expected improvement in explanatory power with each additional CSC
layer.
Insert Figure 3 about here

17
Based on prior research studies in related fields (Hand & Lev, 2003; Lev & Sougiannis, 1999;
Stuart, 2000), firm size and industry sub sector were used as control variables. The additional
control variable of profitability was introduced due to the relatively large proportion of loss
making firms in the sample. The proposition that the role of book values on share values differs
for firms in loss making, rather than profit making situations (Collins, Pincus, & Xie, 1999),
further supports its selection as a control variable.
A snowball sampling procedure for network data was used for this research. For large networks,
where the identification of all network actors is impractical, a sampling method is required. For
large networks there exists no systematic theory of network sampling (Granovetter, 1976;
Rothenberg, 1995). Snowball sampling enlarges an initial node selection by adding adjacent
nodes through a number of stages (Frank, 1979). Frank builds a mathematical theory to
demonstrate a connection to probability theory. Theory aside, snowball sampling has proved the
most pragmatic method for sampling large networks. Rothenberg (1995) argues that empirically
driven sampling, as identified above, provides a more representative sample for network data,
than methods that try to satisfy probabilistic criteria.
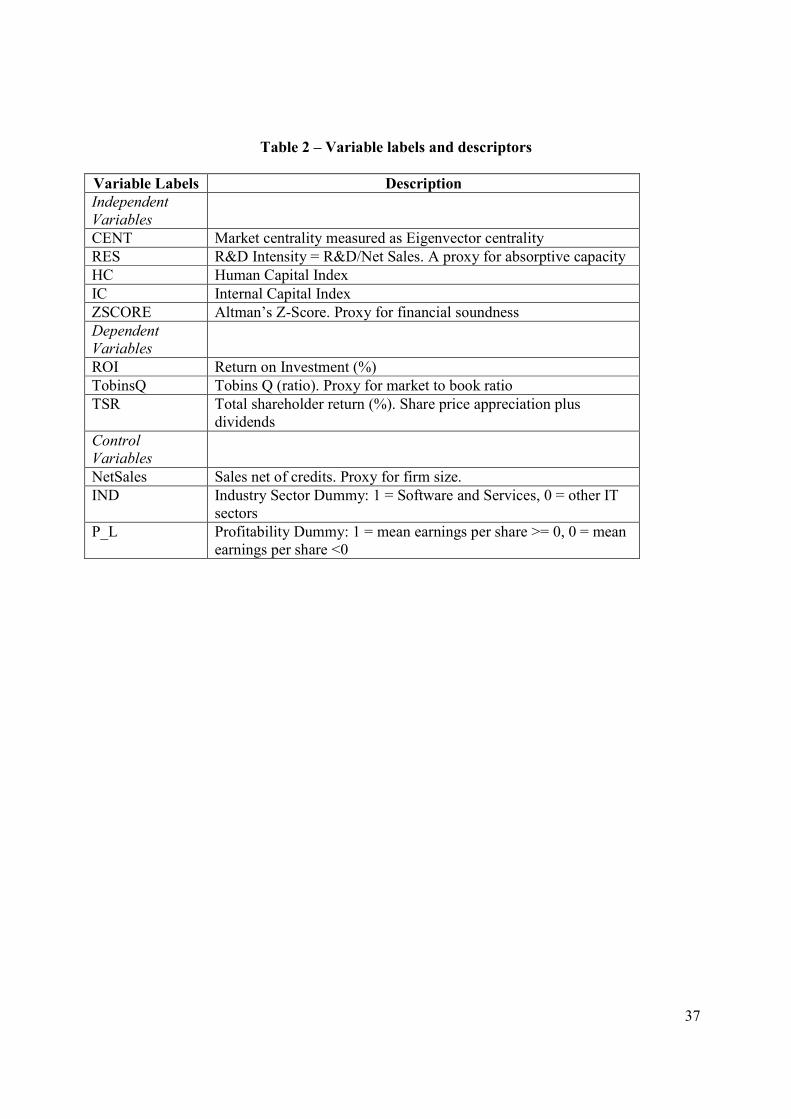
Table 2 identifies the labels for each variable used in the analyses, with a short description.
Insert Table 2 about here
This section has established and described the methods and analytical techniques employed. The
next section reports on the results obtained from the methods described in this section.

18
4. Results
None of the selected variables were able to meet the test for normality and therefore needed to be
transformed for multivariate analysis. Both log and/or inverse transformations were trialed for
each of the variables (Tabachnick & Fidell, 2001). Largely these traditional transformations did
not achieve the desired results. Given the nature of the distributions and the presence of several
extreme outliers with many of the variables, rank transformations were used. While there is some
loss in statistical power with rank regressions, monotonically increasing/decreasing distributions
with the presence of outliers, lend themselves to the use of rank transformations (Iman &
Conover, 1979). The transformation to ranks avoids the need to exclude extreme outliers shown
in the above distributions. All variables participating in the hypotheses tests were therefore
transformed to ranked variables.
Panel data was created by pooling each of the separate year cases into a single sample of 624
cases. For the centrality measure, that only had a single measure across the four year period, the
results were replicated for each year. The pooled cross-sectional time series data runs the risk of
violating the independence of observations assumptions, through the presence of serial
correlations within the time series. Lagrange multiplier (LM) tests were conducted to determine
whether the panel data should be tested using a random effects model (Greene, 2000), rather than
the classical regression model. It was anticipated that this would be the case for the longitudinal
data contained within the panel data and therefore the random effects model was adopted for the
multiple regression analyses. Heteroscedacity would also be controlled for with White’s adjusted
t-statistic (White, 1980).
.

19
A hypothesis test was conducted for each of the three firm performance measures of ROI, Tobins
Q and TSR. Three control variables for firm size, profitability and industry sub sector were
included. The results indicated that the selected control variables were significant predictors for
firm performance for most of the firm performance scenarios. Each control variable was therefore
investigated for all models, resulting in a further 18 tests in addition to the 3 tests conducted on
the full sample. Only the results on the full sample are reported here.
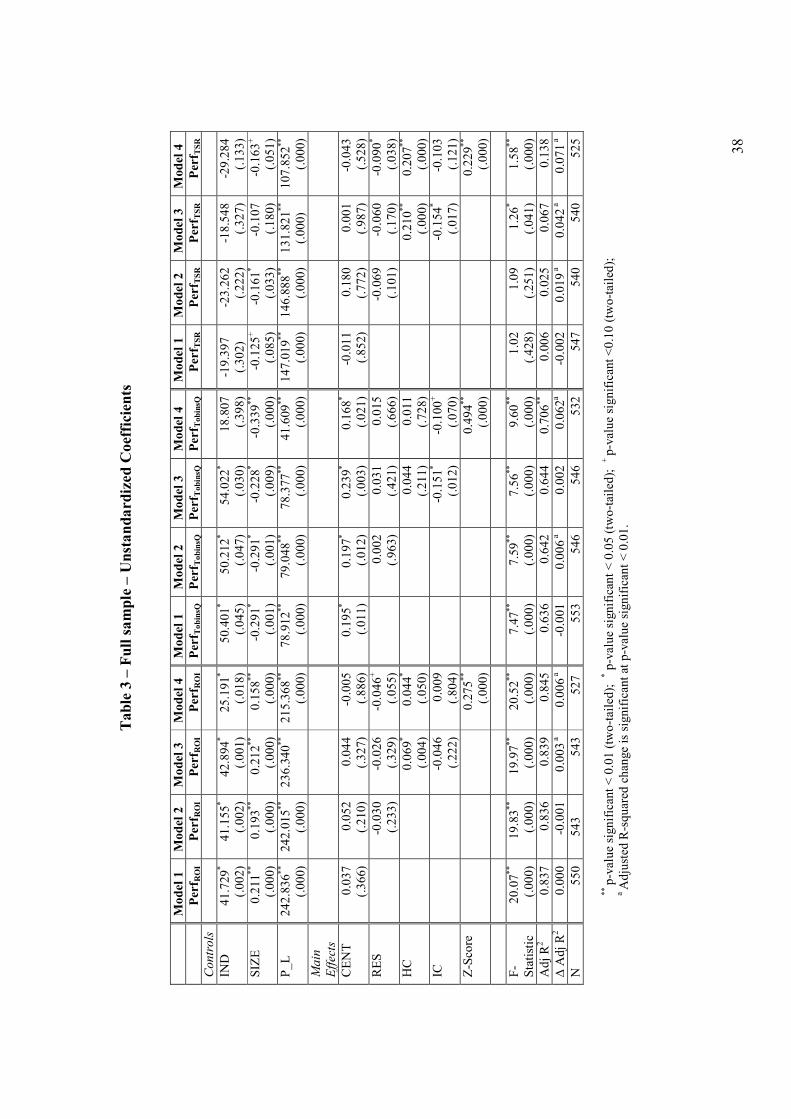
A stepwise regression approach was used to introduce each of the models from model 1 to 4 (as
per figure 3) one step at a time. Statistical significance is indicated at the p< 0.01, p< 0.05 and p <
0.10 level for 2-tailed tests. As the hypotheses predict a directional influence, the equivalent
significance levels should be 1-tailed tests. Therefore the statistically significant variables shown
are actually significant to at least the p < 0.05 level. Table 3 shows the unstandardised
coefficients with the p values in brackets below.
Insert Table 3 about here
The change in explanatory power in moving from model 1 to model 4 is measured through
changes in the adjusted R2. The ∆ Adj R2 for Model 1 reflects the change from the Adj R2 for a
regression model containing the control variables only (not shown). Changes that are statistically
significant are indicated. As anticipated, the control variables of firm size, profitability and
industry sub-sector all had a statistically significant influence on the test results, though industry
sub-sector was only significant for ROI performance. Given the significance of the control
variables, the regression test interpretations were made on the analyses of the sub-sets where firm
size, profitability and industry sub-sector have been controlled for, though not reported here.

20
The full sample, however, was used to explore the degree to which the explanatory power of the
individual CSC elements adds to the influence on firm performance. The change in adjusted R-
squareds was used to identify the changes in explanatory power. Overall the results show that
CSC significantly predicts all firm performance measures at the p < 0.01 level. The results
showed that the increased explanatory power of the CSC model elements beyond the control
variables differed, depending on the firm performance measure. For ROI the increase in adjusted
R-squareds was minimal, though statistically significant for the last two models, which add HC &
IC (adds 0.3% explanatory power) and Z score (adds 0.6% explanatory power), which is
statistical significant at the p < 0.01 level. For Tobins Q, the increase in explanatory power added
by the CSC elements over the control variables is 6.2%, which is statistical significant at the p <
0.01 level. The majority of this increase (6%) is however provided by the addition of the Z score.
For TSR the CSC elements add 13% to the explanatory power over the control variables. The
increase is shared by absorptive capacity adding 1.9%, HC and IC 4.2% and Z scores 7.1%, each
change being statistically significant at the p < 0.01 level.
The above results support the view that a firm’s “financial halo” tends to dominate how a firm’s
reputation is viewed. Brown & Perry (1994) have shown that Fortune magazines “most admired”
companies lists are heavily influenced by prior financial results. They provide methods for
removing the financial halo in order to investigate the non financial elements of a firm’s
reputation. Studies on the Fortune survey results have shown that financial performance explains
anything from 42% (McGuire, Schneeweis, & Branch, 1990) and 53% (Fombrun & Shanley,
1990) of the variance of the overall firm ratings. The dominating influence of financial
performance found here is therefore consistent with the analyses of the Fortune magazine data.

21
However, some new results here are the differential results obtained between the more
accounting focused firm performance measures like ROI and the market based measure of TSR.
The results for TSR are worth noting for the larger relative impact of non-financial elements.
Specifically centrality, absorptive capacity, human capital and internal capital do add significant
explanatory power to the relationship with TSR2 beyond financial soundness. This is significant,
given the growing importance of market performance measures in assessing a firm’s overall
performance.
The other significant interpretation from the above results is the potential interaction effects of
financial soundness with the more intangible performance measures. Brown & Perry (1994) were
more concerned with removing the effect of financial performance to enable unhindered access to
the more qualitative firm attributes. In this research, financial soundness is an integral part of the
CSC formulation. The foundation literature on social capital also acknowledges the impact of
personal wealth on an individual’s social capital status (Lin, 1982). Therefore, rather than looking
to remove the impact of financial performance, these results suggest an exploration of the
interaction effects of financial performance is a potentially beneficial theme for investigation.
Hypothesis Test Results
The synthesised results from the 23 scenario tests, showed support for three of the five
hypotheses (H1, H3 and H5). Hypotheses H2 and H4 were not supported. Significant
2 The full sample results only identified absorptive capacity and human capital for Model 4. Scenarios not reported
here show centrality impacts TSR for profitable firms and internal capital impacts TSR for firms that are small, or
develop software.

22
relationships between absorptive capacity and internal capital were identified with firm
performance, but in a negative, rather than positive direction.
The positive association of centrality only existed for Tobins Q performance. This might suggest
that market centrality, like Tobins Q is seen as a predictive rather than historical performance
measure. Firms who position themselves optimally in the market place would in fact be
positioning themselves for future gains. This is consistent with the literature on CSC which
suggests that investments in social capital are both strategic and long term (Burt, 2003; Burt,
Guilarte, Raider, & Yasuda, 2002).
The support for a positive association for human capital with ROI and TSR (H3), suggests that
investments in human capital are valued by the market in terms of shareholder return, as well
enhancing ROI. This association is well supported in the literature (Coleman, 1988; Florin et al.,
2003; Kaplan & Norton, 2004; O'Donnell & Berkery, 2003; Pennings et al., 1998). The human
capital association was consistent across all sub-samples.
The positive association between financial soundness and firm performance (H5) was the
strongest predictor, predicting all firm performance measures for the majority of sub samples.
Interestingly, the only scenarios where financial soundness was not found to be a significant
predictor was for large, profitable or non software firms, when predicting TSR performance. This
is potentially an interesting result. The image suggests large, mature equipment manufacturers,
that are operating profitably, have perhaps reached a plateau where the market is now looking for
more than financial performance. These same sub-samples also are distinguished for showing the
negative effects of centrality. Both large and profitable firms had negative associations between

23
centrality and firm performance. Non software firms also showed a negative, though not
significant relationship. That is, the larger mature firms could be “locked in” to long term
alliances that are delivering a financial return, but not the growth and innovation that the market
may be looking for. From a social capital perspective this situation lends support to the structural
holes argument (Burt, 1992, 2004), where the advantage from alliance networks is those that
bridge holes in market networks, identifying new ideas and innovations as a source of new
growth. The conjecture is that large, established firms in mature industries would find this style
of alliance formation more difficult to achieve. But for those that can, the rewards are available
through improved market values.
The unsupported hypotheses were the hypothesised positive relationship between absorptive
capacity/R&D (H2) and internal capital (H4) with firm performance. For both hypotheses,
significant relationships were in fact found in the opposite direction. The explanation for the
negative relationship of absorptive capacity/R&D with mostly ROI suggests that the R&D proxy
is being seen simply as an expense. The negative relationship for internal capital was found
against Tobins Q and TSR, but not ROI. This would suggest that it is not the expense of
investments in internal capital that are the issue. On its own the result is difficult to interpret and
therefore is covered in the next section on interaction effects.
Post Hoc Analysis
As a consequence of the unexpected lack of support for H2 and H4 the following post hoc
analysis was conducted. Interaction analysis has been used to investigate social capital effects on
high growth ventures (Florin et al., 2003) and the impact of absorptive capacity on centrality
(Tsai, 2001). Interaction effects were investigated here, either as a result of the unexpected prior
results or results anticipated through the literature.
24
The formal regression tests conducted inclusive of the interaction effects were of the form:
PerfROI;
PerfTobQ;
PerfTSR = b0 + b1SIZE+b2IND+b3P_L+ b4CENT + b5RES + b6HC + b7IC + b8ZSCORE + b9ZSCORExCENT+
b10ZSCORExRES+ b11ZSCORExHC+ b12ZSCORExIC + b13CENTxHC+e
Each of the models achieved a significant F-statistic to the p < 0.01 level, with adjusted R-
squareds highest for ROI prediction (0.846) and lowest for TSR (0.160).
An investigation using interaction plots as described by Aiken & West (1993) was conducted.
The scenarios selected for reporting here are the interaction of financial soundness with
absorptive capacity/R&D and IC variables against a firm performance measure identified in the
main effects regression tests. The selected investigations were:
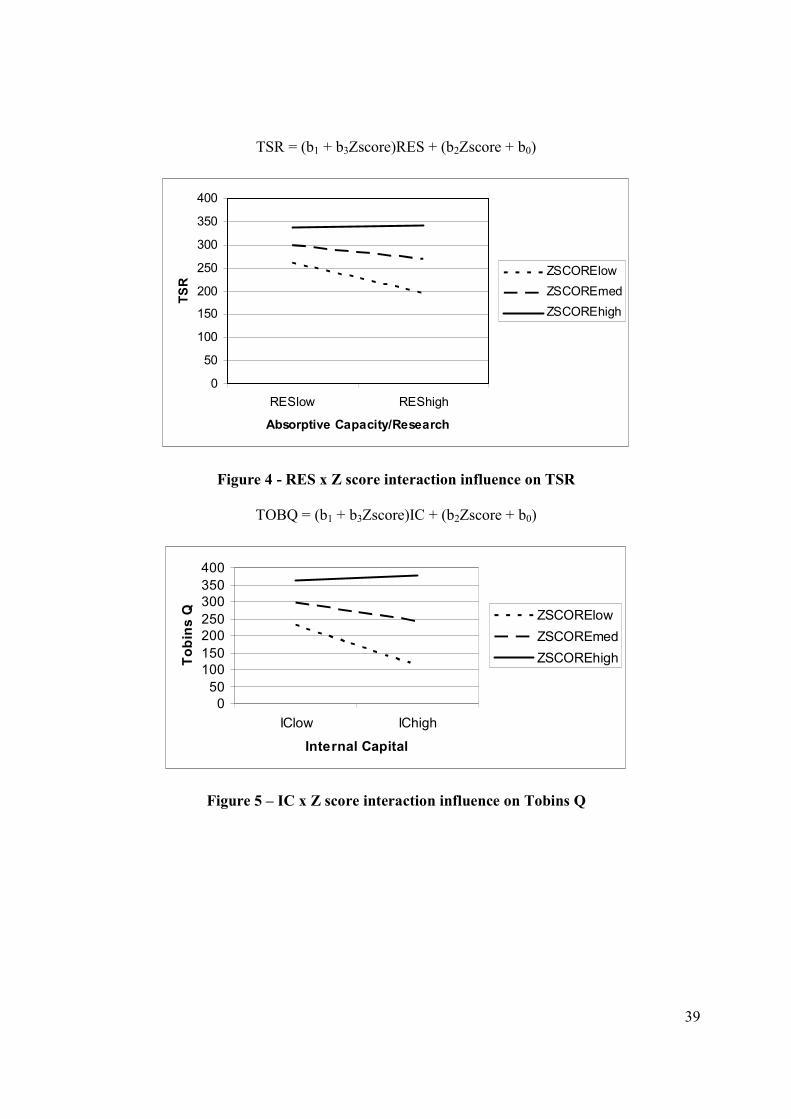
TSR vs Zscore x RES
This plot investigates the negative relationship found between absorptive capacity/R&D and TSR
performance, which was not consistent with H2, which hypothesised a positive relationship
between absorptive capacity/R&D and firm performance. The conjecture was that financial
soundness may have a moderating effect on this relationship.
The interaction plot is shown in the following figure along with the regression equation used.
Each of the variables was centred prior to running the regression.
Insert Figure 4 about here

25
The interaction plot shows a change in slope from negative to positive at higher levels of
financial soundness. This indicates that the negative main effect of RES on TSR was not
sustained for high levels of financial soundness. That is, high levels of financial soundness can
reverse or moderate the strength and/or direction of influence of absorptive capacity/R&D on
TSR. A possible explanation is that the market only appreciates R&D investments from firms
that have the financial resources to afford it. This is consistent with the view that R&D is treated
as an expense with no compensating share value appreciation. For firms that do not have the
financial resources to invest in R&D, the market would penalise those that did invest their limited
resources in R&D.
Tobins Q vs Zscore x IC
This plot investigates the negative relationship found between internal capital and Tobins Q
performance, which was not consistent with H4, which hypothesized a positive relationship
between internal capital and firm performance. The conjecture was that financial soundness may
have a moderating effect on this relationship.
The interaction plot is shown in the following figure along with the regression equation used.
Each of the variables was centered prior to running the regression.
Insert Figure 5 about here
The main effects showed internal capital with a negative association with Tobins Q and TSR, but
the interaction term of Zscore x IC was positive. The above plot showed the relationship changes
from negative to positive at higher levels of financial soundness. In other words, the negative
relationship does not hold if the firm has strong financial soundness. This result mimics the result
for the absorptive capacity/R&D and financial soundness interaction effect on TSR. The rationale

26
could be that investments in internal capital, like R&D, are not rewarded if the firms do not have
the financial capacity to support it. Where firms do have the financial capacity to afford an
investment in internal capital, then it is rewarded in the marketplace.
In summary, the post hoc interaction effects analyses were able to provide viable explanations for
the unexpected results obtained for two of the five hypothesis tests. For both absorptive
capacity/R&D and internal capital relationships with firm performance, the interactions effect
analysis was able to show that financial soundness has the potential to moderate the negative
effects of absorptive capacity/R&D and internal capital on firm performance. The inference from
the results suggest that R&D and internal capital investments are only of value to those that
already have the financial resources to afford them. Firms investing in R&D or internal capital
without the financial means to do so, would be penalised by the market.
5. Discussion and Conclusions
This research set out to find empirical evidence for a linkage between CSC and firm
performance. The comprehensive analysis conducted explored formulations of CSC at five levels
of granularity and tested these against a suite of firm performance measures that were both
accounting and market based. The results of the regression tests were conclusive in supporting
the view that CSC is strongly linked to firm performance.
While the overall proposition is supported, the value from this research in terms of the underlying
theories it supports or otherwise, can be found at the more granular levels of analyses. The
relationship between some of the components of CSC and how they impact on different firm

27
performance measures, provide more granular explanations as to what particular management
levers can have the most effect.
Financial soundness was found to be the most critical CSC component when predicting future
firm performance. The only exception is for large, profitable or non software firms when
predicting TSR performance. For these firms factors other than financial soundness can dictate
their TSR performance. The impacts of CSC elements on firm performance are now presented.
A firm’s market centrality should be considered a strategic investment. The relationship between
market centrality and performance will differ depending on the circumstances of the firm. For
those firms in the software sector, building alliances which improve on the firm’s market
centrality will have positive effects on the firm’s TSR. However, large or profitable firms may
not necessarily see the same returns for developing a more central position in the market. This is
particularly so for firms not in the software sector. For these firms, the inference is that many
could be over-allianced and therefore limited in their ability to innovate for new growth.
Additional alliances would act as “handcuffs” limiting independent action, which the market
would interpret negatively.
A firm’s investment in human capital will be universally beneficial for both accounting based
measures (ROI) and market based measures (TSR). For firms in a poor financial position,
investments in human capital are more critical than for firms in a better financial position. In fact
for firms in a loss making situation, investments in human capital are perhaps the only viable
investment to move out of this situation.

28
Related to the above, investments in R&D and internal capital are inherently costs to the business
and therefore negatively impact on firm performances. Investments in R&D will have shorter
term negative impacts on ROI, whereas internal capital investments will negatively impact the
more market focused Tobins Q and TSR performance. These negative effects however can be
moderated by financial soundness. For those firms in a financial position to afford investments in
R&D and internal capital, the firms’ performance can be positively impacted. In contrast, firms in
poorer financial positions who invest in R&D and/or internal capital that they potentially cannot
afford, will be penalised by the market.
The critical importance of the financial soundness element of CSC is mimicked by research on
corporate reputation. Several researchers identified the issue of a firm’s financial performance
heavily influencing how a firm’s reputation is assessed (Brown & Perry, 1994; Fombrun &
Shanley, 1990; McGuire et al., 1990). The empirical results from this research however, were
able to determine what firm attributes might lead to a situation where financial soundness does
not guarantee good market performance.
The empirical findings around the different effects of market centrality on firm performance find
support from both the centrality as a benefit theories (Coleman, 1990; Lin, 1982) and centrality
as a liability theories (Cohen & Prusak, 2001; Florida, Cushing, & Gates, 2002; Knoke, 1999;
Leenders & Gabbay, 1999; Locke, 1999). Other studies have found that the impact of centrality is
related to other attributes of the firm. Rowley, Behrens, & Krackhardt (2000) found closed
networks were beneficial for the mature, lower growth steel industry, whereas open networks
were more beneficial to the higher growth semiconductor industry. This research also finds a
similar industry effect between the software and non-software industry sectors.

29
The positive impact of investments in human capital finds substantial support in the literature
(Hitt, Bierman, Shimizu, & Kochhar, 2001; Johnson, Neave, & Pazderka, 2002) and the
interaction between social capital and human capital (Coleman, 1988; Florin et al., 2003). The
interaction effects between social capital and financial capital had also been studied by Florin,
Lubatkin et al.(2003). Interaction effects between centrality and absorptive capacity has been
studied by Tsai, (2001). The moderating effects of financial soundness on other CSC elements
like internal capital and absorptive capacity/R&D are potentially new findings from this research.
The methodological approach in the study of these interaction effects is now well established
(Aiken & West, 1991).
Limitations and Suggestions for Future Research
The use of advanced content analysis techniques has been instrumental in enabling the study of
CSC and firm performance across a relatively large sample of firms. This facility has led to
findings of interest to both the social sciences and intellectual capital research communities.
However, new techniques come with limitations along with the benefits they provide.
One limitation with content analysis techniques is the validity and authenticity of the content
being analysed. Business reporters were used for reporting on CSC attributes of the firms. The
quality and accuracy of the reporting of individual articles could be questionable. Firms with a
strong media following are less likely to be impacted by a wayward reporter, as the weight of
accurate reports will mask inaccurate reports. However, firms with a low level of media coverage
could be susceptible to a single inaccurate report.

30
In terms of future research directions several opportunities exist. The results of this research
could be reinforced or otherwise by increasing the sampling over a longer period, while
controlling for the increase in media intensity over time. Individual case studies could also be
used, where firms could be individually surveyed for CSC elements to complement the media
derived information. For the IT sector the results have shown that firm size, whether they are
profit making or loss making and whether they mainly develop software or services versus
equipment or hardware has an impact on how CSC influences firm performance. Research on the
life cycle of firms, from start up to establishment and decline could significantly contribute to an
understanding of how CSC evolves with the life cycle of a firm and its interdependency with firm
performance measures.
In summary, this research has linked an integrated model of CSC to tangible firm performance
measures. It has drawn from the disparate research fields of social science, intellectual /
intangible capital and marketing. The results both reinforce social capital theories, not previously
tested empirically at the organisational level, and provides new results prompting further
investigation. As the viability of advanced content analysis technologies continues to mature, the
world of research into CSC at the organisational level will open up, providing new insights into
management practice in an increasingly connected market place.

31
References
Aiken, L., & West, S. (1991). Multiple regression: Testing and interpreting interactions:Sage
Publications.
Arvidsson, S. (2004, 2-3rd September). The extent of disclosure on intangibles in analyst reports
covering knowledge-intensive companies. Paper presented at the IC Congress on
"Interpretation and Communication of Intellectual Capital, Helsinki, Finland.
Baker, W. (1990). Market networks and coproate behaviour. American Journal of Sociology,
96(3), pp. 589-625.
Baum, J., Calabrese, T., & Silverman, B. (2000). Don't go it alone: Alliance network compostion
and startups' performance in canadian biotechnology. Strategic Management Journal,
21(3), pp. 267-294.
Bonacich, P. (1987). Power and centrality: A family of measures. The American Journal of
Sociology, 92(5), pp.1170-1182.
Bond, S., & Cummins, J. (2003). The stock market and investment in the new economy: Some
tangible facts and intangible fictions. In J. Hand & B. Lev (Eds.), Intangible assets:
Values, measures, and risks.Oxford: Oxford University Press.
Borgatti, S. P., Everett, M. G., & Freeman, L. C. (2002). Ucinet for windows: Software for social
network analysis:Harvard, MA: Analytic Technologies.
Brown, B., & Perry, S. (1994). Removing the financial performance halo from fortunes "most
admired" companies. Academy of Management Journal, 37(5), pp.1347-1359.
Burt, R. (2003). The social structure of competition. In Rob Cross, A. Parker & L. Sasson (Eds.),
Network in the knowledge economy (pp. pp.13-56). New York: Oxford University Press.
Burt, R., Guilarte, M., Raider, H., & Yasuda, Y. (2002). Competition, contingency, and external
structure of markets. Advances in Strategic Management, 19, pp.167-217.
Burt, R. S. (1992). Structural holes:Cambridge: Harvard University Press.
Burt, R. S. (2004). Structural holes and good ideas. American Journal Of Sociology, 110(2), 349-
399.
Chan, S. H., Kensinger, J., W., Keown, A. J., & Martin, J. D. (1997). Do strategic alliances create
value? Journal of Financial Economics, 46, pp.199-221.
Chauvin, K., & Hirschey, M. (1993). Advertising, r&d expenditures and market value of the firm.
Financial Management, 22, pp.128-140.
Chung, K., & Pruitt, S. (1994). A simple approximation of tobin's q. Financial Management,
23(3 Autumn), pp.70-74.
Cohen, D., & Prusak, L. (2001). In good company: How social capital makes organizations
work.Boston: Harvard Business School Press.
Cohen, W., & Levinthal, D. (1990). Absorptive capacity: A new perspective on learning and
innovation. Administrative Science Quarterly, 35, pp. 128-152.
Coleman, J. (1988). Social capital in the creation of human capital. The American Journal of
Sociology, 94 Supplement, S95-S120.
Coleman, J. (1990). Foundations of social theory:Boston, MA: Harvard Business.
Collins, D., Pincus, M., & Xie, H. (1999). Equity valuation and negative earnings: The role of
book value of equity. The Accounting Review, 74(1), pp.29-61.
Das, S., Sen, P., & Sengupta, S. (1998). Impact of strategic alliances on firm valuation. Academy
of Management Journal, 41(1), pp.27-41.
32
De Gieij, P., & Marquering, W. (2004). Modelling the conditional covariance between stock and
bond returns: A multivariate garch approach. Journal of Financial Econometrics, 2(4),
pp:531-564.
Dean, W., & Faff, W. (2004). Asymmetric covariance, volatility, and the effect of news. The
Journal of Financial Research, 27(3), pp.393-413.
Dollinger, M., Golden, P., & Saxton, T. (1997). The effect of reputation on the decision to joint
venture. Strategic Management Journal, 18(2), pp.127-140.
Dyer, J., & Nobeoka, K. (2000). Creating and managing a high performance knowledge-sharing
network: The toyota case. Strategic Management Journal, 21, pp.345-367.
Eidleman, G. (1995). Z-scores - a guide to failure prediction, The CPA Journal Online
http://www.nysscpa.org/cpajournal/old/16641866.htm (accessed 8/11/05).
Florida, R., Cushing, R., & Gates, G. (2002). When social capital stifles innovation. Harvard
Business Review.
Florin, J., Lubatkin, M., & Schulze, W. (2003). A social capital model of high-growth ventures.
Academy of Management Journal, 46(3), pp.374-384.
Fombrun, C., & Shanley, M. (1990). What's in a name? Reputation building and corporate
strategy. Academy of Management Journal, 33(2), pp.233-256.
Frank, O. (1979). Estimation of population totals by use of snowball samples. In P. Holland & S.
Leinhardt (Eds.), Perspectives on social network research (pp. pp.319-347). New York:
Academic Press.
Granovetter, M. (1976). Network sampling: Some first steps. The American Journal of Sociology,
81(6), pp.1287-1303.
Greene, W. (2000). Econometric analysis.Upper Saddle River, NJ: Prentice-Hall.
Gulati, R. (1995). Social structure and alliance formation patterns: A longditudinal analysis.
Administrative Science Quarterly, 40, pp.619-652.
Gulati, R., & Gargiulo, M. (1999). Where do interorganizational networks come from? American
Journal of Sociology, 104(5), pp.1439-1493.
Gulati, R., Nohria, N., & Zaheer, A. (2000). Strategic networks. Strategic Management Journal,
21, pp.203-215.
Guthrie, J., & Petty, R. (2000). Intellectual capital: Australian annual reporting practices. Journal
of Intellectual Capital, 1(3), pp.241.
Hagedoorn, J., & Schakenraad, J. (1992). Leading coompanies and networks of strategic alliances
in information technologies. Research Policy, 21, pp.163-190.
Hall, R. (1992). The strategic analysis of intangible resources. Strategic Managemnt Journal, 13,
pp.135-144.
Hand, J., & Lev, B. (2003). Intangible assets: Values, measures and risks.Oxford: Oxford
University Press.
Hitt, M. A., Bierman, L., Shimizu, K., & Kochhar, R. (2001). Direct and moderating effects of
human capital on strategy and performance in professional service firms: A resource-
based perspective. Academy of Management Journal, 44(1), 13-28.
Iman, R., & Conover, W. J. (1979). The use of the rank transformation in regression.
Technometrics, 21(4), pp.499-509.
Johnson, L., Neave, E., & Pazderka, B. (2002). Knowledge, innovation and share value.
International Journal of Managment Reviews, 4(2), pp.101-134.
Kaplan, R., & Norton, D. (2004). Measuring the strategic readiness of intangible assets. Harvard
Business Review, 82(2), pp.53-63.

33
Knoke, D. (1999). Organizational networks and corporate social capital. In R. Leenders & S.
Gabbay (Eds.), Corporate social capital and liability (pp. pp. 17-42): Boston: Kluwer.
Knoke, D., Yang, S., & Granados, F. (2002, July 4-6). Dynamics of strategic alliance networks in
the global information sector, 1989-2000. Paper presented at the The Dynamics of
Networks: 18th EGOS Colloquium, Barcelona, Spain.
Koka, B., & Prescott, J. E. (2002). Strategic alliances as social capital: A multidimensional view.
Strategic Management Journal, 23(9), pp.795-816.
Leenders, R., & Gabbay, S. (Eds.). (1999). Corporate social capital and liability.Boston: Kluwer
Academic Publishers.
Lev, B. (2001). Intangibles: Managment, measurement, and reporting.Washington, D.C.:
Brookings Institution Press.
Lev, B., & Sougiannis, T. (1999). Penetrating the book-to-market black box: The r&d effect.
Journal of Business and Finance Accounting, 26, pp.419-449.
Lin, N. (1982). Social resources and instrumental action. In P. Marsden & N. Lin (Eds.), Social
structure and network analysis (pp. pp.131-145). Beverly Hills, CA: Sage.
Locke, E. A. (1999). Some reservations about social capital. Academy of Management Review,
24(1), pp.8-9.
Marr, B., & Chatzkel, J. (2004). Intellectual capital at the crosroads: Managing, measuring, and
reporting ic. Journal of Intellectual Capital, 5(2), pp.224-229.
Martin-de-Castro, G., Navas-Lopez, J. E., Lopez-Saez, P., & Alama-Salazar, E. (2006).
Organizational capital as competitive advantage of the firm. Journal of Intellectual
Capital, 7(3), pp. 324-337.
McCutcheon, D., & Stuart, F. I. (2000). Issues in the choice of supplier alliance partenrs. Journal
of Operations Managment, 18, pp.270-301.
McElroy, M. (2002). Social innovation capital. Journal of Intellectual Capital, 3(1), pp.30 - 39.
McGuire, J., Schneeweis, T., & Branch, B. (1990). Perceptions of firm quality: A cause or result
of firm performance. Journal of Management, 16(1), pp.167-180.
Nahapiet, J., & Ghoshal, S. (1998). Social capital, intellectual capital, and the organizational
advantage. Academy of Management Review, 23(2), pp.242-266.
Neuendorf, K. (2001). The content analysis guidebook:Sage Publications.
O'Donnell, D., & Berkery, G. (2003). Human interaction: The critical source of intangible value.
Journal of Intellectual Capital, 4(1), pp.82-99.
Pennings, J., Lee, K., & VanWitteloostuijn, A. (1998). Human capital, social capital, and firm
dissolution. Academy of Management Journal, 41(4), pp.425-440.
Podolny, J. (1993). A status-based model of market competition. American Jounal of Sociology,
98(4), pp.829-872.
Podolny, J., Stuart, T., & Hannan, M. (1996). Networks, knowledge, and niches: Competitoion in
the worldwide semiconductor industry, 1984-1991. American Journal of Sociology,
102(3), pp.659-689.
Pomeda, J., Moreno, C., Rivera, C., & Martil, L. (2002, 25-26th Novermber, 2002). Towards an
intellectual capital report of madrid: New insights and developments. Paper presented at
the The Transparent Enterprise. The Value of Intangibles, Madrid, Spain.
Portes, A. (1998). Social capital: Its origins and aplications in modern sociology. Annual Review
of Sociology, 24, pp.1-24.
Roos, G., & Roos, J. (1997). Measuring your company's intellectual performance. Long Range
Planning, 30(3), pp.413-426.

34
Rothenberg, R. B. (1995). Commentary: Sampling in social networks. Connections, 18(1),
pp.104-110.
Rowley, T., Behrens, D., & Krackhardt, D. (2000). Redundant governance structures: An
analysis of structural and relational embeddedness in the steel and semiconductor
industries. Strategic Management Journal, 21(3), 369-386.
Stewart, T. A. (1997). Intellectual capital: The new wealth of organizations.New York:
Doubleday.
Stuart, T. (2000). Interorganizational alliances and the perfpormance of firms: A study of growth
and innovation rates in a high technology industry. Strategic Management Journal, 21,
pp.791-811.
Sveiby, K. E. (1997). The new organizational wealth: Managing & measuring knowledge-based
assets:Berret-Koehler Publishers, Inc.
Tabachnick, B., & Fidell, L. S. (2001). Using multivariate statistics (4th ed.). Boston: Allyn and
Bacon.
Tsai, W. (2001). Knowledge transfer in intraorganizational networks: Effects of network position
and absorptive capacity on business unit innovation and performance. Academy of
Management Journal, 44(5), pp.996-1004.
Uzzi, B. (1997). Social structure and competition in interfirm networks: The paradox of
embeddedness. Administrative Science Quarterly, 42, pp.35-67.
White, H. (1980). A heteroscedacity-consistent covariance matrix estimator and a direct test for
heteroscedacity. Econometrica, 48, pp. 817-838.

35
Figure 1 – An integrated model for corporate social capital
Corporate Social
Capital
Corporate Social
CapitalCorporate
Reputation
Corporate
Reputation
Structural
Social Capital
Structural
Social Capital
Network
CentralityAbsorptive
capacity
Financial
Soundness
ROIROI Tobin’s QTobin’s Q
TSRTSR
Intellectual
Capital
External
Capital
Internal
Capital
Human
CapitalFirm PerformanceFirm Performance
H1: Centrality is positively associated with Firm Performance
H2: Absorptive capacity is positively
associated with Firm Performance
H5: Financial soundness is positively associated
with Firm Performance
H4: Internal Capital is
positively associated
with Firm Performance
H3: Human Capital
is positively
associated with
Firm Performance
Figure 2 – Path Model and Hypotheses
Corporate Social Capital
Financial Soundness
Human Capital
Internal Capital
Network Centrality
Absorptive Capacity
Structural Social Capital
Intellectual Capital
Corporate Reputation
Qualitative Social Capital

36
Table 1 – Search term mappings
IC Classification Equivalence (Guthrie
and Petty, 2000)
Factiva Intelligent Taxonomy Terms
Human capital: Employee, Education, Training, Work-
related knowledge, Entrepreneurial spirit
Employee Training/Development
Workers Pay
Labor Disputes
Lay-offs
Recruitment
Directors Dealings
Executive Pay
Management Moves
Internal Capital: Intellectual property, Management
philosophy, corporate culture,
management processes,
information/networking systems,
financial relations
Intellectual Property
Best Practice
Competitive Intelligence
Corporate Governance/Investor
Relations
Corporate Process Redesign
Knowledge Management
Supply chain
Information Technology
Debt/Bond Markets
Figure 3 – Stepwise Regression Model
Corporate Social Capital
Alliance Networks
Absorptive Capacity
Intellectual / Intangible Capital
Corporate Reputation
ROI TOBQ TSR
CENT
RES
HC, IC
Z-Score
=
+
+
+
Independent Variables
Dependent Variables
Model 1 (H1)
Model 2 (H2)
Model 3 (H3,H4)
Model 4 (H5)
37
Table 2 – Variable labels and descriptors
Variable Labels Description
Independent
Variables
CENT Market centrality measured as Eigenvector centrality
RES R&D Intensity = R&D/Net Sales. A proxy for absorptive capacity
HC Human Capital Index
IC Internal Capital Index
ZSCORE Altman’s Z-Score. Proxy for financial soundness
Dependent
Variables
ROI Return on Investment (%)
TobinsQ Tobins Q (ratio). Proxy for market to book ratio
TSR Total shareholder return (%). Share price appreciation plus
dividends
Control
Variables
NetSales Sales net of credits. Proxy for firm size.
IND Industry Sector Dummy: 1 = Software and Services, 0 = other IT
sectors
P_L Profitability Dummy: 1 = mean earnings per share >= 0, 0 = mean
earnings per share <0
38
Table 3 – Full sample – Unstandardized Coefficients
Model 1
Model 2
Model 3
Model 4
Model 1
Model 2
Model 3
Model 4
Model 1
Model 2
Model 3
Model 4
Perf ROI
Perf ROI
Perf ROI
Perf ROI
Perf TobinsQ
Perf TobinsQ
Perf TobinsQ
Perf TobinsQ
Perf TSR
Perf TSR
Perf TSR
Perf TSR
Contr
ols
IND
4
1.7
29
*
(.0
02)
41.1
55
*
(.0
02)
42.8
94
*
(.0
01)
25
.191
*
(.0
18)
50.4
01
*
(.0
45)
50
.212
*
(.0
47)
54
.022
*
(.0
30)
18
.807
(.3
98)
-19
.39
7
(.3
02)
-23
.26
2
(.2
22)
-18
.54
8
(.3
27)
-29
.28
4
(.1
33)
SIZ
E
0.2
11
**
(.0
00)
0.1
93
**
(.0
00)
0.2
12
**
(.0
00)
0.1
58
**
(.0
00)
-0.2
91
*
(.0
01)
-0.2
91
*
(.0
01)
-0.2
28
*
(.0
09)
-0.3
39
**
(.0
00)
-0.1
25
+
(.0
85)
-0.1
61
*
(.0
33)
-0.1
07
(.1
80)
-0.1
63
+
(.0
51)
P_
L
24
2.8
36
**
(.0
00)
24
2.0
15
**
(.0
00)
23
6.3
40
**
21
5.3
68
**
(.0
00)
78
.912
**
(.0
00)
79
.048
**
(.0
00)
78.3
77
**
(.0
00)
41
.609
**
(.0
00)
14
7.0
19
**
(.0
00)
14
6.8
88
**
(.0
00)
13
1.8
21
**
(.0
00)
107
.85
2*
*
(.0
00)
Main
Effec
ts
CE
NT
0
.03
7
(.3
66)
0.0
52
(.2
10)
0.0
44
(.3
27)
-0.0
05
(.8
86)
0.1
95
*
(.0
11)
0.1
97
*
(.0
12)
0.2
39
*
(.0
03)
0.1
68
*
(.0
21)
-0.0
11
(.8
52)
0.1
80
(.7
72)
0.0
01
(.9
87)
-0.0
43
(.5
28)
RE
S
-0
.03
0
(.2
33)
-0.0
26
(.3
29)
-0.0
46
+
(.0
55)
0
.00
2
(.9
63)
0.0
31
(.4
21)
0.0
15
(.6
66)
-0
.06
9
(.1
01)
-0.0
60
(.1
70)
-0.0
90
*
(.0
38)
HC
0.0
69
*
(.0
04)
0.0
44
*
(.0
50)
0.0
44
(.2
11)
0.0
11
(.7
28)
0.2
10
**
(.0
00)
0.2
07
**
(.0
00)
IC
-0.0
46
(.2
22)
0.0
09
(.8
04)
-0.1
51
*
(.0
12)
-0.1
00
+
(.0
70)
-0.1
54
*
(.0
17)
-0.1
03
(.1
21)
Z-S
core
0.2
75
**
(.0
00)
0
.49
4**
(.0
00)
0.2
29
**
(.0
00)
F-
Sta
tist
ic
20
.07
**
(.0
00)
19
.83
**
(.0
00)
19
.97
**
(.0
00)
20
.52
**
(.0
00)
7.4
7*
*
(.0
00)
7.5
9*
*
(.0
00)
7.5
6**
(.0
00)
9.6
0**
(.0
00)
1.0
2
(.4
28)
1.0
9
(.2
51)
1.2
6*
(.0
41)
1.5
8*
*
(.0
00)
Ad
j R
2
0.8
37
0
.83
6
0.8
39
0
.84
5
0.6
36
0
.64
2
0.6
44
0
.70
6**
0.0
06
0
.02
5
0.0
67
0
.13
8
∆ A
dj
R2
0.0
00
-0
.00
1
0.0
03
a
0.0
06
a
-0.0
01
0
.00
6 a
0.0
02
0
.06
2a
-0.0
02
0
.01
9 a
0.0
42
a
0.0
71
a
N
55
0
54
3
54
3
52
7
55
3
54
6
54
6
532
54
7
54
0
54
0
52
5
**
p-v
alu
e si
gn
ific
ant
< 0
.01
(tw
o-t
aile
d);
* p
-val
ue
signif
ican
t <
0.0
5 (
two
-tai
led
);
+ p
-val
ue
sign
ific
ant
<0
.10
(tw
o-t
aile
d);
a A
dju
sted
R-s
qu
ared
ch
ange
is s
ignif
ican
t at
p-v
alu
e si
gn
ific
ant
< 0
.01
.
39
TSR = (b1 + b3Zscore)RES + (b2Zscore + b0)
0
50
100
150
200
250
300
350
400
RESlow REShigh
Absorptive Capacity/Research
TSR
ZSCORElow
ZSCOREmed
ZSCOREhigh
Figure 4 - RES x Z score interaction influence on TSR
TOBQ = (b1 + b3Zscore)IC + (b2Zscore + b0)
0
50
100
150
200
250
300
350
400
IClow IChigh
Internal Capital
Tobins Q ZSCORElow
ZSCOREmed
ZSCOREhigh
Figure 5 – IC x Z score interaction influence on Tobins Q