corporate presentation november, 2010. index 1.introduction 2.rice business 3.pasta business...
TRANSCRIPT

Corporate PresentationNovember, 2010
INDEX
1. Introduction
2. Rice Business
3. Pasta Business
4. Conclusion
5. Annex I. Main Figures
6. Annex II. Product Samples
1INTRODUCTION

Who is Ebro?
Ebro is an international brand-based food group with a market capitalization of €2.26 billion, turnover of €1.75 billion and net profit of €176.4 m at the end of 2009.
Over the last ten years we have made several changes, transforming our company from a sugar company in 2000 (with a financial participation in Herba since 1989) to our present structure:
In 2000, we merged with Puleva (branded dairy leader in Spain).In 2001, we fully incorporated Herba (European rice leader).Between 2001 and 2004 we bought up 7 small and medium-sized leading branded rice companies in Europe.In 2004, we acquired Riviana (branded rice leader in USA). In 2005, we acquired Panzani (branded rice and pasta leader in France).In 2006, we acquired New World Pasta and Minute Rice (leading branded pasta and rice companies in USA and Canada).In 2007, we acquired Birkel (leading branded pasta company in Germany).In 2009, we divested our Sugar Division.In 2010, we divested Puleva.
In this period we have invested €1.7 billion, made divestments of €1.87 billon, with no capital increase and maintaining a healthy pay out for our shareholders. Nowadays, after the sale of Puleva, we are debt free.

Ebro Nowadays
We are world leaders in the branded rice sector and the second branded pasta manufacturer worldwide.
Ebro subsidiaries are distributed over 23 countries in Europe, America, Asia, Northern Africa and we have a portfolio of over 60 brands.
Our stock is quoted in the Madrid Stock Exchange Market (Ibex 35 company). The Hernandez family is the reference shareholder since 2003. All together, with other members of the Board (essentially other Spanish families), control 44.6% of the equity. The rest is freely floated in the market.
Being our products strongly related with raw materials our relationship with rice and durum wheat farmers has always been very strong and we consider this as a very valuable asset.
Our balance sheet is very strong. Nowadays we are debt free and we have a strong cash flow generation. We have the clear ambition of reinforcing our international leadership in our core businesses.

Breakdown of Ebitda
EBITDA by Geographical Zone 1H10North
America51%
Rest of Europe
41%
Iberia7%
Rest of World1%
EBITDA by Divisions 1H10
Pasta59%
Rice41%
Spain
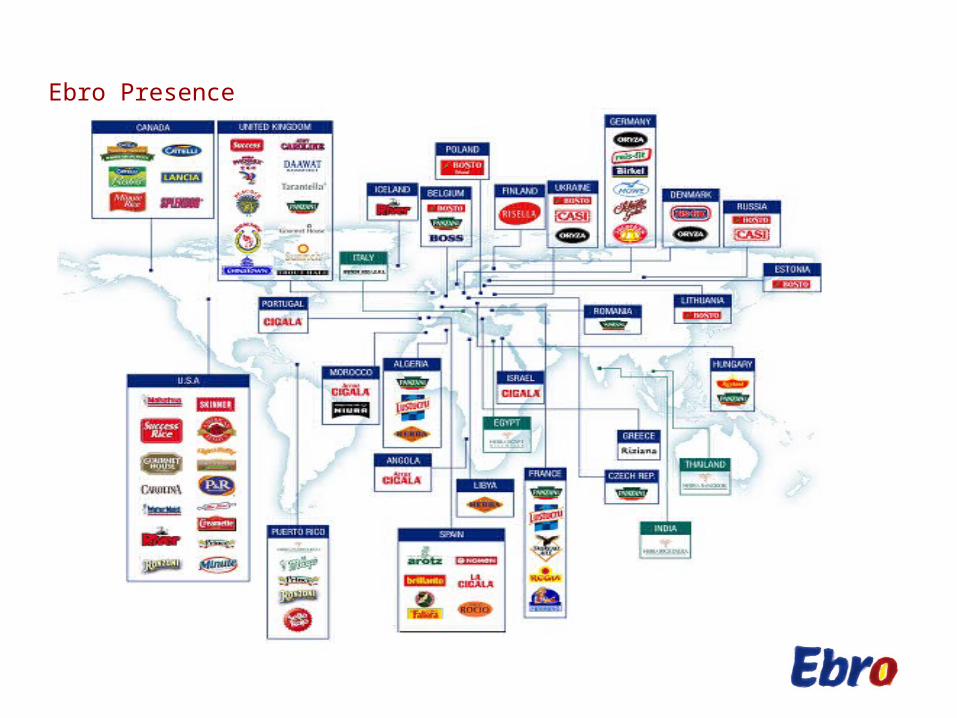
Ebro Presence
2RICE BUSINESS
The Rice Business
The history of our Rice Division tracks back to a business started by the Hernandez Family in Spain in 1950.
After its full integration in Ebro Foods in 2001, we have taken over 10 rice businesses throughout the world: Denmark, Hungary, Finland, Germany, UK, USA, Canada, Egypt, Thailand and India most of them branded companies but as well sourcing capacity (silos and mills).
Two key milestones for us were the acquisition on Riviana Foods in 2004 (374 MUSD) and Minute Rice in 2006 (280 MUSD). That development allowed us to become US leader in rice. That added to our pasta activity created a 1,0 BUSD sales group in US and Canada.
Nowadays we are the largest rice processor in the world with leading brands in most countries in Europe, USA and Canada.
We have a strong expertise in raw materials. One of our strengths is having a strong foothold in the largest rice production regions in the world, with a strong infrastructure and a flexible balance sheet.
We are using our brands to open up new sectors, including convenience foods, pasta, purées, porridges and new products.
Management raw materials, production and packaging, technologies and brands are vital for our project.
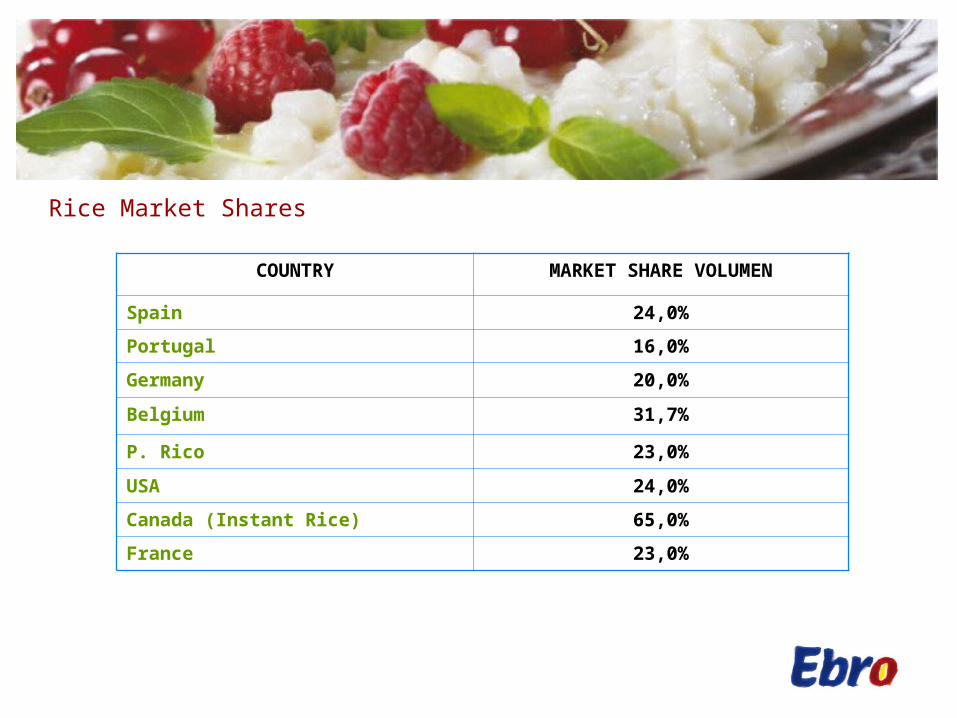
Rice Market Shares
COUNTRY MARKET SHARE VOLUMEN
Spain 24,0%
Portugal 16,0%
Germany 20,0%
Belgium 31,7%
P. Rico 23,0%
USA 24,0%
Canada (Instant Rice) 65,0%
France 23,0%

Rice Brands

Rice Raw Material Purchases
In Europe:
We purchase 500.000 tm/annum of rice. All purchases are made to farmers and cooperatives.
In North America:
We purchase 200.000 tm/annum of paddy rice.
We purchase 200.000 tm/annum of milled rice.
The bulk of our purchasing is from Arkansas and Memphis therefore our facilities are located in that regions.
We procure paddy rice directly from growers as well as from drying and storage operations throughout Arkansas.
We purchase milled rice from a preferred group of vendors that meet our quality requirements.
Other sources:
We purchase on paddy basis other 500.000 Mt/annum from origins as Uruguay, Guyana, Thailand, Egypt and fragrant rice from India, Pakistan and Thailand.

Rice Factories Spain
Our factories in Spain have a:
Milling capacity of: 500.000 mt/annum. Parboiling capacity: 210.000 mt/annum. Storage capacity: 182.000 mt.
The facilities are located in:
San Juan – Seville: Rice Mill, Parboiled Rice, Quick Rice, Ready Made Dishes and Packing.Isla Mayor - Seville: Rice Mill.Coria - Seville: Rice Mill.Jerez: Microwave and Packing facilities.Silla - Valencia: Rice Mill and Packing Facilities. L´Aldea - Tarragona: Rice Mill and Flour Mill.Tortosa - Tarragona: Packing facilities.

L´Aldea Tarragona
Coria - Sevilla
Tortosa - Tarragona
Isla Mayor-Sevilla
Silla - Valencia
San Juan - Sevilla
Jerez - Jerez
Rice Factories Spain
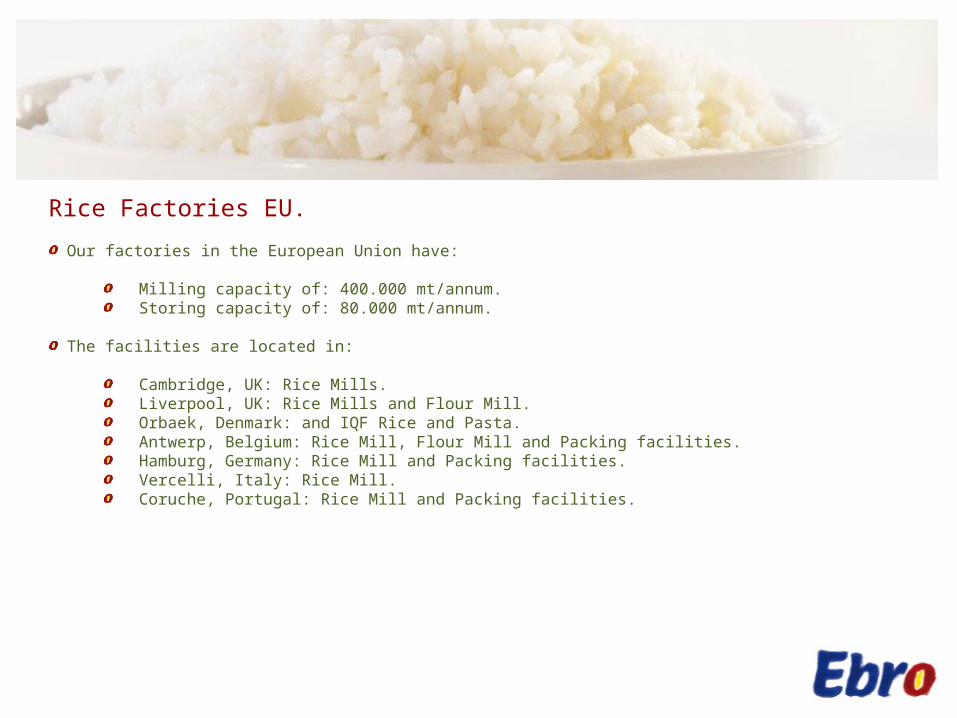
Rice Factories EU.
Our factories in the European Union have:
Milling capacity of: 400.000 mt/annum.Storing capacity of: 80.000 mt/annum.
The facilities are located in:
Cambridge, UK: Rice Mills.Liverpool, UK: Rice Mills and Flour Mill.Orbaek, Denmark: and IQF Rice and Pasta.Antwerp, Belgium: Rice Mill, Flour Mill and Packing facilities.Hamburg, Germany: Rice Mill and Packing facilities.Vercelli, Italy: Rice Mill.Coruche, Portugal: Rice Mill and Packing facilities.
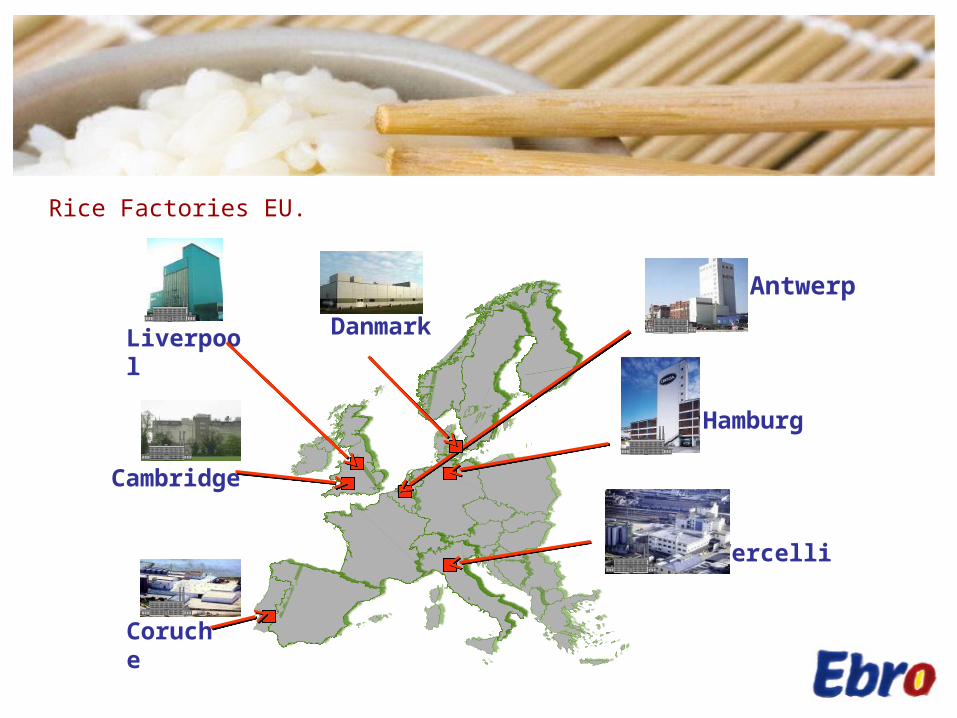
Hamburg
Liverpool
Antwerp
Vercelli
Coruche
Cambridge
Danmark
Rice Factories EU.
Rice Factories USA.
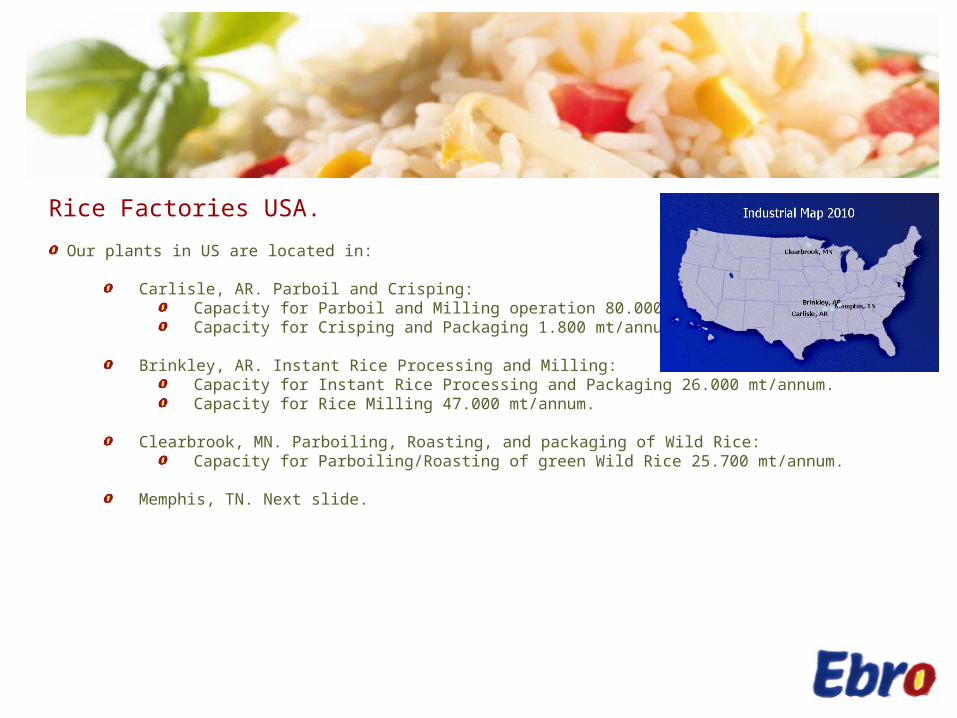
Our plants in US are located in:
Carlisle, AR. Parboil and Crisping:Capacity for Parboil and Milling operation 80.000 mt/annum.Capacity for Crisping and Packaging 1.800 mt/annum.
Brinkley, AR. Instant Rice Processing and Milling:Capacity for Instant Rice Processing and Packaging 26.000 mt/annum.Capacity for Rice Milling 47.000 mt/annum.
Clearbrook, MN. Parboiling, Roasting, and packaging of Wild Rice:Capacity for Parboiling/Roasting of green Wild Rice 25.700 mt/annum.
Memphis, TN. Next slide.

Rice Factories USA. Memphis Rice Factory
Construction on the estimated 110 MAUD Ebro’s., rice processing and packaging plant in Memphis will be finished by 1Q11 but is already starting to work.
It will add a 400,000-square-foot state-of-the-art plant that will include an on-site warehousing and distribution center.
The new facility will be located on 31 acres lands property of the Group.
It will have instant rice processing and packaging of instant and milled rice:Capacity for instant rice processing and packaging 91.500 mt/annum. 8 processing lines and 9 packaging lines.Milled Rice packaging capacity 152.500 mt/annum. 11 packaging lines.

Other Rice Affiliates
We are also placed in:
Egypt: Herba EgyptMilling capacity of: 100.000 mt/annum. Storage capacity: 20.000 mt
Morocco: MundirizMilling capacity of: 60.000 mt/annum. Parboiling capacity: 18.000 mt/annum.Storage capacity: 25.000 mt
Thailand: Herba BangkokProcessing and packing capacity of: 100.000 mt/annum. Storage capacity: 20.000 mt
Uruguay: Joint Venture with Casarone20.000 ha of rice rotating with wheat. Production 40.000 mt/annum of paddy rice.180.000 mt/annum of rice milled and parboiled.

Other Rice Affiliates
Herba Bangkok Herba Bangkok
Uruguay Uruguay
3PASTA BUSINESS

The Pasta Business
Our first step in the Pasta business was the acquisition of Panzani in 2005 (€639 m).
Panzani was the leading dry pasta, fresh pasta, rice and sauces branded leader in France. It brought to our group an expertise in pasta marketing and R+I+D, along with a specialized management team that allowed us to transfer all these knowledge to other countries.
Panzani was the perfect platform to develop a pasta business, offering know-how and product innovation, allowing those new products to be introduced on markets on which we were already present.
In 2006 we bought New World Pasta (“NWP”), the pasta branded leader in USA and Canada, it was a company that was getting out of Chapter 11, clearly underinvested in R+D and A&P. We integrated NWP with our rice businesses in North America generating important synergies.
In 2008 we acquired Birkel, the branded pasta leader in Germany.
Our strategy in pasta is focused in:
Convenience, e.g.: microwave products, quick cook, etc.Health, e.g.: pasta enriched with vegetables, whole grain pasta, high fiber white pasta, etc.Taste/Ethnics, e.g. Fresh pasta, fresh sauces, Halal, etc.

COUNTRY MARKET SHARE VOLUMEN
Germany 11,2%
Belgium 13,7%
Cezch Republic 12,5%
USA 25,8%
Canada 39,4%
France 40,8%
Sauce
COUNTRY MARKET SHARE
France 33,6%
COUNTRY MARKET SHARE
France 30,5%
Fresh Pasta
Pasta
The Pasta Division Market Shares

The Pasta Division Main Brands
Pasta Raw Material Purchases
In Europe:
We purchase 582.000 tm/annum of durum wheat.524.600 tm/ annum come from France.57.400 tm/annum come from North America.
100% of French durum wheat purchase is done to cooperatives. In France the 60% of the purchases are made through three years contract where the price is fixed at the average price of the market.
The North American 100% durum wheat purchases for Europe are made from brokers.
In North America:
We purchase 280.000 tm/annum of durum wheat. 196.000 tm/annum come from the Northern Tier (Dakotas).28.000 tm/annum come form the desert (California).56.000 tm/annum come from Canada (Saskatchewan and Alberta).
All purchases from the Northern Tier are made on the open market, in the desert we contract acres with farmers, and in Canada is through the Canadian Wheat Board.
Pasta Factories EU.
Our facilities in EU are located in:
France:
Three mills: Gennevilliers (Paris): with a capacity of 130.000 tm/annum.Littoral (Marseille): with a capacity of 65.000 tm/annum.Saint Just (Marseille): with a capacity of 130.000 tm/annum.
Two plants of dry pasta:Nanterre (Paris): with a capacity of 87.000 tm/annum.La Montre (Marseille): with a capacity of 76.000 tm/annum.
Two plants of fresh pasta:Saint Genis Laval (Lyon): with a capacity of 20.000 tn/annum.Lorette (Lyon): with a capacity of 16.000 tn/ annum.
A plant of cous cousVitrolles: with a capacity of 50.000 tn/annum.
Germany:
Two plants of dry pasta:Mannheim: with a capacity of 66.000 tm/annum.Waren: with a capacity of 14.000 tm/annum.

Pasta Factories France
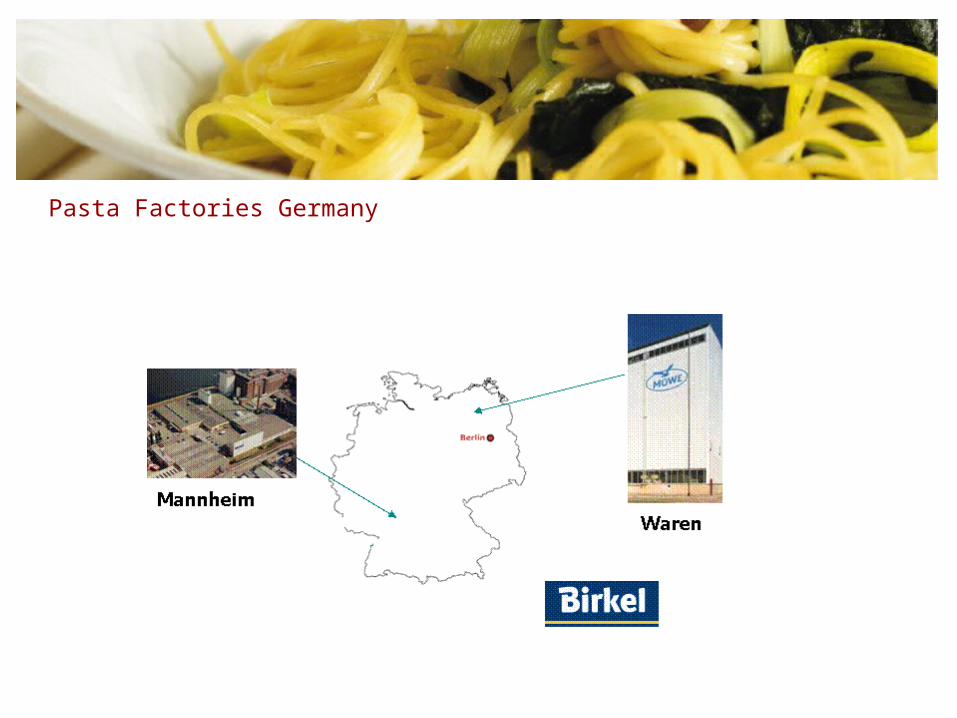
Pasta Factories Germany
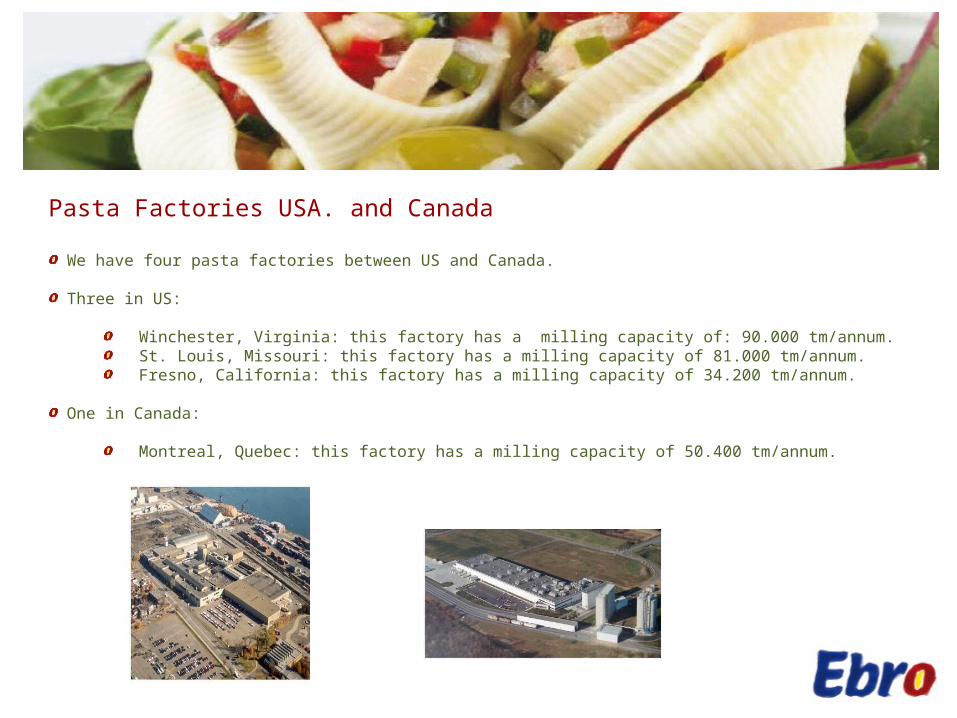
Pasta Factories USA. and Canada
We have four pasta factories between US and Canada.
Three in US:
Winchester, Virginia: this factory has a milling capacity of: 90.000 tm/annum.St. Louis, Missouri: this factory has a milling capacity of 81.000 tm/annum.Fresno, California: this factory has a milling capacity of 34.200 tm/annum.
One in Canada:
Montreal, Quebec: this factory has a milling capacity of 50.400 tm/annum.
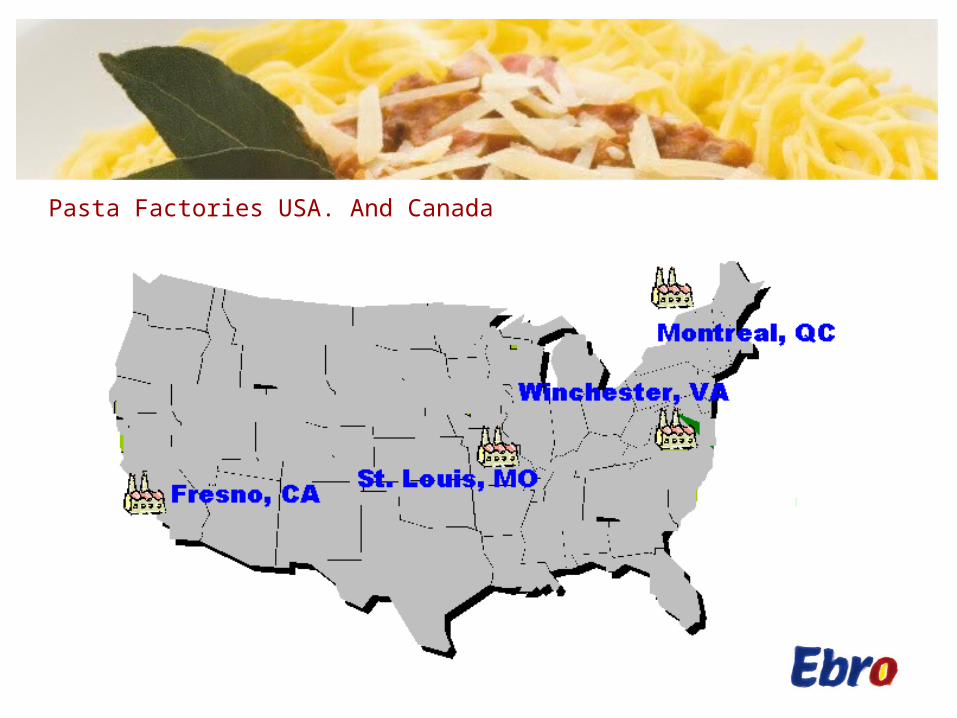
Pasta Factories USA. And Canada

4CONCLUSION

Conclusion
We are a Food Group specialized in products highly related with their raw materials, rice and durum wheat. Originally we started as a sugar and dairy company and nowadays we are focused in rice and pasta therefore our relationship with our raw material providers is very important.
We maintain strong and long lasting relations with the local farmers; we understand that the relationship between farmers and industrials is a long term one, based on cooperation and respect.
We purchase around 2 million tones of rice a year and some 1 million tones of durum wheat what shows the magnitudes we are used to trade.
We have a clear and strong commitment to develop ourselves as a world leading group in meal solutions based on rice and pasta and therefore we highly invest in R+D and marketing. We want to upgrade our portfolio with more value added products.
We are a Group with high speed of adaptation to the environment and specificities of each country. We have developed a skill of integration, always respecting the local cultures of each business and local management.
5ANNEX I. MAIN FIGURES
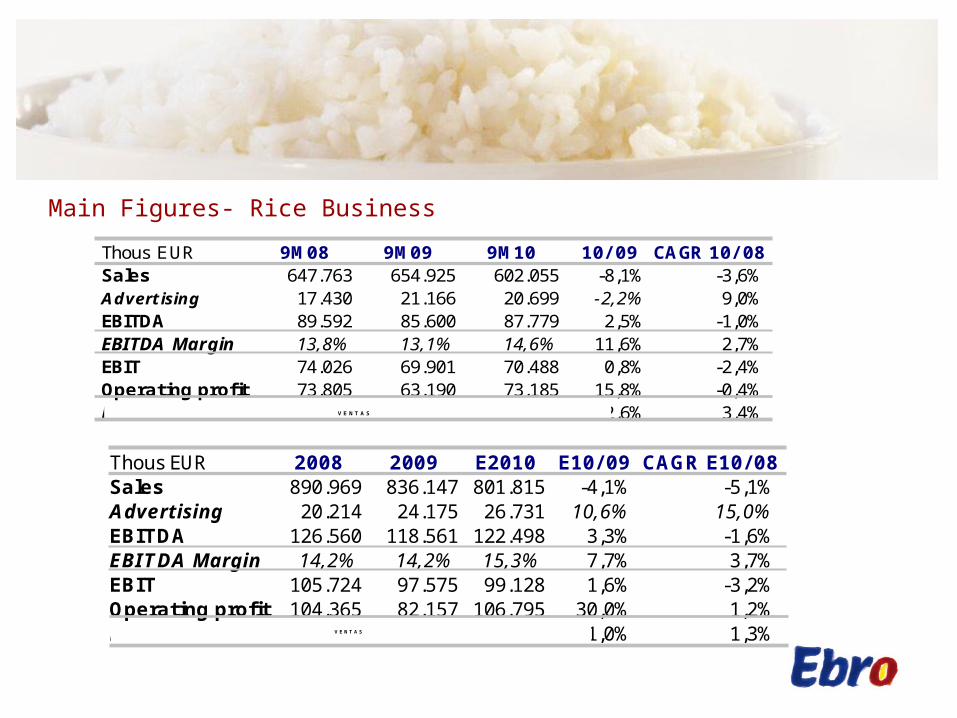
Main Figures- Rice Business
RICE
Thous EUR 9M08 9M09 9M10 10/ 09 CAGR 10/ 08Sales 647.763 654.925 602.055 -8,1% -3,6%Advertising 17.430 21.166 20.699 -2,2% 9,0%EBITDA 89.592 85.600 87.779 2,5% -1,0%EBITDA Margin 13,8% 13,1% 14,6% 11,6% 2,7%EBIT 74.026 69.901 70.488 0,8% -2,4%Operating profit 73.805 63.190 73.185 15,8% -0,4%ROCE 18,6 19,4 19,9 2,6% 3,4%
1
1
V E NT A S
Thous EUR 2008 2009 E2010 E10/ 09 CAGR E10/ 08Sales 890.969 836.147 801.815 -4,1% -5,1%Advertising 20.214 24.175 26.731 10,6% 15,0%EBITDA 126.560 118.561 122.498 3,3% -1,6%EBITDA Margin 14,2% 14,2% 15,3% 7,7% 3,7%EBIT 105.724 97.575 99.128 1,6% -3,2%Operating profit 104.365 82.157 106.795 30,0% 1,2%ROCE 19,0 19,7 19,5 -1,0% 1,3%
0
0
V E NT A S

Main Figures- Pasta Business
Thous EUR 9M08 9M09 9M10 10/ 09 CAGR 10/ 08Sales 713.065 692.308 669.379 -3,3% -3,1%Advertising 34.538 37.431 43.153 15,3% 11,8%EBITDA 67.208 94.807 117.651 24,1% 32,3%EBITDA Margin 9,4% 13,7% 17,6% 28,3% 36,6%EBIT 45.257 73.818 97.569 32,2% 46,8%Operating profit 36.381 71.767 91.254 27,2% 58,4%ROCE 12,6 21,6 29,3 35,6% 52,5%
1
1
V E NT A S
Thous EUR 2008 2009 E2010 E10/ 09 CAGR E10/ 08Sales 993.696 928.077 905.394 -2,4% -4,5%Advertising 47.273 48.781 56.661 16,2% 9,5%EBITDA 105.993 137.057 157.205 14,7% 21,8%EBITDA Margin 10,7% 14,8% 17,4% 17,6% 27,6%EBIT 75.581 108.831 130.935 20,3% 31,6%Operating profit 65.312 104.066 122.236 17,5% 36,8%ROCE 14,8 23,2 29,2 25,9% 40,5%
0
0
V E NT A S
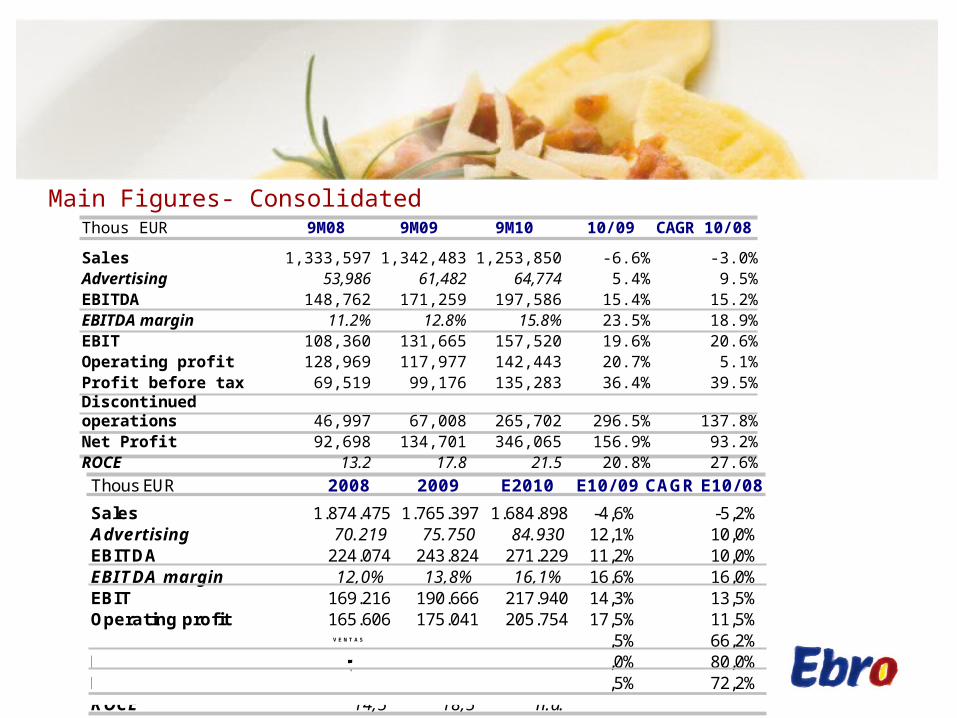
Main Figures- ConsolidatedThous EUR 9M08 9M09 9M10 10/09 CAGR 10/08
Sales 1,333,597 1,342,483 1,253,850 -6.6% -3.0%Advertising 53,986 61,482 64,774 5.4% 9.5%EBITDA 148,762 171,259 197,586 15.4% 15.2%EBITDA margin 11.2% 12.8% 15.8% 23.5% 18.9%EBIT 108,360 131,665 157,520 19.6% 20.6%Operating profit 128,969 117,977 142,443 20.7% 5.1%Profit before tax 69,519 99,176 135,283 36.4% 39.5%Discontinued operations 46,997 67,008 265,702 296.5% 137.8%Net Profit 92,698 134,701 346,065 156.9% 93.2%ROCE 13.2 17.8 21.5 20.8% 27.6%
Thous EUR 2008 2009 E2010 E10/ 09 CAGR E10/ 08
Sales 1.874.475 1.765.397 1.684.898 -4,6% -5,2%Advertising 70.219 75.750 84.930 12,1% 10,0%EBITDA 224.074 243.824 271.229 11,2% 10,0%EBITDA margin 12,0% 13,8% 16,1% 16,6% 16,0%EBIT 169.216 190.666 217.940 14,3% 13,5%Operating profit 165.606 175.041 205.754 17,5% 11,5%Profit before tax 72.354 124.436 199.780 60,5% 66,2%Discontinued operations 82.049 79.543 265.702 234,0% 80,0%Net Profit 130.637 176.539 387.552 119,5% 72,2%ROCE 14,5 18,5 n.a.
1
1
V E NT A S

Main Figures- Balance Sheet
After the sale of the Dairy Division (€630m) that took place in September we are debt free.
Thous EUR 30 Sep 08 31 Dec 08 30 Sep 09 31 Dec 09 30 Sep 10 E31 Dec 10 E10/09CAGR
E10/08
Net Debt 1,233,271 1,055,853 545,272 556,800 -84,306 70,160 -115.5% -74.2%Average Debt 1,205,893 1,208,078 770,943 716,725 508,386 n.d -34.1% -23.0%Equity 1,189,193 1,203,131 1,228,326 1,280,322 1,500,321 1,544,867 22.1% 13.3%Leverage ND 103.7% 87.8% 44.4% 43.5% -5.6% 4.5% -112.7% -77.3%Leverage AD 101.4% 100.4% 62.8% 56.0% 33.9% 46.4% -46.0% -32.0%x EBITDA (ND) 4.7 2.3 0.3x EBITDA (AD) 5.4 2.9 n.a.