corporate report · multiple pillars ensures its stability and a good risk-reward tradeoff. lbs...
TRANSCRIPT
2014Corporate Report
The Franco-German regional bankDie deutsch-französische Regionalbank
Foresight through proximity

CONTENTS
Foreword .......................................................................................................... 6
Group Management Report – Overview ......................................................13
SaarLB consolidated financial statements 2014 ...................................... 68
Consolidated statement of comprehensive income ................................ 69
Consolidated balance sheet ........................................................................ 70
Schedule of changes in equity .................................................................... 72
Cash flow statement .................................................................................... 73
Group Notes to the consolidated financial statements 2014 ................. 74
Board of Administration ............................................................................. 159
Board of Management ............................................................................... 160
Independent Auditors’ Report ................................................................... 166
Report of the Board of Administration .................................................... 167
Organisational Chart ................................................................................... 168
Shareholders ................................................................................................ 169
List of abbreviations .................................................................................... 170

3
CORPORATE REPORT 2014 | CONTENTS
We want to be close and take action... As the Franco-German regional bank, we set the agenda. Because we have the courage to try new things and improve existing ones. Because we want to combine economic foresight with human proximity. Because we can act at short notice and think in the long term.
We set the agenda.
People, stories and development
2014

4
1. BALANCE SHEET 31 DEC. 2014EUR MILLION
31 DEC. 2014EUR MILLION CHANGE IN %
Total assets 16,517 16,959 -2.6
Business volumes 17,330 18,026 -3.9
Loans and advances to banks 2,327 2,022 15.1
Loans and advances to customers 8,989 8,797 2.2
Assets held for trading 477 328 45.4
Investments* 4,342 5,033 -13.7
Liabilities to banks 4,880 5,749 -15.1
Liabilities to customers 4,645 4,759 -2.4
Securitised liabilities 5,196 4,940 5.2
Liabilities held for trading 543 433 25.4
Shareholders’ equity 747 585 27.7
Eligible equity in accordance with the CRR 878 876 0.2
2. PROFIT AND LOSS ACCOUNT
Net interest and commission income** 129.5 129.2 0.2
Gains or losses on fair value measurement 49.0 19.7 > 100.0
Administrative expenses 73.5 71.9 2.2
Earnings before taxes 88.0 56.0 57.1
Consolidated net income/loss for the year 59.2 35.6 66.3
* Including security repurchase transactions and interests in entities valued at equity** Including shares of profits in associated companies accounted for using the equity method
At a glance (IFRS)

5
The Bank’s Franco-German business model again ensured a successful financial year in 2014. There was a significant rise in the IFRS earnings, which was strongly affected by the exceptionally positive fair value gains.
CORPORATE REPORT 2014 | AT A GLANCE (IFRS)

6
(from left to right)
Werner Severin Chairman of the Board of Management
Frank Eloy Member of the Board of Management
Dr. Matthias Böcker Member of the Board of Management
Gunar Feth Chief Representative /
Designated Deputy Chairman of the Board of Management
Ladies and Gentlemen,Business Partners,

7
CORPORATE REPORT 2014 | FOREWORD
What is a sign of success for a company or bank? Growth in business volume? A “solid” profit at the end of the year? Satisfied customers? Motivated employees? All these aspects are certainly important. One point is missing, however: sustainable development. At SaarLB we have attached great importance to this in recent years. It comes with the Bank’s regional orientation – which has been reflected in the pure-ly regional ownership structure of SaarLB since last year. We would like to express our gratitude for the trust and confidence that our owners have in us.

8
The 2014 financial year proves that this path is a successful one. The Bank was able to generate IFRS earnings of EUR 59.2 million after tax-es, greatly exceeding its earnings in 2013. This increase was heavily influenced by the market value changes (over time greatly fluctuat-ing) due to the exceptionally positive fair value gains. A glimpse at the earnings (in terms of the German Commercial Code / HGB) over the last few years shows the stable core returns of the Bank with significantly smaller fluctuations. For 2014, the HGB earnings of EUR 22.2 million after taxes allow for both a reinstatement of the dividend payments to our shareholders and the strengthening of our equity base. Overall, the Bank generated higher income and was exposed to less risk in the last few financial years. The reduction of international capital market activities and the ongoing expansion of the direct customer business were very important. We created this together with our dedicated em-ployees.
Today, the Franco-German business model is established. In its core business, roughly 2/3 of the volume and income come from Germany, 1/3 from France. Our corporate customer business in Germany (new business volumes totalled EUR 305 million) saw an increase in invest-ments in 2014 and strong demand for credit in the region.
In France, our new business with corporate customers expanded de-spite the slow economic performance. In real estate finance, new busi-ness (total of EUR 375 million) was stable in Germany. In France, it de-clined due to margins being under pressure from competitors. Things looked different in the project business (new business volume totalled EUR 359 million): We saw another sharp increase in new business dur-ing 2014 in France. In Germany, by contrast, the “anticipation” effect from 2013 (due to the amendment of the Renewable Energy Act / EEG) lost its impact in 2014.
Together with the savings banks, SaarLB remains an important part-ner for municipalities, not only for municipal loans (EUR 123 million in new business) but, for instance, in the area of interest and currency management to hedge the currently low interest rates. On the deposit side of the balance sheet, the business with high net worth individuals

9
Our balanced business model ensures stability and a good
risk-return tradeoff.
CORPORATE REPORT 2014 | FOREWORD

10
We will continue to finance structurally important
investments in Saarland.

11
was influenced by the ongoing low interest policy in Eu-rope. The basically zero interest rate level we have reached in the meantime has a significant impact not only on pri-vate investors but also the credit economy. Despite the si-multaneously dramatic increase in the requirements from bank regulation, we were able to observe the following for SaarLB: The Bank’s balanced business model based on multiple pillars ensures its stability and a good risk-reward tradeoff. LBS Landesbausparkasse Saar also contributes to this as an integral part of SaarLB. Its new business was again significantly higher in 2014 (at EUR 652 million) than in 2013 (EUR 581 million).
With regard to the future development of SaarLB, we want to remain the first contact for structurally important in-vestments in Saarland.
We view ourselves as an integral part of Saarland’s strategy for France. We want to support SMEs even more strongly abroad, which could benefit from the new cooperation agreements (e.g. with the Bank of China, Frankfurt Branch). For customers, this can be a door-opener to the most im-portant export countries for Saarland. We continue to re-gard the area of renewable energy as a growth segment. In the case of larger financing, we would like to include even stronger partners, such as the savings banks in the region, through syndication.
We look forward to ongoing good collaboration with our customers and partners in 2015. We will introduce four cus-tomers from Germany and France on the following pages: Nanogate AG, VSE AG, EVS Entsorgungsverband Saar and Groupe Soprema.
Werner Severin Frank Eloy Dr. Matthias Böcker Gunar Feth
CORPORATE REPORT 2014 | FOREWORD

12

13
CORPORATE REPORT 2014 | GROUP MANAGEMENT REPORT
OVERVIEW
SAARLBThe SaarLB Group (hereinafter referred to as “SaarLB”) is a corporation established under public law with its headquarters in Saarbrücken.
In April 2014, the state of Saarland completed the acquisition of the shares held by Bayern-LB, as announced in the Management Report appended to the 2013 annual financial state-ments. The owners of SaarLB as of 31 Decem-ber 2014 are: • Saarland: 74.90% • Saar Association of Savings Banks,
Saarbrücken: 25.10%
SaarLB’s strategy is to be the Franco-German regional bank with a focus on corporate cus-tomer business, real estate business, special financing in the area of renewable energies (“RE”) and advisory services for institutional investors, the public sector/municipalities and high net worth individuals (wealth man-agement). SaarLB’s business is managed cen-trally from Saarbrücken. For the French busi-ness, SaarLB also has a branch in Metz as well as sales offices in Strasbourg and Paris.
Landesbausparkasse Saar (LBS), part of SaarLB, finances primarily residential real es-tate through its home loan savings business.
On account of its history and its ownership structure, SaarLB is an integral part of the savings banks finance group (Sparkassen-Fi-nanzgruppe) and attaches great importance to networking, particularly with the Saarland savings banks, while simultaneously concen-trating on core competencies. SaarLB is a central bank for the savings banks and is the principal bank for Saarland.
SaarLB and its shareholders have each made commitments that should ensure the ongo-ing independence of the Bank and its devel-opment into the Franco-German regional
bank. There is also a framework agreement with the Saar Association of Savings Banks on the principles for collaboration between the Saarland savings banks and SaarLB. The binding form is determined by the Bank’s business and risk strategy.
The entire target market includes Saarland, the neighbouring regions in south-west Ger-many, France and Luxembourg. For business in the area of renewable energies, the core market of SaarLB in Germany and France ex-tends across the regions, depending on the geographic conditions that are required for the successful operation of renewable ener-gy plants. The requirements for the business target in real estate and project financing as well as LBS (Landesbausparkasse : subsidiary of savings bank offering collective real estate savings products and providing low-interest residential mortgage loans) are met if the fi-nanced property or project is in Germany or France. In the case of properties (except for LBS), the borrower/investor/asset manager must also be based in the target market; or the financed property must be in the target market. In the area of real estate finance in France, the Île de France region is also one of the major core regions.
On the product side, SaarLB primarily con-centrates on marketable and needs-based products. Complex and highly-specialised products and services are primarily handled by cooperation partners.
In terms of its balance sheet, SaarLB is the largest bank in Saarland and feels a particu-lar connection and obligation to the region. SaarLB has deep roots in the region and ac-tively shapes economic life, making an im-portant contribution to cultural diversity and promoting the sciences in the greater region. This is seen, among others, in the promotion of science and culture through the awarding of the SaarLB science prize and countless permanent loans to the Saarland Museum.
Group Management Report

14
SaarLB’s obligation with respect to its em-ployees is reflected in its human resources work. In 2014, a focal point of SaarLB’s human resources work was on the subject of work-life balance, the overhauling of the management guidelines and the development of a Code of Conduct for all employees as well as the ongo-ing optimisation of the process for standard-ised staff issues.
The subject of work-life balance has been gain-ing importance on account of demographic change, the resulting lack of specialists and the need to strengthen staff loyalty. The fo-cus of the human resources work was on the development and design of instruments that make it possible for staff with dependants, for example, to handle their responsibilities for the Bank and address the needs of their family. Accordingly, a concept for alternating telework was developed and launched. This concept makes it possible to handle some tasks from home. The Bank’s efforts in this regard were acknowledged in October 2014 when it was awarded the seal of a “Fami-ly-friendly company”. The seal is awarded by the state of Saarland.
In various workshops with management and staff, SaarLB developed a collective under-standing of management and a Code of Con-duct that are based on its corporate strategy and brand. The main parts of this are: • Acting as a model generates motivation • Communication opens borders • Innovation shapes the future • Encouragement allows for opportunity
In order to simplify further the standard pro-cesses in the area of human resources, the Bank launched more options for technical support, including areas such as time man-agement.
SaarLB’s group of consolidated companies includes 7 subsidiaries, as in 2014. These in-clude SaarLB Bankenbeteiligungsgesellschaft mbH, Saarbrücken, LBS Immobilien GmbH, Saarbrücken and special funds that are
consolidated in full in accordance with IFRS 10. Companies on which SaarLB can exercise significant influence (associates) are included in the consolidated financial statements in accordance with the “at-equity” method. As in 2013, three associates continue to be valued according to the at-equity method. Materi-ality criteria are used to determine SaarLB’s scope of consolidation. After LBS Immobilien GmbH was consolidated in full for the first time as a material subsidiary in 2013, there are three (31 Dec. 2013: one) subsidiaries and one (31 Dec. 2013: zero) joint venture compa-nies and three associates (31 December 2013: five) neither fully consolidated nor included at equity, since they are insignificant for the net assets, financial position and results of operations of the Group.
SaarLB breaks its business down into a num-ber of segments that are mainly reflected in the structural organisation. The segments are described in the following:
Corporate CustomersThe Corporate Customers segment covers the entire SME business of SaarLB in its target markets. In Germany, this includes Saarland, Rhineland-Palatinate and the adjacent re-gions. In France, SaarLB’s Corporate Customer business is focused on the Grand-Est (Grand East) and here in particular on the neighbour-ing Alsace-Lorraine where the Bank is rep-resented by its branch in Metz and its sales office in Strasbourg. The main product in this segment is traditional lending. Further-more, a full service is provided, primarily by offering investment products, interest rate and currency management products as well as products in the areas of foreign trade and payment transactions in accordance with cus-tomers’ needs and giving business advice on how to finance companies. The broad range of products also includes financing for munic-ipalities and municipally-owned companies.
Real estateThe Real Estate segment at SaarLB is respon-sible for the financing of commercial real

15
CORPORATE REPORT 2014 | GROUP MANAGEMENT REPORT
estate. The business activities are limited to the target markets of SaarLB. Business is transacted on a bilateral basis or in the form of club deals under the leadership of the Bank. Professional and institutional investors who primarily invest in office and retail real es-tate are the focus in this segment. In France, the market is primarily handled by the Cen-tre d’Affaires Paris, which is a part of SaarLB France. In the German target market, SaarLB acts selectively as a financial service provider for developer measures and for public private partnership (PPP) measures for investments in infrastructure, education or other public construction projects. The Real Estate seg-ment’s regional focus on the German side is in the metropolitan area of the Rhine-Main, while in France it is on the urban centre of the Île-de-France. As in the Corporate Customers segment, credit financing is the main product, although SaarLB’s structuring and cross-bor-der legal expertise are also significant for the success of the business segment. Interest hedges with simple derivatives in the portfo-lio and new business are concluded with suc-cess, and increasingly payment transactions and investment products, too.
ProjectsThe Projects segment at SaarLB is responsi-ble for the financing of projects primarily in the renewable energy sector (RE) but also in the area of public private partnership on the French market. In the RE sector, SaarLB acts as a financial service provider for midsized project initiators and manufacturers that invest in wind and/or solar parks at good lo-cations and with sophisticated technology. Many customers in the business segment are supported across borders. The focus of the segment on the German side is regional in Saarland and Rhineland-Palatinate, while on the French side – due to its very good po-sition on the market – it is the entire country of France. The Bank does not finance offshore wind parks. As in the Corporate Customers and Real Estate segments, credit financing is of critical significance for the customer relationships and thus the development of
business. In addition to SaarLB’s particular Franco-German legal expertise, it also has extensive and long-standing know-how de-veloped under constantly changing market conditions in project analysis, the resulting case-specific and cash flow-driven structuring of finance, and SaarLB’s good access to long-term funding, which are viewed as significant key factors for the success of business over the long term.
Savings Banks, Institutionals and High Net Worth IndividualsThe Savings Banks, Institutionals and High Net Worth Individuals segment handles wealth advisory services and management for savings banks, institutionals and high net worth individuals. The focus of the Savings Banks and Institutionals is on increasing ex-isting customer connections and expanding contacts with insurance companies and pen-sion funds in the region and the business re-lationships to savings banks in Rhineland-Pa-latinate. It also deals with the financing of the region’s savings banks and municipalities. In the sub-segment of high net worth private customers, the focus is on complete support and advising for wealthy private customers. Lastly, as a centre of expertise, it actively supports the other segments in customer relationship management, especially in in-vestment, interest rate and currency manage-ment.
Treasury & Portfolio ManagementTreasury is responsible for the management of the interest book, the trading activities of the Bank, the collateral pool and collateral management as well as liquidity control and pricing. Portfolio Management is in charge of managing the liquidity account (Securities Ac-count A, collateral account and LCR portfolio), the management of the Bank’s own invest-ments (direct investments and special funds) and the management of the portfolios that are no longer a part of SaarLB’s core business and are being systematically reduced (reduc-tion portfolios).
16
LBSLandesbausparkasse Saar is a legally depend-ent unit of SaarLB. LBS Saar and its subsidi-aries are a service and excellence centre for “everything related to real estate”, making them an integral part of the Saarland savings banks finance group (Sparkassen-Finanz-gruppe). The main services are home loans and the financing of residential real estate. Another focus of the Bank’s policy is on the financing of energy projects in real estate and investments within the framework of the German Renewable Energy Act (Erneuer-bare-Energien-Gesetz), photovoltaic systems, for example. Additional services range from the management and brokerage of residential and commercial real estate to the preparation of real estate evaluations, energy reports or damage appraisals as well as the brokerage of select network (Verbund) products.
As announced in 2013, equity investments shall no longer be reported as a segment but rather be summarised under “Other items” due to their decreasing significance.
Control system at the BankThe strategic controlling of SaarLB is based on the business strategy for the entire bank and for the segments. It monitors the following IFRS financial performance indicators:
• Return on equity (RoE): Earnings before tax-es in relation to the tied-up economic capi-tal, whereby the economic capital is defined as 8% of the average risk positions in the year under review as calculated in accord-ance with the regulatory requirements, and
• Cost-income ratio (CIR): Administrative ex-penses as a percentage of the total ordinary income (consisting of net interest income, net commission income and other income). The fair value gain/loss is not explicitly tak-en into account in order to avoid market-in-duced dilution effects.
• RWA returns: This key performance indica-tor shows the total from the net interest
income, net commission income and other operating income in relation to the average risk positions.
Non-financial performance indicators are not used for controlling.
Economic environment
Germany began 2014 with a very strong 1st quarter. When adjusted for prices, gross do-mestic product (GDP) rose by 0.8% during this time. This jump benefited from the mild win-ter at the beginning of the year. In particular, construction profited from the seasonable weather. The slowdown in the 2nd quarter dampened the optimism, however. Nonethe-less, the ensuing weakness during this time also continued in the 3rd quarter so that the economy basically stagnated during the sum-mer. In particular, investment activity in Ger-many, which had finally taken off before, col-lapsed quite abruptly again. The 4th quarter has not yet been definitively calculated by the German Federal Statistical Office. The unoffi-cially stated growth of “roughly one quarter” of a percent is an indication, however, that the recovery – supported by cheap oil and a devalued euro – should have started up again.
The first official estimate announced that there was economic growth of 1.5% for the full year of 2014. That is significantly better than the weaker growth rates in 2012 and 2013 (+0.4% and +0.1%) and is even above the potential rate for Germany, which is usually expected to be around a good 1%.
German growth was supported by all the individual components, above all domestic demand. After adjusting for prices, private consumer expenditures rose by 1.1% in 2014. Despite fluctuations over the course of the year, gross capital expenditures increased by a total of 3.1%. The export of goods rose by 3.7% in real terms; imports by 3.3%. As a re-sult, the positive trade balance also made an important contribution to growth in 2014.

17
CORPORATE REPORT 2014 | GROUP MANAGEMENT REPORT
The transition to environmentally-friendly en-ergies continued to move ahead in 2014, with the year turning out to be a record breaker for renewable energies. According to the pre-liminary surveys by the German Energy and Water Industry Association (BDEW) at the end of December, renewable energies as a per-centage of total electricity generated in Ger-many should have increased to 25.8% in the past year (2013: 24.1%). In total, renewable energies covered roughly 27.3% of gross Ger-man electricity consumption in 2014. Wind energy also generated more electricity than ever before, accounting for roughly 8.9 TWh in the last month of the year. Wind energy’s generation of electricity rose by roughly 1.0%, whereas photovoltaics rose much more rap-idly, by roughly 14%. The gross increase in ca-pacity for onshore wind energy was 4,750 MW in 2014 (+58% as compared to 2013) and was thus far above the target corridor of 2,400 to 2,600 MW as set forth in the Renewable Ener-gy Act (EEG) in 2014. The cause of this sharp increase is an anticipatory effect due to the debate over the Renewable Energy Act (EEG).
SaarlandAfter two years of recession-related weak-ness, the Saarland economy recovered during 2014. Above all, the large industrial sectors have returned to their former strength. Gross domestic product (GDP) in Saarland rose by 2.1% in the first half of 2014, when adjusted for prices. On average, the economy in Saar-land outperformed the German economy both in nominal and real terms. For full year 2014, growth of roughly 2.0% is expected in Saarland.
The large industrial sectors in Saarland – the automotive industry, machine building and the steel industry – represent over 70% of the total sales in manufacturing and were able to significantly increase their sales in 2014. In the primary construction industry, incoming orders (+1.2%) rose slightly, while sales again fell substantially (-6.1%). The renovation busi-ness saw a 14.8% jump in sales. After the out-standing performance in 2013, there was no
hope for another improvement in the perfor-mance of construction approvals for residen-tial housing in 2014.
Thanks to the ongoing positive consumer sentiment of private households, retail (not including cars) managed to increase sales by 2.4%. The sale of vehicles, which collapsed by almost 40% in the previous year, continued to remain on a low level, however. This year, the catering and hotel industry should be men-tioned since it gave Saarland tourism a highly welcome lift, above all thanks to the construc-tion of a large recreational park.
Rhineland-PalatinateThe economic position of the economy in Rhineland-Palatinate was stable in 2014. Con-cerns about the ongoing course of domestic sales became the no. 1 risk factor, replacing concerns about high energy and raw material prices over the long term, which had assumed this place for many months. Companies across all industries observed increasingly weak de-mand, both on the part of end consumers as well as commerce and industry.
After a slight recovery in the early summer, investments in Rhineland-Palatinate lost mo-mentum into autumn. Furthermore, the fo-cus of the planned measures continued to be replacement purchases, while investments in the expansion of capacities – at least in indus-try – continued to lose significance.
In 2014, the adjusted production index was in total 0.7% below the level in the previous year. All three of the main industrial groups posted declines of a similar order of magnitude. While the output of intermediate product manufac-turers fell by 0.8%, the throughput in capital goods dropped by 0.6%. Consumer goods pro-duction was also somewhat lower than in the previous year. Of the three largest sectors in the state, only the mechanical engineering sector succeeded in noticeably increase its production output (+7.3%). Car manufactur-ing (-3.2%) and the chemical industry (-8.3%) had to accept declines. Rhineland-Palatinate’s

18
construction industry achieved growth in con-struction sales and in incoming construction orders in 2014. According to the State Statis-tical Office, sales – adjusted for the calendar and season – were 3.8% higher than in 2013. Commercial building construction accounted for a major contribution, rising by roughly 10.2%. Income orders exceeded the level from the previous year by 6.0% and were positively affected in particular by commercial construc-tion and excavation work.
FranceFor France, 2014 was as weak as the two years before, with GDP rising by up to 0.4%. Private consumption expenditures, a traditional driv-er of the French economy, have significantly underperformed since 2011. This reflects the massive uncertainty of French consumers. The consumption climate may have slightly recovered recently, but it is still at a low lev-el. Due to the low inflation rate of 0.8% on account of oil prices, wages in real terms rose slightly. The situation on the labour market stabilised recently.
The French government recognised the need to improve the competitiveness of companies and provide tax relief for them, so it launched a programme called “Crédit d’impôt pour la compétitivité et l’emploi” (CICE). Roughly EUR 40 billion in tax relief was granted over a period of three years. In addition, compa-nies should benefit in two other ways: on the one hand from a change in the threshold val-ues under labour market law and the other requirements that must be met once these thresholds have been reached. On the other, steps have been planned for a liberalisation, above all, of the service sector which is impor-tant for France. These are all steps in the right direction, but the positive effects from them will take time.
The situation on the office market in Paris is by no means as bad as sentiment in the French economy. After multiple quarters with declining rents, the office market should
stabilise gradually. The year 2014 went better than 2013, particularly with regard to the vol-ume and number of conducted transactions. However, the market was characterised by a significant decline in transactions with vol-umes < EUR 100 million (in 2013 their share was 52% vs. 32% in 2014). There were 44 trans-actions with a volume of > EUR 100 million in 2014. The vacancy rate remains relatively sta-ble at an average of 7.8%. Demand for quality properties continues to be very high. Rents are stabilising or starting to rise again.
Wind energy in France is also clearly on the rise. After many weak years in which new con-struction successively declined and the year 2013 when newly installed wind output was at 525 MW, new wind construction gained steam noticeably in 2014. New wind energy plants with a total output of 1,042 MW were connected to the grid in 2014. Among oth-ers, this is also due to the fact that the le-gal dispute over the remuneration waiver (Vergütungserlass) was resolved in May 2014 and various measures for a simplification of the legal framework were introduced for wind energy.
LorraineIndustrial production remained stable in 2014, exceeding the expectations of compa-nies in 2013. Total sales only improved slight-ly in 2014, by roughly 0.2%, but the share of exports in it increased somewhat more mod-erately, by +1.1%. By contrast, employment continued to decrease (-1.5%). The use of tem-porary workers continued to rise during the course of the year, but differs significantly from sector to sector. After a slight recovery in investments in 2013, they declined sharply, by 13.4%, in 2014. This development is mostly due to the significant decline in other indus-trial products, while other sectors (e.g., food production) increased. The performance of other industrial products (-2.2%) was also connected with this, and the chemical indus-try (-13.8%) declined the most in this segment.

19
CORPORATE REPORT 2014 | GROUP MANAGEMENT REPORT
Construction declined by 6.7%, which was significantly higher than forecast in 2013. Income declined across all sectors, with exca-vation accounting for roughly -8.9% and the primary construction industry for -10.2%.
In the service sector, sales decreased by 1.6% overall as compared to a 3.8% decline in 2013, whereby this decline concealed the differences in the individual sectors. While the legal professions, tax and corporate consulting firms as well as engineering and transport had to post declines in growth of between 3-5%, the information and commu-nications sectors saw growth (+6.1%). Sup-ported by government measures, particular-ly with regard to the employment costs, the percentage of employed people fell only very moderately (roughly 0.5%). Investment ac-tivity levelled off across all sectors, primarily in transport.
AlsaceAfter the observed decline in 2013, the situ-ation in industry in Alsace improved slightly in 2014. Total sales rose slightly, by roughly 1.5%, supported in particular by exports (+2.8%), even if the European economy was not especially dynamic. This development had no positive impact on employment, which fell by -0.7% over the course of the year. The food industry was able to increase sales by 4.4%, despite the disappointing re-sults in the sector of meat and drink produc-tion. As predicted, the production of means of transport showed a pleasing improvement of 14.1%, both in the automotive industry (particularly in production) and in other means of transport. The increase in sales is supported in particular by the improvement in exports (+20.9%).
According to a business survey by the Ban-que de France, investments increased by roughly 5.6% in 2014. 85% of businesses have invested in modernisation and in the adjust-ment to applicable standards. Expenses in the food industry, by contrast, fell by 16.1%, after a decline of 6.7% in 2013. In the area
of means of transport and other industrial products (e.g. chemicals, textiles, paper pro-duction) by contrast, investment expendi-tures rose significantly.
In construction, stability was attributable to sales in the secondary construction industry (+3.6%), while the primary construction indus-try (-1.6%) and excavation (-5.9%) confronted a decline in demand and a lack of large projects. The ongoing weakness in incoming orders and the lack of a recovery in demand – above all from the public sector – caused companies to adjust their costs and staff to capacity (-1.1%); use of temporary work was also limited. After the de-cline in the last two years, investment expendi-tures increased overall in 2014 (+4.5%) except in the primary construction industry (-8.2%).
In the service sector, economic growth re-mained 1.3% behind expectations, with de-mand not showing any signs of rising. Trans-port and logistics rose by 2.9%, while the IT industry solely grew by 0.6%. The 1.6% rise in employment was mainly due to hiring in the transport (+1.7%) and IT (+5.9%) industries. In-vestments in the area of the service sector fell by roughly 10.3% in 2014, particularly affected by declines in the transport industry (-10.7%).
Financial sector
The stability of the financial sector in Germa-ny continued to be slightly strained during the reporting period. There is still a series of risks that could disrupt this stability. These include, for example, exposure to countries that are affected by the European sovereign debt crisis or the effect the economic sanctions have on the Russian economy. In addition, the ongoing low-interest environment is also having a no-ticeable impact on the stability of the German financial system.
Furthermore, the financial sector must face the challenges that could result from structur-al changes in the financial system. The signifi-cance of regulatory requirements plays a major role here.

20
The financial market and sovereign debt crisis in recent years caused the adoption and the planning of numerous regulatory measures over the past few years and in 2014. These
measures should affect the regulatory envi-ronment in the financial sector over the long term.
The development on the European and par-ticularly the German stock market is an indi-cator of how the financial crisis continues to abate. The DAX closed the reporting period at roughly 9,800 points, a slight rise of 2.66%. The German benchmark index is currently affected by the significant uncertainty on ac-count of the ongoing conflicts in Ukraine and the Middle East, which is seen in the high de-gree of fluctuation over the course of the year. The 10,000 point benchmark may have been broken twice, but was not held for long.
Contrary to the positive development on the stock market, the euro fell substantially against the US dollar over the course of the year, dropping from 1.38 EUR/USD at the be-ginning of the year to 1.21 EUR/USD at the end of 2014.
The Swiss franc remained stable, above the level of 1.20 CHF/EUR over the course of the year, despite high international demand. This exchange rate was supported by the meas-ures of the Swiss National Bank (SNB), which attempted to avoid an appreciation of the franc. After the SNB stopped the measures on
15 January 2015, the exchange rate fell signif-icantly to roughly 0.86 CHF/EUR. SaarLB and its customers only do business in Swiss francs to an insignificant extent. In this respect, the devaluation did not play an important role for SaarLB.
Due to the slow economic recovery in the eurozone, the ECB lowered its benchmark refinancing rate from 0.15% to 0.05% in Sep-tember. After years of zero interest rates, in-terest rates for the deposit facility at the ECB became negative for the first time at -0.20% in September 2014.
The average 3-month Euribor was below the Bank’s originally expected amount of 0.5% throughout the 2014 reporting year and, after a fairly stable first half of the year, moved sub-stantially downward to an average of 0.3% and thus again fell below the already low level in 2013. The development of long-term inter-est remained on a historically low level over the course of the year and, contrary to our ex-pectations, fell even further as compared to the end of 2013.
3-month Euribor Q1/14 - Q4/14 in %
0.40
0.32
0.24
0.16
0.08
0.00
Q1/14 Q2/14 Q3/14 Q4/14
Source: Deutsche Bundesbank statistics
Swap rates Q1/14 - Q4/14 in %
2.50
2.00
1.50
1.00
0.50
0.00
Q1/14 Q2/14 Q3/14 Q4/14
Source: Bloomberg
10 years 5 years

21
CORPORATE REPORT 2014 | GROUP MANAGEMENT REPORT
The architecture of the European banking un-ion continued to take shape in 2014. The Sin-gle Rule Book, which also includes the Capital Requirements Regulation (CRR) and the Cap-ital Requirements Directive (CRD), standard-ised the European banking supervisory rules. The equity and liquidity requirements of the CRR in force were amended. In accordance with the European Capital Requirements Reg-ulation (CRR), banks have been required to re-port a leverage ratio to the European Banking Authority since 2014. The leverage ratio is a debt ratio independent of risk, consisting of the regulatory capital as a percentage of the Bank’s business volume.
This is now followed by the European Bank-ing Authority (EBA): After a comprehensive review of the 120 largest bank groups in the eurozone, the Single Supervisory Mechanism (SSM) will begin its work. The European Cen-tral Bank (ECB) has been responsible for the supervision of the 120 largest bank groups in the eurozone since November 2014. It works closely with the national supervisory authori-ties. The SSM is a part of the overall project to create a banking union. The next step will be-gin in 2016 and consist of a joint Single Reso-lution Mechanism (SRM) for banks. The main goals of the SSM are the standardisation and the simplification of the banking authority. The ECB completed a Comprehensive Assess-ment in preparation for the assumption of its supervisory function over the 120 bank groups in the eurozone. This included a regulatory risk audit, an asset quality review and a stress test. The stress test was completed in close coordination with the EBA and should deter-mine the resiliency of the banks during times of crisis. SaarLB was not affected by this in 2014.
The harmonisation of the Deposit Guarantee Schemes (DGS), the third component of the banking union, is also moving ahead. All EU countries are obligated to build up bank-fi-nanced deposit guarantee schemes. This will guarantee bank deposits up to EUR 100,000 in cases of loss. The deposit guarantee schemes
in Germany will continue to remain in their ex-isting forms. An EU-wide pooling of the depos-it guarantee schemes is not planned.
In order to implement the European require-ments for the bank union, the German parlia-ment passed a package of laws for the imple-mentation of the European bank processing guidelines (BRRD Implementation Act) and other accompanying laws. The package of laws should facilitate in particular the imple-mentation of the guidelines for a European legal framework for restructuring and un-winding banks, which entered into force on 2 July. The unwinding authority shall receive in particular the right to financially include shareholders and creditors of a bank in the event of an unwinding (so-called “bail-in”). This rule complements the intervention and unwinding instruments that already exist in national law. The most important part is the “Law on the Restructuring and Unwinding of Banks and Financial Groups” (Sanierungs- und Abwicklungsgesetz – SAG).
Besides the far-reaching changes that the fi-nancial sector is facing as a result of the bank-ing union, the current regulatory drafts are already foreshadowing their impact:
the Basel Committee on Banking Supervision has already tightened the existing rules and the regulatory requirements for banks in the principles for the effective aggregation of risk data and the risk reporting (BCBS 239). BCBS 239 consists of eleven principles which are considered relevant for banks in general and are based on overall corporate management and infrastructure, the risk data aggregation capacities and the risk reporting. Starting at the end of 2015, the first banks in Germany will implement the rules.
The Financial Reporting (FINREP) and the Common Reporting (COREP) for regulated bank institutions will also be harmonised and standardised. The FINREP implements the ba-sic understanding of the international finan-cial reporting standards (IFRS). This applies in

22
particular to the classification and the evalu-ation of financial instruments.
The European Banking Authority (EBA) is preparing another regulatory framework by drafting a guideline for the Supervisory Re-view and Evaluation Process (SREP). This is intended for the supervisory authorities of the EU states. In part, these principles have already been included in the guidelines for
the banking supervision by the ECB and are therefore of major significance for future reg-ulatory practice. The institutes are divided into categories according to the concept of proportionality, whereby this categorisation should reflect the institute’s risk for the finan-cial system. The internal governance and con-trols, the significant risks, capital and liquidi-ty stand at the centre of the assessments.

23
CORPORATE REPORT 2014 | GROUP MANAGEMENT REPORT
RESULTS OF OPERATIONSDEVELOPMENT OF EARNINGS IN THE SAARLB GROUP
The consolidated net profit before taxes was EUR 88.0 million, significantly above the good result in the comparative period of 2013 (EUR 56.0 million). However, the slow invest-ment activity and the historically low interest rates had a negative impact on SaarLB’s earn-ings in 2014.
Due to the stable course of business in 2014, the extraordinarily good fair value gains as well as the significantly lower-than-expected
risk provisions, the return on equity (before taxes), in accordance with IFRS, was 16.0% as of 31 December 2014. This is significantly above the amount in the comparative period of 2013 (9.9%) and, on the current reporting date, is better than expected in last year’s forecast. The cost-income ratio in accordance with IFRS is 56.3%, moderately above the com-parative amount of 54.9% in 2013 and in line with our forecast at the end of 2014. The RWA returns remained largely on a constant level.
EUR million 2014 2013 ∆ in million ∆ in %
Net interest income, including profit/loss from companies valued at equity [1] 122.4 121.4 1.0 0.8%
Risk provisions in the credit business [2] -16.2 -20.0 3.8 -19.0%
Net commission income [3] 7.2 7.8 -0.6 -7.7%
Earnings from fair value measurement, including gain/loss on hedge accounting [4] 46.3 20.1 26.2 130.3%
Gain/loss on investments [5] 0.9 -3.3 4.2 -127.3%
Administrative expenses (incl. depreciation) [6] -73.5 -71.9 -1.6 2.2%
Other income [7] 0.9 1.9 -1.0 -52.6%
Consolidated net profit/loss (before taxes) [8] 88.0 56.0 32.0 57.1%
Income taxes [9] -28.7 -20.4 -8.3 40.7%
Consolidated net profit/loss for the year [10] 59.3 35.6 23.7 66.6%
Average risk positions [11] 6,877 7,042 -165.4 -2.3%
CIR ([6] / ([1]+[3]+[7])) [12] 56.3% 54.9% 142 bp
RoE ([8] / ([11]*8%)) [13] 16.0% 9.9% 606 bp
RWA returns (([1]+[3]+[7]) / ([11]) [14] 1.9% 1.9% 4 bp

24
SaarLB’s net interest income (including earn-ings from companies measured at equity) rose by EUR 1.0 million in 2013, from EUR 121.4 mil-lion to EUR 122.4 million in 2014. This remains significantly below the last forecast and cor-responds to a rise of 0.8%.
Net interest income continues to be defined by the very low interest rates and decreasing credit volume, which is largely determined by the systematic reduction of the sub-portfoli-os that are no longer a part of the core busi-ness.
The decline in interest expenses from EUR -477.2 million in 2013 to EUR -417.0 mil-lion in 2014 (-12.6%) was more than fully com-pensated by a moderate decline in interest income from EUR 598.2 million in 2013 to EUR 539.3 million (corresponds to -9.8%) in the current reporting period.
Interest income from credit and money mar-ket transactions fell by EUR 22.9 million and was significantly below the level in the pre-vious year. This is a decline of roughly 7.6%. Interest expenses from liabilities to banks and customers decreased significantly, by EUR 31.2 million, or 17.2%.
Interest expenses for derivatives in hedge accounting and derivatives with economic hedge relationships totalled EUR 196.1 million in the reporting period, which was slightly be-low the amount in 2013 (EUR 220.1 million).
By contrast, interest expenses for sub-ordinate/hybrid capital declined from EUR 18.7 million to EUR 16.6 million (-11.4%) in 2014.
The earnings from companies valued at-equi-ty totalled EUR 0.2 million at the end of 2014, remaining on almost the same level as in 2013 (EUR 0.3 million).
The risk provision in the credit business was EUR -16.2 million, which was EUR 3.8 million below the level of EUR -20.0 million in 2013.
The additions to individual risk provisions (including provisions) were EUR -24.5 million, which was EUR 14.5 million below the amount of EUR -39.0 million in 2013. The releases of individual risk provisions (including provi-sions and the receipt of written-off loans and advances as well as the write-up of loans and advances) totalled EUR 10.7 million, which is roughly EUR 9.1 million below the level of EUR 19.8 million in 2013.
Additions to portfolio risk provisions totalled EUR -2.4 million, which is below the amount in 2013 (EUR -2.9 million). They stand in relation to releases of EUR 0.1 million in 2014 (2013: EUR 2.1 million).
The net commission income amounts to EUR 7.2 million and is thus slightly below the level in 2013 (EUR 7.8 million) and also slightly below the last forecast.
The decline in the net commission income is primarily due to a drop in the commission income from the credit and lending business (EUR -1.5 million as compared to 2013).
Other commission income fell slightly, by EUR 0.5 million, to EUR 0.7 million.
The gains on fair value measurement, incl. the gains on hedge accounting, came to EUR 46.3 million and were significantly above the level of EUR 20.1 million in 2013. The pos-itive valuation effects due to low interest rates accounted for this, including an effect of EUR +7.7 million from securities measured in accordance with the fair value option.
The gains on hedge accounting are EUR -2.7 mil-lion in the year under review, which is below the level of the previous year (2013: EUR +0.4 mil-lion). The gains on hedge accounting show the existing ineffectiveness of the held hedges within the scope of the ranges permitted for hedge accounting. The absolute increase in the gains on hedge accounting is due to the significant increase in the scope of the hedge relationships relative to the end of 2013.

25
CORPORATE REPORT 2014 | GROUP MANAGEMENT REPORT
The gains/losses on investments totalled EUR 0.9 million in the reporting period, which is EUR 4.2 million above the level in 2013 (EUR -3.3 million) and thus confirms the forecast in the previous year. The gains were mainly influenced by the relatively higher capital gains profits (EUR 2.8 million) and higher income from write-ups (EUR 1.6 mil-lion).
Administrative expenses incl. the deprecia-tion of property, plant and equipment and the amortisation of other intangible assets totalled EUR -73.5 million on 31 Decem-ber 2014, which was above the amount in the comparative period of 2013 (EUR -71.9 mil-lion), but significantly better than expected in our original forecast. Personnel expenses rose slightly from 2013, by EUR 1.6 million, to EUR -43.1 million, in accordance with the forecast. Other administrative expens-es also rose slightly, by EUR 0.3 million, to EUR -28.2 million, but that is significantly less than expected in the framework of last year’s forecast. The deviation from the fore-cast is mainly due to the higher than planned capitalisation of IT migration costs at LBS.
The depreciation of property, plant and equip-ment and the amortisation of other intangi-ble assets was EUR -2.2 million and slightly below the level from 2013 (EUR -2.5 million).
Other income amounted to EUR 0.9 million in the reporting period (2013: EUR 1.9 million).
Other income fell year on year from EUR 4.6 million to EUR 3.4 million. It main-ly includes rental income from investment property (EUR 1.3 million; 2013: EUR 1.3 mil-lion) and income from the release of provi-sions (EUR 0.8 million; 2013: EUR 1.5 million). The decline in other income as compared to 31 December 2013 is primarily due to the decline in income from the release of provi-sions (EUR -0.7 million) and the decrease in capital gains from repurchased own issues (EUR -0.4 million).
The sum total of other expenses is EUR -2.5 mil-lion in the reporting period, which is on the level of 2013 (EUR -2.7 million).
In total, the consolidated net profit before taxes in 2014 is EUR 88.0 million as compared to EUR 56.0 million in the comparative period of 2013. The forecast in 2013 was greatly ex-ceeded as a result.
After taking into account the tax expenses of EUR -28.7 million (2013: EUR -20.4 million), there was a consolidated net profit after taxes of EUR 59.3 million (2013: EUR 35.6 mil-lion) of which a dividend in the amount of EUR 3.0 million was distributed to the share-holders. The tax expense consists of an actual tax expense in the amount of EUR -11.6 million (2013: EUR -15.1 million) and an expense for deferred taxes in the amount of EUR -17.2 mil-lion (2013: EUR -5.3 million).
DEVELOPMENT OF BUSINESS AND EARNINGS IN THE SEGMENTS
The contributions made by the core segments to earnings are described in the following:
Corporate Customers (CC)
Corporate Customers services corporate customers in Germany as well as corporate customers, municipalities and municipally owned companies in France. The target mar-kets in Germany are Saarland, Rhineland-Pa-latinate and the surrounding regions. In France, SaarLB concentrates on the Grand-Est (Grand East) and here in particular on the neighbouring Alsace-Lorraine where the Bank is represented by its SaarLB France branch at the offices in Metz and Strasbourg.

26
The Corporate Customers segment achieved net interest income of EUR 25.0 million at the end of 2014 and thus exceeded its earnings in 2013 by EUR 2.1 million. The rise in companies’ business and investment activity, which was noticed in both the French and German target markets in the second half of 2013 also con-tinued in 2014. In the second half of the year, the sectors of metal production and process-ing as well as power plant construction were an exception to this due to the strong compe-tition from the far east and the high level of uncertainty on the market as well as the hes-itancy to make investments in the European energy industry. The high liquidity reserves and good internal financing capabilities place large midsized companies in the position to fund their working capital needs and ongoing investments increasingly from their own re-sources. This increases competitive pressure among banks and keeps the pressure on the margins constantly high. On the German side, SaarLB was able to successfully implement multiple structured financing (promissory notes and syndicated loans) with the involve-ment of Saarland savings banks.
In the business with corporate customers in France, SaarLB benefited in particular from a very dynamic 2nd half of the year. The Bank provided new loans above all to internation-ally active companies and companies with a connection to Germany. New lending business with municipal customers in France remained below expectations in this year. However, it
was possible to draw attention to new points of emphasis through the development of new products and services. The offer of short-term lines of credit based on the reference interest rate and the providing of promissory note loans for German investors should be empha-sised here.
The entire new business volume in the seg-ment totalled roughly EUR 300 million and was distributed almost evenly across Germa-ny and France in 2014. In comparison to the previous year and to the plan, new business could also be improved due to the income components in the current financial year. The portfolio quality as measured in terms of av-erage rating exceeds the budget assumptions but remains slightly below the amount in 2013.
Overall, we slightly exceeded our expecta-tions both in new business and portfolio busi-ness on the basis of the good positioning with our strategic customers and the high number of initiated business relationships, also con-firming our forecast in last year’s financial statements.
The risk provisions in the lending business for EUR -3.4 million were due to new provisions in the Corporate Customers Germany seg-ment. In France, by contrast, the releases of provisions overcompensated for the creation of new provisions. Thanks to the conserva-tive risk provision policy, the actual costs
EUR ’000s 2014 2013 Δ thousand Δ in %
Net interest income 25,034 22,952 2,082 9.1%
Risk provisions in the credit business -3,377 -6,666 3,289 -49.3%
Net commission income 3,526 3,917 -391 -10.0%
Gain/loss on fair value measurement -260 94 -354 -377.0%
Gain/loss on investments 0 115 -115 -100.0%
Administrative expenses -10,905 -15,134 4,229 -27.9%
Earnings before taxes 14,017 5,279 8,739 165.5%
Segment assets 1,906,893 1,778,351 128,543 7.2%

27
CORPORATE REPORT 2014 | GROUP MANAGEMENT REPORT
(individual risk provisions) both in Germany and in France were significantly below the planned risk costs.
Net commission income in the amount of EUR 3.5 million in 2014 consists of almost one half commissions as a result of guarantee business and one half commissions that are largely driven by the credit business.
Administrative expenses totalled EUR -10.9 mil-lion and were roughly EUR 4.2 million below the level in 2013. This is primarily due to a change in the cost system and cost allocations from the previous year. This also applies according-ly to other segments.
The segment assets in the amount of EUR 1,907 million showed slight growth in
comparison to the previous year, rising by EUR 129 million.
Real Estate (RES)
The Real Estate segment is responsible for the financing of commercial real estate in the SaarLB Group. The regional focus is also on the German target market already defined for the Corporate Customers segment and the French Grand East, with a focus on the Île-de-France. The management of French real estate investors is also handled mostly from the offices in Paris. Additionally, the Real Es-tate segment supports public private part-nership measures (PPP) for investments in infrastructure and education as well as other public construction measures in the German regional market.
Net interest income in the Real Estate seg-ment totalled EUR 30.2 million, remaining fairly stable as compared to 2013 (+1.5%) but it did not meet expectations and confirmed the forecast made in the middle of the year. This is due to the lack of new business in the French market, the lacking or very low number of market transactions in the Bank’s target segment as well as the substantially greater competition with new market competitors in the niche business < EUR 20 million. The re-sulting decreases in volumes in France were not compensated by the better development of business in Germany. The large shortfall in the development of new business also led to a corresponding reduction in the net commis-sion income.
The Real Estate segment was revalued and extended for a total of roughly EUR 375 mil-lion in the reporting period. Despite greater competition in both markets, SaarLB was able to achieve its planned margins. The develop-ment of new business remained significantly behind expectations in France in particular.
The risk provisions in the lending business of EUR -6.9 million remained on the level of 2013, deviating by just EUR 0.2 million (2.5%). The release of provisions in Germany and France were not able to compensate for newly cre-ated provisions. The majority of the risk pro-visions are attributable to the Real Estate France segment.
EUR ’000s 2014 2013 Δ thousand Δ in %
Net interest income 30,244 29,787 457 1.5%
Risk provisions in the credit business -6,919 -7,095 176 -2.5%
Net commission income 944 1,544 -600 -38.8%
Gain/loss on fair value measurement -576 0 -576 0.0%
Administrative expenses -8,412 -8,849 437 -4.9%
Earnings before taxes 15,281 15,386 -105 -0.7%
Segment assets 2,637,597 2,713,043 -75,446 -2.8%

28
The change in net commission income primar-ily depends on the new business volume and was – due to the low number of closings – sig-nificantly lower at EUR 0.9 million on 31 De-cember 2014 (-38.8%).
Administrative expenses totalled EUR -8.4 mil-lion in 2014 and are thus slightly below the lev-el of the previous year (EUR -8.8 million).
In total, segment assets amount to roughly EUR 2,638 million and are thus slightly below the level in 2013.
Projects (PF)
The Projects segment is responsible for the financing of projects in the SaarLB Group, es-pecially in the renewable energy sector, but also in the area of public private partnership (PPP) on the French market. The regional fo-cal point of business is in France.
Net interest income in the Projects seg-ment could be significantly increased in 2014, from roughly EUR 20.0 million to EUR 24.7 million (+23.5%). The main reason for this was the continuous expansion of the new lending business in 2014. In total, the Bank awarded credit in the amount of roughly EUR 350 million, which signifi-cantly exceeded the trend described in the 2013 forecast. Of this amount, almost 90% – more than in previous years – was attrib-utable to the French market, which again underscores the strong market position and the structuring and legal expertise of SaarLB as the Franco-German regional bank. In the German target market, new business was in line with expectations, but closures were significantly below the level in 2013 due to the restrictive impact of the Ger-man Renewable Energies Act (EEG). In the sub-segment PPP France, the Bank was able
to maintain its market position as a niche provider for midcap projects, as planned.
The use of the risk provisions was defined by the creation of new provisions in the area of other special finance in the past financial year, and they are also reported in the Pro-jects segment. The portfolio quality in the Renewable Energies segment continues to be linked to the very good level in 2013.
Net commission income of EUR 4.3 million is EUR -0.2 million below the previous year. This is mainly due to a decline in credit com-missions from lending in Germany, which could not be fully compensated by projects in France.
Administrative expenses amount to EUR -6.3 million and are thus below the level in 2013 (EUR -7.4 million).
EUR ’000s 2014 2013 Δ thousand Δ in %
Net interest income 24,675 19,983 4,692 23.5%
Risk provisions in the credit business -5,865 -7 -5,858 ***%
Net commission income 4,305 4,550 -246 -5.4%
Gain/loss on fair value measurement -181 0 -181 ***%
Administrative expenses -6,269 -7,437 1,168 -15.7%
Earnings before taxes 16,664 17,089 -425 -2.5%
Segment assets 2,001,401 1,790,396 211,005 11.8%

29
CORPORATE REPORT 2014 | GROUP MANAGEMENT REPORT
Segment assets in the business segment rose by EUR 211 million to EUR 2,001 million as of 31 December 2014.
Savings Banks, Institutionals and High Net Worth Individuals
Savings Banks, Institutionals and High Net Worth Individuals provides wealth advice and management to savings banks, institutional investors and high net worth individuals. The focus of the Savings Banks and Institutionals segment is on increasing existing customer connections as well as on expanding contacts with insurance companies and pension funds in the region and the business relationships to savings banks in Rhineland-Palatinate. An-other task consists in obtaining liquidity for institutional investors. It also deals with the financing of the region’s savings banks and municipalities.
New business in the area of municipalities ended the year at roughly EUR 122 million, which was significantly above the level in 2013 but below the expectations for the financial year. The forecast at midyear 2014 was con-firmed here. In contrast to this, the achieved
new business margins did meet expectations. For the first time, the business segment for municipal customers acted as the arranger for promissory notes and placed them with insti-tutional investors.
The special fund business thrived, which was seen in particular in a noticeable rise in the depository bank volume. The ongoing low lev-el of interest rates continued to hurt margins in the liabilities business over the course of the year.
In the business with high net worth private customers, the volume of liabilities contin-ued to enjoy a positive development, rising by just under 38% to roughly EUR 330 million at the end of the year. Due to the low interest environment, margins remain on a low level but slightly increased in comparison to the previous year.
The Wealth Management subsegment has been steadily expanded and is improving high net worth individuals’ awareness of SaarLB, particularly those with an entrepreneurial background.
EUR ’000s 2014 2013 Δ thousand Δ in %
Net interest income 6,457 4,430 2,027 45.7%
Risk provisions in the credit business 4 29 -25 -85.6%
Net commission income 4,772 3,775 998 26.4%
Gain/loss on fair value measurement -313 809 -1,122 -138.7%
Administrative expenses -5,939 -7,410 1,472 -19.9%
Earnings before taxes 4,982 1,633 3,349 205.1%
Segment assets 1,596,627 1,817,976 -221,349 -12.2%
Net interest income rose from EUR 4.4 million to EUR 6.5 million. The reasons for this were the increase in volumes, effects from inter-est book management, which had a positive impact on liability margins, and the good success in the placement of the Bank’s own is-sues with institutional investors and savings banks.
A risk provision in the lending business was not required to any significant extent at the time this annual report was prepared, similar to 2013. This reflects the good quality of the portfolio in the segments of Savings Banks, High Net Worth Individuals and Institution-als.

30
Net commission income improved signifi-cantly year on year to EUR 4.8 million (2013: EUR 3.8 million), which is mainly due to a rise in securities and commission income. Besides the classical securities business, the commis-sion business also made a major contribution. The development of the commission business reflects the forecasts made in midyear 2014.
Administrative expenses in the amount of EUR -5.9 million are below the level of the pre-vious year (EUR -7.4 million).
The segment assets, which have been defined by municipal financing and (in the past) the refinancing of savings banks, fell from roughly EUR 1,818 million to around EUR 1,597 million on account of scheduled repayments.
Treasury and Portfolio Management (TP)
The Treasury and Portfolio Management seg-ment is responsible for the classical treasury functions, including management of the in-terest rate risk (asset-liability management) and liquidity, as well as the management of the securities portfolio that is primarily held for liquidity purposes (Securities Account A and LCR Portfolio) and the management of the Bank’s strategic own investments (direct
investments and special funds). In addition, the segment is also responsible for the man-agement of all the portfolios that are no longer included in the Bank’s core business, including investments in international banks and corporate addresses outside of the core of Europe, international commercial real estate finance, securitisations and various smaller subportfolios. Over the medium term, SaarLB would like to sell and run off these re-duction portfolios, 80% of which have invest-ment grade securities.
Thanks to new business of roughly EUR 563 million, which was significantly above the budget, the portfolio volume in Securities Account A will remain at roughly the same level as in the previous year despite the high repayment volumes of EUR 2.3 bil-lion. The LCR portfolio required for Basel III remains on the level of the previous year at roughly EUR 0.3 billion. The development of volumes and income reported here confirms the forecast made in the middle of 2014.
With assets of EUR 1.0 billion at the end of 2014, the reduction portfolio decreased, as planned, by another EUR 0.6 billion since the beginning of 2014.
The reclassification of a subportfolio to Oth-er items/Overhead produced slight shifts in
various items relative to their disclosure in the previous year.
EUR ’000s 2014 2013 Δ thousand Δ in %
Net interest income 27,701 34,632 -6,932 -20.0%
Risk provisions in the credit business 2,182 -8,612 10,794 -125.3%
Net commission income -878 -453 -425 93.9%
Gain/loss on fair value measurement 45,079 1,056 44,023 4,169.3%
Gain/loss on investments 911 -2,947 3,858 -130.9%
Administrative expenses -7,424 -10,485 3,062 -29.2%
Earnings before taxes 67,572 13,191 54,381 412.3%
Segment assets 3,746,522 4,285,141 -538,620 -12.6%

31
CORPORATE REPORT 2014 | GROUP MANAGEMENT REPORT
Net interest income in the amount of EUR 27.7 million was below the level of EUR 34.6 million in 2013. This is due, on the one hand, to the decreasing net interest in-come from the reduction portfolio but also the weaker disposition and maturity-trans-formation results that are hurt by the ongo-ing low interest rates.
Risk provisions in the lending business could be overcompensated by the release of provi-sions during the reporting period and amount-ed to EUR +2.2 million (2013: EUR -8.6 million).
Furthermore, net commission income fell by EUR -0.4 million to EUR -0.9 million, with the commission expenses for the securities and deposit business being the reason.
This stands in relation to the positive fair val-ue gains, which primarily result from interest swaps and amount to EUR 45.1 million. Inter-est derivatives concluded in the Treasury and Portfolio Management segment are primarily used for SaarLB’s interest book management. The significant deviation from the previous year results from the fair value effects distrib-uted across the segments for the first time, in particular the fair value effects from interest derivatives. In the previous year, these com-ponents were still reported in Other items/Overhead.
The gains/losses on investments mainly re-late to securities in the reduction portfolio and totalled EUR 0.9 million, which is signif-icantly above the amount of EUR -2.9 million in the previous year.
Administrative expenses of EUR -7.4 million were significantly below the level of the pre-vious year (EUR -10.5 million).
Segment assets declined as planned – due to the development of the reduction portfolio – and were at a level of EUR 3,747 million, down EUR -538 million in comparison to the dead-line in the previous year.
Landesbausparkasse Saar (LBS)
Privately used real estate was financed in close collaboration with the Saarland savings banks exclusively through the Landesbaus-parkasse Saar, which belongs to SaarLB.
As of 31 December 2014, the credit volume was EUR 0.7 billion higher than the level as of 31 December 2013. The rate of increase in the credit volume is thus around 11.0%.
The new business volume in home loan sav-ings deposits again increased substantially from the record 2013 financial year, by roughly 12.4%, and amounted to EUR 652 million.
EUR ’000s 2014 2013 Δ thousand Δ in %
Net interest income 17,998 17,237 761 4.4%
Risk provisions in the credit business -102 -95 -7 7.0%
Net commission income -3,056 -2,861 -196 6.8%
Administrative expenses -12,016 -10,958 -1,058 9.7%
Other income 379 560 -181 -32.4%
Earnings before taxes 3,203 3,884 -681 -17.5%
Segment assets 830,690 758,462 72,228 9.5%

32
Net interest income rose again from EUR 17.2 million in 2013 to EUR 18.0 million over the course of 2014. This development confirms the forecast made at midyear 2014.
The risk provisions in the home loan savings business showed a sideways trend in 2014, to-talling EUR -0.1 million (2013: EUR -0.1 million).
Commission income was heavily influenced by the brokerage business for savings banks and continued to follow the trend in 2013, reducing the segment’s income by roughly EUR -3.1 million (2013: -2.9 million). This in-crease is due to the very positive new busi-ness in the current financial year. In contrast, sustainable higher net interest income will be generated over the next few years. The
assumed forecast was also confirmed for this item.
Administrative expenses at Landesbaus-parkasse rose from EUR -11.0 million to EUR -12.0 million. The reasons for this were mainly the increase in personnel expenses as well as legal and audit costs relative to 2013.
The income at Landesbausparkasse as of 31 December 2014 was 17.5% below the amount in 2013 and reached EUR 3.2 million.
Segment assets at Landesbausparkasse in-creased by roughly 9.5%, from EUR 758 mil-lion to EUR 831 million.
FINANCIAL POSITIONThe financial position of SaarLB also contin-ued to be good in 2014. The inflow of liquidity due to the current refinancing structures has been secured for the next few years.
The mortgage cover in accordance with Sec-tion 28 PfandBG (German Pfandbrief Act) totalled EUR 704 million, slightly exceeding the amount from 2013 (EUR 698 million) by EUR 6 million. Greater usage of the cover funds for refinancing simultaneously led to a significant increase in the Pfandbriefe (cov-ered bonds) in circulation, so the cover was significantly lower in 2014 at roughly 69% than it was at the end of 2013 (roughly 105%) but still easily in line with the regulatory re-quirements.
The public sector cover funds in accordance with Section 28 PfandBG and the correspond-ing public sector Pfandbriefe in circulation continued to decrease due to maturities and ongoing new business. The total amount
of the cover funds fell moderately from EUR 1,797 million on 31 December 2013 to EUR 1,617 million on 31 December 2014. The cover is roughly 46% as of 31 December 2014, which is slightly below the amount at the end of 2013 (roughly 54%), but substantially above the regulatory requirements.
The situation on the capital market contin-ues to be stable as compared to financial year 2013, from the perspective of SaarLB. With almost EUR 989 million (2013: EUR 778 mil-lion), the placed volumes in 2014 are on a high level and occurred almost entirely as part of private placements with customers and finan-cial partners, as in past years. Roughly half of the funds received were from the network of savings banks and Landesbanks. Investor loy-alty therefore remains of central importance for SaarLB. As a result, SaarLB was largely in-dependent of capital markets in the current financial year 2014, as in 2013. In the process, SaarLB – similar to 2013 – also succeeded in
33
CORPORATE REPORT 2014 | GROUP MANAGEMENT REPORT
refinancing itself primarily via uncollateral-ised issuances with long maturities.
The development of refinancing conditions depends not only on the credit spread but also largely on the development of the swap and money market curve.
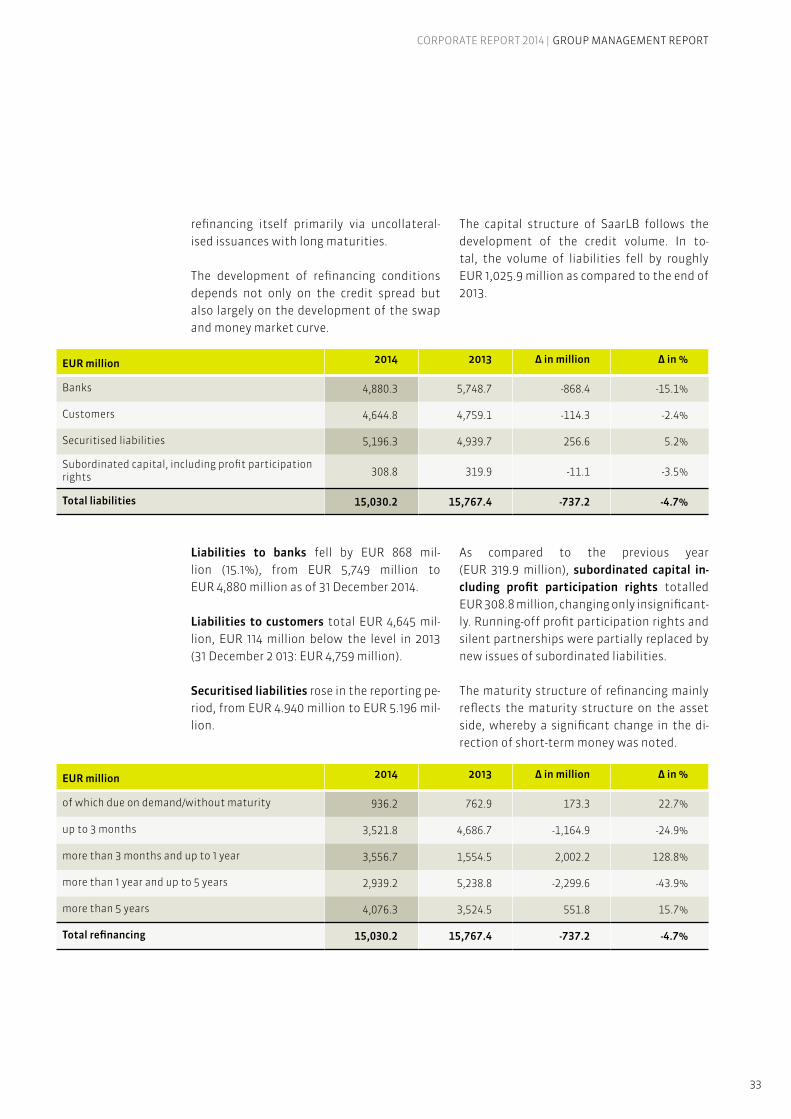
The capital structure of SaarLB follows the development of the credit volume. In to-tal, the volume of liabilities fell by roughly EUR 1,025.9 million as compared to the end of 2013.
Liabilities to banks fell by EUR 868 mil-lion (15.1%), from EUR 5,749 million to EUR 4,880 million as of 31 December 2014.
Liabilities to customers total EUR 4,645 mil-lion, EUR 114 million below the level in 2013 (31 December 2 013: EUR 4,759 million).
Securitised liabilities rose in the reporting pe-riod, from EUR 4.940 million to EUR 5.196 mil-lion.
As compared to the previous year (EUR 319.9 million), subordinated capital in-cluding profit participation rights totalled EUR 308.8 million, changing only insignificant-ly. Running-off profit participation rights and silent partnerships were partially replaced by new issues of subordinated liabilities.
The maturity structure of refinancing mainly reflects the maturity structure on the asset side, whereby a significant change in the di-rection of short-term money was noted.
EUR million 2014 2013 Δ in million Δ in %
Banks 4,880.3 5,748.7 -868.4 -15.1%
Customers 4,644.8 4,759.1 -114.3 -2.4%
Securitised liabilities 5,196.3 4,939.7 256.6 5.2%
Subordinated capital, including profit participation rights 308.8 319.9 -11.1 -3.5%
Total liabilities 15,030.2 15,767.4 -737.2 -4.7%
EUR million 2014 2013 Δ in million Δ in %
of which due on demand/without maturity 936.2 762.9 173.3 22.7%
up to 3 months 3,521.8 4,686.7 -1,164.9 -24.9%
more than 3 months and up to 1 year 3,556.7 1,554.5 2,002.2 128.8%
more than 1 year and up to 5 years 2,939.2 5,238.8 -2,299.6 -43.9%
more than 5 years 4,076.3 3,524.5 551.8 15.7%
Total refinancing 15,030.2 15,767.4 -737.2 -4.7%

34
Reported equity rose by EUR 162.6 million, from EUR 584.9 million at the end of 2013 to EUR 747.5 million. The change is mainly due to the increase in the subscribed capital and the reinvestment of profits from 2013, as well as an increase in new valuation reserves. The retained profit rose from EUR 27.2 million as of 31 December 2013 to EUR 52.7 million at the end of 2014.
Please refer to the “Risk report” section for an explanation of the regulatory capital re-quirements and the resulting regulatory key performance indicators.
Off-balance sheet liabilities of SaarLB are primarily affected by irrevocable credit com-mitments and contingent liabilities. With a total volume of EUR 807.6 million as of 31 De-cember 2014, these liabilities are of only in-significant importance for an assessment of the financial position, as in the previous year (EUR 961.7 million).
In the past financial year, as in 2013, there were not committed credit lines for the ben-efit of SaarLB.
In order to ensure solvency at all times, SaarLB deposited securities amounting to roughly EUR 1,161 million at the Bundesbank, as in 2013 (EUR 1,024 million). Payment obliga-tions could therefore be met independently of other sources of refinancing.
Please refer to the “Risk report” for an expla-nation of the liquidity management.
Due to SaarLB’s business activity focused on Germany and France, the portion of the hedge for net positions in foreign currencies is insig-nificant. Both the new awarding of loans and the corresponding refinancing take place pri-marily in EUR. Still existing foreign currency portfolios are primarily assigned to the reduc-tion portfolio.
The use of derivative financial instruments is overwhelmingly to hedge the Bank’s own in-terest rate risk as part of asset/liability man-agement. The nominal volume rose moderate-ly, by EUR 624 million, to EUR 16,429 million (2013: EUR 15,805 million). Roughly 95% of this relates to interest swaps.
SaarLB’s ability to meet its payment obliga-tions was ensured at all times in the financial year.
SaarLB’s access to money and capital markets is supported by the credit ratings of two in-ternational rating agencies. Fitch lowered the outlook for the long-term rating to negative in April 2014. This step was justified by a forth-coming change in the method for valuing the support rating as a result of the change in the EU rules on “bail-ins”. The viability rating that reflects the internal financial strength of the Bank was confirmed by Fitch at its current lev-el in June 2014.
Rating Moody’s Fitch Ratings
Long-term rating (uncollateralised)
with government liability Aa1 AAA
without government liability A3 A
Outlook Negative Negative
Short-term rating (uncollateralised) P-2 F1
Financial strength/viability rating D bb+

35
CORPORATE REPORT 2014 | GROUP MANAGEMENT REPORT
In summary, the business performance in 2014 was positive overall, but in particular the net interest income was hurt by the on-going low interest phase and remained below the Bank’s expectations. The development of
SaarLB’s loan-driven core business segments and refinancing options was overall in line with the Bank’s expectations, however.
ASSETSThe SaarLB Group’s total assets fell by 2.6% to EUR 16,512 million as of 31 December 2014 (as compared to EUR 16,959 million as of 31 De-cember 2013).
The decline mainly resulted from a reduction in the portfolio of financial assets. The credit volume of the SaarLB Group – similar to to-tal assets – continued to fall, by 2.1%, from EUR 16,814 million to EUR 16,466 million in 2014.
Loans and advances to banks increased since the end of 2013 by roughly EUR 305 million to EUR 2,327 million on 31 December 2014.
Financial assets declined in the reporting pe-riod, from EUR 4,398 million to EUR 3,674 mil-lion (-16.5%). The reasons for this include re-payments of money market securities, but also loans and debt securities, e.g., from in-vestments in international corporates that do not belong to the core business. The shares of companies valued at-equity did not change in comparison to the previous year (2013: EUR 6 million).
Securities repurchase transactions total roughly EUR 662 million as of 31 Decem-ber 2014, on the level as of 31 December 2013.
The development of loans and advances to customers, which is largely influenced by the Bank’s core business segments, remained stable at EUR 8,989 million as of 31 Decem-ber 2014 (2013: EUR 8,797 million).
Contingent liabilities totalled EUR 229 mil-lion as of 31 December 2014, slightly below the level in 2013 (31 December 2013: EUR 322 mil-lion), while irrevocable credit commitments declined slightly to EUR 579 million (31 De-cember 2013: EUR 640 million).
EUR million 2014 2013 Δ in million Δ in %
Loans and advances to banks 2,327 2,022 305 15.1%
Investments 3,674 4,398 -724 -16.5%
Securities repurchase transactions 662 629 33 5.2%
Interests in entities valued at equity 6 6 0 -1.7%
Loans and advances to customers 8,989 8,797 192 2.2%
Contingent liabilities 229 322 -93 -28.9%
Irrevocable credit commitments 579 640 -61 -9.6%
Total credit volume 16,466 16,814 -348 -2.1%

36
SUPPLEMENTARY REPORTThere have been no events of special signifi-cance since the end of the year under review.
RISK REPORTRISK MANAGEMENT AND MONITORING PRINCIPLES
SaarLB manages and monitors its risks on the basis of uniform principles. Management of subsidiaries and companies valued at equity takes place as part of investment controlling.
The key risk management and monitoring principles are laid down in SaarLB’s risk strat-egy. In accordance with the business strategy, the Board of Management lays down the pol-icy for dealing with counterparty risk (coun-terparty default risks and credit spread risks), market price risk, liquidity risk, operational risk, real estate risk, strategic risks / business risks and reputation risks, which are the key risk types for SaarLB. It is responsible for and monitors the implementation of these guide-lines.
Generating a reasonable and sustainable return after allowing for risk is the ultimate aim of all SaarLB’s business activities. Risks may only be entered into to the extent per-mitted by SaarLB’s risk-bearing capacity. The risk management system fundamentally does not take into account either diversification effects between risk types or (income) oppor-tunities.
Suitable limits for the key risk types have therefore been set and appropriate proce-dures for identifying, measuring and monitor-ing them defined as part of the risk strategy. The risks of the Bank and the relevant subsid-iaries (incl. LBS, the securities special funds) are measured and controlled in an integrated way.
The tasks, competencies and responsibilities of the staff involved are based on clearly de-fined organisational structures and process-es. Organisational structures take account of the regulatory requirements under the Min-imum Requirements for Risk Management (MaRisk) and the Capital Requirements Reg-ulation (CRR) on the division of functions be-tween Sales and Trading (business segments) on the one hand and Risk Office, Settlement and Risk Controlling on the other.
While business areas are based around SaarLB’s business model, core competencies have been combined in the organisation of the Risk Office and Settlement.
Global Risk Management is in charge of risk controlling of all risk types at the portfolio level. Risk Office is responsible for managing and monitoring counterparty risk at the indi-vidual exposure and sub-portfolio level. This involves integrated risk reporting of all risk types as part of a joint MaRisk risk report.
Internal Audit reports directly to the Board of Management and is answerable to its Chair-man. It is an independent internal division that audits and assesses, on the basis of a risk-oriented audit approach, all activities and processes within SaarLB, including the inter-nal control system and risk management and controlling. This also applies for outsourced activities and processes. Internal Audit acts in accordance with legal and regulatory re-quirements such as KWG [German Banking Act], MaRisk [Minimum Requirements for Risk Management].
CAPITAL MANAGEMENT
The regulatory requirements set out in the Capital Requirements Regulation (CRR) are key for SaarLB when assessing and managing capital adequacy as well as maintaining eco-nomic risk-bearing capacity.

37
CORPORATE REPORT 2014 | GROUP MANAGEMENT REPORT
REGULATORY CAPITAL
SaarLB has applied the relevant rules on cal-culating capital requirements under the Capi-tal Requirements Regulation (CRR; until 2013: German Solvency Ordinance/SolvV) since ob-taining approval from the German Federal Fi-nancial Supervisory Authority (BaFin) to use the Internal Ratings Based Approach (IRBA) on 1 January 2007.
Regulatory capital – i.e. equity – comprises eq-uity tier 1 (essentially nominal capital, silent partner contributions and reserves, including the reserves under Section 340 g of the Com-mercial Code) plus supplementary capital (essentially profit participation rights and long-term subordinated liabilities) after de-ductible items.
The key performance indicators for common equity tier 1, equity tier 1 and total equity – the ratio of the respective equity components as a percentage of the risk positions calculat-ed in accordance with the requirements of the Capital Requirements Regulation (CRR) – may not fall below the minimum regulatory
amounts. In its internal controlling, SaarLB also set additional requirements.
The requirements are constantly met by means of medium-term planning over a five-year timeframe. The Corporate Development segment is responsible for the strategic plan-ning process. On the basis of the economic conditions determined in this process, each business area performs its own risk exposure planning for this time period. Their figures are then collated at Group level by Profit Con-trolling – the department in charge of the quantitative aspects of medium-term plan-ning – and compared with the equity available in the planning period. Finally, the measures needed to procure capital or scale back pro-posed business area budgeting are defined to ensure the targets are met.
An overview of the key CRR data as of the bal-ance sheet date of 31 December 2013 and the previous year’s corresponding figures (in ac-cordance with the SolvV) are provided below. SaarLB has not prepared regulatory group re-ports since the middle of 2011. To this extent, the figures only include the individual bank.
Both the equity tier 1 ratio and the total equi-ty ratio of SaarLB increased noticeably during
the reporting period, while the risk assets re-mained at the same level.
Key performance indicators in accordance with CRR (2014) and SolvV (2013) (in EUR million or in %) 31/12/2014 31/12/2013
Risk exposure (EUR million) 6,888 6,904
Equity 878 832
of which: equity tier 1 847 809
of which: common equity tier 1* 621 ---
Total equity ratio 12.8% 12.1%
Equity tier 1 ratio 12.3% 11.7%
Common equity tier 1 ratio* 9.0% ---
* The common equity tier 1 and the common equity tier 1 ratio have only been determined since the Capital Requirements Regulation (CRR) entered into force in 2014.

38
• The positive effect with regard to the equity tier 1 ratio results from (1) replen-ishing the 340g HGB reserves on the ba-sis of the findings in the 2013 financial statements (roughly EUR 27 million) and (2) the decline in the reduction item for investments of roughly EUR 10 million.
• Total equity rose by roughly EUR 8 million on account of the lower value adjustment shortfalls.
SaarLB complied with the minimum regula-tory ratio during the entire reporting period at all times as well as its stricter target ra-tios. The good overall capital adequacy ratios were also reflected in the results of the re-quired regulatory stress tests (in accordance with the CRR): based on the assumption of economic weakness, the equity ratio at the Group level was 10.9% on the reporting date (31 Dec 2013: 10.2%), the equity tier 1 ratio was 10.5% (31 Dec. 2013: 10.0%) and the common equity tier 1 ratio was 7.7%.
ECONOMIC CAPITAL (RISK BEARING CAPACITY)
The core aim of SaarLB’s risk management, aside from complying with regulatory capital requirements, is to ensure that the economic risk-bearing capacity, which is the difference between risk capital (risk cover funds) and risk capital needed, is adequate.
Risk cover funds were fundamentally deter-mined on the basis of IFRS accounting and indicate the maximum actual level of unex-pected losses from risks entered into that can be borne:1
Components of the available cover funds (EUR million) 31/12/2014 31/12/2013 Delta
Results after taxes (minimum YTD and proj.) 51.4 36.0 +15.4
+ nominal capital 250.1 150.1 +100.0
+ capital reserves 69.1 69.1 -
+ retained earnings 238.2 203.8 +34.4
+ undated silent partner contributions 24.5 124.5 -100.0
+ dated silent partner contributions 218.6 218.6 -
+ profit participation rights 0.0 8.5 -8.5
+ subordinated liabilities 25.5 124.0 -98.5
+ revaluation reserve 72.6 41.9 +30.7
Risk cover funds 950.0 976.5 -26.5
less intangibles 4.0 4.0 -
less balance of hidden charges and silent reserves from securities (LaR and HtM) -5.7 2.6 -8.3
less corrections in equity due to the surplus of deferred taxes -17.8 -12.3 -5.5
Liquidation cover funds +969.5 +982.2 -12.7
less losses from non-performing positions 18.5 17.8 +0.7
less anticipated losses from the risk assessment horizon 35.5 35.2 +0.3
Available cover funds +915.4 +929.2 -13.7
1 On account of the one-year analysis period, the equity items as of the reporting deadline are not reported in the risk cover funds, but rather the figures one year after the reporting deadline are recognised (if need be, reduced by maturities in the period under consideration).

39
CORPORATE REPORT 2014 | GROUP MANAGEMENT REPORT
The risk cover funds fell in comparison to the previous year, primarily due to subordinated liabilities, which will fall due, before the end of the one-year assessment horizon, in the 4th quarter of 2015, and are partially com-pensated by the positive development in earnings after taxes, profit reserves and the revaluation reserve. The conversion of silent reserves in the amount of EUR 100 million (contract of 27 October 2014) led to a change in the structure of the risk cover funds as of 31 December 2014, but the absolute amount remained unchanged despite this measure.
The available cover funds result from the risk cover funds due to the reductive considera-tion of other effects:
• In the liquidity cover funds, elements from the cover funds are corrected if it would be necessary to net them differ-ently in the case of a liquidation.
• Buffers for possible reductions in the risk cover funds are deducted over a one-year assessment horizon, which will not be
explicitly considered in the future model-ling of the economic risk bearing capacity calculation.
As part of economic risk capital management, SaarLB monitors its risk profile and ensures its risk-bearing capacity is always adequate by comparing each month the risk capital al-located to the available cover funds and risk capital needed. Risk capital needed is deter-mined by analysing all significant risk types in a consistent manner. The risks from across the Group are collated into an overall assessment of the risk existing. In ICAAP, the value at risk (VaR) method based on a confidence level of 99.95% is used to determine risk capital need-ed. The limiting takes place on the level of the individual risk types and collectively through the (total) allocated risk capital. The assump-tions and results of risk quantification are val-idated at least annually.
The ICAAP risk-bearing capacity as of the re-porting date is illustrated in the following overview:2
2 The risk of unanticipated behaviour by home loan savers has not been classified as a significant risk since 1 January 2014 and is no longer considered in the risk-bearing capacity calculation. For reputation risks, a capital requirement of zero has been determined on the basis of the current liquidity preview.
Economic risk bearing capacity: Capital requirement and cover funds (EUR million)
31/12/2014 31/12/2013
Capital needed
Limit Range Capital needed
Limit Range
Counterparty risk 217.6 315.0 69% 268.6 420.0 64%
of which default risk (136.6) (180.0) 76% (139.9) (180.0) 78%
of which credit spread risks (81.0) (135.0) 60% (128.7) (240.0) 54%
Market risk 45.9 90.0 51% 48.0 90.0 53%
Operational risk 6.8 10.0 68% 6.8 10.0 68%
Reputation risk 0.0 2.0 0% 0.0 2.0 0%
Unexp. behaviour by home loan savers - - - 0.7 3.0 23%
Real estate risk 13.1 15.0 87% 12.6 15.0 84%
Strategic risk/business risk 76.0 90.0 84% 76.6 90.0 85%
Total 359.4 522.0 69% 413.3 630.0 66%
Available cover funds 915.4 929.2
Free econ. cover funds 556.1 515.9

40
SaarLB’s risk bearing capacity was ensured at all times without limitations throughout the reporting period (both in total and on the lev-el of individual types of risk).
Besides the ICAAP risk capital needed, the risk capital needed in multiple scenarios, was cal-culated among others in the case of serious
economic weakness modelled across all risk types under consistent assumptions. With regard to counterparty risks, a sector-specific deterioration of the credit portfolio and a fur-ther increase in credit spreads are assumed, and for all other types of risk, more stringent assumptions also apply.
The need for capital fell significantly in the reporting period, primarily due to the coun-terparty risk: The modelling of credit spread risks now takes place on the basis of a more precise model that shows a lower need for capital. Risks of default fell on account of the declines in the need for capital for significant clumps of risks (repayments and/or rating im-provements). At the same time, the available economic cover funds increased noticeably. Overall, the available economic cover funds also continue to exceed the capital needs under the assumption of a serious economic downturn as of the reporting date.
COUNTERPARTY RISK (CREDIT RISK)
Under counterparty risk (credit risk), SaarLB combines counterparty default risk and credit spread risks. SaarLB defines counterparty de-fault risk as the risk that the credit quality of a business partner will deteriorate to such an extent that it is unable to meet its payment or contractual obligations towards the Bank either in full and/or on time. Counterparty default risk traditionally covers credit risk but also includes issuer risk, borrower risk, country risk and investment risk. Other coun-terparty risks (credit spread risks) result for SaarLB from credit-related changes in prices for the securities portfolio (incl. credit deriv-atives and securitisations).
Serious economic weakness: Capital requirement and cover funds (EUR million)
31/12/2014 31/12/2013
Counterparty risk 214.3 291.4
of which default risk (140.0) (174.3)
of which credit spread risks (74.3) (117.1)
Market risk 41.3 27.8
Operational risk 3.4 3.4
Reputation risk 0.0 0.0
Unexp. behaviour by home loan savers 0.0 0.2
Real estate risk 10.1 9.6
Strategic risk/business risk 40.0 40.3
Total 309.1 372.8
Free econ. cover funds 556.1 515.9
Free econ. cover funds with stress 247.0 143.2

41
CORPORATE REPORT 2014 | GROUP MANAGEMENT REPORT
The risk strategy sets out the framework for taking on counterparty default risks. A limit on them, calculated from the risk-bearing ca-pacity, is then set in the annual strategy pro-cess. To manage and monitor concentration risks, limits are also imposed according to the credit rating of borrowers, transactions, geo-graphical markets and sectors.
The entire credit business chain, including management and monitoring systems, is de-scribed in detail in the SaarLB instructions. The master processes defined here apply Bank-wide and are implemented uniformly in all Risk Office areas. The instructions are con-stantly updated to take account of changing internal and external requirements.
Counterparty default risk is initially assessed at individual borrower and (regulatory) bor-rower unit level (groups of included custom-ers), using the rating procedures of Rating Ser-vice Unit GmbH & Co. KG, Munich, for banks, corporates (including municipally-owned companies), international public authorities, leasing entities (leasing companies and real estate leasing SPVs), insurers, international commercial real estate, project financing and country and transfer risk, and the DSGV liabil-ity association of the RSU Rating Service Unit GmbH & Co. KG, Munich. These procedures are backed up by the savings banks stand-ard rating and the savings bank real estate rating modules from Sparkassen Rating und Risikosysteme GmbH, Berlin. All these rating procedures have been approved by the Ger-man Federal Financial Supervisory Authority (BaFin) for use within the Internal Ratings Based Approach (IRBA) to calculate capital re-quirements in accordance with the Solvency Ordinance. They are validated annually by the Bank in cooperation with these partners on the basis of the current credit portfolio.
Significant input parameters for the quanti-tative part of the credit rating analysis per-formed in the rating process come from a bal-ance sheet analysis system, which supports
the major accounting standards (among oth-ers HGB, IFRS, US-GAAP) and facilitates peer groups and industry comparisons. In addition to borrowers’ credit ratings, the risk assess-ment also takes into account, where required, property and project risks as well as country and transfer risks. Finally, borrowers are allo-cated to a specific rating category on a 25-tier rating scale based on the probability of de-fault. Rating categories are therefore compa-rable regardless of the rating procedure used.
In accordance with SaarLB’s requirements, standard forms of bank collateral – particular-ly mortgage liens, pledges, assignments, chat-tel mortgages, and debt undertakings – are accepted by the Bank to reduce risks. Collater-al is processed and valued in accordance with the Collateral Manual. The procedure used to calculate and determine collateral value must be clearly documented. In the case of deriva-tives trading, master agreements are conclud-ed for the purpose of close-out netting. Collat-eral agreements have been made with certain business partners limiting the risk of default in each case to an agreed maximum.
Exposures that may be at risk are identified using an appropriately constructed early warning system – for example, by means of annually revised ratings – and transferred for intensive support. As with problem loan han-dling, this falls within the remit of the Risk Office.
Counterparty default risks from trading are monitored daily by Settlement to take ac-count of MaRisk. In particular, all derivatives business is monitored (counterparty risk). All trading business conducted with each customer is counted towards the borrower limits – including settlement limit – set for that specific customer in a system-supported and uniform Bank-wide process in accordance with the requirements on market valuation methods under the Capital Requirements Regulation (CRR).

42
The internal rating is key for managing and monitoring counterparty default risks at the overall Bank level; collateral is currently taken into account only at individual exposure level as part of reaching decisions. In particular for the calculation of the capital adequacy under the Capital Requirements Regulation (CRR), collateral (through the credit risk mitigation techniques) is largely not taken into account. Gross exposure limits for borrower units based on rating categories, markets and cus-tomer types derived from the business strat-egy are clearly defined in the risk strategy. In addition, to strengthen individual sector portfolios, only selected new business may be conducted in the risk sectors identified by the Bank. A strict ancillary condition requires risk-oriented pricing supported by a suitable calculation tool.
The relevant Sales and Risk Office areas mon-itor each individual credit decision to ensure compliance with the risk strategy.
The quarterly MaRisk risk report for the Board of Management and the SaarLB Risk Commit-tee contains both an analysis of the credit portfolio – particularly in relation to rating categories, sectors and countries – as well as a summary target/actual comparison with the risk strategy.
SaarLB uses the CreditRisk+ credit portfolio model – particularly in calculating risk-bear-ing capacity – to analyse risks at the portfo-lio level. The credit portfolio model takes ac-count of SaarLB’s entire receivables portfolio exposed to counterparty default risk, weight-ed by the specific probability of default for each borrower derived from the rating cat-egories. A key variable is credit value at risk, which breaks down into expected loss – which is taken into account through the risk-orient-ed pricing – and an unexpected loss. Both the expected and unexpected loss must be cov-ered by risk capital in the risk-bearing capac-ity calculation.

43
CORPORATE REPORT 2014 | GROUP MANAGEMENT REPORT
PORTFOLIO ANALYSIS (ECONOMIC)
The presentation in the following chapters “Portfolio analysis (economic)” and “Sub-port-folios with increased risk profile” is based on the internal risk management (management approach) according to which there was a maximum credit risk of EUR 17,913 million (31 Dec. 2013: EUR 18,345 million). Minor devi-ations from the balance sheet approach (see
chapter “Portfolio analysis (balance sheet)” are due, among others, to consideration giv-en to add-ons in the determination of the credit risk of derivative financial instruments according to the market valuation method, counterparty risks from securities repurchase transactions and the recognition of credit de-rivatives at nominal values.
Around 83% of credit risk is in the investment grade bracket (rating categories 1 to 5 ac-cording to the DSGV scale), representing an increase of around 2 percentage points year-on-year.
SaarLB uses a value-added and risk-orien-tated grouping code on the borrower level for the purposes of economic management and strategic alignment of the sector credit risk, breaking down credit risk into 32 sector groups. Credit risk by sector groups (not in-cluding the separately reported Bank sector, whose share of the total credit risk in the re-porting period fell from 38% to 37%) breaks down as follows:
Max. credit risk by rating category (EUR million)
12,000
10,000
8,000
6,000
4,000
2,000
01 2 - 5 6 - 12 13 - 15 16 - 18
31/12/2013 31/12/2014
10,3
38
4,35
1
3,39
0
105
162
9,86
0
4,98
5
2,73
5
168
166

44
SaarLB’s sector portfolio – particularly the corporates portfolio – continues to be well-di-versified. Real estate, the largest individual sector (besides banks), comprises roughly 15% of the total credit risk (including banks) and fell slightly from 2013 (16%).
The credit risk in the Banks sector (not in-cluded in the chart) fell substantially, by EUR 383 million, in the year under review as it did in the Real Estate sector (by EUR 233 mil-lion). The credit risk in the target sector of Renewable Energies again increased by EUR 119 million.
Max. credit risk by region (EUR million)
12,000
10,000
8,000
6,000
4,000
2,000
0
Germany France Rest of Europe North America Other
31/12/2013 31/12/2014
11,1
44
10,9
07
4,76
5
4,84
7
2,02
3
1,87
2
341
196
72 92
Maximum credit risk for customers by sector (EUR million)
3,500
3,000
2,500
2,000
1,500
1,000
500
0
Real Estate Sovereigns Renewable energy Utilities Automotive Construc-
tion Steel Wholesale +retail trade
Food +beverages ABS Retail custo-
mersOther
sectors
31/12/2013 31/12/2014
2,99
52,
762
2,36
92,
359
1,95
72,
077
393
405
207
284 36
129
6
276
241
210
237 28
527
6
48 39
596
649
1,63
01,
654

45
CORPORATE REPORT 2014 | GROUP MANAGEMENT REPORT
SaarLB uses the official Bundesbank codes to give a breakdown of its credit risk in a uniform manner for each individual country. Borrowers are encoded according to the re-spective authoritative country risk, which, for example, in the case of dependent branches does not necessarily correspond to the coun-try in which they are based. Regions are then grouped on the basis of global and regional links. The focus of SaarLB’s country portfo-lio is in its defined target markets of Germa-ny and France, which account for a share of around 88% (as of 31 Dec. 2013: 87%) of the
credit risk. Another 10% (as of 31 Dec. 2013: 11%) concerns exposure in the rest of Europe, whereby the credit risks in Ireland and in the southern European countries of Greece, It-aly, Spain and Portugal amount to a total of EUR 231 million (as of 31 Dec. 2013: EUR 352 mil-lion), of which 53% is investment grade (as of 31 Dec. 2013: 45%). In the reporting period, the volume of French business was again expand-ed by EUR 82 million (2013: EUR 295 million), while the credit risk in Germany (primarily with banks) and outside of the target markets fell significantly.
The loans and advances to banks – including the credit substitute securities portfolio re-ported under investments on the balance sheet – are predominantly to banks head-quartered in Europe, mostly in Germany. Across all regions, the bank credit risk fell by
a total of EUR 383 million in the reporting period, in absolute terms most substantially in Germany where it fell by EUR 179 million, and as a percentage in North America where it dropped by -48%.
Banks: Maximum credit risk (EUR million)Regions
31/12/2014 31/12/2013
Germany 5,000 5,178
France 415 484
Rest of Europe 1,068 1,155
North America 74 144
Other 77 56
Total 6,635 7,017
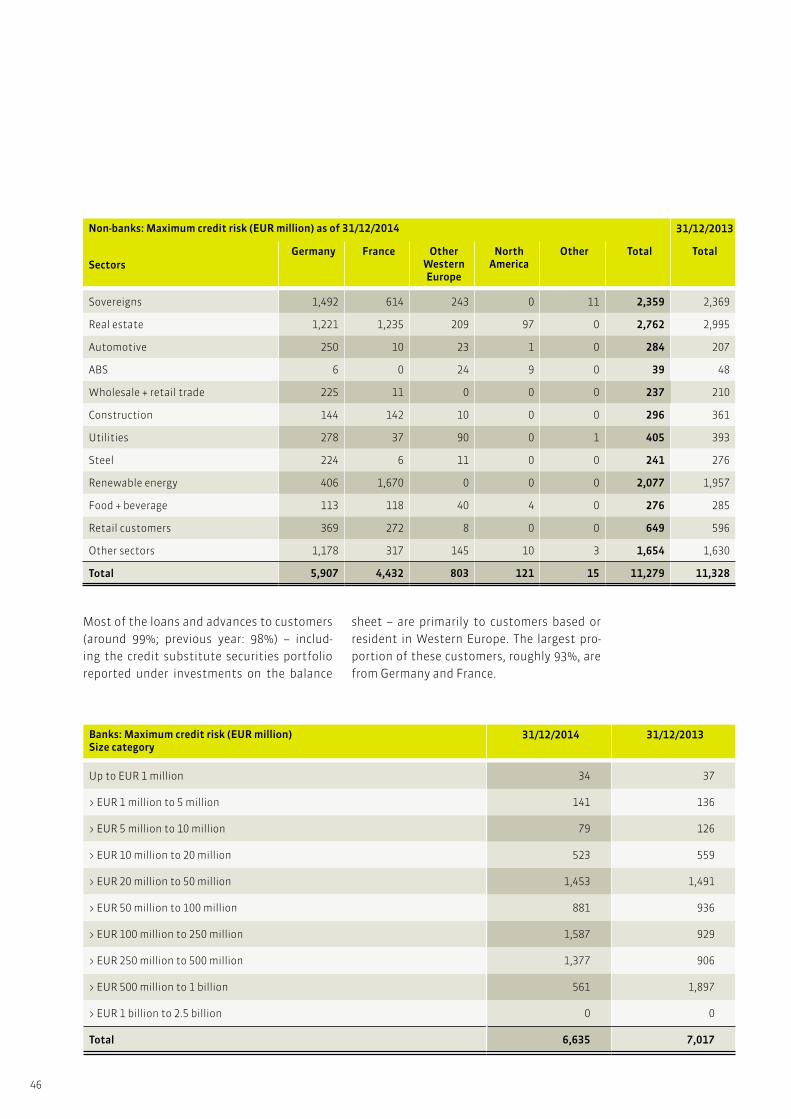
46
Most of the loans and advances to customers (around 99%; previous year: 98%) – includ-ing the credit substitute securities portfolio reported under investments on the balance
sheet – are primarily to customers based or resident in Western Europe. The largest pro-portion of these customers, roughly 93%, are from Germany and France.
Banks: Maximum credit risk (EUR million)Size category
31/12/2014 31/12/2013
Up to EUR 1 million 34 37
> EUR 1 million to 5 million 141 136
> EUR 5 million to 10 million 79 126
> EUR 10 million to 20 million 523 559
> EUR 20 million to 50 million 1,453 1,491
> EUR 50 million to 100 million 881 936
> EUR 100 million to 250 million 1,587 929
> EUR 250 million to 500 million 1,377 906
> EUR 500 million to 1 billion 561 1,897
> EUR 1 billion to 2.5 billion 0 0
Total 6,635 7,017
Non-banks: Maximum credit risk (EUR million) as of 31/12/2014 31/12/2013
SectorsGermany France Other
Western Europe
North America
Other Total Total
Sovereigns 1,492 614 243 0 11 2,359 2,369
Real estate 1,221 1,235 209 97 0 2,762 2,995
Automotive 250 10 23 1 0 284 207
ABS 6 0 24 9 0 39 48
Wholesale + retail trade 225 11 0 0 0 237 210
Construction 144 142 10 0 0 296 361
Utilities 278 37 90 0 1 405 393
Steel 224 6 11 0 0 241 276
Renewable energy 406 1,670 0 0 0 2,077 1,957
Food + beverage 113 118 40 4 0 276 285
Retail customers 369 272 8 0 0 649 596
Other sectors 1,178 317 145 10 3 1,654 1,630
Total 5,907 4,432 803 121 15 11,279 11,328
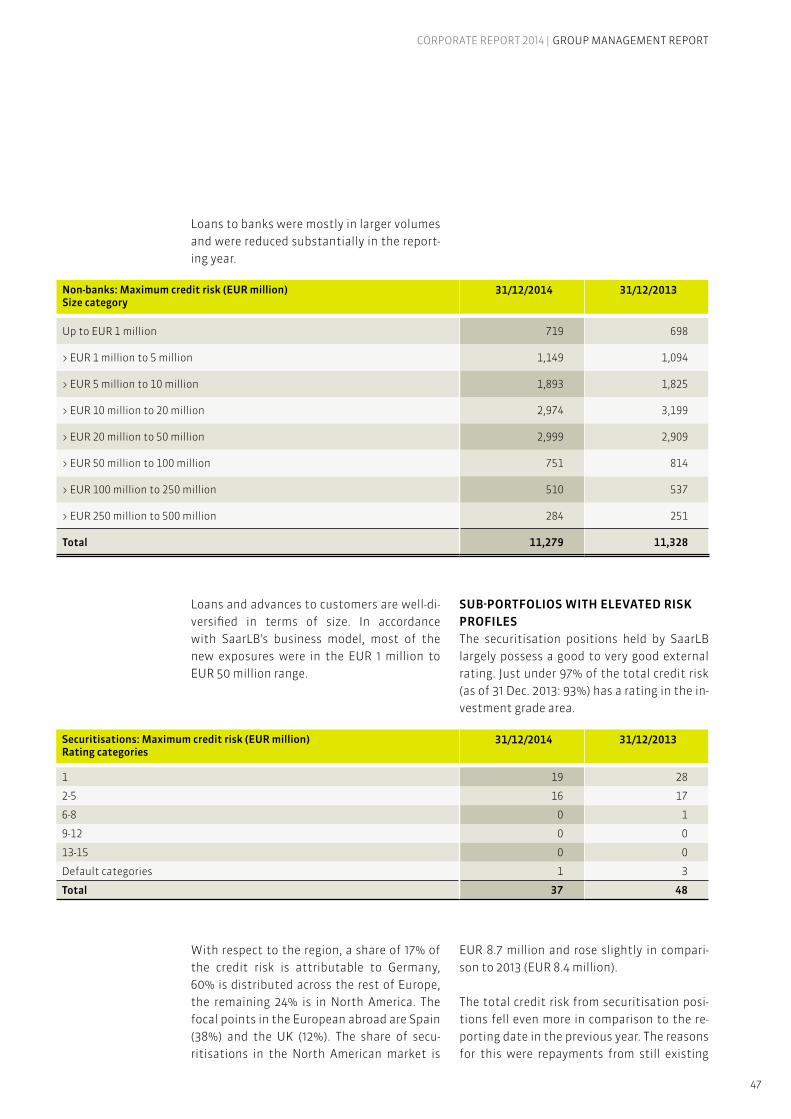
47
CORPORATE REPORT 2014 | GROUP MANAGEMENT REPORT
Loans to banks were mostly in larger volumes and were reduced substantially in the report-ing year.
Loans and advances to customers are well-di-versified in terms of size. In accordance with SaarLB’s business model, most of the new exposures were in the EUR 1 million to EUR 50 million range.
SUB-PORTFOLIOS WITH ELEVATED RISK PROFILESThe securitisation positions held by SaarLB largely possess a good to very good external rating. Just under 97% of the total credit risk (as of 31 Dec. 2013: 93%) has a rating in the in-vestment grade area.
With respect to the region, a share of 17% of the credit risk is attributable to Germany, 60% is distributed across the rest of Europe, the remaining 24% is in North America. The focal points in the European abroad are Spain (38%) and the UK (12%). The share of secu-ritisations in the North American market is
EUR 8.7 million and rose slightly in compari-son to 2013 (EUR 8.4 million).
The total credit risk from securitisation posi-tions fell even more in comparison to the re-porting date in the previous year. The reasons for this were repayments from still existing
Non-banks: Maximum credit risk (EUR million) Size category
31/12/2014 31/12/2013
Up to EUR 1 million 719 698
> EUR 1 million to 5 million 1,149 1,094
> EUR 5 million to 10 million 1,893 1,825
> EUR 10 million to 20 million 2,974 3,199
> EUR 20 million to 50 million 2,999 2,909
> EUR 50 million to 100 million 751 814
> EUR 100 million to 250 million 510 537
> EUR 250 million to 500 million 284 251
Total 11,279 11,328
Securitisations: Maximum credit risk (EUR million)Rating categories
31/12/2014 31/12/2013
1 19 28
2-5 16 17
6-8 0 1
9-12 0 0
13-15 0 0
Default categories 1 3
Total 37 48

48
exposures (roughly EUR 7.1 million), sales (roughly EUR 3.6 million) and repayments (roughly EUR 0.6 million). These figures take into account a positive currency effect of EUR 2.8 million. New business was not con-cluded in the reporting year and also will not be concluded in the future under SaarLB’s business and risk strategy. The securitisation portfolio resulted in a charge to the revalua-tion reserve of roughly EUR 2.4 million as of the reporting deadline (as of 31 Dec. 2013:
EUR 2.5 million). Furthermore, the 2008 re-classification to the category of Loans and Receivables (LaR) avoided another charge to the revaluation reserve of EUR 1.1 million (as of 31 Dec. 2013: EUR 2.7 million).
On account of the sovereign debt crisis in the eurozone, exposure in Portugal, Ireland, Italy, Greece and Spain (“PIIGS” countries) are cur-rently being monitored very carefully.
The credit portfolio continued to fall in the reporting period. The maximum credit risk was 53% in the investment grade as of the
reporting deadline (as of 31 Dec. 2013: 45%) (rating grades 1-5 according to DSGV scale).
SaarLB has exposure with a maximum credit risk of roughly EUR 29 million to sovereigns in the PIIGS countries as of the reporting date (31 Dec. 2013: EUR 70 million). The majority of this is in Italy (43%), the rest in Spain (38%). Portugal has a share of 13%, Ireland 6% and Greece 0%. Impairments were not taken into account on the reporting date.
RISK PROVISIONS
As part of risk monitoring, all exposures with counterparty default risk are subject to a set “early warning, intensive care and problem loan handling process” and the relevant in-structions and policies. Within this process, exposures with warning signals are trans-ferred to the appropriate type of support ade-quate for the risk content and classified.
PIIGS exposureMaximum credit risk (EUR million)Country
31/12/2014 31/12/2013
Spain 95 146
Italy 118 168
Portugal 12 35
Ireland 6 2
Greece 0 0
Total exposure 231 352
PIIGS exposureMaximum credit risk (EUR million)Sectors
31/12/2014 31/12/2013
Banks 100 199
ABS 20 24
Real estate 22 25
Sovereigns 29 70
Rest 60 34
Total exposure 231 352

49
CORPORATE REPORT 2014 | GROUP MANAGEMENT REPORT
This is based on objective indicators pointing to impairment of the exposure. These include:
• clear deterioration of financial circum-stances
• expectation of lower future payment streams than those agreed
• credit-rating-induced interruptions in per-formance
• concessions to the borrower for economic or legal reasons in connection with finan-cial difficulties
• significant breaches of contract such as, e.g., an application for postponement
• high probability of insolvency proceedings or other restructuring of the borrower
• disappearance of an active market for this financial asset due to financial difficulties
• significant or ongoing decline in the fair value below the acquisition cost
When the risk analysis shows that the contractual repayment or collection of all contractual compensation for credit is im-probable, a risk provision is established. The calculation of the risk provision is made for each business and considers all counterpar-ty default risks. The amount of the impair-ment is fundamentally determined by the difference between the carrying value of the receivables and the anticipated future cash flows, which are discounted with the original effective interest rate. Specific risk provisions are also established for exposures if complete repayment of loans is improbable due entirely to country risks.
When establishing risk provisions, a distinc-tion is made between specific risk provisions for existing receivables and provisions for future drawdowns (provisions for non-bal-ance sheet business in the credit business). Irrecoverable financial instruments are derecognised. With receivables, this normal-ly involves utilising specific risk provisions. Defaults for which no or insufficient specific provisions have been created were charged to current portfolio risk provisions.
Portfolio risk provisions are established for financial instruments that are recognised at amortised cost and for which no impair-ment has been identified. These include ex-posures where objective indications as listed above did exist for an impairment but, after subsequent examination, were not rated as impaired. When establishing portfolio risk provisions, it needs to be ensured that impair-ments not individually identified are taken into account. They are used to cover risks that have occurred, but are not yet individually assignable. The portfolio risk provisions are calculated using CRR parameters and under consideration of the loss identification period (LIP) for portfolios with the same risks.
Adequate provision was made for any poten-tial losses detected as part of risk monitor-ing in the reporting year. The changes in risk provisions for individual risks in the SaarLB Group (including the Landesbausparkasse and the country risk provisions and general provisions) were as follows:
Risk provisions for individual risksEUR million
1 January 2014 – 31 December 2014
1 January 2013 – 31 December 2013
Start level 121.7 147.1
Release -8.8 -14.5
Unwindings -2.5 -3.5
Utilisations -9.8 -46.5
Additions 24.5 39.0
End level 125.1 121.7

50
The following table shows this maximum credit risk, broken down by (a) financial as-sets that are neither past due nor impaired, (b) financial assets that are past due, but not impaired and (c) financial assets that are im-paired.
Direct write-downs due to credit ratings to-talled EUR 0.1 million (in financial year 2013: EUR 2.7 million). For risks in the credit busi-ness that have occurred, but cannot yet be individually assigned, including financial as-sets measured at amortised cost, there were portfolio risk provisions of EUR 18.1 million (as of 31 Dec. 2013: EUR 18.5 million). Of this amount, there were EUR 3.6 million in guaran-tees and irrevocable credit commitments (as of 31 Dec. 2013: EUR 2.6 million). For financial investments, there were write-downs due to credit ratings and not including portfolio risk provisions for a total of EUR 2.3 million in the reporting period (in financial year 2013: EUR 0.2 million).
PORTFOLIO ANALYSIS (BALANCE SHEET)
The changes in maximum credit risk based on IFRS carrying amounts (for balance sheet items) and nominal amounts (for contingent liabilities and irrevocable loan commitments), taking account of specific risk provisions and country risk provisions in accordance with IAS 39, were as follows in the reporting period:
Maximum credit risk (EUR million)by balance sheet items
31/12/2014 31/12/2013
Cash reserves 299 785
Loans and advances to banks 2,310 2,005
Loans and advances to customers 8,866 8,693
Assets held for trading 477 328
Positive market value of fair value hedges 136 29
Investments* 4,271 4,913
Other assets 2 4
Contingent liabilities 229 322
Irrevocable credit commitments 579 640
Total 17,168 17,718
* Not including equity instruments, including securities repurchase transactions

51
CORPORATE REPORT 2014 | GROUP MANAGEMENT REPORT
The credit risk for neither overdue nor im-paired financial investments fell by roughly EUR 519 in the reporting period, mostly in cash reserves (by EUR 486 million), financial investments (by EUR 640 million) and contin-gent liabilities and irrevocable credit commit-ments (by a total of EUR 154 million). By con-trast, there was a rise in loans and advances to banks (by EUR 355 million), loans and ad-vances to customers (by EUR 152 million) and assets held for trading (by EUR 149 million) and positive market values from fair value hedges (by EUR 107 million).3
Financial assets that are neither past due nor impaired:maximum credit risk as of 31 Dec. 2014 by rating category (EUR million)*
31/12/2013
Balance sheet item and category**1 2-5 6-12 13-15 Default Unrated Total Total
Cash reserve (LaR) - - 2 - - 298 299 785
Loans and advances to banks (LaR) 1,458 278 489 - - 85 2,309 1,954
Loans and advances to customers (LaR) 2,861 3,517 1,919 151 51 169 8,669 8,517
Assets held for trading (HfT) 354 61 53 1 - 7 476 327
Positive market value of fair value hedges 128 8 - - - - 136 29
Investments*** 3,489 568 212 0 - 1 4,270 4,910
Available for sale 2,921 446 22 - - - 3,389 3,674
Fair value option 99 49 120 - - 1 268 250
Held to maturity 428 21 - - - - 450 593
Loans and receivables 42 51 71 0 - - 164 393
Other assets - - 1 - - 1 2 4
Contingent liabilities 30 99 96 4 - - 229 322
Irrevocable credit commitments 44 371 143 1 - 19 579 640
Total 8,364 4,902 2,915 157 51 580 16,968 17,487
* In the event of past due receivables, the entire exposure of the borrower incl. investments, assets held for trading, contingent liabilities and irrevocable credit commitments are reported as past due.
** Categories are: Loans and Receivables (LaR), Held for Trading (HfT), Available for Sale (AfS), Fair Value Option (FVO) and Held to Maturity (HtM).*** Not including equity instruments, including securities repurchase transactions
3 Unrated items relate to assets for which a derived rating could not be allocated in accordance with the management approach, e.g. cash reserve, active balances for ledger accounts.

52
Solely loans and advances to customers were overdue but not impaired as of the reporting date.4 The decline of EUR 31 million in overdue, but not yet impaired assets in the reporting
period is mainly due to loans and advances to banks (which fell by EUR 51 million), while loans and advances to customers rose slightly (by EUR 20 million).
4 The balance sheet item “Loans and advances to customers” also includes customers that are assigned to the Banks sector economically.
Financial assets that are past due, but not impaired:maximum credit risk as of 31/12/2014 by length of overdue payment (EUR million)*
31/12/2013
Balance sheet item, category** and sector1 to 30
days30 days to 3 months
3 months to 1 year
> 1 year Total Fair value of
collateral
Max. credit risk
Fair value of
collateral
LOANS AND ADVANCES TO BANKS (LaR) 0 - - - 0 0 51 40
Banks / Finance 0 - - - 0 0 51 40
LOANS AND ADVANCES TO CUSTOMERS (LaR) 33 5 3 15 56 32 36 28
Banks 22 - - - 22 12 8 6
Technology 10 0 - - 10 6 - -
Non-profit org. 0 - - 9 9 5 - -
Sovereigns 0 - 0 6 6 3 0 0
Other sectors 1 5 3 0 9 5 28 22
ASSETS HELD FOR TRADING (HfT) - - - - - - 0 0
AVAILABLE FOR SALE FINANCIAL INVESTMENTS (AfS)*** - - - - - - - -
Contingent liabilities - - - - - - - -
Irrevocable credit commitments - - - - - - - -
Total 33 5 3 15 56 32 87 69
* In the event of past due loans and advances, the entire exposure of the borrower incl. investments, assets held for trading, contingent liabilities and irrevocable credit commitments are reported as past due.
** Categories are: Loans and Receivables (LaR), Held for Trading (HfT), Available for Sale (AfS), Fair Value Option (FVO) and Held to Maturity (HtM).*** Not including equity instruments, including securities repurchase transactions

53
CORPORATE REPORT 2014 | GROUP MANAGEMENT REPORT
The maximum credit risk of impaired assets includes the netting of specific impairments for roughly 125.1 million as of the reporting deadline (as of 31 Dec. 2013: EUR 121.7 million). The maximum credit risk described above does not contain the received standard bank securities, above all, mortgage liens, pledges, assignments, chattel mortgages and debt un-dertakings. Within the scope of security utili-sation, SaarLB did not acquire any collateral in terms of a rescue purchase in the reporting period.
MARKET PRICE RISK
Market price risk is the risk of (valuation) losses on open (trading) positions due to unfavourable market price fluctuations. For SaarLB, relevant market prices are in particu-lar EUR interest rates, stock prices and curren-cy exchange rates. Open positions are created from spot, forward and option transactions.The strategic principles for dealing with mar-ket price risks at SaarLB are set out in the risk strategy. Organisationally, the trading
business is structured around the require-ments of MaRisk. Treasury and Portfolio Management actively manages assets and li-abilities, interest rate risks from the banking book, while the Savings Banks, Institutionals and High Net Worth Individuals segment is in charge of interest rate products and foreign exchange. Trading transactions are processed by the Services area. Risk controlling is re-sponsible for managing and monitoring mar-ket risks and for systematically developing the tools required to perform this. Since the Minimum Requirements for Trading Activities (MaH) was introduced in 1996, SaarLB has lim-ited market price risks from both the trading book and the banking book, including inter-est rate risks, using a uniform Value at Risk (VaR) approach. Risk controlling monitors the risks in all five sub-portfolios, taking account not just of trading risks in the narrow sense, but also the asset/liability management po-sitions, which hold substantial interest rate risks for the Bank.
Financial assets that are impaired: maximum credit risk (EUR million)
31/12/2014 31/12/2013
Balance sheet item, category* and sectorExposure Specific
risk provisions
Max.credit
risk
Fair value of
collateral
Max.credit
risk
Fair value of
collateral
LOANS AND ADVANCES TO BANKS (LaR) 17 -16 1 0 0 0
LOANS AND ADVANCES TO CUSTOMERS (LaR) 249 -108 141 80 139 110
Real estate 104 -62 42 24 60 47
Retail customers 66 -4 62 35 49 39
Sovereigns 12 -1 10 6 10 8
Food + beverage 17 -9 8 5 3 2
Construction 12 -6 6 3 4 3
Chemicals 15 -9 6 3 2 1
Other sectors 24 -18 6 3 11 8
ASSETS HELD FOR TRADING (HfT) 1 - 1 0 1 1
INVESTMENTS** 1 - 1 0 3 3
Contingent liabilities 0 0 0 0 0 0
Irrevocable credit commitments - - - - 0 0
Total 268 -125 143 81 144 113
* Categories are: Loans and Receivables (LaR), Held for Trading (HfT), Available for Sale (AfS), Fair Value Option (FVO) and Held to Maturity (HtM).** Not including equity instruments, including securities repurchase transactions

54
The parameters used for calculating VaR re-flect the Bank’s caution to exposing itself to market risk. The risks of all the segments are included in the daily risk report with an assumed holding period of 10 trading days and a one-sided confidence level of 99.95%. When producing a risk summary, correlations that minimise risks are disregarded. For the trading book section, the Bank calculates the risk parameters from its own history, which stretches far into the past in some cases. In the banking book section, the key risk perfor-mance indicators will fundamentally be cal-culated with historical simulation, whereby the used periods are regularly updated. The stock price risks that may be included in the special funds will be assessed on the basis of the scaled key performance indicators for risk in the fund company.
As of 1 January 2014, the positions with inter-est rate risks were combined into a treasury portfolio and the interest rate risks of LBS were also included.5 In addition, a benchmark strategy for liabilities to manage the risk of a change in interest rates was implemented in a new section (ALCO portfolio). Overall, the
number of subportfolios fell from eight in 2013 to five.
The Board of Management has set a maxi-mum potential loss limit (VaR limit) and a maximum loss limit (target deviation limit) for each sub-portfolio based on the risk cov-er funds. Each sub-portfolio’s value-at-risk, which is calculated daily, must not exceed the VaR limit allocated to it at any time. Negative deviations from the respective proportionate target value in the sub-portfolio’s net gain/loss must not exceed any of the target devi-ation limits either. The target deviation limit is usually 50% of the planned amount of a sub-portfolio. In some cases, VaR limits can be supplemented by guideline values for upper portfolio limits and other restrictive stipula-tions laid down by the member of the Board of Management responsible for Trading.
Reporting to all departments and segments involved in the risk monitoring and manage-ment process takes place at the start of each trading day. It covers realised gains/losses, valuation gains/losses, VaR and limit utilisa-tion for the preceding trading day.
The system for determining the net VaR was converted on 1 January 2014. While the comparative figures as of 31 December 2013 include deviations from the proportionate target value, the room for manoeuvre in the
trading departments during the reporting pe-riod are limited by the negative operating re-sults. This prevents any trading losses exceed-ing upper loss limits allocated to market risks.
Market risk for the SaarLB Group:gross VaR (EUR million)
12 month comparison as of 31/12/2014 12 month comparison as of 31/12/2013
Average Maximum Minimum Average Maximum Minimum
Interest rate VaR 10.1 15.6 4.2 14.6 24.1 9.6
Special funds VaR* --- --- --- 2.5 8.1 0.7
FX VaR 0.6 1.2 0.4 0.3 0.5 0.2
Shares-VaR* 1.5 7.1 0.0 --- --- ---
Total VaR 12.2 18.4 6.8 17.4 32.0 11.2
* Since 1 January 2014, the risks from the special funds have been separated by cause of risk: the interest portion is included in the interest VaR; the equity portion is reported in the new rubric of asset VaR.
5 The interest VaR values for LBS as of the comparative date of 31 December 2013 are not integrated in the following table in EUR million): average 2.4; maximum: 3.4; minimum: 1.5

55
CORPORATE REPORT 2014 | GROUP MANAGEMENT REPORT
For the (net) VaR determined under consider-ation of the negative operating earnings, lim-its totalling EUR 44.65 million were allocated to the individual portfolios from the risk cov-er funds of SaarLB as of the reporting date (31 Dec. 2013: EUR 60.3 million). These limits were used (across all portfolios) at an average of 35.2% in the reporting period (2013: 26.5%), whereby the utilisation fluctuated between a minimum of 19.9% (2013: 14.7%) and a maxi-mum of 48.4% (2013: 50.3%).6 The latter corre-sponds – in absolute terms – to a loss potential of EUR 21.6 million (2013: EUR 27.0 million). As of the reporting date, the VaR from market risks was EUR 20.7 million (net; as of 31 Dec. 2013: EUR 26.7 million).
The tools described above are constantly modified to take account of changing cir-cumstances. Risk quantification methods in particular are validated in a back-testing procedure and refined accordingly every six months. The risk parameters are updated on a revolving basis every quarter.
When calculating risk-bearing capacity, the potential losses in the daily management are scaled at a uniform SaarLB-wide confidence level and holding period. In addition to quan-tifying ICAAP risk capital needs, forward-look-ing analyses based on unusual market price changes (stress scenarios) are also carried out here.
Each month, interest rate risk in the banking book is assessed specifically based on month-ly interest rate changes of +/-200 basis points in line with Deutsche Bundesbank specifica-tions. The calculated cash value changes in relation to the liable equity were (at SaarLB, incl. LBS as well as LBS itself) significantly be-low the regulatory thresholds.
LIQUIDITY RISK
SaarLB defines liquidity risk as the risk of be-ing unable to meet payment obligations as they fall due in full or on time or – in the case of a liquidity crisis – only being able to obtain funds at high rates or sell assets at discounts to the market prices.
The strategic principles for dealing with li-quidity risk at SaarLB are set out in the risk strategy and the liquidity contingency plan. The prime goal of liquidity risk management and risk controlling is to ensure SaarLB’s pay-ment obligations can be met and refinancing obtained at all times.
Liquidity management is handled by Treasury, which also includes the money market trad-ing unit responsible for ensuring that liquid-ity is balanced on the market for maturities of up to one year. Liquidity risk controlling is performed by Risk Controlling.
In 2014 the method of modelling the cash flow was changed relative to 2013. Now the liquid-ity commitment schedule is displayed sepa-rately from the funding potential.
All the liquidity flows (incoming and outgo-ing payments) of the Bank are included in the measurement of liquidity risks. They include the deterministic payment flows and, mod-elled on assumptions, the relevant non-deter-ministic payment flows (e.g. from irrevocable credit commitments). The liquidity coverage that stands in relation to this includes, among others, available access to central bank mon-ey at the ECB, securities that can be sold or loaned at short notice and the potential for Pfandbrief issues placed at short notice and quantifies the possibility of covering (nega-tive) liquidity outflows.
6 In the above table, the minimum (maximum) of the gross VaR of the respective market price risk type are summarised, while the minimum (maximum) of the net VaR (i.e. including target value deviations and negative operating earnings) is reported across all market price risk types here.

56
SaarLB measures and manages the liquidity risks in four scenarios:
• Base scenario (budget point of view) Illustration of the “ordinary” business ac-
tivity by taking into account the contrac-tual capital maturities and assumption of equivalent new business at maturity.
• Bank stress scenario Illustration of a significant downgrade of
SaarLB, which leads to liquidity outflows by private and institutional investors as well as to the discontinuation of the Bank’s own issues (outflow of variable portfolios). Furthermore, the funding is no longer possible by placing uncovered securities.
• Market stress scenario Reflection of capital market disruption
(loss of confidence on the interbank mar-ket), which has an impact on obtaining liquidity and leads to liquidity outflows due to the settling of open commitments of commercial customers.
• Combination scenario Simultaneous illustration of the effects
from the bank stress and market stress scenarios.
To remain solvent even in times of crisis, SaarLB has a suitable portfolio of securities eligible for refinancing at central banks. An adequate facility with the ECB ensures that any unexpected payment obligations can be covered on the same day. SaarLB thereby limits its short-term liquidity needs so that the shortfall arising from liabilities maturing overnight does not exceed the central bank refinancing freely available at the time con-cerned.
The volume of ECB deposits is roughly EUR 1.2 billion as of the reporting date (as of 31 Dec. 2013: EUR 1.0 billion), of which roughly EUR 0.5 billion (as of 31 Dec. 2013: EUR 0.4 bil-lion) is freely available. Payment obligations
can continue to be covered, if need be, largely independently of other sources of refinanc-ing. The Bank did not resort to the overnight facility of the ECB in the reporting period (as in past years).
The short-term refinancing needs pursuant to BTR 3.2 MaRisk have been reported by solely offsetting both the ECB-eligible and GC pool-ing-eligible assets in the potential liquidity coverage. This should be sufficient in the weekly report updated on each trading day for the coverage of the liquidity gap resulting from the “combination” scenario.
Liquidity management and monitoring for each next 180-day period is performed using a juxtapositioning of the cumulative liquid-ity gap and the cumulative funding poten-tial. The utilisation of the funding potential is judged on the basis of scenario-specific thresholds.
The degree of utilisation for the funding potential is also the key for managing ma-turities for periods of longer than 180 days. Suitable funding instruments are employed by the Bank to create a balanced funding structure so it can safeguard its solvency and ability to refinance in the medium and long term. At present: SaarLB’s collateral pool – the pool of assets serving as cover for pfand-briefs – has sufficient surplus cover, enabling issuing activity to continue in normal market situations. On the other hand, the liquidity commitment schedule has been structured so that there will be a net inflow of liquidity in the coming years. Returns from asset man-agement can therefore be used as credit.
Under the stress assumptions of the previ-ously defined scenarios, the liquidity out-flows as of the reporting date were covered by appropriate potential liquidity coverage from the control-relevant 180 day point of view at all times.

57
CORPORATE REPORT 2014 | GROUP MANAGEMENT REPORT
All the tools described form part of the regu-lar reporting to the Board of Management and are integrated into the MaRisk risk report. In 2014 the funding potential was sufficient to cover SaarLB’s liquidity flows at all times.
The ongoing positive assessment of the li-quidity situation is also confirmed by the liquidity ratio (according to the regulatory requirements under the Liquidity Ordinance [Liquiditätsverordnung]). In its internal reg-ulations SaarLB’s managing and monitoring goes further than the supervisory require-ment that the liquidity ratio within the com-ing month must be greater than 1. The bank sets its warning level to 1.25, which triggers counter-measures. In the reporting period, the liquidity ratio of the Bank was between 2.00 and 3.25 (in 2013: between 1.78 and 2.59); as of the reporting date, it amounted to 2.62 (as of 31 Dec. 2013: 2.15). The observance of both the regulatory and internal require-ments was thus ensured at all times. LBS also complied with the regulatory requirements on liquidity in 2013.
In addition, a breakdown of balance sheet financial liabilities by contractually agreed terms to maturity (excluding home loan sav-ings deposits, off-balance sheet liabilities, other liabilities and some subordinate capital components which have no agreed maturity) is given below:
The utilisation of the funding potential (180 days) as of 31 December 2014 (in % or EUR million)
Maximum utilisation Minimum free funding potential
Base scenario (planned run-off structure) 0.00% 2,178
Bank stress scenario 27.33% 2,022
Market stress scenario 0.79% 1,554
Combination scenario 45.85% 1,011
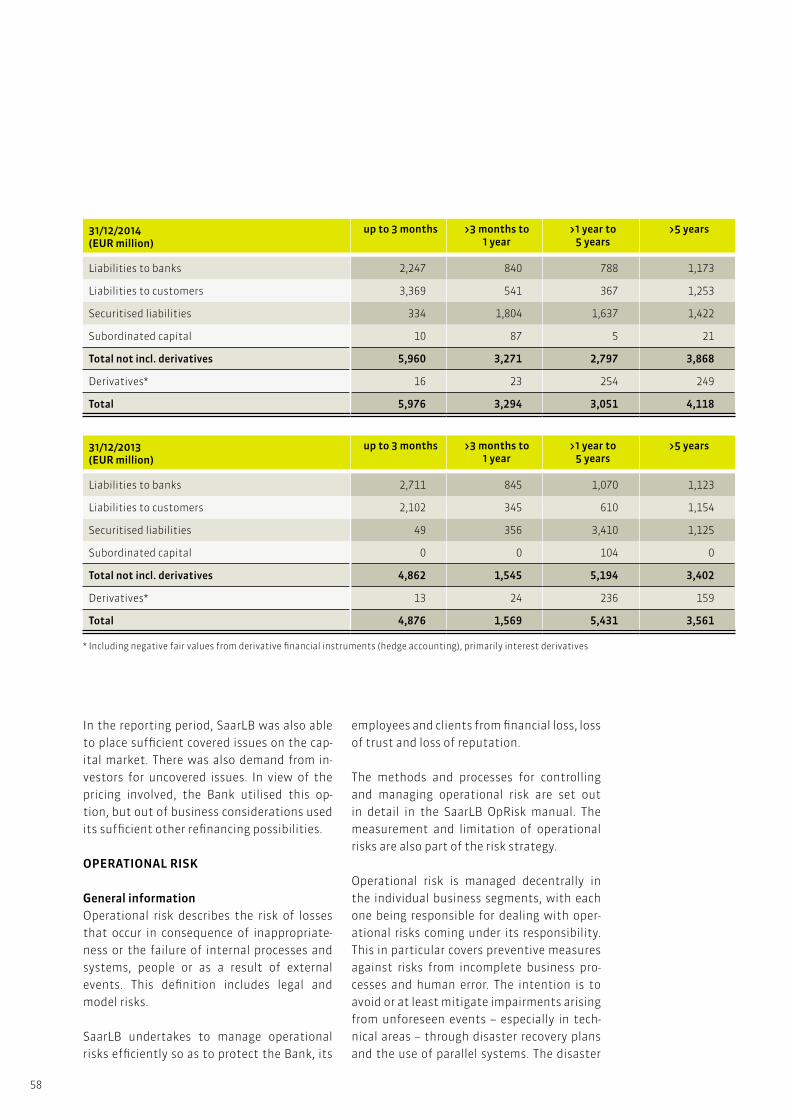
58
In the reporting period, SaarLB was also able to place sufficient covered issues on the cap-ital market. There was also demand from in-vestors for uncovered issues. In view of the pricing involved, the Bank utilised this op-tion, but out of business considerations used its sufficient other refinancing possibilities.
OPERATIONAL RISK
General informationOperational risk describes the risk of losses that occur in consequence of inappropriate-ness or the failure of internal processes and systems, people or as a result of external events. This definition includes legal and model risks.
SaarLB undertakes to manage operational risks efficiently so as to protect the Bank, its
employees and clients from financial loss, loss of trust and loss of reputation.
The methods and processes for controlling and managing operational risk are set out in detail in the SaarLB OpRisk manual. The measurement and limitation of operational risks are also part of the risk strategy.
Operational risk is managed decentrally in the individual business segments, with each one being responsible for dealing with oper-ational risks coming under its responsibility. This in particular covers preventive measures against risks from incomplete business pro-cesses and human error. The intention is to avoid or at least mitigate impairments arising from unforeseen events – especially in tech-nical areas – through disaster recovery plans and the use of parallel systems. The disaster
31/12/2013(EUR million)
up to 3 months >3 months to 1 year
>1 year to 5 years
>5 years
Liabilities to banks 2,711 845 1,070 1,123
Liabilities to customers 2,102 345 610 1,154
Securitised liabilities 49 356 3,410 1,125
Subordinated capital 0 0 104 0
Total not incl. derivatives 4,862 1,545 5,194 3,402
Derivatives* 13 24 236 159
Total 4,876 1,569 5,431 3,561
* Including negative fair values from derivative financial instruments (hedge accounting), primarily interest derivatives
31/12/2014(EUR million)
up to 3 months >3 months to 1 year
>1 year to 5 years
>5 years
Liabilities to banks 2,247 840 788 1,173
Liabilities to customers 3,369 541 367 1,253
Securitised liabilities 334 1,804 1,637 1,422
Subordinated capital 10 87 5 21
Total not incl. derivatives 5,960 3,271 2,797 3,868
Derivatives* 16 23 254 249
Total 5,976 3,294 3,051 4,118

59
CORPORATE REPORT 2014 | GROUP MANAGEMENT REPORT
recovery plans are regularly adapted to cater for changing structural and procedural organ-isational circumstances and the systems up-dated on an ongoing basis.
The duties of SaarLB’s Legal Department in-clude minimising legal risks from contractual terms and conditions, provisions of national and international law and litigation and court decisions. Pending litigation is taken into ac-count appropriately in the annual financial statements.
Risk Controlling provides central monitoring of operational risks. The used instruments currently include in particular the systemat-ic collation of operational losses occurring at SaarLB in a loss database, forward-looking assessment of the OpRisk profile through regular self-assessments of all of SaarLB’s organisational units and the requisite struc-tural and procedural organisation within the Bank. Since 1 January 2007, SaarLB has used the standardised approach under the Capital Requirements Regulation (CRR) for calculat-ing capital requirements for operational risk.
Losses that have occurred and the results of the self-assessments are analysed in a regular reporting process which is integrated into the MaRisk risk report.
In the reporting year, 22 losses (in 2013: 26) were observed. These losses had a negative impact on net income of around EUR 0.6 mil-lion (2013: EUR 2.1 million). This amount is significantly below the risk capital allocated for operational risk based on the capital re-quirements of the regulatory standardised approach in the amount of EUR 23.3 million (2013: EUR 22.2 million).
Legal risksLegal risks describe the likelihood of losses on account of a failure to comply with the rules set in legislation or case law due to a lack of knowledge, insufficiently cautious applica-tion of the law or failure to react promptly to a change in the legal framework conditions.
Legal risks fall under the definition of opera-tional risks in accordance with the Capital Re-quirements Regulation (CRR).
The legal risk is seen in booked losses or in pro-visions that result on account of or in connec-tion with lawsuits directed against SaarLB (li-ability proceedings). Lawsuits filed by SaarLB (asset proceedings) usually do not embody any operational, but rather a credit risk, so that the risk of loss is taken into account by impairments. The costs of legal proceedings (court and attorney costs) in asset proceed-ings are categorised as the legal risk, however.
Organisation In SaarLB and its subsidiaries, the Legal busi-ness segment is responsible for managing the legal risk. All legal employees in the Legal business segment are responsible for identi-fying and managing the legal risk in SaarLB and its subsidiaries.
Risk management The legal staff in the Legal business segment are responsible for identifying the legal risks and all the potential ensuing losses at an ear-ly stage, finding possible solutions to avoid or minimise the losses and actively partici-pating in the decisions related to the legal risks. They should be constantly informed about all legal changes or new developments within the scope of their responsibilities, and notify the affected business units of the im-pact on the legal risk and the resulting need for action. They are responsible for taking ac-tion or adjusting the legal provisions in light of a risk-oriented approach, managing and monitoring the new and ongoing court pro-ceedings. In liability proceedings, a provision is created on the basis of the risk assessment by the responsible employee in the Legal busi-ness segment in coordination with the head of the department in the Legal business seg-ment. The expected risk of loss in the proceed-ings usually corresponds to the created pro-visions. In order to judge the amount of the expected loss, it is necessary to re-evaluate after each significant part of the proceedings

60
what amount the Bank would have to pay in a reasonable case if it ended the dispute at this time by settlement. In asset proceedings, the Bank’s court and own attorney costs are usually set aside. Every six months, the Legal business segment reports on all the signif-icant court proceedings and developments in legal risk by preparing board resolutions. The addressees are members of the Board of Management, the divisional head responsible for the Legal business segment, the internal supervisory boards, the external auditors and the Risk Controlling department at the Bank.
Current developments SaarLB is confronted by various court and ar-bitration proceedings, claims and regulatory investigations (legal proceedings) that relate to a wide range of subjects which are insignif-icant in terms of their amounts. They include, for example, disputes in connection with loan financing, disputes related to the use of a guarantee and disputes about the question of when issued cancellation policies took effect. In addition, there may be changes or an inten-sification in the form of supreme court case law, e.g., in the private customer area that lead to further claims against SaarLB in the home loan savings business. In such court proceed-ings, above all damage compensation claims or the revocation of concluded contracts are enforced. If individual or multiple lawsuits take place, the damage compensation pay-ments, the expenses for revocation and other cost-intensive measures could follow. Individu-al court proceedings may also have an impact on the reputation of SaarLB. SaarLB and its subsidiaries have created provisions for court proceedings if and to the extent that the re-sulting obligations are likely and the amount of the obligations can be determined with sufficient accuracy. Since the development of these proceedings is connected with sig-nificant uncertainties, it cannot be ruled out that the created provisions will prove to be partially insufficient after the final rulings in the proceedings. This could lead to significant additional expenses. This also relates to legal
proceedings for which no provisions were nec-essary from SaarLB or its subsidiaries’ point of view. The final outcome of individual legal pro-ceedings can affect the result of SaarLB and its subsidiaries in a certain reporting period; the possibly resulting obligations may also have an impact on the net assets, financial position and results of operations. In legal proceedings for which provisions are to be created, it is not possible to definitively predict the length of the proceedings or the amount of the claim at the time the provision is created, as with all le-gal proceedings. For legal risks, a provision of EUR 1,534,000 was created as of 31 December 2014 after application of a risk-oriented ap-proach. SaarLB has not provided an individual outline of each provision amount in order not to influence the outcome of the respective pro-ceedings.
SaarLB and its subsidiaries have taken suffi-cient organisational precautions to ensure the recording, valuation, current controlling and monitoring of legal risks from court pro-ceedings.
Additional information on the legal proceed-ings can be found in Note 57 on the provisions and Note 76 on the contingent liabilities and irrevocable loan commitments in the consoli-dated financial statements.
Accounting-related internal control and risk management systemThe following comments relate to the provi-sion of Section 315 (2) No. 5 of the German Commercial Code, in conjunction with Sec-tion 315a (1) of the German Commercial Code, according to which corporations in terms of Section 264d of the German Commercial Code have to describe the significant features of the internal control and risk management system with regard to the Group accounting process.
Responsibilities and goalsTo ensure the appropriateness and reliability of the accounting, the SaarLB Group has set up an internal control system (ICS). It includes

61
CORPORATE REPORT 2014 | GROUP MANAGEMENT REPORT
principles, processes and measures to ensure the effectiveness and efficiency of the ac-counting. Against this backdrop, the internal control system also serves to present a true and fair view of the SaarLB Group’s net assets, financial position and results of operations. The main goal of the internal control system is to ensure that all transactions are recorded, processed and documented correctly and in full in accordance with the legal requirements and standards as well as the provisions of the articles of association and the other internal guidelines. The internal risk management sys-tem is viewed as a component of the internal control system.
OrganisationThe SaarLB’s Board of Management (Group’s Board of Management) bears responsibility for the Bank having a proper business or-ganisation, which includes both appropriate internal control processes and above all the adequate controlling and monitoring of the significant risks. The Group’s Board of Man-agement is supported in this particularly by the corporate area of Global Risk Manage-ment with its organisational units of Risk Controlling, Financing and Reporting, and the corporate area of Services with its IT organisa-tional unit as well as by Internal Audit.
Risk management and monitoringSee “Risk management and monitoring princi-ples” for the organisation of these areas.
Financing and ReportingFinancing and Reporting in the SaarLB Group is responsible for the preparation of the con-solidated financial statements, the develop-ment of accounting requirements, the initia-tion of accounting-relevant projects and for the observance of national and international changes in the accounting. With regard to the creation of the consolidated financial state-ments, other subdivisions as well as units to be consolidated are included.
Responsibilities in this context include pri-marily ensuring the appropriateness of the
accounting, in particular the uniform Group accounting and valuation (partially in collab-oration with the IT organisational unit). This primarily consists of setting up and monitor-ing the effectiveness of the accounting pro-cesses as well as the implementation of the accounting standards and statutory require-ments in the area of accounting that are rel-evant for the SaarLB Group and are stipulat-ed in the accounting guidelines, the booking logic and the posting rules. Furthermore, the special departments and consolidation units define the rules for business recognition, master data maintenance and the fulfilment of storage obligations in organisation and process instructions. These instructions form an essential basis for the accounting-related internal control system.
Internal AuditInternal Audit handles the auditing of SaarLB’s business operations and the audit procedures for LBS, LBS Immo and LBS Ver-triebs GmbH; for the special funds, it checks the proper execution of the business opera-tions. It is subordinate to the chairman of the Group’s board of management. The audit ac-tivities extend fundamentally to all activities and processes, also to the extent that they are outsourced, on the basis of a risk-orient-ed audit approach. This includes a review of the effectiveness and appropriateness of the internal control system and the risk manage-ment.
Internal Audit carries out the tasks assigned to it independently of the activities, process-es and functions to be reviewed or audited in accordance with the applicable legal and reg-ulatory requirements (e.g. German Banking Act, MaRisk).
Control environment and control processThe internal control system is based on organ-isation and process instructions.
The central components of these regulations with regard to the accounting-related inter-nal control system are:

62
• provisions from the so-called new prod-uct processes for the recording, valuation and reporting,
• instructions in the Lending and Control Manual for recording, valuing and report-ing on receivables as well as
• documentation of the process for prepar-ing the financial statements.
These provisions include the significant re-quirements for uniform Group accounting and valuation methods in the SaarLB Group on the basis of IFRS/IAS.
Furthermore, Financing and Reporting pre-pares the annual and semiannual instructions at each reporting deadline, which contain not only legal changes, but also primarily the significant preparation work (including the required proofs) and a schedule to be under-taken by the respective special departments.
The rules for the recording and controlling of business data are at the disposal of the re-spective OU; these instructions are prepared decentrally and updated if need be.
The organisation and process instructions also include the handling of the SaarLB Group’s significant risks with regard to the risk management and monitoring.
The rules for risk management and monitor-ing are regularly reviewed and updated.
To ensure a complete and correct processing of the transactions including the proper data recording, booking and documentation, a va-riety of internal controls are performed in the SaarLB Group. These include appropriate sep-arations of functions, a differentiated access authorisation system for protection against unauthorised access, continuous controls within the scope of the work processes under application of the four-eye principle as well as programmed controls within the IT systems.
As part of the internal controls, general ledg-ers and sub-ledgers are reconciled in SaarLB
and manually postable ledger accounts are monitored by the responsible areas. Further-more, controls and reconciliations are also handled to ensure the proper transfer of data between the different IT systems. Within the process for preparing the consolidated financial statements, the correct profession-al presentation of the circumstances forming the basis of the financial statements is re-viewed and the quality assurance measures are carried out for data included in the con-solidated financial statements. The IDLKON-SIS server-based software that is used for the consolidation contains multiple programmed controls to ensure the recording of data and documentation in accordance with the Group requirements.
The SaarLB Group outsourced a portion of its services (primarily IT services, services in the area of payment transactions and securities settlement) to external companies. The in-tegration of the outsourced areas into the SaarLB Group’s internal control system is en-sured within the framework of the outsource controlling. Furthermore, Internal Audit at SaarLB considers the outsourced areas in the test process. Where there is an audit by the Internal Audit of the outsourcer, SaarLB’s In-ternal Audit regularly convinces itself of the functionability of the respective audits by the outsourcers.
In the SaarLB Group, the accounting process is subject to regular controls with regard to the inherent risks in order to introduce appro-priate measures for the further development of the internal control system, if need be. This also relates to the internal risk management and monitoring.
Real estate riskThe real estate risk is defined as potential negative changes in value of SaarLB’s own real estate portfolio due to a worsening of the general real estate situation or a deteri-oration in specific aspects of individual real estate (vacancies, changes in use options, structural damage, etc.).

63
CORPORATE REPORT 2014 | GROUP MANAGEMENT REPORT
SaarLB’s own former real estate portfolio was transferred to a closed-end real estate fund in 2005. SaarLB is a 100% shareholder of the fund and a tenant of the space it uses. The technical support for the properties is provid-ed by SaarLB, while the business administra-tion of the real estate is handled by an exter-nal service provider.
There is a regular annual evaluation of all real estate by an independent appraisal commit-tee, and the appraisals are presented to SaarLB for informational purposes and possibly for a statement. They take into account the current market conditions and the development of rental prices as well as the respective rental situation in the buildings and the measures conducted on the properties. Appreciation due to value-increasing measures on the properties takes place with a stable retention in value and is done in coordination with the corporate area of Global Risk Management at SaarLB.
The permanent technical support for the property takes into account the engagement of the investment committee for stability in value. For complete management to retain the value of the real estate, an economic plan is created for all real estate and presented to the fund for approval. Ongoing measures are taken within the framework of this econom-ic plan and – depending on the contractual-ly defined limits – presented to the fund for approval in each case. A special release of the fund is required in each case for conducting the measures not planned in advance.
The business real estate management en-sures the constant controlling and monitor-ing of rents with the goal of full tenancy, the early addressing of expiring tenancies and the optimisation of the sector mix. The invest-ment committee sets the goals and strategy at least once a year, and SaarLB is represented by the Technical Director of Services and Man-ager of Services.
The methods and processes for the con-trolling and management of real estate risks
is also a part of the risk strategy. Risks are also quantified and limited within the framework of the risk bearing capacity calculation.
Reputation riskReputation risk describes the risk that neg-ative publicity on SaarLB, whether accurate or not, could harm the confidence (of parts) of the public in the competency, integrity or credibility of SaarLB.
The publicity on SaarLB (“its own and that of others”) is monitored and managed in the Bank’s Communications unit. The institution-alised complaint management makes it pos-sible to measure and control the impact on the Bank’s reputation. Additionally, reference should also be made in this connection to the close link between the business and brand strategy of the Bank so that the reputation risk is also limited by the factors with a re-gional connection, standard products and in-tegration in the savings banks finance group (Sparkassen-Finanzgruppe).
The methods and processes for the con-trolling and management of reputation risks are also a part of the risk strategy. Risks are also quantified and limited within the frame-work of the risk bearing capacity calculation.
Strategic risk/business riskSaarLB understands strategic risks to be un-expected, ongoing negative impacts on the capital and income of the Bank (or the corpo-rate value), which are due to1. unexpected changes in the regulatory
or other exogenous market and environ-mental conditions or
2. false or insufficient management deci-sions on business policy positioning.
The business risk describes unexpected changes in the economic environment which will lead to negative changes in the business volume or the margins and are not due to the other risk types. It quantifies deviations between the planned and actual costs and income.
64
The handling of business and strategic risks (identification, limiting, control) is docu-mented in the business strategy of SaarLB. The business model, the strategic positioning of the Bank and the annually imposed inte-grated strategy and planning process are de-scribed in detail.
The identification and measurement of risks is done by analysis of the plan/actual devia-tions on the total bank and business segment level within the scope of the strategy and planning process.
A (qualitative) limiting of the risks is ensured within the framework of the business prin-ciple of “understanding and designing” due to the regional nature of the Bank, which ensures almost exclusive use of standard products and inclusion in the savings banks finance group (Sparkassen-Finanzgruppe).
The controlling is handled in the strategy/planning process, among others by requiring strategic key performance indicators and the use of so-called business segment analyses that address in particular the treatment of business risks on the level of the individual business segments.
The methods and processes for the controlling and management of strategic/business risks are also a part of the risk strategy. Risks are also quantified and limited within the frame-work of the risk bearing capacity calculation.
Summary of risk situationSaarLB has risk cover funds that were suffi-cient to cover all the ICAAP risk capital need-ed at any time in the year under review. Con-sequently, SaarLB’s economic risk bearing capacity was present at all times during the reporting period. From a regulatory point of view in terms of the Solvency Ordinance [SolvV] report, the key figures in the reporting period exceeded the internal targets so that the regulatory risk bearing capacity was en-sured at all times without any qualifications.
FORECAST AND OPPORTUNITY REPORT
SaarLB’s business planning and the develop-ment of its earnings are based on assump-tions with regard to future economic develop-ment, particularly with regard to the markets relevant for SaarLB. These assumptions come with uncertainties, however. A deviation in the actual development of the market can lead to negative and positive deviations for the future earnings of the Bank.
SaarLB’s business structure is not expected to change from the one in the past financial year, but there will be changes in the segment structure of the Bank, which will have a differ-ent structural organisation.SaarLB expects the following development for financial year 2015.
FORECAST FOR THE BANK’S RESULTS OF OPERATIONS
SaarLB expects a stable development of earn-ings in the core business segments during the coming financial year 2015. If, however, our ex-pectations of a stable economic development and a manageable crisis in the eurozone are not accurate, our forecasts will not be met.
According to our forecast for 2015, the posi-tive assessment will also be reflected in the good pre-tax earnings before the reinvest-ment of profits in 2015, which will link up to the good earnings in 2013, but will fall signif-icantly short of the earnings in 2014 which were heavily influenced by the fair value ef-fects. The greatest risk for SaarLB continues to be another intensification of the sovereign debt crisis in Europe, which could produce a chain reaction across the entire sector and also have a negative impact on the perfor-mance at SaarLB.
Net interest income in 2015 will be signifi-cantly above the current level despite the re-strained money market and low interest rates.

65
CORPORATE REPORT 2014 | GROUP MANAGEMENT REPORT
This is due to higher income in the core busi-ness segments on account of slightly higher new business volumes and minor increases in net margins as well as the expansion of value-oriented interest book management, which is reflected in a moderately increasing maturity transformation result.
Net commission income will develop in a very positive way. Particularly due to the planned expansion of the syndication business and the establishment of new commission-driven products, the Bank expects a substantial rise in commission income.
For 2015, slightly higher expenses than in 2014 are expected for personnel – among others due to the implementation of the salary in-creases and a moderate increase in personnel. Due to already planned and mainly regulato-ry-driven projects, other administrative ex-penses, including the depreciation of proper-ty, plant and equipment, will rise moderately from 2014 to 2015.
FORECAST FOR THE DEVELOPMENT OF THE BUSINESS SEGMENTS
In the Corporate Customers segment, we assume a slight increase in net interest in-come for the coming year, which is due to the planned expansion of new business. We ex-pect a significant rise in the net commission income.
There are opportunities in an expansion of the range of services in close collaboration with cooperation partners, particularly in the savings bank finance group.
We expect growth in line with the budget for the Real Estate and Projects segments, both in the financing of portfolio real estate and in projects, and thus slightly rising interest and commission income.
With a sustainable rise in interest rates, a nor-malisation of competition is expected, which would offer opportunities to raise margins
and commission income above the planned amounts in the target business and thus im-prove the returns in the segment. We see op-portunities in the placement of projects and thus the connected RWA controlling on the asset side for the Projects segment.
Savings Banks, Institutionals and High Net Worth Individuals will concentrate increas-ingly on the deposit and service business with institutional investors and high net worth pri-vate customers in 2014, and raise the net com-mission income as a result. We expect a side-ways development in net interest income.
The best opportunities in the Savings Banks, Institutionals and High Net Worth Individu-als can be found in rising commission income in the securities business if interest rates con-tinue to remain on the historically low level, and investors are driven out of bonds and into equities as a result of the low yields. Further-more, there will be opportunities in municipal business with unchanged interest rates, if municipalities cover their financial needs at historically low interest rates.
Treasury and Portfolio Management will con-tinue active portfolio management within the framework of the risk and income man-agement of SaarLB. We anticipate constant net interest income here. We expect a slight improvement in the net commission income.
The introduction of value-oriented interest book management on the level of the overall bank means that there is the opportunity to generate higher (and also constant structur-al) earnings in the future. The volatile devel-opment of financial markets must be consid-ered here, however, since they have a negative impact on the achievable contributions to earnings.
The ongoing low market interest rate level will continue to limit the income possibilities for Landesbausparkasse over the next two years. The liabilities side of Landesbauspar-kasse is defined by interest payments on the

66
home loan savings deposits, while the asset side with the credit business and investment possibilities largely depends on the current market conditions. Consequently, the net interest income is only anticipated to rise moderately, which is justified by increasing volumes. The assumed very positive new busi-ness development means that the commis-sion income due to payable brokerage com-missions will have a negative impact on the total earnings of Landesbausparkasse.
EXPECTED ECONOMIC CONDITIONS
SaarLB bases its forecast of the economic performance on the current estimates of ex-ternal institutions such as e.g. those for bank associations relevant for the Bank.
In the eurozone, a continuation of the eco-nomic recovery continues to be hoped for. GDP in the eurozone might grow by roughly 1.0% in 2015. Whether recently stagnating countries such as Italy will also see growth re-mains an open question. Furthermore, the de-velopments in Greece remain critical, both po-litically and institutionally. The devaluation of the euro, which intensified at the begin-ning of 2015, should lift exports from the cur-rency zone. Relative to the US dollar, the euro was roughly 20 US cents cheaper in January 2015 than it was the year before. The ECB also began quantitative easing (QE) in the form of government bond purchases on a large scale at the beginning of the year. The details and impact of this programme were announced in the first few months of 2015. QE entails signif-icant risks. It threatens to further distort fi-nancial market prices (stocks and bonds) and also creates a moral hazard for countries that continue to assume there will be loose mone-tary policy. Furthermore, there is a risk of high inflation if the right time for a tightening of monetary policy is missed. We therefore con-tinue to expect moderately rising SWAP inter-est rates and ongoing low EURIBOR reference interest rates for 2015.
The leading German economic research in-stitutes forecast 2015 full year growth rates ranging from 1.3%-1.6% for Germany. Econom-ic momentum will increase in Germany during 2015. After a weak winter half of the year, the Germany economy should slowly gain steam again, also because the low oil price means a reduction in costs for German households and companies. The increase in exports will accelerate due to the improving global econ-omy. This will also impact investment activ-ity. The drivers of the growth will be private consumer spending with clearly rising real income and another positive development on the labour market. The consumer price index should increase moderately, by 1.1%, in 2015. The unemployment rate will probably remain at its current level of 6.4%, although the intro-duction of the minimum wage for all profes-sions could alone have a negative impact on employment.
The largely stable growth in the fourth quar-ter of 2014 did not continue in France. For 2015, French experts anticipate a positive growth of the economy over the short term. The recovery of the American and English economy and the devaluation of the euro give exporters reason to be optimistic. The price of oil will also continue to strengthen the purchasing power of private households. These factors should contribute to the revival of consumption and a greater recovery in the French economy.
However, economists anticipate that the ef-fect of this recovery will first be noticed in 2016. Economists continue to assume that the year 2015 will be a difficult economic year.
FORECAST AND OPPORTUNITIES FROM REGULATORY DEVELOPMENTS
Despite the solid regulatory capital require-ments in Basel III, there will be additional re-quirements from current and new regulatory developments on the supranational level in 2015.

67
CORPORATE REPORT 2014 | GROUP MANAGEMENT REPORT
The Single Supervisory Mechanism (SSM) is a part of the overall project to create a bank-ing union. The next step will begin in 2016 and consist of a European Single Resolution Mechanism (SRM) for banks.
SaarLB was not affected by the ECB’s Asset Quality Review (AQR). If the ECB conducts such stress tests for smaller banks like SaarLB, it cannot fundamentally be ruled out that the results of the AQR could result in an adjustment of the relevant equity ratios.
Since the “Law on the Restructuring and Unwinding of Banks and Financial Groups” (Sanierungs- und Abwicklungsgesetz – SAG) entered into force on 1 January 2015, the Ba-Fin cannot require systemic banks to prepare restructuring plans. This is a challenge but also an opportunity to establish an adequate definition of restructuring indicators and the calibration of suitable thresholds and appro-priate options for action, including analyses of impact and implementation.
FORECAST ON CAPITAL AND RISK POSITIONS
SaarLB disclosed capital ratios at the end of the year that demonstrate it has a solid base in a challenging regulatory and economic en-vironment.
In light of the strengthening of capital due to the net income in 2014 on the one hand and the equity components determined on the basis of the Capital Requirements Regulation (CRR) on the other, the Bank anticipates a slightly declining equity ratio in the 2015 fi-nancial year, which will then rise moderately afterwards.
For the regulatory risk positions, we assume a value of just above EUR 7 billion in 2015 and thus a slight rise. The further reduction in non-core positions should be viewed in rela-tion to the new business.
OVERALL ASSESSMENT
On the basis of the described economic and business development, SaarLB expects that the positive development of earnings in the operating core areas will continue in 2015. We assume that the unusually high fair value gains will not be achieved again, but the decline will be par-tially compensated by structural growth in the core business segments. It is also not possible to assume that the historically low risk result will continue in 2015. SaarLB anticipates pre-tax earnings for 2015 that will be significantly lower than the current earnings, but will pick up from the earnings in 2013. The return on equity shall also be significantly below the current level. The IFRS cost-income ratio shall improve slightly in 2015 despite the moderately rising administra-tive expenses. The RWA returns shall also increase moderately due to the expected moderate rise in net interest and commission income with risk positions remaining the same.
Saarbrücken, 20 March 2015
Landesbank SaarBoard of Management
Werner Severin Frank Eloy Dr. Matthias Böcker

68
SaarLB consolidatedfinancial statements 2014
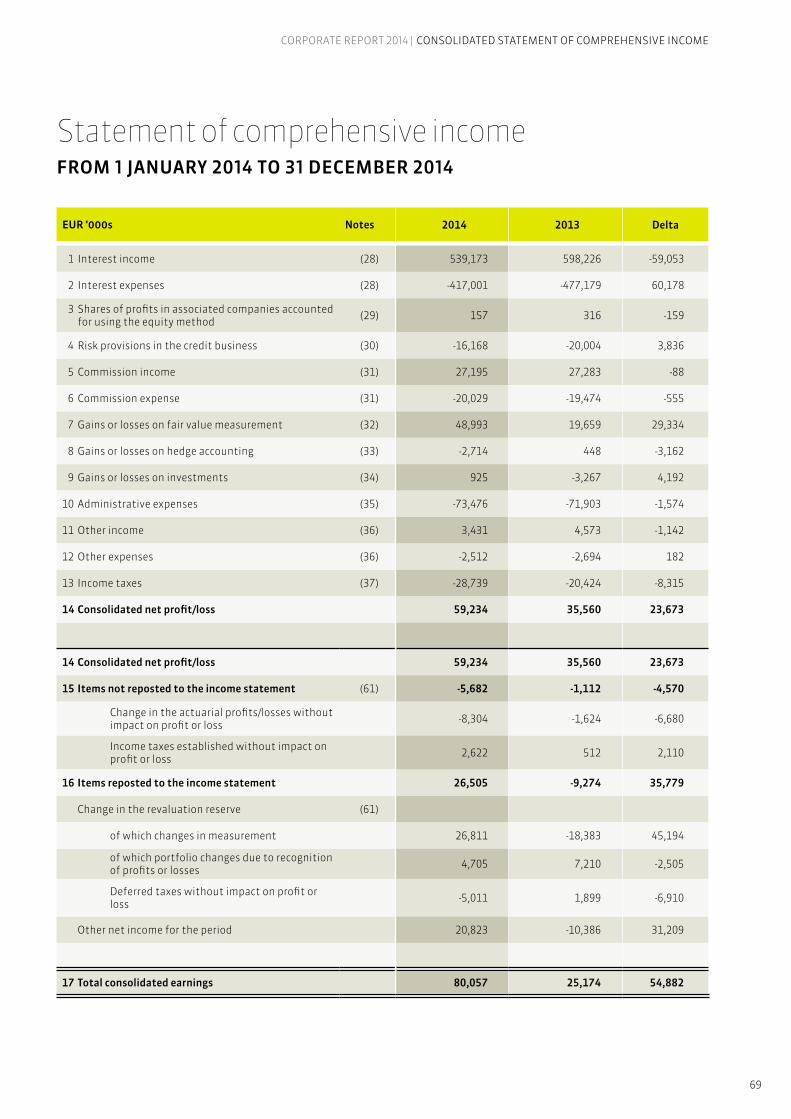
69
CORPORATE REPORT 2014 | CONSOLIDATED STATEMENT OF COMPREHENSIVE INCOME
Statement of comprehensive income FROM 1 JANUARY 2014 TO 31 DECEMBER 2014
EUR ’000s Notes 2014 2013 Delta
1 Interest income (28) 539,173 598,226 -59,053
2 Interest expenses (28) -417,001 -477,179 60,178
3 Shares of profits in associated companies accounted for using the equity method (29) 157 316 -159
4 Risk provisions in the credit business (30) -16,168 -20,004 3,836
5 Commission income (31) 27,195 27,283 -88
6 Commission expense (31) -20,029 -19,474 -555
7 Gains or losses on fair value measurement (32) 48,993 19,659 29,334
8 Gains or losses on hedge accounting (33) -2,714 448 -3,162
9 Gains or losses on investments (34) 925 -3,267 4,192
10 Administrative expenses (35) -73,476 -71,903 -1,574
11 Other income (36) 3,431 4,573 -1,142
12 Other expenses (36) -2,512 -2,694 182
13 Income taxes (37) -28,739 -20,424 -8,315
14 Consolidated net profit/loss 59,234 35,560 23,673
14 Consolidated net profit/loss 59,234 35,560 23,673
15 Items not reposted to the income statement (61) -5,682 -1,112 -4,570
Change in the actuarial profits/losses without impact on profit or loss -8,304 -1,624 -6,680
Income taxes established without impact on profit or loss 2,622 512 2,110
16 Items reposted to the income statement 26,505 -9,274 35,779
Change in the revaluation reserve (61)
of which changes in measurement 26,811 -18,383 45,194
of which portfolio changes due to recognition of profits or losses 4,705 7,210 -2,505
Deferred taxes without impact on profit or loss -5,011 1,899 -6,910
Other net income for the period 20,823 -10,386 31,209
17 Total consolidated earnings 80,057 25,174 54,882
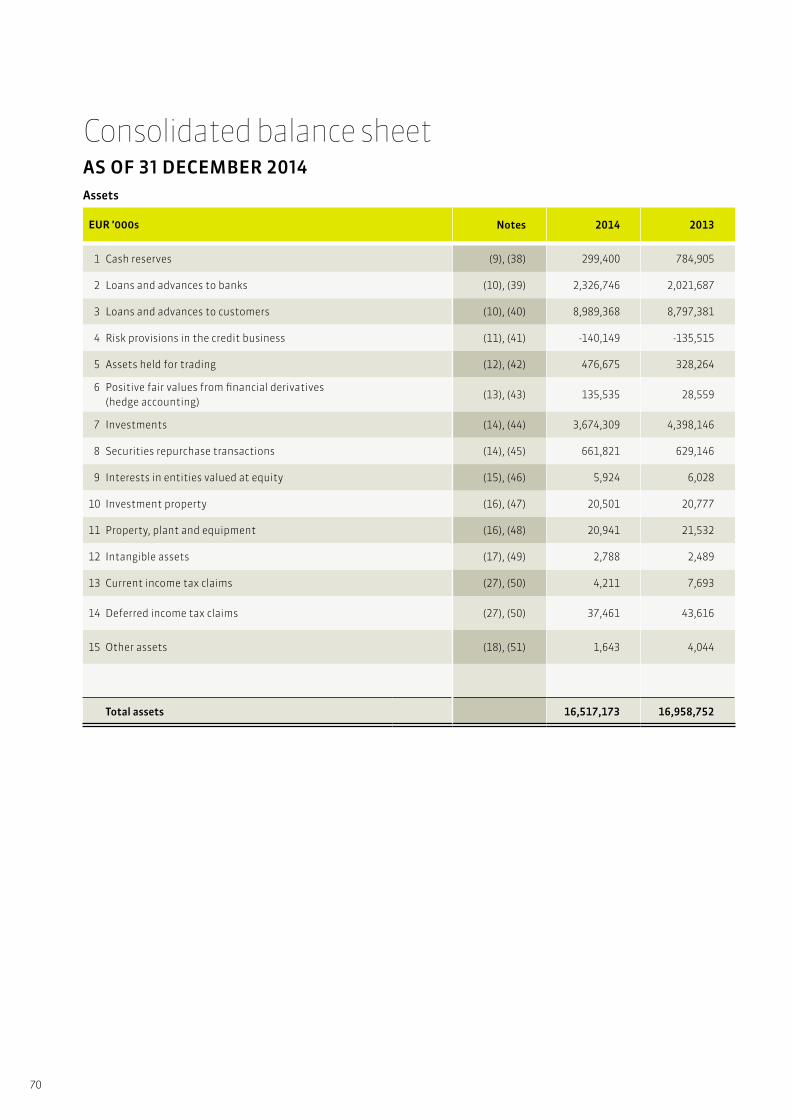
70
Consolidated balance sheet AS OF 31 DECEMBER 2014Assets
EUR ’000s Notes 2014 2013
1 Cash reserves (9), (38) 299,400 784,905
2 Loans and advances to banks (10), (39) 2,326,746 2,021,687
3 Loans and advances to customers (10), (40) 8,989,368 8,797,381
4 Risk provisions in the credit business (11), (41) -140,149 -135,515
5 Assets held for trading (12), (42) 476,675 328,264
6 Positive fair values from financial derivatives (hedge accounting)
(13), (43) 135,535 28,559
7 Investments (14), (44) 3,674,309 4,398,146
8 Securities repurchase transactions (14), (45) 661,821 629,146
9 Interests in entities valued at equity (15), (46) 5,924 6,028
10 Investment property (16), (47) 20,501 20,777
11 Property, plant and equipment (16), (48) 20,941 21,532
12 Intangible assets (17), (49) 2,788 2,489
13 Current income tax claims (27), (50) 4,211 7,693
14 Deferred income tax claims (27), (50) 37,461 43,616
15 Other assets (18), (51) 1,643 4,044
Total assets 16,517,173 16,958,752

71
CORPORATE REPORT 2014 | CONSOLIDATED BALANCE SHEET
Liabilities
EUR ’000s Notes 2014 2013
1 Liabilities to banks (20), (52) 4,880,332 5,748,734
2 Liabilities to customers (20), (53) 4,644,753 4,759,091
3 Securitised liabilities (20), (54) 5,196,321 4,939,714
4 Liabilities held for trading (21), (55) 542,589 432,882
5 Negative fair values from derivative financial instruments (hedge accounting)
(22), (56) 27,620 29,517
6 Provisions (23), (57) 47,467 37,779
7 Current income tax liabilities (27), (58) 14,026 6,684
8 Deferred income tax liabilities (27), (58) 69,277 55,886
9 Other liabilities (24), (59) 38,485 43,677
10 Subordinated capital (25), (60) 308,840 319,937
11 Shareholders’ equity (61) 747,465 584,851
Subscribed capital (61) 274,619 174,600
Hybrid capital (25), (61) 62,107 72,413
Capital reserve (61) 69,085 69,085
Retained earnings (61) 237,612 211,024
Other reserves (44), (61) 51,309 30,486
Consolidated profit (61) 52,733 27,243
Total liabilities 16,517,173 16,958,752

72
Schedule of changes in equity
EUR ’000s Subscribed capital
Hybrid capital
Capital reserve
Retained earnings
Other reserves
Consolidat-ed profit
Consolidat-ed share-holders’ equity
as of 1/1/2013 169,114 91,453 50,841 154,348 40,872 50,522 557,150
Change in other reserves
Items not reposted to the income statement - - - - -1,112 - -1,112
Items reposted to the income statement - - - - -9,274 - -9,274
Total changes taken directly to equity - - - - -10,386 - -10,386
Consolidated net profit/loss - - - - - 35,560 35,560
Total consolidated profit - - - - -10,386 35,560 25,174
Capital increase/conversion of silent reserves 5,486 -9,733 18,244 - - - 13,997
Change due to deferred taxes (hybrid capital) - - - 6,154 - - 6,154
Allocations to/withdrawals from re-tained earnings - - - 50,522 - -50,522 -
Decrease in hybrid capital instruments - -9,307 - - - - -9,307
Distributions on silent partner contri-butions and profit participation rights - - - - - -8,317 -8,317
as of 31/12/2013 174,600 72,413 69,085 211,024 30,486 27,243 584,851
as of 1/1/2014 174,600 72,413 69,085 211,024 30,486 27,243 584,851
Change in other reserves
Items not reposted to the income statement - - - - -5,682 - -5,682
Items reposted to the income statement - - - - 26,505 - 26,505
Total changes taken directly to equity - - - - 20,823 - 20,823
Consolidated net profit/loss - - - - - 59,234 59,234
Total consolidated profit - - - - 20,823 59,234 80,057
Capital increase 100,019 - - - - - 100,019
Allocations to/withdrawals from re-tained earnings - - - 26,588 - -27,243 -655
Decrease in hybrid capital instruments - -10,306 - - - - -10,306
Distributions on silent partner contributions and profit participation rights
- - - - - -6,501 -6,501
as of 31/12/2014 274,619 62,107 69,085 237,612 51,309 52,733 747,465

73
CORPORATE REPORT 2014 | SCHEDULE OF CHANGES IN EQUITY & CASH FLOW STATEMENT
Cash flow statement
EUR ’000s 2014 2013
Consolidated net income for the year 59,234 35,560Non-cash items included in the consolidated net income for the year andreconciliation to cash flow from operating activitiesWrite-downs, impairments and write-ups on receivables, property, plant and equipment, investments, intangibles and investment properties 19,307 24,164
Changes in provisions 1,383 269
Changes in other non-cash items -54,622 -37,574
Gains on sales of non-current assets -1,645 1,853
Other adjustments -107,434 -94,884
Subtotal -143,010 -106,172
Change in assets and liabilities after adjusting for cash items
Loans and advances to banks -304,758 1,220,941
Loans and advances to customers -302,991 216,995
Assets held for trading -105,734 210,681
Other operating assets 2,401 -206
Liabilities to banks -868,604 -247,798
Liabilities to customers -114,337 -1,139,084
Securitised liabilities 258,797 -174,565
Liabilities held for trading 109,706 -212,449
Other operating liabilities -5,192 -6,717
Positive/negative fair value of hedging derivatives -9,690 -1,869
Interest paid -398,159 -450,172
Interest received 529,259 587,865
Dividends received 2,898 2,990
Income tax paid/reimbursed 16,017 -15,352
Cash flow from operating activities -1,280,665 -79,353
Inflows from sale/repayment of investments 2,226,859 1,528,186
Inflows from disposal of property, plant and equipment, investment properties andintangibles 74 468
Outflows for purchase of investments -1,496,834 -1,306,055
Outflows for purchase of property, plant and equipment, investment properties andintangibles -1,925 -2,519
Cash flow from investing activities 728,174 220,080
Payments received from capital additions 0 2,527
Use of funds from subordinated capital (payment) -22,073 -27,650
Cash flow from financing activities 66,985 -25,124
Cash and cash equivalents at end of previous period 784,905 669,302
Cash flow from operating activities -1,280,665 -79,353
Cash flow from investing activities 728,174 220,080
Cash flow from financing activities 66,985 -25,124
Cash and cash equivalents at end of period 299,400 784,905

74
Notes to the consolidated financial statements of SaarLB ...............................................................76Accounting policies ............................................................................................................................77
(1) General principles ...................................................................................................................................77(2) Principles of consolidation .................................................................................................................. 80(3) Scope of consolidation ......................................................................................................................... 80(4) Information on joint venture companies and associates ................................................................ 81(5) Disclosures on structured entities ..................................................................................................... 83(6) Currency translation ............................................................................................................................. 85(7) Offsetting ............................................................................................................................................... 86(8) Financial instruments .......................................................................................................................... 86(9) Cash reserves ......................................................................................................................................... 93(10) Receivables ........................................................................................................................................... 94(11) Risk provisions in the credit business ............................................................................................... 94(12) Assets held for trading ........................................................................................................................ 94(13) Positive market value of derivative financial instruments (hedge accounting) ........................ 94(14) Investments ......................................................................................................................................... 94(15) Interests in entities valued at equity ............................................................................................... 94(16) Investment property/property, plant and equipment ................................................................... 94(17) Intangible assets ................................................................................................................................. 95(18) Other assets ......................................................................................................................................... 96(19) Non-current assets held for sale and disposal groups ................................................................... 96(20) Liabilities ............................................................................................................................................. 96(21) Liabilities held for trading .................................................................................................................. 96(22) Negative fair values from derivative financial instruments (hedge accounting) ...................... 96(23) Provisions ............................................................................................................................................. 96(24) Other liabilities ................................................................................................................................... 98(25) Hybrid capital ...................................................................................................................................... 98(26) Leasing transactions .......................................................................................................................... 99(27) Taxation ................................................................................................................................................ 99
Segment reporting ...........................................................................................................................100Disclosures on the comprehensive income statement .................................................................... 104
(28) Net interest income ...........................................................................................................................104(29) Shares of profits in associated companies accounted for using the equity method ...............105(30) Risk provisions in the credit business .............................................................................................105(31) Net commission income ....................................................................................................................106(32) Gains or losses on fair value measurement ....................................................................................107(33) Gains/losses on hedge accounting ..................................................................................................107(34) Gain/loss on investments .................................................................................................................108(35) Administrative expenses ..................................................................................................................109(36) Other income ...................................................................................................................................... 110(37) Income taxes ........................................................................................................................................ 111
Notes to the balance sheet ...............................................................................................................113(38) Cash reserves .......................................................................................................................................113(39) Loans and advances to banks ...........................................................................................................113(40) Loans and advances to customers ...................................................................................................113(41) Risk provisions in the lending business ............................................................................................115
Group Notes to the consolidated financial statements 2014

75
CORPORATE REPORT 2014 | NOTES
(42) Assets held for trading .......................................................................................................................117(43) Positive market value of derivative financial instruments (hedge accounting) ........................118(44) Investments .........................................................................................................................................118(45) Securities repurchase transactions ..................................................................................................121(46) Interests in entities valued at equity ...............................................................................................121(47) Investment property ..........................................................................................................................121(48) Property, plant and equipment ....................................................................................................... 123(49) Intangible assets ................................................................................................................................ 123(50) Current and deferred income tax claims ........................................................................................ 124(51) Other assets ........................................................................................................................................ 125(52) Liabilities to banks ............................................................................................................................126(53) Liabilities to customers ....................................................................................................................126(54) Securitised liabilities ......................................................................................................................... 127(55) Liabilities held for trading ................................................................................................................ 127(56) Negative fair values from derivative financial instruments (hedge accounting) ..................... 128(57) Provisions ............................................................................................................................................128(58) Current and deferred income tax liabilities ....................................................................................131(59) Other liabilities ...................................................................................................................................131(60) Subordinated capital ........................................................................................................................ 132(61) Shareholders’ equity .......................................................................................................................... 133
Notes on financial instruments ....................................................................................................... 139(62) Fair value of financial instruments .................................................................................................139(63) Level information for financial instruments measured at fair value ......................................... 143(64) Financial instrument measurement categories ............................................................................ 147(65) Net gains or losses on financial instruments ................................................................................. 148(66) Derivative transactions..................................................................................................................... 149
Notes to the cash flow statement ....................................................................................................151(67) Notes to items in the cash flow statement .....................................................................................151
Other notes ...................................................................................................................................... 152(68) Subordinated assets.......................................................................................................................... 152(69) Assets and liabilities in foreign currencies ..................................................................................... 152(70) Transferred, but not fully written-off financial assets ................................................................. 152(71) Transferred, fully written-off financial assets ................................................................................ 153(72) Assets pledged as collateral ............................................................................................................. 153(73) Collateral received that may be sold on or pledged on ................................................................. 154(74) Leasing transactions ......................................................................................................................... 154(75) Fiduciary transactions....................................................................................................................... 155(76) Contingent liabilities and other obligations.................................................................................. 155(77) Other financial obligations ...............................................................................................................156(78) List of SaarLB’s shareholdings .........................................................................................................156(79) Administrative bodies of SaarLB .....................................................................................................159(80) Related party disclosures .................................................................................................................161(81) Auditors’ fees ...................................................................................................................................... 164(82) Employees ........................................................................................................................................... 164
Responsibility statement by the Board of Management ................................................................. 165

76
The consolidated financial statements for Landesbank Saar, Saarbrücken, a corporation established under public law (hereinafter SaarLB), for financial year 2014 have been prepared in accordance with International Fi-nancial Reporting Standards (IFRS), pursuant to Commission Regulation 1606/2002 of the European Parliament and of the Council dat-ed 19 July 2002 and in conjunction with Sec-tion 315a (1) of the German Commercial Code (HGB). In addition to the IFRS-defined stand-ards, IFRS also comprise the International Accounting Standards (IAS), the interpreta-tions of the International Financial Reporting Interpretations Committee (IFRIC) and the Standing Interpretations Committee (SIC). All standards and interpretation which are man-datory in the EU for the financial year 2014 have been applied. SaarLB did not apply any standards prematurely. In addition, German Accounting Standards (DRS) 20 was applied with respect to the management report and the risk report.
The consolidated financial statements con-tain the statement of comprehensive income, consisting of the income statement with an effect on profits and losses and without an ef-fect on profits and losses, the balance sheet, the schedule of changes in equity, the cash flow statement, the Notes and the segment reporting. The reporting currency is the euro.
Unless explicitly stated otherwise, all amounts are given in thousands of euro (EUR ’000s). Figures in the tables may be rounded by +/- one unit. The reported amounts in the tables are not normally preceded by a symbol if it is clear from the context.
Saarland holds 74.90% and the Sparkassen-verband Saar (Saarland Savings Bank Associ-ation) 25.10% of the shares in SaarLB as of 31 December 2014.
The Group management report, which in-cludes the risk report, has been published in a separate section of the annual report.
Notes to the consolidated financial statements of SaarLB

77
CORPORATE REPORT 2014 | NOTES
(1) GENERAL PRINCIPLES
The consolidated accounts of SaarLB are drawn up using consistent accounting poli-cies across the Group. The accounting policies are based on the assumption that the Group is a going concern.
Income and expenses are accrued pro rata temporis and recognised in the income state-ment in the period to which they are econom-ically relevant.
Estimates and measurements required for accounting and valuation under IFRS are carried out in accordance with the relevant standards. They are examined on an ongoing basis and are based on past experience and other factors such as expectations of future events. The assumptions and estimates es-sentially relate to the calculation of the fair values of certain financial instruments, the identification and calculation of impairments under IAS 39, the accounting treatment and measurement of provisions and the realisabil-ity of future tax reliefs. Where there are risks and uncertainties resulting from estimates to a large extent, the relevant assumptions are shown in the notes to the corresponding items.
Assets are recognised when it is probable that the SaarLB Group will derive a future econom-ic benefit from them and the cost of acquisi-tion or production can be reliably determined.
Debts are recognised when it is probable that satisfaction of a current obligation will result in an outflow of economically useful resourc-es and the amount required to do so can be reliably determined.
Effects of new and amended IFRS
Standards and interpretations that must be applied for the first time in the reporting period
In the reporting period, it was necessary to apply the accounting standards for IFRS 10 “Consolidated financial statements”, IFRS 11 “Joint arrangements”, IAS 27 “Separate finan-cial statements”, IAS 28 “Interests in associ-ates and joint ventures”, IFRS 12 “Disclosures of interests in other entities”, amendments to IAS 19 “Employee benefits”, amendments to IAS 32 “Offsetting financial assets and lia-bilities”, amendments to IAS 36 “Impairment of assets”, and amendments to IAS 39 “Nova-tion of derivatives and continuation of hedge accounting” for the first time.
The new standard IFRS 10 (Consolidated finan-cial statements) contains requirements for the consolidation of companies and replaces the previous standard IAS 27 and the inter-pretation SIC 12. The most significant change results from the new definition of the term control. The standard amends the definition of “control” such that the same criteria are ap-plied to all companies for the determination of the circumstance of control. In accordance with IFRS 10, there is control when the compa-ny possesses decision-making power to con-trol the other company’s relevant activities, has a right to significant variable returns and has the ability to use its decision-making pow-er to influence the amount of the significant variable returns. There was no need to make adjustments to the group of fully consolidat-ed companies from the first-time application of this standard. In addition, we refer to the information on the group of consolidated companies (Note 3).
The new standard IFRS 11 (Joint arrangements) governs the accounting of joint ventures and joint activities if at least two companies exer-cise joint control. The previous standard IAS 31 and the interpretation SIC 13 are replaced as a result.
Due to the amendment of the definition on account of IFRS 11, there are now two kinds of joint arrangements:• joint venture companies and• joint venture activities.
Accounting policies

78
The most important amendment is the dis-continuation of the proportionate consoli-dation (see IAS 28, rev. 2011, in the following). Partnership companies for a joint venture now have to measure their investment at eq-uity. Companies that are invested in joint ven-ture activities are subject to the rules that are comparable with the previously applicable accounting provisions for joint assets or joint activities (proportionate inclusion of the as-sets, liabilities, expenses and income). There was no need to make significant adjustments to the group of companies measured at equi-ty on account of the first-time application of this standard.
IAS 28, rev. 2011 (Interests in associates and joint ventures): IFRS 11 resulted in the elimi-nation of the proportionate consolidation of joint venture companies. Since the joint ven-ture companies are to be considered accord-ing to the equity method pursuant to IAS 28, the application area of IAS 28 was expanded for joint venture companies and the standard renamed accordingly. At the present time, SaarLB has one interest in a joint venture.
The new standard IFRS 12 (Disclosure of inter-ests in other entities) includes the disclosure obligations for IFRS 10 and 11 as well as IAS 28 and will be applied as of 31 December 2014 for the first time in full. IFRS 12 will lead to a re-porting obligation for all equity investments in subsidiaries, joint ventures and associat-ed companies as well as not-consolidated structured units according to one standard. Accordingly, companies must provide quan-titative and qualitative information that make it possible for readers of the financial statements to identify the risks and financial effects connected with the company’s equity investment in the business. Fundamentally, this amendment had an impact on the scope of the information in the notes to the financial statements of the SaarLB Group and will be discussed in more detail under Note 4 and 5.
The amendment in the standard IAS 19 spec-ifies the deduction of contributions by em-ployees from their service expenses within the scope of defined benefit plans. If the con-tributions are independent of the number of years of employment, the recording of the
date when the service is rendered is distribut-ed across the years of employment.
Another clarification of IAS 19 addresses the question of the correct disclosure of the dis-count interest rate for the benefits after the end of employment. In the calculation of the discount interest rate, the used highly-rated corporate bonds should be denominated in the same currency as the payout to be made. There will not be any major impact for SaarLB as a result of this.
The amendments to IAS 32 (Financial instru-ments) relate to the disclosure of the “off-setting of financial assets and liabilities” and contain a clarification of some details in regard to the offsetting of financial assets and liabilities. These continue to be offset as before only if a company has a legal right to the offsetting on the reporting date for the financial statements and confirms that it will ensure a settlement on a net basis or simulta-neously use the sale of the concerned assets to replace the related liability. Rather, the guidelines for “IAS 32 Financial instruments: disclosure” clarify the term “current point of time” and the term “simultaneity”. The clarifi-cation will not have any impact on the finan-cial statements of SaarLB.
The changes to IAS 36 (Impairment of assets) were overhauled in regard to the recoverable amount for non-financial assets and involve the clarification of required information. These clarifications will not have any impact on the financial statements of SaarLB.
The amendments to IAS 39 in regard to the novation of derivatives and the continuation of hedge accounting make it possible for com-panies to use a simplification option in the continuation of hedge accounting. The stat-utory or contractual requirements mean that the required contractual amendments for de-rivatives such as the change to a central clear-inghouse will not lead to a termination of the hedge according to IAS 39. The amendment of IAS 39 will have no impact on SaarLB’s consol-idated financial statements.

79
CORPORATE REPORT 2014 | NOTES
IFRIC 21 (Levies) is an interpretation of IAS 37 (Provisions, contingent liabilities and contin-gent assets), which apply to financial years that begin on or after 17 June 2014. It clarifies that a company first reports levies imposed by a regulatory body when it undertakes the activity that leads to the making of the pay-ment due to the law. Since this solely involves a clarification of an existing rule, SaarLB al-ready applied this practice as of the reporting date 30 June 2014. There were no significant changes for SaarLB as a result of IFRIC 21.
Passed standards and interpretations that are to be applied in the periods following the reporting period and are not applied in advance
The key standards approved, the mandatory effective date and the expected impact on SaarLB are summarised below:
Standard Mandatory application for financial years that begin after 31 December 2014
Description of amendments and impact on SaarLB
IFRS 9 (Financial instruments) 1 Jan. 2018 (published 28 Oct. 2010, amended on 19 Nov. 2013; not yet endorsed)
The new IFRS 9 contains the results of the first revision of IAS 39, which refers to the classification and measurement of financial instruments. Ac-cordingly, when financial assets are recognised, they are to be allocated to the amortised cost category or to the fair value category. Recognition at amortised cost occurs when• the financial asset is held in conformity with the business model in order
to receive contractual cash flows and• the contractual conditions of the financial asset foresee payments at
scheduled dates that represent interest and redemption payments on the outstanding nominal amount.
Financial assets that do not fulfil these conditions are recognised under profit or loss on fair value.A voluntary allocation of financial assets to the fair value category is pos-sible upon recognition if incongruities are eliminated or significantly re-duced with such measurement or disclosure.For the initial recognition of equity instruments that are not held for trad-ing purposes, there is the option of disclosing changes in the value of these financial assets including the gain/loss on disposals not at profit or loss, but rather in the statement of comprehensive income without an impact on profit/loss.Since the business model specifies the respective classification and eval-uation, there is a reclassification obligation in the case of a change in the business model.
Financial liabilities are usually measured at amortised cost. The exceptions to this are the trade portfolios and the financial liabilities for which the fair value option was selected. Credit-risk-related fair value changes in financial liabilities in the fair value option are recognised in accordance with IFRS 9 in other comprehensive income. All other fair value changes continue to be recognised at profit or loss.
IFRS 9 also changes the rules for the reporting of expected counterparty default risks (risk provision). Different from IAS 39, a risk provision is not first created for already incurred losses. Rather, for each financial instru-ment that is measured at amortised acquisition cost, the expected loss over one year is created upon addition as a risk provision. If there is a sig-nificant deterioration in the credit rating of the debtor, but there is still no reason for default, the risk provision for the anticipated losses is created for the lifetime expected loss. If there is a reason for default, the risk provi-sion is calculated on the basis of the cash flows still anticipated.The revised rules for hedge accounting mainly set forth the following amendments:
• Hedge accounting should reflect the risk management in a way that is slightly closer to reality, so that a strong link between risk management and accounting takes place.
• The effectivity test shall only be performed prospectively and qualita-tively in future. The quantitative bandwidth of 80-125% does not apply as a result.
The application of the new IFRS 9 will have a major impact on the classifi-cation and measurement of financial assets and with regard to the calcula-tion of the risk provision in the financial statements of the SaarLB Group. No major impact is anticipated in hedge accounting.

80
SaarLB has refrained from early implementa-tion of any amended or new standards and in-terpretations (partially not yet endorsed) that have been issued by the IASB and the IFRIC and are fundamentally relevant for the SaarLB Group where their use first becomes mandato-ry as of the 2015 financial year or later.
(2) PRINCIPLES OF CONSOLIDATION
All the significant subsidiaries that SaarLB controls directly or indirectly in accordance with IFRS 10 are included in the consolidated financial statements.
The costs of acquisition of the consolidation entities were offset against their equity at the time of acquisition for the consolidation. To date there have been no amounts where the costs of acquisition exceed equity as part of first-time consolidation.
In consolidating the balance sheet and in-come statement and eliminating intragroup gains, all receivables and liabilities, income and expenses and gains arising from intra-group transactions have been eliminated.
Shares in associated companies are valued at equity and shown under the balance sheet item “Interests in entities valued at equity”. Under this method, the cost of acquisition of an investment in an associate is recognised at its acquisition cost at the time of acquisition and subsequently carried over in line with the Group’s share of the associate’s net income or other change(s) in its net assets.
The determination of the group of consolidat-ed companies has been specified by the rules in IFRS 10 since the 2014 financial year. SaarLB
completed a project within the scope of IFRS 10 and undertook an analysis of the relevant units and exposures with regard to a possible consolidation obligation. No changes were identified. SaarLB also examined the impact of the disclosure obligations in accordance with IFRS 12 in another project. The impact is described in the following notes.
(3) SCOPE OF CONSOLIDATION
The group of consolidated companies at SaarLB includes seven (31 December 2013: seven) subsidiaries. These include SaarLB Bankenbeteiligungsgesellschaft mbH, Saar-brücken, LBS Immobilien GmbH, Saarbrücken and special funds that are consolidated in full in accordance with IFRS 10. Three associates (31 Dec. 2013: three) continue to be valued ac-cording to the at-equity method.
Materiality criteria are used to determine SaarLB’s scope of consolidation. In financial year 2014, LBS Immobilien GmbH formed IVS Immobilien Verwaltungsgesellschaft Saar mbH, Saarbrücken, and LBS Gutachter Ge-sellschaft mbH, Saarbrücken. After the two newly formed companies were considered as immaterial subsidiaries on 31 December 2014, there are three (31 Dec. 2013: one) subsidiaries and three (31 Dec. 2013: five) associates nei-ther fully consolidated nor included at equity, since they are insignificant for the net assets, financial position and results of operations of the Group. The accounting and earnings-relat-ed impact of the contractual relationships be-tween Group companies and these excluded companies is contained in the consolidated fi-nancial statements. A joint venture company in accordance with IFRS 11 was identified for the first time in the financial year. Inclusion
Standard Mandatory application for financial years that begin after 31 December 2014
Description of amendments and impact on SaarLB
IFRS 15 (Revenue from con-tracts with customers)
1 Jan. 2017 (published 28 May 2014; not yet endorsed)
IFRS 15 sets when and at what amount an IFRS reporter must report reve-nue. Furthermore, the preparers of the financial statements are required to provide the readers of financial statements with more informative and more relevant information than before. The standard offers a single, prin-ciple-based, five-step model that applies to all contracts with customers. Only insignificant changes are anticipated for SaarLB as a result of IFRS 15.IFRS 15 replaces the following standards and interpretations:IAS 11 “Construction contracts”, IAS 18 “Revenue”, IFRIC 13 “Customer loyal-ty programmes”, IFRIC 15 “Agreements for the construction of real estate”, IFRIC 18 “Transfers of assets from customers”, SIC 31 “Revenue - barter transactions involving advertising”.

81
CORPORATE REPORT 2014 | NOTES
in accordance with the equity method did not take place on account of materiality.
A complete overview of the special funds and associates included in the consolidated finan-cial statements can be found in the list of shareholdings (see Note 78).
Significant limitations
Legal, contractual or regulatory limitations as well as property rights for non-controlling shares may significantly circumscribe the SaarLB Group’s access to assets or their trans-fer in other companies within the Group or with regard to the settling of liabilities of the Group.
As of the reporting deadline, there were no significant shares without controlling influ-ence for the Group. Consequently, there are no significant limitations on account of the property rights for the benefit of these share-holders.
With the exception of the following signifi-cant circumstances, there are no definitive limitations in the SaarLB Group. Assets that were transferred as part of pension transac-tions, collateralised refinancing and for ear-marked means of refinancing as collateral totalled EUR 2,975.3 million. The encumbered assets in accordance with IFRS 12 fundamen-tally match the definition in the Capital Re-quirements Regulation for restricted assets. Assets that must be assigned to the cov-er pool for covered bond issues totalled
EUR 2,902.8 million. These assets may not be transferred within the Group.
In regard to the contractual agreements for granting financial aid, there are separate fi-nancial guarantees that SaarLB grants to a few companies. These are inessential for SaarLB. Furthermore, there are limitations for a non-structured, insignificant associate in the form of a distribution lock so that fi-nancial assets cannot be transferred.
Please refer to Note 78 for the required in-formation about differences between the re-porting deadline for the financial statements of our subsidiaries and for the consolidated financial statements. Please refer to Note 5 for information on the type and change in the risks to consolidated structured entities.
(4) INFORMATION ON JOINT VENTURE COMPANIES AND ASSOCIATES
Significant associates and joint venture companies
Investments in associates and joint venture companies are reported in accordance with the equity method.
The SaarLB Group holds shares in six associ-ates and one joint venture company. Three associates are significant for the Group on ac-count of the carrying value of the sharehold-ing and the proportionate earnings of the shareholding.
Name of company Type of relationship Purpose Headquarters of the company
Share (in %) Included
GeKoBa mbH AssociateDevelopment activity Strategic Saarbrücken 38.00 At equity
GSW mbH AssociateDevelopment activity Strategic Saarbrücken 28.57 At equity
NBV Beteiligungs GmbH
AssociateHolding for investment in Deutscher Sparkassenverlag GmbH
Strategic Hamburg 21.33 At equity

82
Summarised financial information on share-holdings1)
Reconciliation of net assets with carrying value of shareholding
GeKoBa mbH GSW mbH NBV Beteiligungs GmbH
EUR ’000s 31/12/2014 31/12/2013 31/12/2014 31/12/2013 31/12/2014 31/12/2013
Sales revenue 1,306 4,683 2,343 5,681 0 0
Earnings after taxes 7 204 -103 422 2,255 2,271
Other income -1,306 -4,683 -2,343 -5,680 -37 -60
Total earnings 7 204 -103 422 2,218 2,211
EUR million
Total assets 19,630 22,672 15,075 16,464 15,007 19,868
Total liabilities 13,333 16,378 6,765 8,051 11 6
Net assets 6,297 6,294 8,310 8,413 14,996 19,862
GeKoBa mbH GSW mbH NBV Beteiligungs GmbH
EUR ’000s 31/12/2014 31/12/2013 31/12/2014 31/12/2013 31/12/2014 31/12/2013
Net assets1) 6,297 6,294 8,310 8,413 14,996 19,862
Group's share of the capital in the companies (in %) 38.0 38.0 28.6 28.6 21.3 14.3
Group's share of net assets in the companies 2,393 2,392 2,374 2,404 3,199 2,837
Goodwill 1,770 1,769 1,863 1,892 151 -315
Intangible assets 0 0 0 0 0 0
Other adjustments 0 0 0 0 0 0
Carrying value of shareholdings 623 623 511 511 3,047 3,153
1) The financial statements for the respective past periods were only available for the indicated companies.
1) To calculate the carrying value of the shareholdings, the financial statements in the last period were used for the indi-cated companies.

83
CORPORATE REPORT 2014 | NOTES
Insignificant joint ventures and associates
The summarised financial information on the Group’s individually considered, insignificant interest in joint ventures and associates is as follows:
EUR ’000s Insignificant joint ventures Insignificant associates
31/12/2014 31/12/2013 31/12/2014 31/12/2013
Total of Group's interest in the profits or losses from continued business units - - - -
Total of Group's interest in the profits or losses from discontinued business units - - - -
Total of Group's interest in other earnings -14.4 0.4 -148.6 231.8
Total of Group’s interest in overall earnings -14.4 0.4 2,068.7 2,449.1
Additional information on joint venture com-panies and associates
Joint ventures and associates in the SaarLB Group were not subject to any significant lim-itations in terms of the transfer of financial resources, e.g. in credit and loan repayments, during the financial year.
Type and change of risks on account of interest in joint ventures and associates
SaarLB’s joint ventures do not have any con-tingent liabilities or other obligations. There are also no contingent liabilities for associ-ates of SaarLB.
(5) DISCLOSURES ON STRUCTURED ENTITIES
Disclosures on consolidated structured entities
Consolidated structured entities of SaarLB in-clude SaarLB Bankenbeteiligungsgesellschaft mbH, LBS Immobilien GmbH and the inter-ests in the special funds. Besides the two controlling and profit and loss transfer agree-ments at Bankenbeteiligungsgesellschaft
mbH and LBS Immobilien GmbH, there are no other obligations with respect to consolidat-ed structured entities. In the financial year, the SaarLB Group did not provide any finan-cial aid or other support services, nor are any intended in the foreseeable future.
Disclosures on non-consolidated structured entities
Type, purpose and scope of the Group’s equi-ty investment in non-consolidated structured entities
To conduct our business activities, SaarLB uses so-called structure entities that serve a certain business purpose. Structured entities are entities that are designed so that voting rights or similar rights are not definitive for the control of the entity. This is the case, for example, if voting rights refer only to adminis-trative responsibilities and the relevant activi-ties are controlled by contractual agreements.
A structured entity often has some or all of the following characteristics: • Limited activities; • A narrowly interpreted and precisely de-
fined goal;
84
• Insufficient equity in order to finance its activities without subordinate financial support;
• Financing in the form of numerous con-tractually linked instruments for inves-tors in order to bundle credit or other risks (tranches).
Structured entities are usually used at SaarLB for income-generating purposes. They can be formed as capital, investment or partner-ship companies. Structured entities usually finance the acquisition of assets by taking out loans or issuing debt or obtaining equity, which is collateralised by the assets they hold and/or is tied to them. The debt or equity of structured entities can include tranches with different ranks. Typically, structured entities involve securitisation vehicles, leasing prop-erty companies or investment funds.
As described in Note 2 “Principles of consoli-dation”, structured entities will be consoli-dated if the relationship between the Group and the structured entities shows that these entities are controlled by the Group in terms of IFRS 10. The units that are the object of these disclosures in the notes are not consoli-dated since the Group does not have any con-trol over the contracts, financing agreements or other resources. The scope of the Group’s investments in non-consolidated structured entities varies depending on the type of struc-tured entity.
SaarLB holds investments in 17 securitisation companies, 16 leasing property companies or finance companies backed with assets, 3 in-vestment funds and 10 other investments.
In the following, the business activities of the SaarLB Group with non-consolidated struc-tured entities will be described:
Securitisation companiesThe Group holds investments in securitisa-tion companies which are sponsored by third parties and which invest in diversified pools of assets. These include, among other, fixed
income securities, corporate loans, asset backed securities (primarily securitised com-mercial and private real estate loans). The companies finance these purchases through the issuing of various tranches of debt and equity, with their repayment tied to the per-formance of the assets in the vehicle.
Leasing property companies and other financingThe Group provides financial resources for structured entities that can hold a number of different assets. These structured units can be established in the form of financing com-panies or as private investment companies. The financing is collateralised with the assets held.
FundsThe Group can create structured units in order to meet its own or possibly different custom-er requirements in regard to investments in specific assets. A Group company can exercise the function of a fund manager, trustee or an-other function. The financing is collateralised by the underlying assets, which are held by the fund.
Other companiesOther companies include structured entities which are sponsored by third parties and do not fall under the aforementioned categories.
Maximum possible risk of default from non-consolidated structured entities
The maximum possible risk of loss is deter-mined from the type of investment in the non-consolidated structured entity. The maxi-mum possible risk of loss from exposure in the lending business is the carrying value that is reported on the balance sheet. The maximum possible loss from off-balance-sheet transac-tions, such as guarantees, liquidity facilities and loan commitments is determined by their nominal value under IFRS 12. These nominal values do not represent the economic risk since neither the effects from collateralisa-tion and securitisation nor the probability of

85
CORPORATE REPORT 2014 | NOTES
incurring losses are considered. For trading assets, the highest-possible risk of default is determined by the amount of the positive re-purchase values.
Size of structured entities
The type of business activities in a structured entity is determined by their size. The follow-ing performance indicators are viewed as ap-propriate indicators for the valuation of the size of the structured entities: • Securitisation companies: Nominal value
of issued securities if the Group holds its investments in the form of securities, and the nominal value of derivatives, if the in-vestment of the Group occurs in the form of derivatives.
• Leasing property companies and finance companies: fair value of the investment.
• Funds: net asset value or amount of the managed assets if the Group holds shares in the fund.
• Other companies: the fair value.
The following table shows the carrying val-ues of the Group’s investments and the max-imum possible loss that could result from these investments, broken down by type of structured entity. It also provides an indica-tion of the size of the structured entities. The values do not represent the economic risk of the Group from these investments since they do not take any collateral or hedges into ac-count.
Sponsored, non-consolidated structured entities
SaarLB does not sponsor the formation of any structured entities.
(6) CURRENCY TRANSLATION
All assets and liabilities denominated in a foreign currency are translated into the func-tional currency (EUR) at the spot rate on the day of the business transaction on initial recognition. For the translation of currency
EUR ’000s Securitisation companies
Leasing property companies Investment funds Other investments
Assets
Loans and advances to customers - 69,158 22,690 36,243
Investments 34,278 1,777 0 -
Total assets 34,278 70,935 22,690 36,243
Liabilities
Liabilities to customers - 2,906 - 27,413
Total liabilities - 2,906 - 27,413
Off-balance sheet risk positions - 1,978 - -
Total 34,278 70,007 22,690 8,830
Size of structured company 58,470 489,981 1,980,904 10,807
Maximum risk of loss 34,278 70,935 22,690 36,243

86
in subsequent periods, it is necessary to dis-tinguish between monetary and non-mone-tary items when translating currency. Mon-etary assets and liabilities denominated in foreign currencies are translated using the rate on the balance sheet date. In the case of non-monetary items valued at historic cost of acquisition or production, currencies are translated at the historical acquisition rate. Non-monetary items designated at fair value are translated using the rate on the date the fair value was calculated. Gains and losses from monetary items resulting from curren-cy translation are recognised in the income statement.
(7) OFFSETTING
Financial assets and liabilities are offset and reported as a net amount on the balance sheet if SaarLB has a legal right to offset the recorded amounts and report either the bal-ance on a net basis or simultaneously use the sale of the asset in question to replace the lia-bility associated with it.
(8) FINANCIAL INSTRUMENTS
Definition
A financial instrument is an agreement that simultaneously creates a financial asset for one of the contracting parties and a financial liability or equity instrument for the other party.
Recognition and measurement
Financial instruments are recognised on the balance sheet from the date upon which the company reporting becomes a contracting party and is either entitled to obtain con-sideration or required to provide consider-ation.
Normal purchases or sales (spot transactions) of financial assets (regular way contracts) can be recognised either on their trade date or settlement date. Under IAS 39.9, purchases
and sales of financial assets where delivery of the asset takes place in accordance with a specified deadline in line with customary mar-ket practice are deemed to be such contracts. At SaarLB securities are always recognised on their trade date.
Derivatives are recognised on their trade date. Other financial instruments are recognised on their settlement date.
All financial instruments, including financial derivatives, are carried in the balance sheet in accordance with IAS 39 and allocated to cate-gories set out in IAS 39.
Initial recognition of financial instruments is at fair value, which generally corresponds to the consideration (the exit price) paid or re-ceived at the time of acquisition.
Subsequent measurement
Subsequent measurement of financial instru-ments depends on their measurement cate-gories under IAS 39, which differ as follows:
Financial assets and liabilities at fair value through profit or loss:
These include financial instruments and deriv-atives held for trading purposes which do not meet hedge accounting criteria under IAS 39 (held for trading), and financial instruments not held for trading purposes where the fair value option under IAS 39 is used.
Financial instruments held for trading (HfT):
These are measured at fair value and recog-nised in the income statement under gains or losses on fair value measurement. This item also shows realised gains and losses; current income and expenses appear under net inter-est income. Derivatives in hedges do not meet the hedge accounting criteria under IAS 39. They are used for risk management and have not been concluded for trading purposes.

87
CORPORATE REPORT 2014 | NOTES
HfT financial instruments are recognised un-der assets held for trading and liabilities held for trading accordingly.
Financial instruments in the fair value option category (FVO):
The fair value option is used for portfolios of financial instruments managed on a fair value basis in accordance with a documented risk management or investment strategy; this re-lates primarily to securities managed by the securities special funds. For structured prod-ucts which have to be separated the fair value option is also applied to avoid splitting the underlying transaction and the embedded de-rivative. Measurement is at fair value. Gains and losses are recognised in gains or losses on fair value measurement, while current in-come is recognised in net interest income.
Financial instruments designated under the fair value option are included under invest-ments. Financial instruments which would otherwise have to be measured at amortised cost are not categorised under the fair value option.
Investments held to maturity (HtM):
This category covers non-derivative financial assets with fixed or determinable payments, and fixed maturities that the Bank intends and is able to hold to maturity, where an ac-tive market exists for them at the time of recognition or reclassification. Measurement is at amortised cost. Please refer to the com-ments on impairments for the calculation of required write-downs.
These financial instruments are recognised under investments. Current gains and losses and income and expense from amortisation are recognised under net interest income.
Loans and receivables (LaR):
These are non-derivative financial assets with fixed or determinable payments that are not
quoted on an active market. They are meas-ured at amortised cost. Please refer to the comments on impairments for the calculation of required risk provisions and write-downs.
Financial instruments in the LaR category are shown under cash reserves, loans and ad-vances to banks/customers, investments and other assets. Current gains and losses and in-come and expense from amortisation are rec-ognised under net interest income; this also applies for holdings which are part of a hedge under IAS 39. Gains and losses on sale are shown under gains or losses on investments if they relate to investments and under other income/expense if they relate to receivables.
Available for sale financial assets (AfS):
These include any non-derivative financial assets (securities, equity investments) that are classified as available for sale or have not been assigned to any of the categories above. The financial instruments in this category are measured at fair value. Any difference be-tween fair value and amortised cost is shown as a separate item under shareholders’ equity (the revaluation reserve) until the asset is ei-ther sold or matures or a permanent impair-ment (see comments on impairments) has to be recognised at profit or loss. Equity instru-ments for which fair value cannot be reliably calculated are recognised at their costs of ac-quisition less any impairments.
Available for sale financial instruments are in-cluded in investments. Gains/losses on their sale and permanent impairment are report-ed in gains or losses on investments, current income and income and expense from amor-tisation are recognised under net interest in-come; this also applies for holdings that are part of a hedge under IAS 39.
Liabilities measured at amortised cost:
Liabilities measured at amortised cost in-clude financial liabilities not held for trading purposes. They are measured at amortised

88
cost and reported under liabilities to banks/customers, securitised liabilities, other liabil-ities and subordinated capital. Current gains and losses and income and expense from am-ortisation are shown under interest expense.
Fair value
Definition of fair valueIn accordance with IAS 39, all financial instru-ments are measured at fair value for first-time disclosure. In the case of a financial instru-ment that is not classified as measured at fair value through profit or loss, the measurement is to take place with the inclusion of specific transaction costs.
Subsequent measurement of financial in-struments that are classified as measured at fair value through profit or loss or availa-ble-for-sale financial assets constantly takes place at fair value. In this sense, financial instruments measured at fair value through profit or loss include derivatives, instruments held for trading purposes and instruments that were designated as measured at fair val-ue.
Fair value is a market-based and not a com-pany-specific measurement parameter. IFRS 13 defines the fair value as the price that one would receive in an ordinary transaction be-tween market participants in the main mar-ket (or the most advantageous market; see the following section on “Measurement” for a definition of the main market or the most advantageous market) under the current mar-ket conditions on the measurement deadline for the sale of an asset or would have paid for the transfer of a liability.
Accordingly, the fair value of an asset accord-ing to IFRS 13 is the amount that this asset could be sold for between knowledgeable, contractually willing and independent busi-ness partners. The fair value corresponds to the sales price (exit price). For liabilities, the fair value is defined as the price at which the liability could be transferred to a third party
within the framework of an ordinary transac-tion. For the valuation of liabilities, the indi-vidual default risk is also to be taken into ac-count. If collateral is provided by third parties for our liabilities (e.g. guarantees), they are to be taken into account fundamentally in the measurement, since the repayment obliga-tion for the Bank continues to exist.
The fair value takes place according to the requirements of IAS 13. It also includes the conditions for the valuation hierarchy. The re-spective provisions of the standards for finan-cial instruments, including the explanations of IAS 39 on financial instruments, particular-ly the classification to measurement catego-ries, continue to apply.
Measurement at fair value
SaarLB sets the following criteria for meas-urement at fair value: • the specific asset or specific liability that
is the object of measurement, together with its balance sheet unit (i.e., the lev-el on which an asset or a liability is com-bined or broken down for disclosure pur-poses in an IFRS standard.
• the main market (or the most advanta-geous market) for the asset or liability. In order to identify the main market or – if there is no main market – the most advantageous market, it is necessary to take into account all information that is obtained with a reasonable effort. As long as there are no substantial signs to the contrary, the market in which the Bank would normally pursue a transac-tion for the sale of the asset or the trans-fer of the liability is the main market or – if there is no main market – the most advantageous market. If there is a main market for the asset or liability, the fair value measurement represents the price in this market (this price is either directly observable or is calculated by using an-other measurement process), even if the price is potentially more advantageous in another market on the measurement

89
CORPORATE REPORT 2014 | NOTES
deadline. SaarLB had access to its defined main markets (or the most advantageous markets) on the measurement date.
• the measurement process suited for the calculation after taking into account the availability of the data for the derivation of the input parameters that represent the assumptions of the market partici-pants in the setting of the price of the asset or liability and the
• hierarchy level to which the input param-eters are assigned (see below).
Fair value hierarchy and measurement process
In order to increase the comparability and consistency in the fair value measurement and the related disclosures, IFRS 13 specifies a hierarchy for the calculation of the fair val-ue (“fair value hierarchy”) that assigns three levels in the measurement process for the calculation of the input parameters for the fair value. Accordingly, the highest priority is awarded to prices in active markets for iden-tical assets, while the use of unobservable input factors in the measurement models receives the lowest priority. The total classifi-cation of the fair value is based on the lowest level of a used significant input parameter.
The reliable proof for the fair value is the list-ed market price for an identical instrument on an active market (Measurement hierarchy level 1) Whenever such a listed price is avail-able, it is to be used for the measurement of the fair value. The relevant market for the determination of the fair value is fundamen-tally the market with the highest activity (main market). In order to reflect the price at which an asset is exchanged or a liabili-ty can be settled, the assets are measured at the bid price and the liabilities at the ask price. A market for financial instruments is regarded as active if quoted prices are easily and regularly available from an exchange, a broker or a market platform and these prices represent actual, regularly occurring market transactions between knowledgeable, willing
and independent business partners. SaarLB uses the exchange price, the OTC prices of market platforms (e.g. Bloomberg) and the prices on other active markets for the subse-quent measurement of financial instruments measured at fair value and traded on active markets (including securities and derivative exchange-traded contracts).
If no listed prices are available, the meas-urement is based on listed prices for similar assets or liabilities on active markets. If no listed prices for identical or similar financial assets are available, the fair value is calculat-ed by using a suitable measurement model where the included data comes from review-able market sources, as much as possible (Measurement hierarchy level 2). If the fair value is calculated according to measurement methods whose measurement parameters are directly or indirectly (e.g. derived from similar prices) observable on the market and have a significant impact on the calculation of the fair value, then they are allocated to Level 2. Derivatives that are measured solely with parameters observable on the market are to be allocated to Level 2.
While most measurement methods are based on data from reviewable market sources, certain financial instruments are measured by using measurement models that draw on other input values for which there is not sufficiently current reviewable market data. In terms of possible measurement methods, IFRS 13 differentiates between the market approach, the income approach and the cost approach. The market approach includes measurement methods that rely on informa-tion about identical or comparable assets and liabilities. The income approach reflects to-day’s expectations for future payment flows, expenses or income. The income approach also includes option price models. In the cost approach (only permitted for non-financial instruments), the fair value corresponds to the current repurchase costs after taking into account the status of the asset. These meas-urement methods are naturally subject to the
90
assessments of management to a large ex-tent. These non-observable input values can include data that is calculated in the form of approximate values from correlated or histor-ical data. However, market data or data from third parties are used to the greatest possible extent and company-specific input values are used as little as possible (Measurement hier-archy level 3)
If there is no active market for the financial instruments in question, the aforementioned measurement methods are relied on. The in-puts used for this purpose must include all inherent market expectations. Inactive mar-kets are characterised by heavily reduced trading volumes, extremely wide bid/offer spreads and existing arbitration possibilities. If the fair value is calculated with valuation methods where the influence of valuation pa-rameters – that are not based on observable market data – is significant for the fair value, they are allocated to Level 3 of the valuation hierarchy of IFRS 13.
With securities, mainly indicative prices from independent market data providers are used in applying the valuation methods and – where these are not available – prices from other market participants (especially issue ar-rangers). In the process, prices or quotes are obtained from different providers for each financial instrument. The prices provided are compared for plausibility. If in exceptional circumstances only one price is available, a credit analysis is also performed as a plausi-bility check. Where present, prices of securi-ties with similar features, residual maturities and credit ratings are used for plausibility. This approach was used to calculate the fair values of certain securities. In the absence of other sources, fair values of ABS securities were mainly calculated using prices provided by arrangers. Securities that are measured by means of an indicative price fall into Level 3.Valuation models are also used for OTC de-rivatives and equity securities not traded on active markets.
Fair values are also calculated using recog-nised valuation models based on publicly available market inputs and, to a limited ex-tent, internal company data. The valuation models include the net present value method and option pricing models.
The net present value method is used for un-conditional derivative financial instruments (interest rate swaps, interest rate/currency swaps, forward rate agreements and forward foreign exchange transactions). Valuation is based on cash flow structure taking account of nominal values, residual maturities and the agreed interest rate calculation method. Credit default swaps are also treated as un-conditional derivative financial instruments, with expected defaults based on current cred-it spreads also being taken into account.
The cash flow structure of financial instru-ments with contractually agreed fixed cash flows is calculated using the cash flows agreed. For variable rate instruments, cash flows are determined using forward curves.
Discounting uses a yield curve in the same cur-rency and of matching maturity, and a risk-ad-justed spread. Observable market inputs are used where spreads are publicly available.
Material equity securities held as invest-ments that are not traded on active markets are valued using earnings power value analy-sis. Expected cash flows are based on the tar-gets of the entities in question. Non-material holdings and holdings without reliable pro-jected values are carried at amortised cost.
Options and other financial derivatives with option-type characteristics are largely val-ued on the basis of the Black Scholes option pricing model. The following parameters are regularly used in the valuation process: cu-mulative probability distribution function for standard normal distribution, option strike prices, risk-free interest rates (for different currencies and maturities), price volatilities,

91
CORPORATE REPORT 2014 | NOTES
option time to expiry, (as applicable) interest rate and pricing barriers, and probabilities of occurrence. Options include interest rate cap and floor agreements, swaptions and curren-cy options.
The valuation models are therefore used to calculate fair values for accounting purposes for financial instruments in the categories HfT and AfS. Balance sheet items and prod-ucts affected are: • OTC derivatives in assets held for trading • equity instruments held in investments • OTC derivatives in liabilities held for trad-
ing
For the purposes of the notes, all financial in-struments are reported on the balance sheet are measured at fair value in accordance with IFRS 7 in conjunction with IFRS 13 and the ap-plicable calculation procedure is assigned to a three-level hierarchy (Level 1 to 3).
Please refer to Note 62 and Note 63 for the disclosures of the fair values of financial in-struments and their level allocation.
Fair value for first-time recognition and day one profit / loss
In its assessment of whether the fair value corresponds to the transaction price in the first-time recognition, SaarLB examined the characteristic factors in accordance with IFRS 13. Recognition at a fair value deviating from the acquisition costs can only occur under certain conditions. In the year under review, no such circumstances were determined; a potential day one profit or loss did not occur.
Hedge accounting
Interest rate and currency risks are managed using financial derivatives to hedge assets or liabilities in the balance sheet. The different measurement methods possible for the un-derlying transaction and the hedging trans-action can give rise to asymmetric effects in
the income statement which do not reflect economic reality and, most notably, give an improper picture of profitability. Hedge ac-counting can eliminate this accounting mis-match. Hedges that qualify for the hedge accounting in terms of IAS 39 and are desig-nated as such are currently reported solely as fair value hedges and limited to the hedging of interest rate risks. By applying hedge ac-counting, which in respect of the hedged risk provides a valuation of the underlying trans-action through the fair value, the frequency of asymmetric valuations is reduced. All or a portion of an asset or liability in the balance sheet is hedged against a change in fair value due to interest rate risk that could affect the net income for the period. As a precondition for applying hedge accounting a high expect-ed and actual degree of effectiveness is need-ed; i.e. that changes in the fair value of the hedged underlying transactions must stay within a range of 80-125% of the hedged risk and the hedging derivative. Fair value hedge accounting uses micro-fair value hedges. In-terest rate swaps are used as hedging instru-ments. Derivatives used to hedge the fair val-ue of assets and liabilities held on the balance sheet are measured at fair value; changes in value are taken to the income statement. The carrying values of the underlying transactions are adjusted for the measurement gains/loss-es arising from the hedged risk, which are rec-ognised in the income statement.
Both the measurement gains/losses of hedge transactions and measurement gains/losses of underlying transactions are reported in “Gains/loss on hedge accounting” on the in-come statement. Current income from deriv-atives that are part of a hedge and meet the hedging criteria under IAS 39 is recognised under net interest income.
Impairments
At every balance sheet date, SaarLB assesses whether objective indicators of impairment exist for a financial asset. A financial asset is

92
considered to be impaired and an impairment loss to have occurred if: • there are objective indicators of an im-
pairment due to a loss event which oc-curred after the financial instrument was recognised for the first time and no later than the reporting date,
• the loss event has an influence on the es-timated future cash flow of the financial asset or group of financial assets and
• a reliable estimate of the impairment amount can be made.
For financial instruments in the categories LaR, HtM and AfS, SaarLB initially assesses at the individual level whether objective indica-tors of an impairment exist. To this end, cus-tomer relationships and securities issuers are analysed at regular intervals (if there are debt securities and other fixed income securities). The following criteria are specifically regarded as objective indicators of an impairment:
• clear deterioration of financial circum-stances
• expectation of lower future payment streams than those agreed
• default or delay in arranged payments of capital and/or interest, application for de-ferment or extension
• concessions to the borrower for economic or legal reasons in connection with finan-cial difficulties
• breach of agreements material to lending • high probability of insolvency proceedings
or other restructuring of the borrower • rating-related restructuring or reorgani-
sation • disappearance of an active market for
this financial asset due to financial diffi-culties,
• country-specific evidence of impairment • discounts in market prices of more than
15% in comparison to the original buying price.
For receivables, the amount of the specific provision is equal to the difference between the carrying value of the financial instrument concerned and the net present value of ex-pected future cash inflows calculated using the discounted cash flow method and based on the original effective interest rate. The expected cash flows also include cash which may result from the sale of collateral after deducting the costs of take-over and sale. The carrying value of the financial instrument is reduced by means of a specific risk provision, which is shown on the assets side of the bal-ance sheet. The impairment expense is recog-nised in the income statement as part of the risk provisions.
Changes in expected inflows lead to releases from or additions to risk provisions.
For securities in the LaR and HtM categories, the amount of the impairment expense is equal to the difference between the carrying value and the fair value, if there is an active market. The impairment expense is recog-nised as a write-down and shown in gains or losses on investments.
As soon as a receivable or security in the LaR or HtM category is identified as impaired, in-terest income ceases being recognised on the contractual terms. Notwithstanding this, the change in the net present value of expected future cash inflows over time on the basis of the initial effective interest rate (unwinding) is reported under interest income.
For financial instruments in the LaR and HtM categories, portfolio risk provisions are calcu-lated on the basis of historic default probabil-ities for receivables where there are no objec-tive indicators of impairment and for those where, in the case of objective indicators, an individual examination has revealed no need for impairment. Historical default probabil-ities are updated on an ongoing basis in the course of backtesting.

93
CORPORATE REPORT 2014 | NOTES
Country risks (transfer risk) are also reflected through the creation of portfolio risk provi-sions based on country-specific probabilities of default, unless the risks have already been taken into account through specific risk pro-visions.
Irrecoverable financial instruments are derecognised. With receivables this normal-ly involves utilising specific risk provisions. Defaults for which no or insufficient specific provisions have been created were charged to current portfolio risk provisions.
For financial instruments in the category AfS an assessment is also made on each reporting date as to whether objective indicators of im-pairment exist.
For equity instruments classified as AfS, a significant or lasting decline in the fair value of the investment below the costs of acquisi-tion constitutes an objective indicator of an impairment. For debt instruments classified as AfS, the existence of an impairment is de-termined based on the same criteria as for securities in the categories LaR and HtM.
If an impairment exists, the cumulative un-realised loss which previously was reported under shareholders’ equity in the revalua-tion reserve has to be reallocated to the in-come statement for the reporting period and recognised under gains or losses on invest-ments. The amount to be reclassified from the revaluation reserve is the difference be-tween the amortised cost and the current fair value.
Where there is no further reason for impair-ments on debt instruments, these are re-versed through the income statement up to a maximum of amortised cost. Increases in the value of equity instruments may only be reversed after prior impairment against the revaluation surplus directly to equity.
Derecognition
Financial liabilities are derecognised when the contractual rights to cash flows from the respective assets expire or the financial asset is transferred and the transfer meets the cri-teria for a disposal in accordance with IAS 39. A transfer in accordance with IAS 39 occurs when the contractual rights to the cash flows from the financial asset are transferred to a third party or the cash flows are forwarded to a third party in accordance with IAS 39.19. If such a transfer occurs, the financial asset is derecognised when the Group has transferred fundamentally all the rewards and risks from the financial asset. Financial liabilities are derecognised when the contractual obliga-tions are settled, removed or expire.
Transfers that do not meet the criteria for derecognition at SaarLB include in particu-lar real securities repurchase transactions and securities-lending transactions. Since all the risks and rewards connected with own-ership are primarily retained in these cases, the transferred assets continue to remain in full on the balance sheet and are disclosed in a separate item (Note 45). The equivalent values received from real repurchase trans-actions as well as accepted cash collateral are disclosed as liabilities under liabilities to banks/customers.
Please refer to the explanations under “Assets pledged as collateral” (Note 72) for the trans-ferred assets that continued to be recognised.
(9) CASH RESERVES
The cash reserves include cash on hand and deposits at central banks. Disclosure was at nominal value.

94
(10) RECEIVABLES
Loans to banks and customers involve non-de-rivative financial assets with fixed or determi-nable payments that are not quoted on an ac-tive market and not held for trading purposes. Measurement is at amortised cost unless the receivable is not an underlying transaction in an efficient fair-value hedge. Premiums, dis-counts and fees which are part of the effec-tive interest rate of the financial instruments are spread over the fixed interest period and reported in interest income.
Impairments on receivables are recognised in a separate risk provision in the balance sheet and offset against the value of the asset.
(11) RISK PROVISIONS IN THE CREDIT BUSINESS
The risk provisions for receivables are deduct-ed from assets; the item includes specific risk provisions and portfolio risk provisions for re-ceivables.
Expenses for allocations to risk provisions, in-come from the release of risk provisions and receipts on receivables written off are report-ed under risk provisions in the income state-ment.
(12) ASSETS HELD FOR TRADING
Assets held for trading contain exclusively financial derivatives with positive fair values not designated as hedging instruments under IAS 39. Measurement is at fair value. Measure-ment gains/losses and realised gains/losses on assets held for trading are recorded in the income statement under gains or losses on fair value measurement; current gains/losses, with the exception of gains/losses from credit derivatives (premium payments), are recog-nised in net interest income.
(13) POSITIVE MARKET VALUE OF DERIV-ATIVE FINANCIAL INSTRUMENTS (HEDGE ACCOUNTING)
This item contains financial derivatives with positive market values which are used as hedges and meet the hedge accounting crite-ria of IAS 39. These derivatives are measured at fair value. Both changes in the fair value of hedging instruments and changes in the fair value of underlying transactions which result from the hedged risk are shown under gain/loss on hedges. Interest income and expense from hedging derivatives are recognised in net interest income.
(14) INVESTMENTS
Investments comprise investments in the categories HtM, LaR, FVO and AfS. Shares in non-consolidated subsidiaries and associated companies not consolidated under the equity method are reported under available for sale investments. Measurement of investments varies according to the valuation category to which they belong. The impairments to be made are identified in accordance with the cri-teria set out in Note 8.
(15) INTERESTS IN ENTITIES VALUED AT EQUITY
Interest in entities valued at equity include the shareholdings in four companies valued accordingly (cf. Note 46).
(16) INVESTMENT PROPERTY/PROPERTY, PLANT AND EQUIPMENT
Investment property includes land and build-ings rented to third parties or primarily held to achieve an increase in capital value. Proper-ty, plant and equipment comprises land and buildings for own use and operating fixtures and fittings. Where properties are used for both purposes, the different portions are nor-mally accounted for separately as financial in-vestments or property, plant and equipment. If the portions cannot be separately sold or

95
CORPORATE REPORT 2014 | NOTES
let, the properties are only regarded as invest-ment property if the portion used for own purposes is insignificant.
Measurement of property, plant and equip-ment and real estate held as an investment is at cost of acquisition or production, which in the case of depreciable assets is reduced on a straight line basis in accordance with useful life.
The useful life is determined according to the expected rate at which future economic use is exhausted and therefore factors in physical wear and tear; technical or commercial obso-lescence is taken into account independently of expected physical wear and tear.
For the determination of the useful life, ad-ditions to buildings (not incl. property) are broken down into their main components. In the subsequent measurement, these compo-nents of property, plant and equipment are to be depreciated separately if they
• are significant in proportion to the total acquisition and manufacturing costs of the property, plant and equipment and
• differ from each other with regard to their length of use and depreciation methods.
The identification of the components and the assessment of the essentiality are required at the time of the first measurement of the asset for the execution of the component approach. The applicable methodology for the identification of the components and the subsequent distribution of the total costs of property, plant and equipment for the main components is to be handled in accordance with prudent business judgement. As a rule, an estimate is required in the event of an ac-quisition of property, plant and equipment. Individual utilisability of a component is not required for this.
The buildings (not incl. property) at SaarLB are divided into the following components with the following useful lives:
Skeleton construction/ supporting structure 90Roof 40Facade 40Windows 30Electrical installation 30Heating / air-conditioning system 20Sanitation (including sanitary objects) 30Interior expansion 20Grounds 40
With regard to individual buildings for the reconstruction/renovation measures, i.e. if major renovations are made, capitalisation of these measures occurs unless their costs are inessential. Ongoing maintenance costs are taken to the income statement.
The useful life of the operating and office equipment is between 3 and 15 years.
An impairment charge is recognised in cases of permanent impairment (according to IAS 36) and is the difference between the (higher) carrying value and the recoverable amount. Where the reasons for impairments no longer apply, they are reversed, up to a maximum of cost of acquisition or production. The impair-ment process applies to components of an as-set accordingly.
Impairments on investment property are shown under other income/expense, impair-ments on property, plant and equipment are reported under administrative expenses. Re-versals appear under other income.
(17) INTANGIBLE ASSETS
The only intangibles are purchased software.Intangibles are carried at amortised cost and depreciated on a linear basis over an expected useful life of between three to five years.
An impairment charge is recognised in cases of permanent impairment. Where the reasons for impairments no longer apply, they are re-versed, up to a maximum of cost of acquisi-tion or production.

96
Depreciation of intangibles is disclosed under administrative expenses. Reversals appear under other income.
(18) OTHER ASSETS
Other assets include prepaid expenses and miscellaneous assets.
(19) NON-CURRENT ASSETS HELD FOR SALE AND DISPOSAL GROUPS
The SaarLB Group classifies non-current as-sets and disposal groups as being held for sale when the intention is to realise their carrying value by selling them. Conditions for catego-rising assets as being held for sale include: the fact that the asset is immediately realisable in its current condition; that there is a plan for disposal; that an active search for a buyer has started; and that the sale is expected to be completed within one year of the time of classification and that the price is reasonable in relation to the current fair value.
Non-current assets and disposal groups classi-fied as held for sale are measured at the low-er of carrying value and fair value less selling costs; financial instruments falling within the scope of IAS 39 are measured according to the principles set out in IAS 39.
Operating gains and losses are reported un-der the same item in the income statement as they would have been were there no in-tention to sell. Impairments are recognised when fair value less selling costs is less than carrying value. These are shown under other income/expense.
There were no non-current assets held for sale or disposal groups as of 31 December 2014.
(20) LIABILITIES
Liabilities to banks and customers and se-curitised liabilities are measured at amor-tised cost where they are not underlying transactions in an effective fair value hedge.
Premiums and discounts are spread over the fixed interest period on a constant effective yield basis and recognised under interest ex-pense in the income statement.
(21) LIABILITIES HELD FOR TRADING
Liabilities held for trading contain exclusively financial derivatives with negative fair values not designated as hedging instruments un-der IAS 39. Measurement is at fair value. The measurement and recognised gain/loss on as-sets held for trading are recognised in the in-come statement under gains or losses on fair value measurement. The ongoing gains/losses are reported in the net interest income, with the exception of credit derivatives, which are also reported in fair value gains/losses.
(22) NEGATIVE FAIR VALUES FROM DERIVATIVE FINANCIAL INSTRUMENTS (HEDGE ACCOUNTING)
This item contains financial derivatives with negative market values which are used as hedges and meet the hedge accounting crite-ria of IAS 39. These derivatives are measured at fair value. Both changes in the fair value of hedging instruments and changes in the fair value of underlying transactions which result from the hedged risk are shown under gain/loss on hedges. Interest income and expenses from hedging derivatives are recognised as those of the underlying transactions in net interest income.
(23) PROVISIONS
This item shows the provisions for pensions and similar obligations and other obligations as well as other provisions.
Different pension plans exist in the SaarLB Group.
On the one hand, members of the Board of Management receive individual pension com-mitments. Former members of the Board of Management (currently 7 retirees) receive

97
CORPORATE REPORT 2014 | NOTES
pensions. The current and future pensions de-pend on the base salary. The risks from these pension plans consist primarily of biometric risks and the actually occurring salary and pension developments in comparison to the assumptions. There are no unusual risks. Spe-cial investment strategies that are specifical-ly intended for the existing obligations do not exist due to the low number of current and future recipients.
Furthermore, seven employees received pen-sion commitments through so-called fee con-version, which are financed in the form of re-insurance. There were no risks.
The defined benefit plans – management commitments and remuneration converted to pensions – have set benefits which are pro-vided in the event of retirement or disability and to surviving dependants in the event of death, and which depend on multiple factors such as age, length of service and salary.
Pension obligations are calculated annually in an actuarial report.
The pension provisions were calculated on the basis of the following actuarial assumptions:
The Heubeck 2005G mortality tables are used as biometric parameters.
The amount of the pension obligations is calculated using the projected unit credit method, whereby they are measured on the basis of the defined benefit entitlements ac-crued at the balance sheet date. Assumptions about the future trend of certain parameters which affect the value of the benefits, such as increases in salaries and pensions, are taken into account in this measurement.
The determination of the pension accrual is carried over with an impact on profits or loss-es on the basis of the anticipated actuarial parameters at the beginning of the period so that there is usually a difference between the disclosed carrying value and the current actu-arial value which is reported as an actuarial profit or loss and disclosed in other reserves. Deferred taxes are calculated on actuarial profits or losses, which are also taken to equi-ty and reported under other reserves. Actuar-ial profits and losses are not reposted to the income statement.
SaarLB is also a voluntary member of Zusatz-versorgungskasse Saarland (ZVK). The ZVK is a joint pension plan for multiple employers. Members are so-called obligatory members (municipalities, municipality associations and special-purpose associations) and volun-tary members (primarily Saarland, public sec-tor savings banks and other members of the Kommunaler Arbeitgeberverband e. V.).
The financing of the statutory contributions takes place on a pay as you go basis. Due to the inability to go bankrupt and the over-whelming number of members of the ZVK as well as the ZVK itself, SaarLB is actually not liable for the obligations of other employers in the joint benefit plan.
In the case of a departure, SaarLB would have to pay financial compensation at the amount of the cash value of the obligations charged to the ZVK due to the obligatory insurance of SaarLB’s employees. Information on the fi-nancial obligation upon closure of the plan is not available.
in % 2014 2013
Interest rate 2.00 3.50
Increases in salaries 2.50 2.50
Increases in retirement benefits 2.00 2.00
98
SaarLB’s share with regard to the number of insured people in the ZVK amounts to 1%.
Under the terms of IAS 19, the ZVK retirement benefit plan is categorised as a defined ben-efit plan. However, since the Bank does not have access to the information required to ac-count for it as a defined benefit plan and is un-able to obtain this, and under the pay as you go arrangement is also exposed to actuarial risks relating to active and former employees of other members (employers), this pension plan was not treated as a defined benefit pen-sion plan. Accordingly, no provision was creat-ed for the contributions of SaarLB to ZVK in the IFRS consolidated financial statements. In accordance with IAS 19.32 the commitment is recognised for convenience as a defined contribution retirement benefit plan, so the contributions SaarLB pays to ZVK are recog-nised immediately as an expense under staff costs.
From an economic perspective all the pay-ments SaarLB makes to ZVK, i.e. the regular pay as you go contributions and the addition-al “recapitalisation payments”, represent con-tributions towards the ongoing financing of ZVK. They serve neither to settle a past deficit nor to create a capital base. The recapitali-sation payments in particular are in essence simply increased pay as you go contributions. There is no information about any surpluses or shortfalls in the plan which could influence the amount of future contributions.
Other provisions are set up in accordance with IAS 37 for present obligations both le-gal and constructive arising as a result of an event where it is probable that an outflow of resources with economic utility will be re-quired to perform the obligation. It must also be possible to make a reliable estimate of the amount of the outflow of resources.
There are no other long-term provisions to be discounted except for long-term employee benefit provisions.
Provisions have been set up at both the indi-vidual transaction and portfolio level in the credit business to meet contingent liabilities and other liabilities where there is a risk of default.
(24) OTHER LIABILITIES
Other liabilities contains deferred income, other liabilities, accruals and amounts not yet distributed on hybrid capital reported under equity.
(25) HYBRID CAPITAL
Debt and equity instruments are classified in accordance with IAS 32, taking account of IDW recommendation RS HFA 9 dated 11 March 2011 on accounting for financial instru-ments. This states that a financial instrument must be treated as equity if it:
• evidences a residual interest in a share of the assets of an entity after deducting all its liabilities (IAS 32.11)
• and, in particular, it contains no contrac-tual obligation to transfer cash or cash equivalents or other financial assets to the contractual partner (IAS 32.16).
The accounting and measurement methods used in the consolidated financial statements for the contractual terms of the hybrid capi-tal instruments issued by SaarLB are shown below.
Undated silent partnership contributions not recallable by the lender meet the criteria for inclusion under shareholders’ equity if the usual conditions exist.
Silent partnership contributions with a fixed term or recallable by the lender and profit participation rights are compound financial instruments and have to be divided into their equity and debt components (split account-ing). On initial recognition the fair value of the debt component is determined by discount-ing the nominal value of the total compound

99
CORPORATE REPORT 2014 | NOTES
instrument at the agreed effective interest rate. The debt component is shown under subordinated capital. In subsequent years in-terest is accrued on the debt component and the associated expense is recognised in net interest income.
The equity component, which on initial rec-ognition is equal to the net present value of expected future distributions, is shown as hy-brid capital under equity. Distributions are re-ported as part of the appropriation of profit.Subordinated loans and bonds are shown un-der subordinated capital.
(26) LEASING TRANSACTIONS
Under IAS 17, leases are divided into finance leases and operating leases. Agreements are classified on the basis of the distribution of economic risks and rewards from the leased property. A lease is classified as a finance lease if substantially all the risks and rewards associated with ownership are transferred to the lessee; otherwise it is an operating lease. SaarLB is currently only exposed to operating leases.
SaarLB as lessor
The leased assets – primarily land and build-ings – are reported in the balance sheet under investment property and carried at amortised cost. Both leasing instalments received and depreciation and impairments are recorded in other income.
SaarLB as lessee
Leasing payments made under operating leases are recognised as an administrative expense. The assets leased are operating fix-tures and fittings.
(27) TAXATION
Current income tax assets and liabilities are measured by applying currently valid tax rates. Income tax receivables and liabilities
are carried at the amount of the refund or payment due and not discounted.
Deferred tax assets and liabilities arise from timing difference between the different val-ues of assets or liabilities as shown on the balance sheet and their assigned value for taxation purposes. This gives rise to increas-es and decreases in income taxes that can be expected in the future. For each entity in the consolidated financial statement, these are measured at the specific applicable income tax rate expected to be valid when the timing differences are reversed, based on tax legis-lation which is in force or has already been passed.
Due to the split accounting, certain issued instruments are divided between equity and debt components. Since the instruments rep-resent debt in full for tax purposes, deferred taxes are taken to equity upon receipt of the funds. This is then reduced with an impact on earnings to the extent that the difference in amounts will be eliminated in the future. To ensure an accurate reporting of the taxes, the tax expense on the interest portion is deduct-ed from the retained earnings with an effect on income in the following periods.
Deferred taxes are not discounted. Deferred tax assets and liabilities are formed and rec-ognised in the income statement where the underlying transaction is recognised as in-come or expense; where the underlying trans-action does not pass through the income statement they are recognised directly under the respective item in equity.
Income tax expenses and receipts arising from normal operating activities are shown under the income tax in the consolidated in-come statement.
Other taxes not dependent on income appear under other income.

100
Segment reporting is based on the business structure of SaarLB. In total, the Group re-ported on six segments in the past financial year: • Corporate Customers (CC) • Real Estate (RES) • Project Finance (PF) • Savings Banks, Institutionals and High
Net Worth Individuals (SIH) • Treasury (TR) • Landesbausparkasse Saar (LBS)
As notified in 2013, equity investments shall not longer be reported as a separate seg-ment, but rather be summarised under “Other items” due to their decreasing significance.
The segment reporting implements the re-quirements of IFRS 8, according to which the Board of Management acts as the main deci-sion maker in terms of IFRS 8.7 and the exter-nal segment reporting follows the internal reporting and controlling.
The divisional heads in charge of each seg-ment are responsible for earnings and serve as segment managers as defined in IFRS 8.8. The reconciliation contains those amounts that cannot be meaningfully allocated to the operating units. The consolidation col-umn shows the reconciliation of the internal contributions to profits that result from the consolidation of the special funds and the in-vestments valued at equity that are included in the internal accounting on the basis of the calculation.
For 2013 and 2014, the management infor-mation for net interest and net commission income and administrative expenses was calculated on an arithmetic basis (internal accounting) and for the other items using the accounting and valuation methods of IFRS.
Segment assets are loans and advances to banks and customers, bonds reported under investments (known as credit substitute se-curities) and investments. The Reconciliation item mainly contains financial assets used for liquidity management.
Segment reporting as of 31 December 2014
EUR ’000s CC RES PF SIH TR LBS Reconc./Other
positions
Consolida-tion
Total
Net interest income1) 25,034 30,244 24,675 6,457 27,701 17,998 -9,173 -606 122,328
Risk provisions in the credit business -3,377 -6,919 -5,865 4 2,182 -102 -2,091 - -16,169
Net commission income 3,526 944 4,305 4,772 -878 -3,056 -2,696 249 7,167
Gains or losses on fair value measurement2) -260 -576 -181 -313 45,079 - 2,530 - 46,279
Gain/loss on investments - - - - 911 - 14 - 925
Administrative expenses -10,905 -8,412 -6,269 -5,939 -7,424 -12,016 -22,530 18 -73,476
Other income - - - - - 379 540 - 919
Earnings from ordinary operating activities/earnings before taxes 14,017 15,281 16,664 4,982 67,572 3,203 -33,406 -340 87,973
Segment assets 1,906,893 2,637,597 2,001,401 1,596,627 3,746,522 830,690 3,304,262 488,183 16,512,174
1) Including shares of profits in associates accounted for using the equity method2) Including gains/losses on hedge accounting
Segment reporting

101
CORPORATE REPORT 2014 | NOTES
Notes on the definition of segments
SaarLB breaks its business down into multi-ple segments that are mainly reflected in the structural organisation. The segments are de-scribed in the following:
Corporate CustomersThe Corporate Customers segment covers the entire SME business of SaarLB in its target markets. In Germany, this includes Saarland, Rhineland-Palatinate and the adjacent re-gions. In France, SaarLB’s Corporate Customer business is focused on the Grand Est (Grand East) and here in particular on the neighbour-ing Alsace-Lorraine where the Bank is rep-resented by its branch in Metz and its sales office in Strasbourg. The main product in this segment is traditional lending. Furthermore, a full service is provided, primarily by offering investment business and interest rate and currency management as well as the foreign trade and payment transactions in accord-ance with customers’ needs and giving busi-ness advice on how to finance companies. The broad range of products also includes financ-ing for municipalities and municipally-owned companies.
Real estateThe Real Estate segment at SaarLB is respon-sible for the financing of commercial real es-tate. The business activities are limited to the target markets of SaarLB. Business is trans-acted on a bilateral basis or in the form of club deals under the leadership of the Bank. Professional and institutional investors who primarily invest in office and retail real es-tate are the focus in this segment. In France, the market is primarily handled by the Cen-tre d’Affaires Paris, which is a part of SaarLB France. In the German target market, SaarLB acts selectively as a financial service provider for developer measures and for public private partnership (PPP) measures for investments in infrastructure, education or other public construction projects. The Real Estate seg-ment’s regional focus on the German side is in the metropolitan area of the Rhine-Main, while in France it is on the urban centre of the Île-de-France. As in the Corporate Customers segment, credit financing is the main product, although SaarLB’s structuring and cross-bor-der legal expertise are also significant for the success of the business segment. Interest hedges with simple derivatives in the port-folio and new business are concluded with
Segment reporting as of 31 December 2013
EUR ’000s CC RES PF SIH TR LBS Reconc./Other
positions
Consolida-tion
Total
Net interest income1) 22,952 29,787 19,983 4,430 34,632 17,237 -3,492 -4,166 121,363
Risk provisions in the credit business -6,666 -7,095 -7 29 -8,612 -95 2,445 -3 -20,004
Net commission income 3,917 1,543 4,551 3,775 -453 -2,860 -3,130 467 7,810
Gains or losses on fair value measurement2) 94 - - 809 1,056 - 19,880 -1,732 20,107
Gain/loss on investments 115 - - - -2,947 - -435 - -3,267
Administrative expenses -15,134 -8,849 -7,437 -7,410 -10,485 -10,958 -11,403 -226 -71,903
Other income 1 - -1 -1 - 560 652 668 1,879
Earnings from ordinary operating activities/earnings before taxes 5,279 15,386 17,089 1,632 13,191 3,884 4,516 -4,992 55,985
Segment assets 1,778,351 2,713,043 1,790,396 1,817,976 4,285,141 758,462 4,229,821 -414,438 16,958,752
1) Including shares of profits in associates accounted for using the equity method2) Including gains/losses on hedge accounting
102
success, and increasingly payment transac-tions and investment products, too.
ProjectsThe Projects segment at SaarLB is responsible for the financing of projects primarily in the renewable energy sector (RE) but also in the area of public private partnership (PPP) on the French market. In the RE sector, SaarLB acts as a financial service provider for midsized pro-ject initiators and manufacturers that invest in wind and/or solar parks at good locations and with sophisticated technology. Many cus-tomers in the business segment are support-ed across borders. The focus of the segment on the German side is regional in Saarland and Rhineland-Palatinate, while on the French side – due to its very good position on the market – it is the entire country of France. The Bank does not finance offshore wind parks. As in the Corporate Customers and Real Estate segments, credit financing is of critical signifi-cance for the customer relationships and thus the development of business. In addition to SaarLB’s particular Franco-German legal ex-pertise, it also has extensive and long-stand-ing know-how developed under constantly changing market conditions in project analy-sis, the resulting case-specific and cash-flow driven structuring of finance, and SaarLB’s good access to long-term funding, which are viewed as significant key factors for the suc-cess of business over the long term.
Savings Banks, Institutionals and High Net Worth IndividualsThe Savings Banks, Institutionals and High Net Worth Individuals segment handles wealth advisory services and management for savings banks, institutionals and high net worth individuals. The focus of the Savings Banks and Institutionals is on increasing ex-isting customer connections and expanding contacts with insurance companies and pen-sion funds in the region and the business re-lationships to savings banks in Rhineland-Pa-latinate. It also deals with the financing of the region’s savings banks and municipalities. In the sub-segment of high net worth private cus-tomers, the focus is on complete support and advising for wealthy private customers. Last-ly, as a centre of expertise, it actively supports the other segments in customer relationship
management, especially in investment, inter-est rate and currency management.
Treasury & Portfolio ManagementTreasury is responsible for the management of the interest book, the trading activities of the Bank, the collateral pool and collateral management as well as liquidity control and pricing. Portfolio Management is in charge of managing the liquidity account (Securities Ac-count A, collateral account and LCR portfolio), the management of the Bank’s own invest-ments (direct investments and special funds) and the management of the portfolios that are no longer a part of SaarLB’s core business and are being systematically reduced (reduc-tion portfolios).
LBSLandesbausparkasse Saar is a legally depend-ent unit of SaarLB. LBS Saar and its subsidi-aries are a service and excellence centre for “everything related to real estate”, making them an integral part of the Saarland sav-ings banks finance group (Sparkassen-Finan-zgruppe). The main services are home loans and the financing of residential real estate. Another focus of the Bank’s policy is on the financing of energy projects in real estate and investments within the framework of the Ger-man Renewable Energy Act (Erneuerbare-Ener-gien-Gesetz) as well as photovoltaic systems, for example. Additional services range from the management and brokerage of residential and commercial real estate to the preparation of real estate evaluations, energy reports or damage appraisals as well as the brokerage of select network (Verbund) products.
Explanations on the reconciliation and other positions
The Reconciliation item contains circum-stances that are not assigned to any specific segment in the management reporting to the Board of Management (Other positions) and items that are based on the reconciliation of the internal and external accounting (Recon-ciliation).
Interest income contains the most significant positions from the reconciliation of inter-est expenses for the interest-bearing equity

103
CORPORATE REPORT 2014 | NOTES
components netted across the segments in the amount of EUR 6.5 million, which are reported in the appropriation of the result (2013: EUR 8.3 million) and other reconcilia-tion items from internal to external account-ing.
Other positions mainly include trailing neg-ative effects from planned measures in pre-vious years and earnings components not al-located to the segments from income on the investment of equity, the negative margin for hybrid capital and effects from the cancella-tion of interest for impaired loans.
The “Other positions” in this item of the risk provision mainly include EUR -2.1 million (2013: EUR +1.9 million) from the net change in the portfolio adjustment. Since these are not allocated to the segment, there is no alloca-tion to the segments as part of the manage-ment reporting.
In the net commission income, the other po-sitions primarily results from the differences between the internal and external account-ing. They relate mainly to expenses in connec-tion with silent reserves of EUR -2.9 million (2013: EUR -2.9 million).
In the gains/losses on fair value measurement and the gains/losses on hedges, the other items mainly relate only to the gains from the special fund (EUR 4.7 million) and the losses on securities transactions (EUR -2.7 million).
In the previous year, the majority of the fair value gains were not distributed across the segments; the other effects in the fair value gains primarily included profits from interest and currency transactions in the amount of EUR 17.5 million and securities with the appli-cation of the fair value option.
In the past financial year 2014, the fair value gains were largely allocated by origin. This allocation was possible in the preparation of the financial statements since the basis for the data on this was provided for the first time. A retrospective distribution of the fair value gains as of the reporting date in 2013 was not possible as a result.
The Other positions in the gains or losses on investments is mainly influenced by the net change in the portfolio provision for securi-ties in LaR and HtM of EUR +1.4 million (2013: EUR -157,000). In the management informa-tion to the Board of Management, it is not allocated to any segment, similar to the pro-cedure with the risk provision.
The Other positions in administrative expens-es mainly relate to expenses of EUR 22.5 mil-lion (2013: EUR 11.4 million) that could not be allocated to a cause; these primarily result from strategic projects, overhead costs and staff areas. The change in the order of mag-nitude results from the alteration of the al-location system for segments and thus the connected change in a lump sum allocation, particularly in the cost of materials for a cor-rect allocation to the segments in accordance with origin. A retrospective adjustment of the allocation system for 2013 was not possible since the allocation applied in 2014 could not be transferred to the segments in the previ-ous year.
In other income/expenses, the Other posi-tions includes almost exclusively non-allo-catable effects. They mainly result from ten-ant income from buildings not used by the Bank in the amount of EUR 1.3 million (2013: EUR 1.3 million), income from the release of provisions in the amount of EUR 0.8 million (2013: EUR 1.5 million), disposal losses of EUR 0.6 million (2013: EUR 0.8 million) – par-ticularly expenses from the repurchase of own issues – and other expenses in the amount of EUR 0.8 million (2013: EUR 1.0 million).
No further breakdown of the income by indi-vidual product or service is available and the cost of producing such a breakdown would be disproportionately high.
A further breakdown of the segments by re-gion is only undertaken in the internal report-ing for Germany and France with regard to se-lected products. This differentiation is below the segment level and can only be transferred to the segment presentation with dispropor-tionate effort.

104
(28) NET INTEREST INCOME
Total interest income from financial assets and liabilities measured at fair value not through profit and loss was EUR 349,098,000 (2013: EUR 382,178,000) and total inter-est expense was EUR 220,933,000 (2013: EUR 257,116,000). The constant effective yield basis from the distribution of premi-ums, discounts and fees is included in in-terest income, with income reductions of EUR 17,469,000 (2013: EUR 11,961,000) and declining interest expenses of EUR 4,540,000 (2013: EUR 3,043,000). Interest income in 2014 included the release of differing amounts
from the reclassification of securities for EUR 131,000 (2013: EUR 357,000), which were largely compensated by amounts from the release of the revaluation reserve to other re-serves (Note 61).
Disclosures on the comprehensive income statement
EUR ’000s 2014 2013
Interest income 539,330 598,226
Interest income from credit and money market transactions 279,709 302,657
of which: interest income from unwindings 2,474 3,461
Interest income from debt securities and other fixed-interest securities 66,241 85,232
Current income from shares and other non-fixed-interest securities 515 1,463
Current income from non-consolidated subsidiaries and associates as well as other investments 2,540 2,675
Current income from profit pools and profit and loss transfer agreements 125 142
Interest income from derivatives 190,200 206,057
Interest expense 417,001 477,179
Interest expense for liabilities to banks and customers 149,901 181,086
Interest expense for securitised liabilities 50,435 52,486
Interest expense for subordinated capital 6,303 5,759
Interest expense for hybrid capital 10,307 12,989
Interest expense for derivatives 196,068 220,063
Other interest expense 3,988 4,796
Total 122,329 121,047

105
CORPORATE REPORT 2014 | NOTES
(29) SHARES OF PROFITS IN ASSOCIATED COMPANIES ACCOUNTED FOR USING THE EQUITY METHOD
The profits derive from pro-rata recognition of net income for matching periods.
(30) RISK PROVISIONS IN THE CREDIT BUSINESS
The amounts include both on-balance sheet and off-balance sheet credit business.
The appreciation of receivables relates to the receipt of owed exposures.
EUR ’000s 2014 2013
Shares of profits in associated companies accounted for using the equity method
157 316
Total 157 316
EUR ’000s 2014 2013
Allocations 26,718 39,221
Specific risk provisions 24,519 38,997
Risk provisions in the reported lending business 1,260 224
Provisions on the individual business level - -
Provisions on the portfolio level 939 -
Direct depreciation 216 2,662
Releases 8,893 16,552
Specific risk provisions 8,838 13,979
Risk provisions in the reported lending business 52 1,773
Provisions on the individual business level 3 487
Provisions on the portfolio level - 313
Receipts on receivables written off 888 1,006
Appreciation of receivables 984 4,321
Total 16,168 20,004
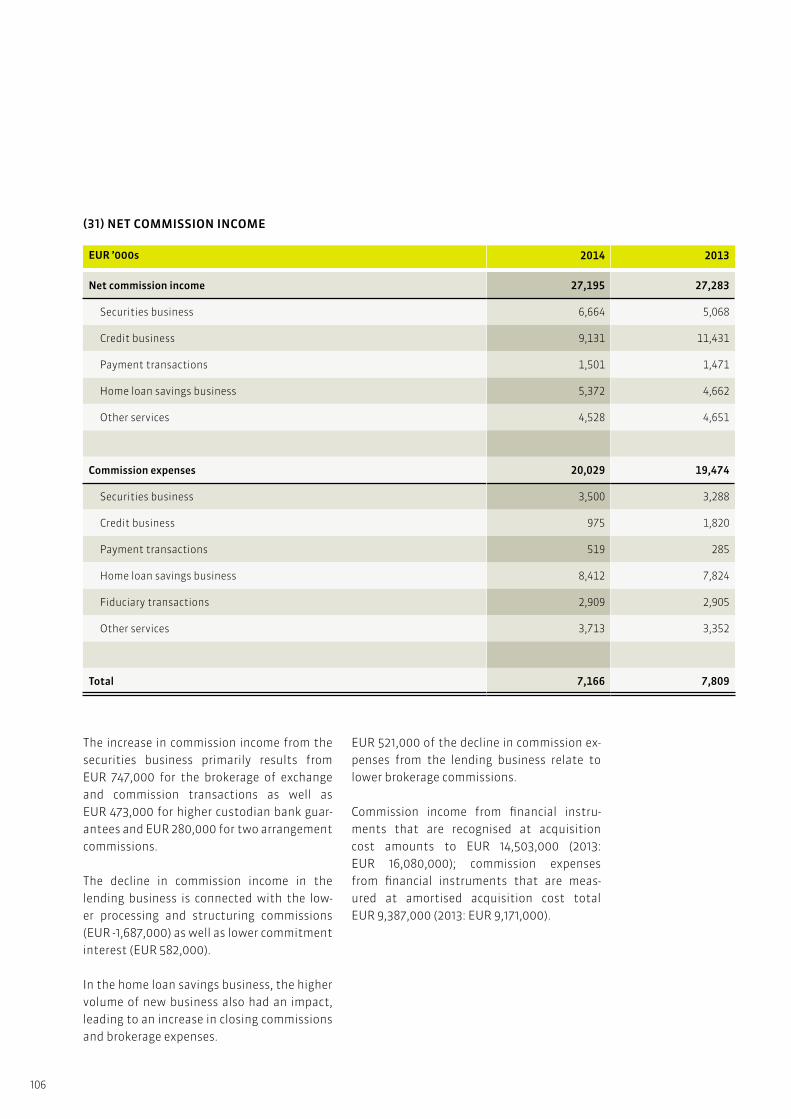
106
(31) NET COMMISSION INCOME
The increase in commission income from the securities business primarily results from EUR 747,000 for the brokerage of exchange and commission transactions as well as EUR 473,000 for higher custodian bank guar-antees and EUR 280,000 for two arrangement commissions.
The decline in commission income in the lending business is connected with the low-er processing and structuring commissions (EUR -1,687,000) as well as lower commitment interest (EUR 582,000).
In the home loan savings business, the higher volume of new business also had an impact, leading to an increase in closing commissions and brokerage expenses.
EUR 521,000 of the decline in commission ex-penses from the lending business relate to lower brokerage commissions.
Commission income from financial instru-ments that are recognised at acquisition cost amounts to EUR 14,503,000 (2013: EUR 16,080,000); commission expenses from financial instruments that are meas-ured at amortised acquisition cost total EUR 9,387,000 (2013: EUR 9,171,000).
EUR ’000s 2014 2013
Net commission income 27,195 27,283
Securities business 6,664 5,068
Credit business 9,131 11,431
Payment transactions 1,501 1,471
Home loan savings business 5,372 4,662
Other services 4,528 4,651
Commission expenses 20,029 19,474
Securities business 3,500 3,288
Credit business 975 1,820
Payment transactions 519 285
Home loan savings business 8,412 7,824
Fiduciary transactions 2,909 2,905
Other services 3,713 3,352
Total 7,166 7,809
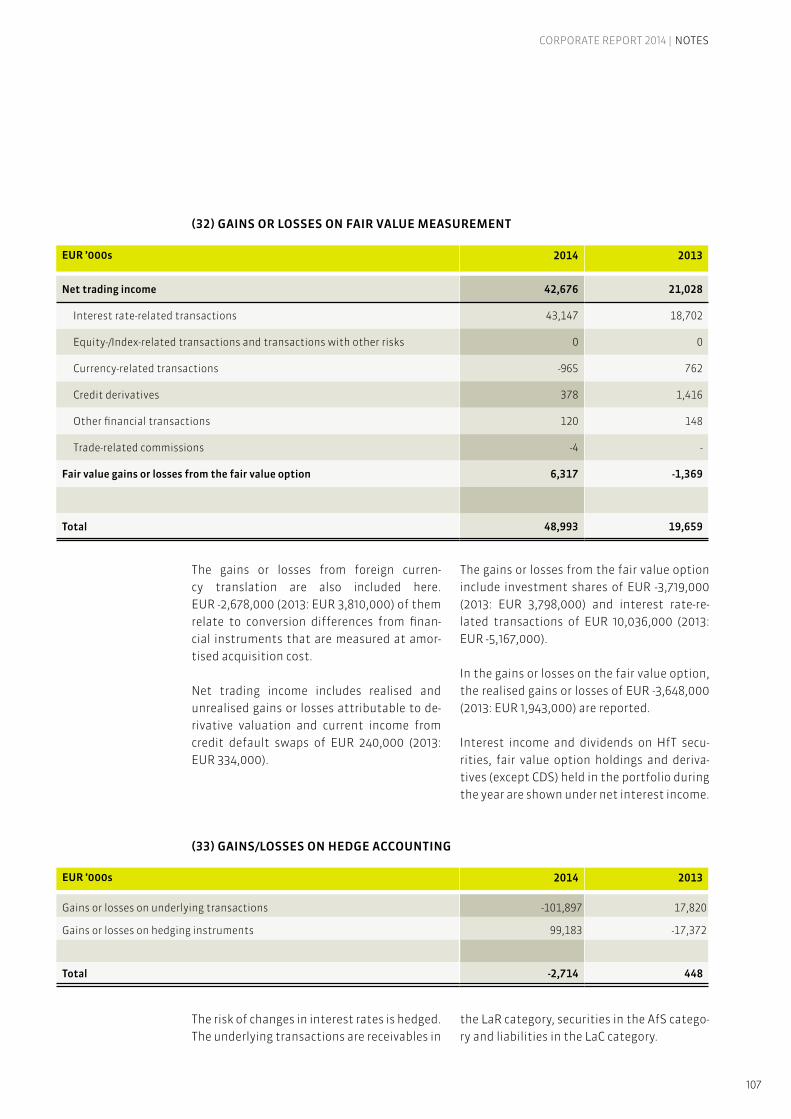
107
CORPORATE REPORT 2014 | NOTES
(32) GAINS OR LOSSES ON FAIR VALUE MEASUREMENT
(33) GAINS/LOSSES ON HEDGE ACCOUNTING
The gains or losses from foreign curren-cy translation are also included here. EUR -2,678,000 (2013: EUR 3,810,000) of them relate to conversion differences from finan-cial instruments that are measured at amor-tised acquisition cost.
Net trading income includes realised and unrealised gains or losses attributable to de-rivative valuation and current income from credit default swaps of EUR 240,000 (2013: EUR 334,000).
The gains or losses from the fair value option include investment shares of EUR -3,719,000 (2013: EUR 3,798,000) and interest rate-re-lated transactions of EUR 10,036,000 (2013: EUR -5,167,000).
In the gains or losses on the fair value option, the realised gains or losses of EUR -3,648,000 (2013: EUR 1,943,000) are reported.
Interest income and dividends on HfT secu-rities, fair value option holdings and deriva-tives (except CDS) held in the portfolio during the year are shown under net interest income.
The risk of changes in interest rates is hedged. The underlying transactions are receivables in
the LaR category, securities in the AfS catego-ry and liabilities in the LaC category.
EUR ’000s 2014 2013
Net trading income 42,676 21,028
Interest rate-related transactions 43,147 18,702
Equity-/Index-related transactions and transactions with other risks 0 0
Currency-related transactions -965 762
Credit derivatives 378 1,416
Other financial transactions 120 148
Trade-related commissions -4 -
Fair value gains or losses from the fair value option 6,317 -1,369
Total 48,993 19,659
EUR ’000s 2014 2013
Gains or losses on underlying transactions -101,897 17,820
Gains or losses on hedging instruments 99,183 -17,372
Total -2,714 448

108
(34) GAIN/LOSS ON INVESTMENTS
The gains on the disposal of financial assets in the LaR category are mainly from the gains from the sale of securities (so-called ABS se-curities) for a total of EUR 706,000, while the losses from the disposal of financial assets in the amount of EUR 1,003,000 (of which one securitisation is EUR 476,000) stand in rela-tion to this. The depreciation in the LaR cate-gory relates to two ABS securities. The income from the release of portfolio provisions was primarily due to a reduction in the portfolio of bonds in question.
The gains on the disposal of financial assets in the AfS category are due to the sale of bonds. The additions relate to one securitisation. The expenses from the write-downs of finan-cial assets in the AfS category are due to two other investments.
EUR ’000s 2014 2013
Gains/losses on investments "held-to-maturity" 101 -29
Income from appreciation 101 -
of which portfolio risk provisions 101 -
Expenses from write-downs - -29
of which portfolio risk provisions - -29
Gains/losses from investments classified as "loans and receivables" 102 -2,591
Disposal proceeds -297 -1,656
Income from appreciation 1,297 -
of which portfolio risk provisions 1,297 -
Expenses from write-downs -898 -935
of which portfolio risk provisions - -128
Gains/losses from investments "available for sale" 722 -647
Disposal proceeds 1,951 85
Income from appreciation 155 -
Expenses from write-downs -1,384 -732
Total 925 -3,267

109
CORPORATE REPORT 2014 | NOTES
(35) ADMINISTRATIVE EXPENSES
EUR ’000s 2014 2013
Staff costs 43,074 41,453
Wages and salaries 34,800 33,826
Social security contributions 5,420 4,694
Expenses for pensions and other employee benefits 2,854 2,933
Other administrative expenses 28,220 27,928
Expenses for land and buildings for own use 2,832 2,648
IT costs 6,359 6,568
Office costs 304 301
Advertising 1,533 1,531
Communication and other distribution costs 2,868 2,820
Contributions, legal and consultancy fees 8,370 7,902
Other administrative costs 5,954 5,952
Expenses for agency arrangements - 206
Depreciation of property, plant and equipment and amortisation of intangibles(not incl. goodwill)
2,182 2,522
Total 73,476 71,903
Other administrative expenses include the bank fee in the amount of EUR 100,000 (2013: EUR 113,000). Furthermore, project costs of EUR 2,164,000 (2013: EUR 2,323,000), restructuring costs of EUR 294,000 (2013: EUR 406,000) and contributions to D&O in-surance for EUR 284,000 (2013: EUR 345,000) are reported.
The drop in expenses from external manage-ment relate to the termination of the con-tract with Banque LB Lux S.A. by the office in Metz as of 31 March 2013.

110
(36) OTHER INCOME
The rest of other income includes cost reim-bursement and charged-on staff and operat-ing costs.
EUR ’000s 2014 2013
Other income 3,431 4,573
Income from the repurchase of own issues - 277
Rental income 1,300 1,332
of which:
Rental income on investment property 1,300 1,332
Disposal profits from property, plant and equipment, intangibles, investment property and real estate of the inventory assets
117 248
Income from the release of provisions 798 1,499
Other miscellaneous income 1,217 1,217
Other expenses 2,512 2,694
Expenses from the repurchase of own issues 606 752
Current expenses for investment property - Leased properties
632 632
409 409
Disposal losses from property, plant and equipment, intangibles, investment property and real estate of the inventory assets
9 10
Depreciation of investment property and real estate of the inventory assets 228 228
Expense from loss transfers 81 40
Expense for other taxes 113 239
Other miscellaneous expenses 844 1,016
Total 919 1,879
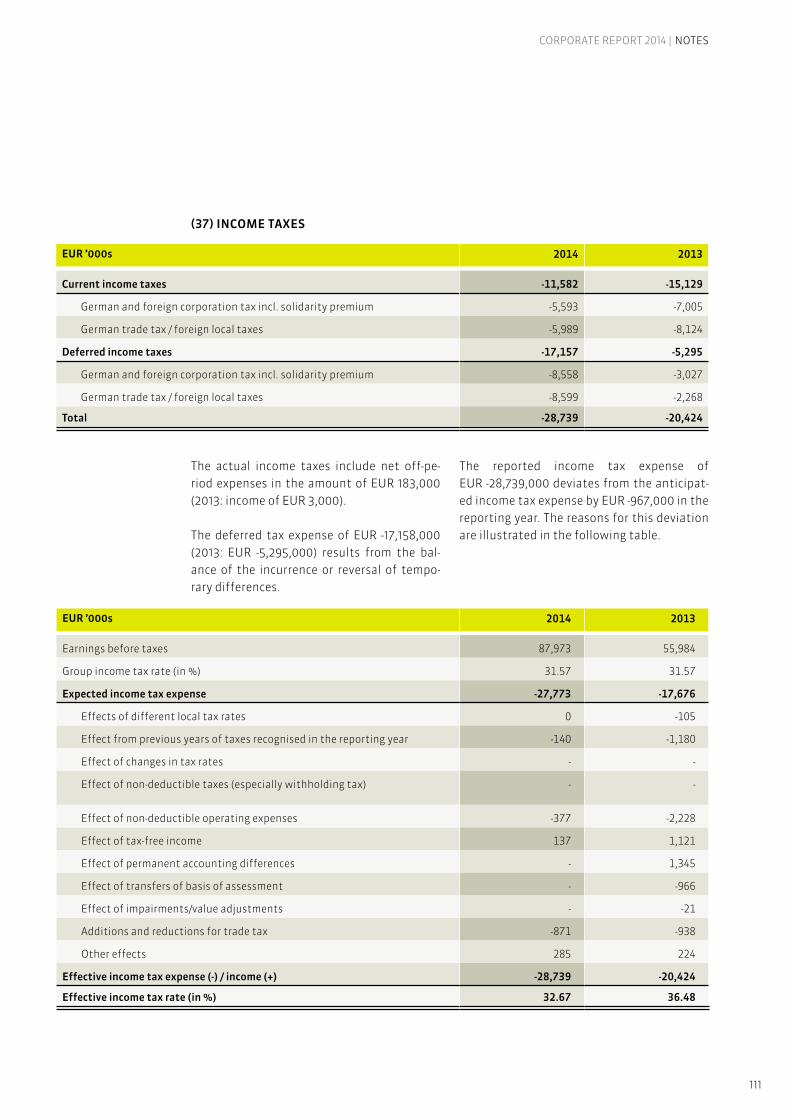
111
CORPORATE REPORT 2014 | NOTES
(37) INCOME TAXES
The actual income taxes include net off-pe-riod expenses in the amount of EUR 183,000 (2013: income of EUR 3,000).
The deferred tax expense of EUR -17,158,000 (2013: EUR -5,295,000) results from the bal-ance of the incurrence or reversal of tempo-rary differences.
The reported income tax expense of EUR -28,739,000 deviates from the anticipat-ed income tax expense by EUR -967,000 in the reporting year. The reasons for this deviation are illustrated in the following table.
EUR ’000s 2014 2013
Current income taxes -11,582 -15,129
German and foreign corporation tax incl. solidarity premium -5,593 -7,005
German trade tax / foreign local taxes -5,989 -8,124
Deferred income taxes -17,157 -5,295
German and foreign corporation tax incl. solidarity premium -8,558 -3,027
German trade tax / foreign local taxes -8,599 -2,268
Total -28,739 -20,424
EUR ’000s 2014 2013
Earnings before taxes 87,973 55,984
Group income tax rate (in %) 31.57 31.57
Expected income tax expense -27,773 -17,676
Effects of different local tax rates 0 -105
Effect from previous years of taxes recognised in the reporting year -140 -1,180
Effect of changes in tax rates - -
Effect of non-deductible taxes (especially withholding tax) - -
Effect of non-deductible operating expenses -377 -2,228
Effect of tax-free income 137 1,121
Effect of permanent accounting differences - 1,345
Effect of transfers of basis of assessment - -966
Effect of impairments/value adjustments - -21
Additions and reductions for trade tax -871 -938
Other effects 285 224
Effective income tax expense (-) / income (+) -28,739 -20,424
Effective income tax rate (in %) 32.67 36.48

112
The forecast income tax expense/income was calculated using the tax rate applicable to com-panies subject to taxation in Germany. Allowing for the non-deductibility of trade tax from the corporation tax, a corporate tax rate of 15%, a solidarity surcharge of 5.5%, and an unchanged trade tax of 15.75%, there was an unchanged Group income tax rate of 31.57% on the report-ing date (2013: 31.57%).
The impact of the tax-free income results pri-marily from tax-free dividend income and dis-posal profits in the previous years. The impact of non-tax-deductible operating expenses are due to expenses in relation to dividend income, non-deductible assumptions of costs for part-nerships and expenses for bank fees pursuant to Section 12 (2) of the Restructuring Law.

113
CORPORATE REPORT 2014 | NOTES
(38) CASH RESERVES
(39) LOANS AND ADVANCES TO BANKS
(40) LOANS AND ADVANCES TO CUSTOMERS
Breakdown of loans and advances to banks by maturities:
Notes to the balance sheet
EUR ’000s 2014 2013
Cash on hand 1,509 1,263
Balances with central banks 297,891 783,642
Total 299,400 784,905
EUR ’000s 2014 2013
Loans and advances to domestic banks 1,851,853 1,553,108
Loans and advances to foreign banks 474,893 468,579
Total 2,326,746 2,021,687
EUR ’000s 2014 2013
Payable on demand 1,009,716 422,686
Fixed-term with residual maturity of 1,317,030 1,599,001
up to 3 months 351,605 340,066
more than 3 months and up to 1 year 614,578 621,728
more than 1 year and up to 5 years 334,048 620,274
more than 5 years 16,800 16,934
Total 2,326,746 2,021,687
EUR ’000s 2014 2013
Loans and advances to domestic customers 4,576,971 4,529,989
Loans and advances to foreign customers 4,412,397 4,267,392
Total 8,989,368 8,797,381

114
Breakdown of loans and advances to customers by sector:
Breakdown of loans and advances to customers by maturities:
EUR ’000s 2014 2013
Real estate 2,674,235 2,897,539
Retail customers 667,861 712,141
Food & beverages 176,387 192,209
Construction 153,358 180,092
Aviation 32,422 37,334
Wholesale & retail trade 202,154 180,927
Sovereigns / Public sector 1,700,128 1,611,610
Technology 171,052 108,557
Automotive 134,144 119,928
Health care industry 139,911 109,752
Steel 183,381 223,073
Renewable energy 1,829,460 1,650,340
Utilities 253,348 249,826
Pharmaceuticals 58,871 56,384
Other 612,659 467,669
Total 8,989,368 8,797,381
EUR ’000s 2014 2013
Fixed-term with residual maturity of 8,500,076 8,428,824
up to 3 months 567,076 684,619
more than 3 months and up to 1 year 721,627 541,366
more than 1 year and up to 5 years 2,743,710 2,789,248
more than 5 years 4,467,663 4,413,591
Indefinite 489,292 368,557
Total 8,989,368 8,797,381
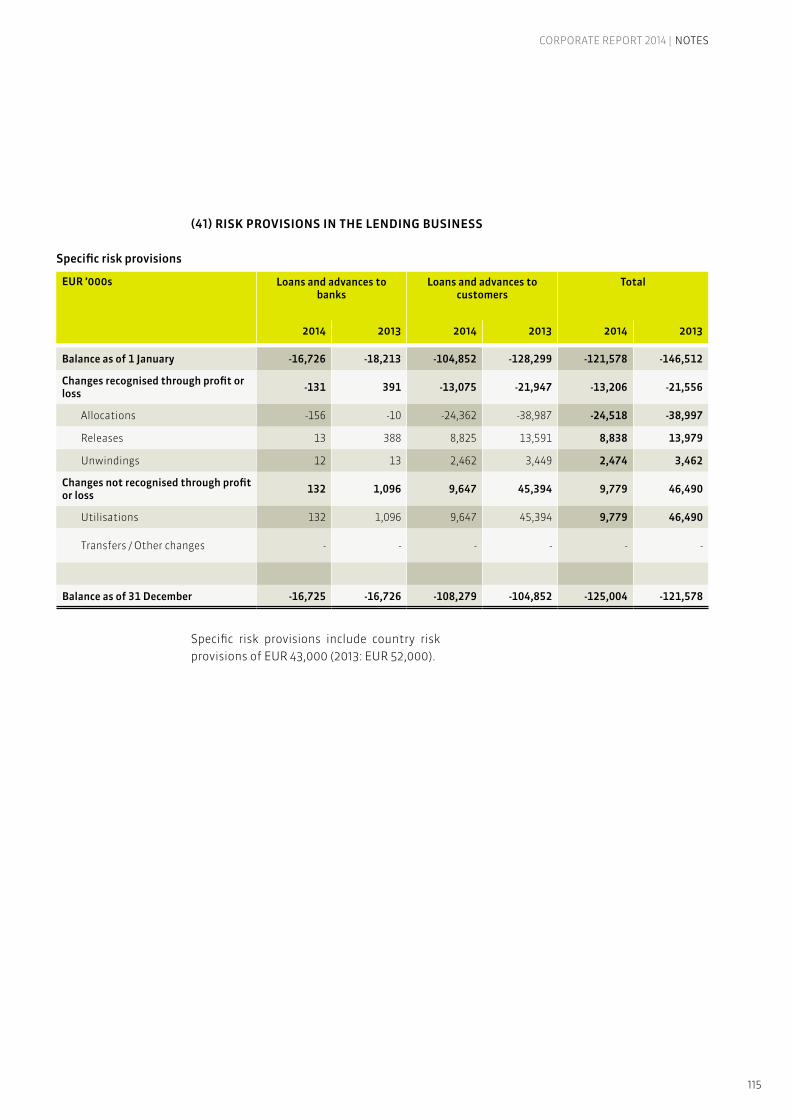
115
CORPORATE REPORT 2014 | NOTES
(41) RISK PROVISIONS IN THE LENDING BUSINESS
Specific risk provisions include country risk provisions of EUR 43,000 (2013: EUR 52,000).
Specific risk provisions
EUR ’000s Loans and advances to banks
Loans and advances to customers
Total
2014 2013 2014 2013 2014 2013
Balance as of 1 January -16,726 -18,213 -104,852 -128,299 -121,578 -146,512
Changes recognised through profit or loss -131 391 -13,075 -21,947 -13,206 -21,556
Allocations -156 -10 -24,362 -38,987 -24,518 -38,997
Releases 13 388 8,825 13,591 8,838 13,979
Unwindings 12 13 2,462 3,449 2,474 3,462
Changes not recognised through profit or loss 132 1,096 9,647 45,394 9,779 46,490
Utilisations 132 1,096 9,647 45,394 9,779 46,490
Transfers / Other changes - - - - - -
Balance as of 31 December -16,725 -16,726 -108,279 -104,852 -125,004 -121,578

116
The following table shows the state of the specific risk provisions (not including country risk provisions) by sector.
The unwindings are recorded by a reduction of the specific risk provisions; the income is dis-closed in net interest income.
EUR ’000s 2014 2013
Sector groups
Real estate 56,683 57,277
Banks / Financial service providers 16,736 16,726
Retail customers 13,989 14,646
Food & beverages 8,561 5,565
Construction 5,673 4,639
Machine and system construction 3,478 3,489
Automotive 950 3,430
Sovereigns / Public sector 2,216 3,292
Suppliers / Disposers 2,990 2,970
Aviation 2,672 2,672
Chemical industry 6,362 2,608
Wholesale & retail trade 2,244 1,753
Technology 1,374 1,408
Health care 590 608
Pulp and paper industry 443 443
Steel - -
Media - -
Utilities - -
Logistics - -
Other - -
Total 124,961 121,525

117
CORPORATE REPORT 2014 | NOTES
The risk provision for contingent liabilities and other obligations is shown as a provision
for risks from the credit business.
(42) ASSETS HELD FOR TRADING
Please see Note 66 for the composition and performance of derivative financial instru-ments.
Breakdown of assets held for trading by con-tractual maturity:
Portfolio risk provisions
EUR ’000s Loans and advances to banks
Loans and advances to customers
Total
2014 2013 2014 2013 2014 2013
Balance as of 1 January -158 -230 -13,780 -15,257 -13,938 -15,487
Changes recognised through profit or loss -47 72 -1,161 1,477 -1,208 1,549
Allocations -47 - -1,213 -224 -1,260 -224
Releases - 72 52 1,701 52 1,773
Balance as of 31 December -205 -158 -14,940 -13,780 -15,145 -13,938
EUR ’000s 2014 2013
Positive fair values from derivative financial instruments (not hedge accounting)
476,675 328,264
Total 476,675 328,264
EUR ’000s 2014 2013
Fixed-term with residual maturity of 476,675 328,264
up to 3 months 14,504 4,042
more than 3 months and up to 1 year 25,298 19,365
more than 1 year and up to 5 years 184,174 167,957
more than 5 years 252,698 136,900
Total 476,675 328,264

118
(43) POSITIVE MARKET VALUE OF DERIVATIVE FINANCIAL INSTRUMENTS (HEDGE ACCOUNTING)
The hedges involve securing the risk of a change in interest rates. Underlying transac-tions are securitised liabilities and promissory notes
(44) INVESTMENTS
The investments consist of the following:
The decline in the area of investment inter-ests comes from sales in the special fund.
EUR ’000s 2014 2013
Positive market value of fair value hedges 135,535 28,559
Total 135,535 28,559
EUR ’000s 2014 2013
Bonds, notes and other fixed-interest securities 3,609,380 4,286,090
Money market instruments 439,675 719,696
Bonds and notes 3,169,705 3,566,394
Equities and other non-fixed-interest securities 9,148 67,236
Equities 469 469
Investment fund units 8,679 66,107
Other non-fixed-interest securities - 660
Interests in subsidiaries 100 25
Interests in non-consolidated joint ventures 88 -
Shares in associated, not consolidated companies 2,205 2,292
Other investments 53,862 44,374
less portfolio risk provisions 473 1,871
Total 3,674,309 4,398,146

119
CORPORATE REPORT 2014 | NOTES
Breakdown of investments by maturity:
A sale of interests without maturity within the next twelve months is not planned.
ReclassificationDue to the financial market crisis, debt secu-rities with a value of EUR 1,232.6 million were reclassified in the fourth quarter of 2008 from the AfS to the LaR category retrospectively as of 1 July 2008. Furthermore, SaarLB reclas-sified debt securities with a market value of EUR 538.4 million from the AfS to the LaR cat-egory and debt securities with a market value of EUR 1,115.7 million from the AfS to HtM cat-egory as of 31 October 2008. More details on the reclassifications can be found in SaarLB’s financial report for the 2008 financial year (see explanations in Notes 1, 8 and 44).
As of 31 December 2014, these reclassified securities, after taking into account sepa-rately reported security repurchase trans-actions in the amount of EUR 365,261,000 (2013: EUR 365,459,000), had a fair value of EUR 622.4 million (2013: EUR 988.1 million). The amortised costs of the reclassified secu-rities amounted to EUR 615.2 million (2013: EUR 982.2 million).
EUR ’000s 2014 2013
Fixed-term with residual maturity of 3,608,907 4,284,219
up to 3 months 328,213 944,245
more than 3 months and up to 1 year 1,294,715 818,300
more than 1 year and up to 5 years 1,404,576 2,167,780
more than 5 years 581,404 353,894
No maturity 65,402 113,927
Total 3,674,309 4,398,146

120
The revaluation reserve of the reclassi-fied securities amounts to EUR -5.4 million (2013: EUR -8.5 million). If no reclassification had occurred, there would have been a re-valuation reserve of EUR 1.8 million (2013:
EUR -2.7 million) so that the portfolio of the revaluation reserve for the reclassified securi-ties would have been EUR 7.2 million higher.
EUR ’000s 2014 2013
Fair value 622,392 988,081
of which LaR 165,480 388,298
of which HtM 456,912 599,783
Amortised cost 615,213 982,211
of which LaR 163,997 393,282
of which HtM 451,216 588,929
Revaluation reserve -5,412 -8,520
of which LaR -4,251 -6,419
of which HtM -1,161 -2,101
Revaluation reserve without reclassification 1,767 -2,650
of which LaR -3,922 -11,403
of which HtM 5,689 8,753
EUR ’000s 2014 2013
Revaluation reserve
Without reclassification 4,417 12,924
of which LaR 7,481 17,910
of which HtM -3,064 -4,986
With reclassification 3,108 6,671
of which LaR 2,168 5,606
of which HtM 940 1,065
The effective interest rates determined at the time of the reclassifications on the basis of the new acquisition costs ranged from a min-imum of 2.3857% to a maximum of 13.1024%.
The estimated cash flows that SaarLB had expected at the time of the reclassifications amounted to EUR 3,493.4 million.

121
CORPORATE REPORT 2014 | NOTES
(45) SECURITIES REPURCHASE TRANSACTIONS
This item includes loans that are the object of securities repurchase transactions. Due to the buyback obligation, SaarLB will continue to bear the credit rating and interest change risk from these loans. The liabilities connect-ed with the securities repurchase transac-tions amounted to EUR 692,058,000 (2013: EUR 645,473,000) and are reported in liabili-ties to banks.
Of these transactions, EUR 146,293,000 (2013: EUR 0) have a remaining term of less than three months and EUR 515,528,000 (2013: EUR 0) had maturities of more than 3 months and up to 1 year.
Counterparty for the transactions are Bayern-LB and EUREX Clearing AG.
In the year under review, three companies continued to be measured at equity. Summa-rised financial information about associates that are valued according to the at equity method is included in Note 78.
The sale of interests within the next twelve months is not planned.
(46) INTERESTS IN ENTITIES VALUED AT EQUITY
EUR ’000s 2014 2013
Securities repurchase transactions 661,821 629,146
Total 661,821 629,146
EUR ’000s 2014 2013
Associates 5,924 6,029
Total 5,924 6,029
(47) INVESTMENT PROPERTY
EUR ’000s 2014 2013
Land and buildings leased 20,501 20,777
Total 20,501 20,777

122
Development of investment property:
Limitations regarding the disposability or the generation of income and disposal proceeds did not exist as of balance sheet date.
The fair value of the investment property and buildings amounted to EUR 22,130,000 (2013: EUR 22,130,000), of which EUR 22,130,000 (2013: EUR 22,080,000) was calculated by ex-ternal experts. The calculation is based on the application of the discounted cash flow pro-cess in which market and geographic data are included.
The fair values are determined by a compari-son of the material asset (total of land value and the value of the construction facilities) and the income value (product of annual gross
yield and a so-called multiplier). Significant in-put parameters are the construction price in-dex and assumptions for age reductions with respect to the material asset process, and the local comparative rents, management costs and the multiplier with respect to the income value process.
All fair values are assigned to the Level 3 measurement hierarchy (see Note 8).
The sale of investment property within the next twelve months is not planned.
EUR ’000s 2014 2013
Costs of acquisition or production
Balance as of 1 January 24,823 25,089
Changes from currency translation - -
Changes in the scope of consolidation - -
Additions - -
Transfers - -
Disposals 49 266
Balance as of 31 December 24,774 24,823
Write-ups/write-downs
Balance as of 1 January 4,046 4,084
Changes from currency translation - -
Changes in the scope of consolidation - -
Scheduled amortisation 228 228
Impairments - -
Reversals - -
Transfers - -
Disposals - 266
Balance as of 31 December 4,274 4,046
Carrying values
Balance as of 1 January 20,777 21,005
Balance as of 31 December 20,501 20,777

123
CORPORATE REPORT 2014 | NOTES
(48) PROPERTY, PLANT AND EQUIPMENT
Performance of property, plant and equipment:
Property, plant and equipment with limited dis-posal rights did not exist as of balance sheet date.
The sale of property, plant and equipment within the next twelve months is not planned.
(49) INTANGIBLE ASSETS
EUR ’000s 2014 2013
Land and buildings for own use 18,662 19,018
Operating and office equipment 2,278 2,514
Total 20,941 21,532
EUR ’000s Land and buildings for own use
Operating and office equipment
Total
2014 2013 2014 2013 2014 2013
Costs of acquisition or production
Balance as of 1 January 22,887 23,327 15,471 15,099 38,358 38,426
Additions - - 520 627 520 627
Disposals - 440 110 255 110 695
Balance as of 31 December 22,887 22,887 15,881 15,471 38,768 38,358
Write-ups/write-downs
Balance as of 1 January 3,870 3,515 12,957 12,431 16,827 15,946
Scheduled amortisation 355 355 718 744 1,073 1,099
Impairments - - - - - -
Disposals - - 73 218 73 218
Balance as of 31 December 4,225 3,870 13,602 12,957 17,827 16,827
Carrying values
Balance as of 1 January 19,018 19,812 2,514 2,668 21,532 22,480
Balance as of 31 December 18,662 19,018 2,278 2,514 20,941 21,532
EUR ’000s 2014 2013
Other intangible assets 2,788 2,489
Total 2,788 2,489

124
Performance of intangible assets:
Intangible assets involve exclusively standard software.
The sale of intangibles within the next twelve months is not planned.
(50) CURRENT AND DEFERRED INCOME TAX CLAIMS
EUR ’000s 2014 2013
Costs of acquisition or production
Balance as of 1 January 6,468 4,710
Additions 1,405 1,891
Disposals - 133
Balance as of 31 December 7,873 6,468
Write-ups/write-downs
Balance as of 1 January 3,979 2,699
Scheduled amortisation 1,106 1,413
Impairments - -
Disposals - 133
Balance as of 31 December 5,085 3,979
Carrying values
Balance as of 1 January 2,489 2,010
Balance as of 31 December 2,788 2,489
EUR ’000s 2014 2013
Current income tax assets 4,211 7,693
Domestic 4,125 5,733
International 86 1,960
Deferred income tax assets 37,461 43,616
Domestic 37,461 43,616
International - -
Total 41,672 51,309

125
CORPORATE REPORT 2014 | NOTES
As in the previous year, deferred tax liabili-ties are in excess of deferred tax assets by EUR 31,816,000 (2013: EUR 12,270,000).
The change in the balance of deferred income tax claims and liabilities of EUR 19,547,000 (previous year: EUR 2,885) does not correspond
to deferred tax expenses of EUR 17,158,000 (2013: EUR 5,295,000).
The reasons for this are the changes in de-ferred taxes not recognised at profit or loss; these result from bookings against the reval-uation reserve.
The intention is to realise other assets within the next twelve months.
(51) OTHER ASSETS
Deferred income tax claims and obligations are distributed over the following items:
EUR ’000s 2014 2013
Deferred tax assets
Deferred tax liabilities
Deferred tax assets
Deferred tax liabilities
Cash reserves - - - -
Loans and advances to banks and customers - 5,627 392 5,735
Risk provisions 5,816 - 2,789 -
Assets held for trading - - - -
Positive market value of derivative financial instruments (hedge accounting) - - - -
Investments - 29,776 1,994 18,820
Property, plant and equipment - - - 15
Other assets 5,446 1,834 1,950 -
Liabilities to banks and customers - 2,094 - 1,702
Securitised liabilities 15,182 - 2,582 -
Liabilities held for trading 4,382 - 30,067 -
Negative fair values from derivative financial instruments (hedge accounting)
- - - -
Provisions 6,624 87 3,732 -
Other liabilities 10 10,280 110 6,730
Subordinated capital - 19,579 - 22,884
Taxable carry-over losses - - - -
Total deferred taxes after impairments and offsetting 37,461 69,277 43,616 55,886
EUR ’000s 2014 2013
Prepaid expenses 498 529
Other assets 1,145 3,515
Total 1,643 4,044

126
(52) LIABILITIES TO BANKS
Breakdown of liabilities to banks by maturity:
(53) LIABILITIES TO CUSTOMERS
Breakdown of liabilities to customers by maturity:
EUR ’000s 2014 2013
Liabilities to domestic banks 4,478,703 5,033,735
Liabilities to foreign banks 401,628 714,999
Total 4,880,332 5,748,734
EUR ’000s 2014 2013
Payable on demand 341,830 214,933
Fixed-term with residual maturity of 4,538,502 5,533,801
up to 3 months 1,324,460 2,495,524
more than 3 months and up to 1 year 1,103,305 845,135
more than 1 year and up to 5 years 860,215 1,070,335
more than 5 years 1,250,522 1,122,807
Total 4,880,332 5,748,734
EUR ’000s 2014 2013
Liabilities to domestic customers 4,413,189 4,475,872
Liabilities to foreign customers 231,564 283,219
Total 4,644,753 4,759,091
EUR ’000s 2014 2013
Fixed-term with residual maturity of 4,050,329 4,211,213
up to 3 months 1,845,012 2,102,020
more than 3 months and up to 1 year 541,185 344,502
more than 1 year and up to 5 years 410,917 610,378
more than 5 years 1,253,215 1,154,313
No maturity (home loan savings deposits) 594,424 547,878
Total 4,644,753 4,759,091

127
CORPORATE REPORT 2014 | NOTES
(54) SECURITISED LIABILITIES
Please see Note 66 for the composition and performance of liabilities held for trading.
Breakdown of liabilities held for trading by contractual maturity:
(55) LIABILITIES HELD FOR TRADING
Breakdown of securitised liabilities by maturity:
EUR ’000s 2014 2013
Bonds and notes issued 5,196,321 4,939,714
Mortgage Pfandbriefe 422,688 299,325
Public-sector Pfandbriefe 535,064 587,630
Other bonds 4,238,569 4,052,759
Total 5,196,321 4,939,714
EUR ’000s 2014 2013
Fixed-term with residual maturity of
up to 3 months 333,805 49,205
more than 3 months and up to 1 year 1,803,798 355,633
more than 1 year and up to 5 years 1,636,792 3,409,526
more than 5 years 1,421,926 1,125,350
Total 5,196,321 4,939,714
EUR ’000s 2014 2013
Negative fair value from derivative financial instruments (not hedge accounting) 542,589 432,882
Total 542,589 432,882
EUR ’000s 2014 2013
Fixed-term with residual maturity of
up to 3 months 15,645 13,397
more than 3 months and up to 1 year 23,188 24,172
more than 1 year and up to 5 years 254,458 236,288
more than 5 years 249,298 159,025
Total 542,589 432,882

128
(56) NEGATIVE FAIR VALUES FROM DERIVATIVE FINANCIAL INSTRUMENTS (HEDGE ACCOUNTING)
The hedges involve securing the risk of a change in interest rates. The underlying
transactions are loans and advances to cus-tomers and fixed interest securities.
(57) PROVISIONS
Provisions for pensions and similar obligations
The accounting of provisions for pensions and similar obligations was adjusted retroactively on account of the amendment to IAS 19. As of 31 December 2012, the recognition of actuari-al losses in the amount of EUR 3,980,000 re-duced other reserves (see Note 61). Deferred
tax assets increased by EUR 1,257,000 (see Note 50).
The value recorded on the balance sheet for pension provisions is determined as follows:
EUR ’000s 2014 2013
Negative market value of fair value hedges 27,620 29,517
Total 27,620 29,517
EUR ’000s 2014 2013
Provisions for pensions and similar obligations 40,143 30,764
Other provisions 7,323 7,015
Provisions for the credit business 3,685 2,749
Other provisions 3,638 4,266
Total 47,467 37,779
EUR ’000s 2014 2013
Net present value of pension obligations 40,795 31,376
unfunded 40,143 30,764
funded 652 612
Fair value of plan assets -652 -632
Not recognised assets (asset ceiling) - 20
Pension provisions reported 40,143 30,764

129
CORPORATE REPORT 2014 | NOTES
Development of pension provision:
Development of the fair value of the plan asset:
The actuarial profits and losses result solely from financial assumptions based on adjust-ments.
Paid benefits involve pension payments; there was no payment in lieu.
The plan asset consists of reinsurance claims on insurance companies (so-called cover as-sets) that are backed by its investments. There is no right of recourse to specific invest-ments; it is therefore not possible to provide a breakdown by equities, debt instruments and other assets. No reimbursement rights have been reported as assets. There is no trading of the collateral pool on an active market.
In the last five years, the net present value of pension obligations, the fair value of the plan asset and the surplus/deficit in obligations as well as adjustments based on expectations changed as follows:
EUR ’000s 2014 2013
Balance as of 1 January 30,764 28,577
Current service expense 600 922
Past service expense 797 0
Interest expense 1,049 977
Actuarial losses 8,304 1,624
Benefits paid -1,371 -1,336
Balance as of 31 December 40,143 30,764
Fair value of plan asset
EUR ’000s 2014 2013
Balance as of 1 January 632 611
Interest income 20 21
Balance as of 31 December 652 632
EUR ’000s 2014 2013 2012 2011 2010
Net present value of pension obligations 40,795 31,376 29,167 24,107 21,945
Fair value of plan assets -652 632 611 710 680
Surplus/deficit in obligations 40,143 30,744 28,556 23,397 21,265
Expectation-based adjustments to value of obligations -8,304 -1,625 -606 -73 -489
Expectation-based adjustments to value of plan assets 20 22 20 -29 -2

130
Since financial year 2012, no contributions to reinsurance have been made.
The cost of pension obligations recognised on the income statement consists of the follow-ing:
The current and past service expense are re-ported in administrative expenses. Interest expenses offset against interest income from the plan asset and disclosure is made under net interest income. Actuarial losses are tak-en to equity and reported under other assets.
It is anticipated that pension provisions of EUR 1,562,000 will be utilised in the following financial year. The average maturity of pen-sion provisions is 12.7 years. The anticipated contributions to the ZVK total EUR 1,851,000 in the following year.
A sensitivity analysis of the influential factors on pension provisions shows the following:
EUR ’000s 2014 2013
Current service expense 600 922
Past service expense 797 -
Interest expense 1,069 998
Current return on plan asset 20 22
Effect of asset ceiling - 1
Total 2,446 1,899
Influential factor Assumption Change in assumptions Provision in the event of
Changes in assumptions
Increase in assumptions
Interest rate 2.0% 0.5% points 43,331 37,315
Increases in salaries 2.5% 0.5% points 39,675 40,637
Increases in retirement benefits 2.0% 0.5% points 37,728 42,796
Mortality 2005 G reference tables 10% points 38,647 41,842
Other provisions
Provisions for the credit business Other provisions
At individual transaction level
At portfolio level
EUR ’000s 2014 2013 2014 2013 2014 2013
Balance as of 1 January 102 589 2,647 2,960 4,266 3,762
Utilisations - - - - 1,119 553
Releases 3 487 - 313 362 260
Allocations - - 939 - 853 1,317
Balance as of 31 December 99 102 3,586 2,647 3,638 4,266

131
CORPORATE REPORT 2014 | NOTES
The provisions in the credit business are cre-ated for contingent liabilities and irrevocable credit commitments.
The other provisions are largely provisions for staff (length of service bonuses, provi-sions for pre-retirement part-time work-ing and early retirement) of EUR 941,000 (2013: EUR 1,261,000), and for legal costs of EUR 1,534,000 (2013: EUR 1,305,000).
External expert reports form the basis of the staff provisions.
Other provisions are not discounted, apart from those related to staff, as the cash out-flows are expected to take place within one year.
(58) CURRENT AND DEFERRED INCOME TAX LIABILITIES
Please see Note 50 for a breakdown of the de-ferred tax liabilities according to the reasons for their occurrence by balance sheet item and the deferred tax assets.
(59) OTHER LIABILITIES
Other liabilities mainly comprise the propor-tionate, not yet paid servicing of subordinat-ed and hybrid capital and permanent capital
contributions of silent partners amounting to EUR 21,259,000 (2013: EUR 25,757,000).
EUR ’000s 2014 2013
Current income tax liabilities 14,026 6,684
Domestic 13,792 6,684
International 234 -
Deferred income tax liabilities 69,277 55,886
Domestic 69,277 55,886
International - -
Total 83,303 62,570
EUR ’000s 2014 2013
Prepaid income 98 131
Other liabilities 23,628 28,046
Accruals 14,758 15,500
Total 38,485 43,677

132
The accruals consist of EUR 6,316,000 (2013: EUR 5,781,000) in employee benefits due in the short term, EUR 2,915,000 (2013: EUR 4,526,000) in taxes unrelated to income and EUR 4,817,000 (2013: EUR 4,192,000) in outstanding invoices.
The intention is to realise other liabilities within the next twelve months.
(60) SUBORDINATED CAPITAL
Subordinated capital broken down by maturity:
EUR ’000s 2014 2013
Subordinated liabilities 143,893 125,297
Profit participation certificates (debt components) 8,500 38,040
Capital contributions from silent partners (debt components) 156,447 156,600
Total 308,840 319,937
EUR ’000s 2014 2013
Fixed-term with residual maturity of
up to 3 months 18,500 40,000
more than 3 months and up to 1 year 108,393 9,299
more than 1 year and up to 5 years 31,275 148,627
more than 5 years 150,672 122,011
Total 308,840 319,937

133
CORPORATE REPORT 2014 | NOTES
(61) SHAREHOLDERS’ EQUITY
Hybrid capital
Silent partnership contributions with a fixed term or recallable by the lender are compound financial instruments and have to be divided into their equity and debt components (split accounting). The disclosure in equity takes place under hybrid capital instruments.
Capital reserve
Additional contributions by the shareholders into shareholders’ equity are listed in the cap-ital reserve.
Retained earnings
Amounts allocated to reserves from the previ-ous year’s distributable earnings are booked under retained earnings.
Other reserves
The item contains measurement gains and losses on AfS financial instruments and AfS financial instruments reclassified to LaR and HtM instruments, taken directly to equity in the revaluation reserve, if they occurred dur-ing the categorisation as AfS and actuarial losses.
EUR ’000s 2014 2013
Subscribed capital 274,619 174,601
Statutory share capital 250,119 150,100
Undated capital contributions from silent partners 24,500 24,500
Hybrid capital 62,107 72,413
Profit participation certificates (equity component) - 460
Dated silent partnership contributions (equity component) 62,107 71,954
Capital reserve 69,085 69,085
Retained earnings 237,612 211,024
Other retained earnings 237,612 211,024
Other reserves 51,309 30,487
Consolidated profit 52,733 27,243
Total 747,465 584,852

134
The other reserve were as follows:
The revaluation reserve contains reclassi-fied securities (before deferred taxes) in the amount of EUR -1.2 million from the HtM cate-gory and EUR -4.3 million from LaR; these will be amortised over the expected remaining life of the underlying investments.
Retained profit
The retained profit was EUR 52,733,000 (2013: EUR 27,243,000).
The net income for the year in accordance with the German Commercial Code (HGB), which is definitive for the appropriation of profits, totalled EUR 4,102,000 (2013: EUR 0.00); after an addition to the statutory reserves in the amount of EUR 410,000, the Board of Management proposes that the re-tained profit of EUR 3,002,000 be distributed and EUR 690,000 be added to other retained earnings. No dividends were paid in 2014 for the 2013 financial year.
Capital management
The supervisory requirements set out in the Solvency Ordinance are key for SaarLB when assessing and managing capital adequacy as well as maintaining economic risk-bearing ca-pacity.
Regulatory capital
SaarLB has applied the relevant rules on cal-culating capital requirements under the Capi-tal Requirements Regulation (CRR; until 2013: German Solvency Ordinance/SolvV) since ob-taining approval from the German Federal Fi-nancial Supervisory Authority (BaFin) to use the Internal Ratings Based Approach (IRBA) on 1 January 2007.
Regulatory capital – i.e. equity – comprises equity tier 1 (essentially nominal capital, silent partner contributions and reserves, including the reserves under Section 340 g of the Com-mercial Code) plus supplementary capital (essentially profit participation rights and long-term subordinated liabilities) after de-ductible items.
The key performance indicators for common equity tier 1, equity tier 1 and total equity – the ratio of the respective equity components as a percentage of the risk positions calculat-ed in accordance with the requirements of the Capital Requirements Regulation (CRR) – may not fall below the minimum regulatory amounts. In its internal controlling, SaarLB also set additional requirements.
The requirements are constantly met by means of medium-term planning over a
EUR ’000s Revaluation reserve Actuarial losses Total
2014 2013 2014 2013 2014 2013
Balance as of 1 January 34,321 43,595 -3,835 -2,724 30,486 40,872
Measurement changes taken directly to equity 31,811 -18,383 -8,304 -1,624 18,507 -20,007
Changes in deferred taxes taken directly to equity -5,011 1,899 2,622 512 -2,389 2,411
Measurement changes taken to the income statement / recognition 4,705 7,210 - - 4,705 7,210
Balance as of 31 December 60,826 34,321 -9,517 -3,835 51,309 30,486

135
CORPORATE REPORT 2014 | NOTES
five-year timeframe. The Corporate Develop-ment segment is responsible for the strategic planning process. On the basis of the econom-ic conditions determined in this process, each business area performs its own risk exposure planning for this time period. Their figures are then collated at Group level by Profit Con-trolling – the department in charge of the quantitative aspects of medium-term plan-ning – and compared with the equity available in the planning period. Finally, the measures
needed to procure capital or scale back pro-posed business area budgeting are defined to ensure the targets are met.
An overview of the key CRR data as of the bal-ance sheet date of 31 December 2013 and the previous year’s corresponding figures (in ac-cordance with the SolvV) are provided below. SaarLB has not prepared regulatory group re-ports since the middle of 2011. To this extent, the figures only include the individual bank.
Both the equity tier 1 ratio and the total equi-ty ratio of SaarLB increased noticeably during the reporting period, while the risk assets re-mained at the same level. • The positive effect with regard to the
equity tier 1 ratio results from (1) replen-ishing the 340g HGB reserves on the ba-sis of the findings in the 2013 financial statements (roughly EUR 27 million) and (2) the decline in the reduction item for investments of roughly EUR 10 million.
• Total equity rose by roughly EUR 8 million on account of the lower value adjustment shortfalls.
SaarLB complied with the minimum regula-tory ratio during the entire reporting period at all times as well as its stricter target ra-tios. The good overall capital adequacy ratios were also reflected in the results of the re-quired regulatory stress tests (in accordance with the CRR): Based on the assumption of economic weakness, the equity ratio at the Group level was 10.9% (31 Dec. 2013: 10.2%), the equity tier 1 ratio was 10.5% (31 Dec. 2013: 10.0%) and the common equity tier 1 ratio was 7.7% as of the reporting date.
Key performance indicators in accordance with CRR (2014) and SolvV (2013)(in EUR million or in %)
31/12/2014 31/12/2013
Risk exposure (EUR million) 6,888 6,904
Equity 878 832
of which equity tier 1 847 809
of which common equity tier 1* 621 -
Total equity ratio 12.8% 12.1%
Equity tier 1 ratio 12.3% 11.7%
Common equity tier 1 ratio* 9.0% -
* The common equity tier 1 and the common equity tier 1 ratio have only been determined since the Capital Requirements Regulation (CRR) entered into force in 2014.

136
Economic capital (risk bearing capacity)
The core aim of SaarLB’s risk management, aside from complying with regulatory capital requirements, is to ensure that the economic risk-bearing capacity, which is the difference between risk capital (risk cover funds) and risk capital needed, is adequate.
Risk cover funds were fundamentally deter-mined on the basis of IFRS accounting and indicate the maximum actual level of unex-pected losses from risks entered into that can be borne:7
The risk cover funds fell in comparison to the previous year, primarily due to subordinated liabilities, which will fall due, before the end of the one-year assessment horizon, in the 4th quarter of 2015, and are partially com-pensated by the positive development in earnings after taxes, profit reserves and the
revaluation reserve. The conversion of silent reserves in the amount of EUR 100 million (contract of 27 October 2014) led to a change in the structure of the risk cover funds as of 31 December 2014, but the absolute amount remained unchanged despite this measure.
7 On account of the one-year analysis period, the equity items as of the reporting deadline are not reported in the risk cover funds, but rather the figures one year after the reporting deadline are recognised (if need be, reduced by maturities in the period under consideration).
Components of available cover fund(EUR million)
31/12/2014 31/12/2013 Delta
Results after taxes (minimum YTD and proj.) 51.4 36.0 +15.4
+ nominal capital 250.1 150.1 +100.0
+ capital reserves 69.1 69.1 -
+ retained earnings 238.2 203.8 +34.4
+ undated silent partner contributions 24.5 124.5 -100.0
+ dated silent partner contributions 218.6 218.6 -
+ profit participation rights 0.0 8.5 -8.5
+ subordinated liabilities 25.5 124.0 -98.5
+ revaluation reserve 72.6 41.9 +30.7
Risk cover funds 950.0 976.5 -26.5
less intangible assets 4.0 4.0 -
less balance of hidden charges and silent reserves from securities (LaR and HtM) -5.7 2.6 -8.3
less corrections in equity due to the surplus of deferred taxes -17.8 -12.3 -5.5
Liquidation cover funds +969.5 +982.2 -12.7
less losses from non-performing positions 18.5 17.8 +0.7
less anticipated losses from the risk assessment horizon 35.5 35.2 +0.3
Available cover funds +915.4 +929.2 -13.7

137
CORPORATE REPORT 2014 | NOTES
The available cover funds result from the risk cover funds due to the reductive considera-tion of other effects: • In the liquidity cover funds, elements
from the cover funds are corrected if it would be necessary to net them differ-ently in the case of a liquidation.
• Buffers for possible reductions in the risk cover funds are deducted over a one-year assessment horizon, which will not be explicitly considered in the future model-ling of the economic risk bearing capacity calculation.
As part of economic risk capital management, SaarLB monitors its risk profile and ensures its risk-bearing capacity is always adequate by comparing each month the risk capital
allocated to the available cover funds and risk capital needed. Risk capital needed is deter-mined by analysing all significant risk types in a consistent manner. The risks from across the Group are collated into an overall assessment of the risk existing. In ICAAP, the value at risk (VaR) method based on a confidence level of 99.95% is used to determine risk capital need-ed. The limiting takes place on the level of the individual risk types and collectively through the (total) allocated risk capital. The assump-tions and results of risk quantification are val-idated at least annually.
The ICAAP risk-bearing capacity as of the re-porting date is illustrated in the following overview:8
SaarLB’s risk bearing capacity was ensured at all times without limitations throughout the
reporting period (both in total and on the lev-el of individual types of risk).
8 The risk of unanticipated behaviour by home loan savers has not been classified as a significant risk since 1 January 2014 and is no longer considered in the risk-bearing capacity calculation. For reputation risks, a capital requirement of zero has been determined on the basis of the current liquidity preview.
Economic risk bearing capacity: capital needed and cover funds (in EUR million)
31/12/2014 31/12/2013
Capital needed
Limit Range Capital needed
Limit Range
Counterparty risk 217.6 315.0 69% 268.6 420.0 64%
of which default risk (136.6) (180.0) 76% (139.9) (180.0) 78%
of which credit spread risks (81.0) (135.0) 60% (128.7) (240.0) 54%
Market risk 45.9 90.0 51% 48.0 90.0 53%
Operational risk 6.8 10.0 68% 6.8 10.0 68%
Reputation risk 0.0 2.0 0% 0.0 2.0 0%
Unexp. behaviour by home loan savers - - - 0.7 3.0 23%
Real estate risk 13.1 15.0 87% 12.6 15.0 84%
Strategic risk/business risk 76.0 90.0 84% 76.6 90.0 85%
Total 359.4 522.0 69% 413.3 630.0 66%
Available cover funds 915.4 929.2
Free econ. cover funds 556.1 515.9

138
Besides the ICAAP risk capital needed, the risk capital needed in multiple scenarios, was cal-culated among others in the case of serious economic weakness modelled across all risk types under consistent assumptions. With
regard to counterparty risks, a sector-specific deterioration of the credit portfolio and a fur-ther increase in credit spreads are assumed, and for all other types of risk, more stringent assumptions also apply.
The need for capital fell significantly in the re-porting period, primarily due to the counter-party risk: The modelling of credit spread risks now takes place on the basis of a more precise model that shows a lower need for capital. Risks of defaults fell on account of the de-clines in the need for capital for significant clumps of risks (repayments of principal and/
or rating improvements). At the same time, the available economic cover funds increased noticeably. Overall, the available economic cover funds also continue to exceed the cap-ital needs under the assumption of a serious economic downturn as of the reporting date.
Serious economic weakness: capital needed and cover funds (in EUR million)
31/12/2014 31/12/2013
Counterparty risk 214.3 291.4
of which default risk (140.0) (174.3)
of which credit spread risks (74.3) (117.1)
Market risk 41.3 27.8
Operational risk 3.4 3.4
Reputation risk 0.0 0.0
Unexp. behaviour by home loan savers 0.0 0.2
Real estate risk 10.1 9.6
Strategic risk/business risk 40.0 40.3
Total 309.1 372.8
Free econ. cover funds 556.1 515.9
Free econ. cover funds with stress 247.0 143.2
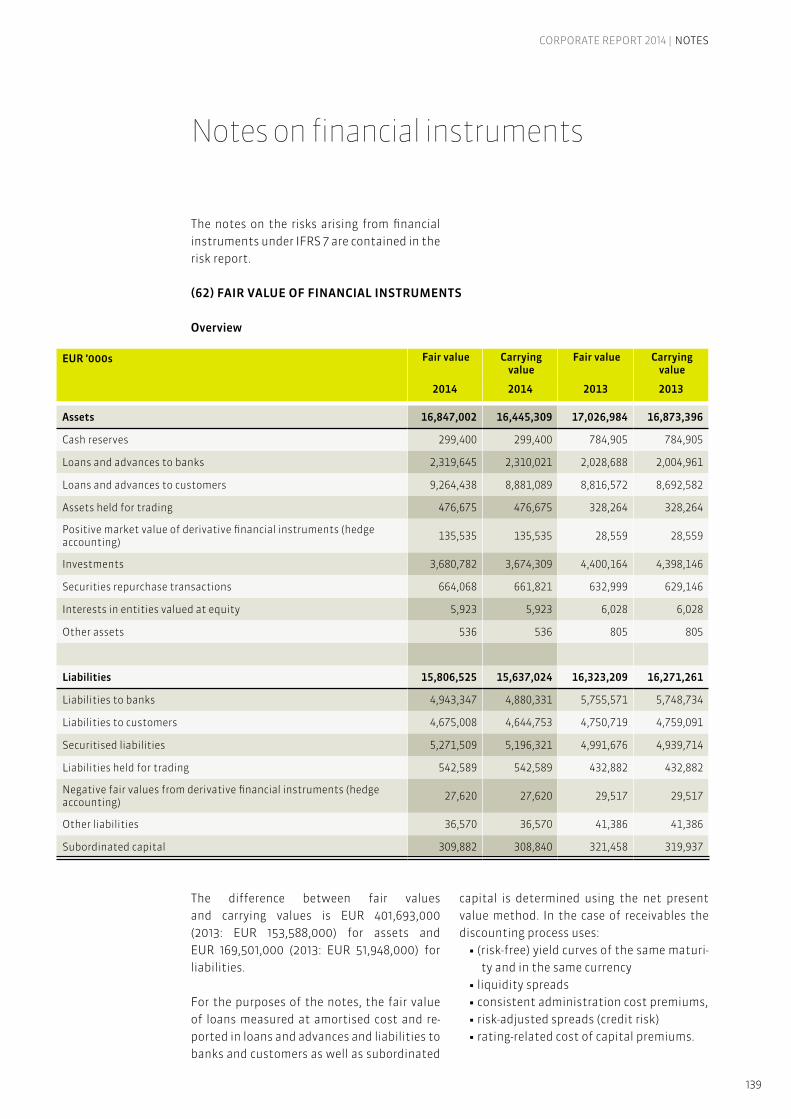
139
CORPORATE REPORT 2014 | NOTES
The notes on the risks arising from financial instruments under IFRS 7 are contained in the risk report.
The difference between fair values and carrying values is EUR 401,693,000 (2013: EUR 153,588,000) for assets and EUR 169,501,000 (2013: EUR 51,948,000) for liabilities.
For the purposes of the notes, the fair value of loans measured at amortised cost and re-ported in loans and advances and liabilities to banks and customers as well as subordinated
capital is determined using the net present value method. In the case of receivables the discounting process uses: • ( risk-free) yield curves of the same maturi-
ty and in the same currency • liquidity spreads • consistent administration cost premiums, • risk-adjusted spreads (credit risk) • rating-related cost of capital premiums.
(62) FAIR VALUE OF FINANCIAL INSTRUMENTS
Overview
Notes on financial instruments
EUR ’000s Fair value Carrying value
Fair value Carrying value
2014 2014 2013 2013
Assets 16,847,002 16,445,309 17,026,984 16,873,396
Cash reserves 299,400 299,400 784,905 784,905
Loans and advances to banks 2,319,645 2,310,021 2,028,688 2,004,961
Loans and advances to customers 9,264,438 8,881,089 8,816,572 8,692,582
Assets held for trading 476,675 476,675 328,264 328,264
Positive market value of derivative financial instruments (hedge accounting) 135,535 135,535 28,559 28,559
Investments 3,680,782 3,674,309 4,400,164 4,398,146
Securities repurchase transactions 664,068 661,821 632,999 629,146
Interests in entities valued at equity 5,923 5,923 6,028 6,028
Other assets 536 536 805 805
Liabilities 15,806,525 15,637,024 16,323,209 16,271,261
Liabilities to banks 4,943,347 4,880,331 5,755,571 5,748,734
Liabilities to customers 4,675,008 4,644,753 4,750,719 4,759,091
Securitised liabilities 5,271,509 5,196,321 4,991,676 4,939,714
Liabilities held for trading 542,589 542,589 432,882 432,882
Negative fair values from derivative financial instruments (hedge accounting) 27,620 27,620 29,517 29,517
Other liabilities 36,570 36,570 41,386 41,386
Subordinated capital 309,882 308,840 321,458 319,937
140
Risk-adjusted spreads are calculated by tak-ing the rating, the fixed interest period and the size of capital repayments.
In the case of liabilities, risk-adjusted spreads and rating-related cost of equity premiums are not used.
The cash reserves, the other accounts includ-ed in loans and advances and liabilities to banks and customers as well as the items re-ported in other assets and liabilities are dis-closed at their nominal amounts.
The fair values for the securitised liabilities are based on the prices that the Bank deter-mined itself as issuer.
See Note 8 on the methods and assumptions for the fair value calculation in assets and liabilities held for trading (including the neg-ative market value from derivative financial instruments from hedge accounting) and financial assets (including securities repur-chase transactions).

141
CORPORATE REPORT 2014 | NOTES
Fair values by classes
Assets
EUR ’000s Fair value Fair value
2014 2013
Cash reserves 299,400 784,905
Loans and advances to banks 2,319,645 2,028,688
Clearing and current accounts 207,446 421,679
Overnight and time deposits 1,396,527 985,099
Loans 630,926 563,074
Other loans and advances 84,747 58,836
Loans and advances to customers 9,264,438 8,816,572
Clearing and current accounts 241,247 201,757
Overnight and time deposits 447,537 254,978
Loans 8,547,142 8,328,701
Other loans and advances 28,512 31,136
Assets held for trading 476,675 328,264
Interest rate-related transactions 469,818 324,745
Equity-related transactions 5,098 2,671
Currency-related transactions 1,341 384
Credit derivatives 417 464
Positive market value of derivative financial instruments (hedge accounting) 135,535 28,559
Interest rate-related transactions 135,535 28,559
Investments 3,680,782 4,400,164
Bonds, notes and other fixed-interest securities 3,615,380 4,286,237
Money market instruments 439,675 719,696
Bonds and notes 3,175,705 3,566,541
Equities and other non-fixed-interest securities 9,148 67,236
Equities 469 469
Investment fund units 8,679 66,107
Other non-fixed-interest securities 0 660
Interests in subsidiaries 100 25
Non-consolidated joint ventures 88 0
Non-consolidated associates 2,205 2,292
Other investments 53,862 44,374
Securities repurchase transactions 664,068 632,999
Interests in entities valued at equity 5,923 6,028
Other assets 536 805

142
Liabilities
EUR ’000s Fair value Fair value
2014 2013
Liabilities to banks 4,943,347 5,755,571
Clearing and current accounts 707,244 598,852
Overnight and time deposits 1,516,085 2,156,687
Loans 2,586,374 2,860,258
Other liabilities 133,644 139,774
Liabilities to customers 4,675,008 4,750,719
Clearing and current accounts 1,145,730 933,739
Overnight and time deposits 786,178 1,141,201
Loans 2,097,680 2,094,835
Home loan savings deposits and savings deposits 568,787 548,420
Other liabilities 76,633 32,524
Securitised liabilities 5,271,509 4,991,676
Liabilities held for trading 542,589 432,882
Interest rate-related transactions 536,163 426,617
Equity-related transactions 5,098 2,671
Currency-related transactions 1,159 3,241
Credit derivatives 169 353
Negative fair values from derivative financial instruments (hedge accounting) 27,620 29,517
Interest rate-related transactions 27,620 29,517
Other liabilities 36,570 41,386
Subordinated capital 309,882 321,458

143
CORPORATE REPORT 2014 | NOTES
General level information
(63) LEVEL INFORMATION FOR FINANCIAL INSTRUMENTS MEASURED AT FAIR VALUE
EUR ’000s Level 1 Level 2 Level 3 Total
2014 2013 2014 2013 2014 2013 2014 2013
Assets held for trading 9,853 5,500 466,404 322,304 417 460 476,674 328,264
Interest rate-related transactions 4,756 2,828 465,062 320,774 - - 469,818 323,602
Equity-related transactions 5,098 2,672 - - - - 5,098 2,672
Currency-related transactions - - 1,341 1,526 - - 1,341 1,526
Credit derivatives - - - 4 417 460 417 464
Positive market value of de-rivative financial instruments (hedge accounting)
- - 135,535 28,559 - - 135,535 28,559
Interest rate-related transactions - - 135,535 28,559 - - 135,535 28,559
Investments 2,002,296 1,424,149 697,835 1,409,797 726,050 946,293 3,426,181 3,780,239
Bonds, notes and other fixed-interest securities 1,996,204 1,358,042 695,248 1,409,137 669,515 899,134 3,360,967 3,666,313
Money market instruments - - - 0 439,675 719,696 439,675 719,696
Bonds and notes 1,996,204 1,358,042 695,248 1,409,137 229,840 179,438 2,921,293 2,946,617
Equities and other non-fixed-interest securities 6,092 66,107 2,587 660 469 469 9,148 67,236
Equities - 66,107 - - 469 469 469 66,576
Investment fund units 6,092 - 2,587 - - - 8,679 -
Other non-fixed-interest securities - - - 660 - - - 660
Subsidiaries - - - - - - - -
Associates not consolidated - - - - - - - -
Other investments - - - - 56,066 46,690 56,066 46,690
Securities repurchase transactions 96,371 57,500 200,188 206,188 - - 296,560 263,688
Liabilities held for trading 9,959 5,169 532,629 457,230 - - 542,589 462,399
Interest rate-related transactions 4,861 2,497 531,302 451,049 - - 536,163 453,546
Equity-related transactions 5,098 2,672 - - - - 5,098 2,672
Currency-related transactions - - 1,159 5,827 - - 1,159 5,827
Credit derivatives - - 169 354 - - 169 354
Negative fair values from derivative financial instruments (hedge accounting)
- - 27,620 29,517 - - 27,620 29,517
Interest rate-related transactions - - 27,620 29,517 - - 27,620 29,517

144
Level 1:
Level 1 consists of those financial instruments for which a transaction-based price could be determined on or shortly before or after the balance sheet date at a not insignificant trad-ing volume. For derivatives, these include in particular prices that were determined on the EUREX. Accordingly, the SaarLB Group presents securities that have a price listed on an active market and OTC derivatives under level 1.
Level 2:
Level 2 consists of financial instruments where the significant input parameters for the determination of the fair value are exclu-sively observed on the market. This relates in particular to derivatives not traded over-the-counter where valuation models with input parameters observable on the market are used to determine their fair value (primarily observable interest and spread curves). For securities that do not meet the criteria ac-cording to Level 1 and whose courses are ob-servable on the market, allocation to Level 2 take place unless there are indications that allocation to another level is appropriate.
Level 3:
Level 3 consists of financial instruments where the criteria for allocation to Level 1 or 2 were absent, i.e. where input parameters that are not observed on the market have a signif-icant influence on the determination of the fair value. These include loans and debt se-curities for which only the indicative courses are present (counterparty prices that do not represent an offer). SaarLB derives spreads from internal ratings for CDS to a limited ex-tent; consequently, these derivatives are allo-cated to Level 3 on account of the significant influence of credit spreads on the fair value. Furthermore, this level contains investments which are measured at fair value.

145
CORPORATE REPORT 2014 | NOTES
Level information for financial instruments that are not reported at fair value
In the following table, SaarLB shows the in-formation in accordance with IFRS 13.97.
Sensitivity analyses:
If the spread as an input parameter varies by 10% for a CDS assigned to Level 3 – i.e. start-ing from a measurement with a spread of 22 basis points, this produces an interval of 19.8 - 24.2 basis points – then the fair value would change by approx. 1.33%. The fair value of the CDS allocated to level 3 and valued in this way amounts to EUR 417,000 (2013: EUR 461,000). If the spreads fall by 10%, the positive market value rises accordingly to EUR 423,000 (2013: EUR 482,000).
The investments are particularly valued on the basis of the so-called risk-free interest and a risk surcharge, which consists of the market risk premium and the beta factor (rep-resentation of sector volatility). If the input parameters are uniformly raised (reduced) by 10%, the value of the investments of EUR 19,558,000 (2013: EUR 30,552,000) meas-ured at fair value falls by EUR 6,006,000 (2013: EUR 4,842,000) or rises by EUR 7,143,000 (2013: EUR 3,937,000). If only one input pa-rameter varies by 10%, the change in the fair value is less.
EUR ’000s Level 1 Level 2 Level 3 Total
2014 2013 2014 2013 2014 2013 2014 2013
Cash reserves - - 299,400 784,904 - - 299,400 784,904
Loans and advances to banks - - 2,038,590 1,813,249 281,055 215,437 2,319,645 2,028,686
Loans and advances to customers - - 2,097,292 1,688,995 7,167,146 7,127,576 9,264,438 8,816,571
Investments 77,202 195,263 476,598 706,374 68,121 87,600 621,921 989,237
Bonds, notes and other fixed-interest securities 77,202 195,263 109,089 337,062 68,121 87,600 254,412 619,925
Bonds and notes 77,202 195,263 109,089 337,062 68,121 87,600 254,412 619,925
Securities repurchase transactions - - 367,509 369,312 - - 367,509 369,312
Non-consolidated subsidiaries - - - - 100 25 100 25
Non-consolidated joint ventures - - - - 88 - 88 -
Interests in entities valued at equity - - - - 5,923 6,028 5,923 6,028
Other assets - - 536 805 - - 536 805
Liabilities to banks - - 2,846,307 3,458,723 2,097,040 2,296,848 4,943,347 5,755,571
Liabilities to customers - - 3,259,335 4,213,132 1,415,673 537,587 4,675,008 4,750,719
Securitised liabilities - - 5,271,509 4,991,676 - - 5,271,509 4,991,676
Other liabilities 36,570 41,386 36,570 41,386
Subordinated capital - - - - 309,882 321,458 309,882 321,458
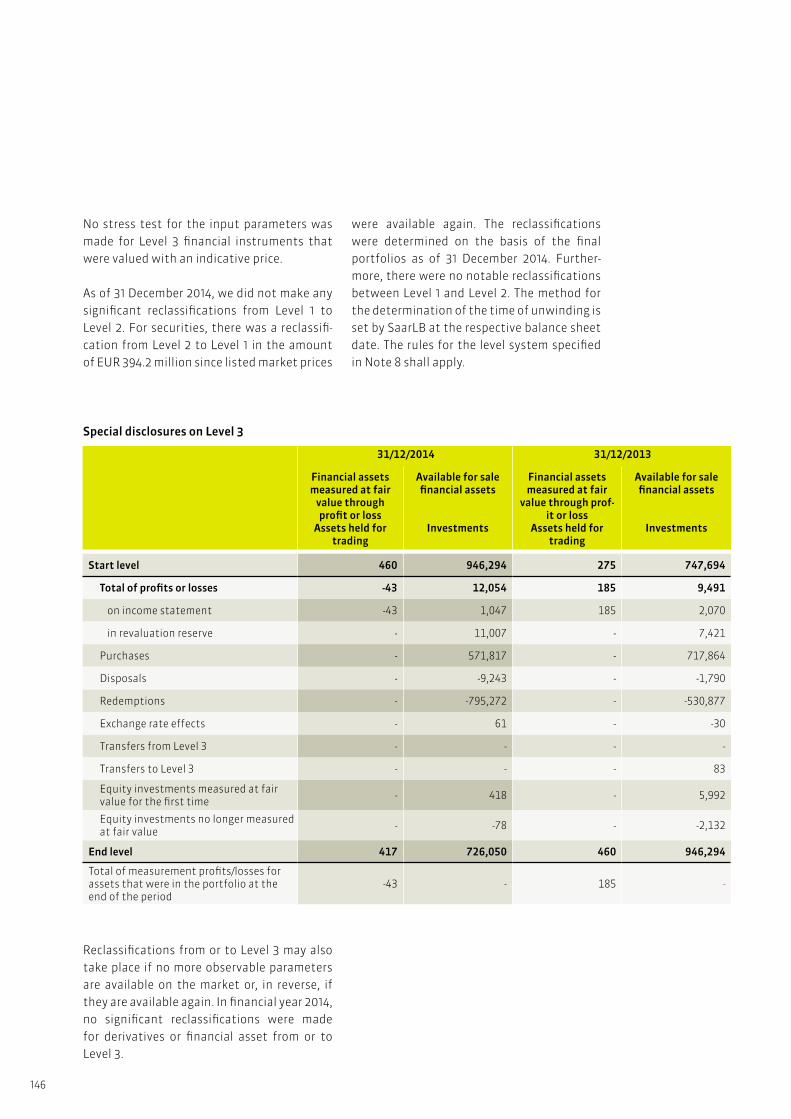
146
Special disclosures on Level 3
No stress test for the input parameters was made for Level 3 financial instruments that were valued with an indicative price.
As of 31 December 2014, we did not make any significant reclassifications from Level 1 to Level 2. For securities, there was a reclassifi-cation from Level 2 to Level 1 in the amount of EUR 394.2 million since listed market prices
were available again. The reclassifications were determined on the basis of the final portfolios as of 31 December 2014. Further-more, there were no notable reclassifications between Level 1 and Level 2. The method for the determination of the time of unwinding is set by SaarLB at the respective balance sheet date. The rules for the level system specified in Note 8 shall apply.
Reclassifications from or to Level 3 may also take place if no more observable parameters are available on the market or, in reverse, if they are available again. In financial year 2014, no significant reclassifications were made for derivatives or financial asset from or to Level 3.
31/12/2014 31/12/2013
Financial assets measured at fair
value through profit or loss
Assets held for trading
Available for sale financial assets
Investments
Financial assets measured at fair
value through prof-it or loss
Assets held for trading
Available for sale financial assets
Investments
Start level 460 946,294 275 747,694
Total of profits or losses -43 12,054 185 9,491
on income statement -43 1,047 185 2,070
in revaluation reserve - 11,007 - 7,421
Purchases - 571,817 - 717,864
Disposals - -9,243 - -1,790
Redemptions - -795,272 - -530,877
Exchange rate effects - 61 - -30
Transfers from Level 3 - - - -
Transfers to Level 3 - - - 83
Equity investments measured at fair value for the first time - 418 - 5,992
Equity investments no longer measured at fair value - -78 - -2,132
End level 417 726,050 460 946,294
Total of measurement profits/losses for assets that were in the portfolio at the end of the period
-43 - 185 -

147
CORPORATE REPORT 2014 | NOTES
(64) FINANCIAL INSTRUMENT MEASUREMENT CATEGORIES
EUR ’000s 2014 2013
Assets
Financial assets measured at fair value through profit or loss 753,422 644,741
Fair value option 276,747 316,477
Investments 276,747 316,477
Financial assets held for trading 476,675 328,264
Assets held for trading 476,675 328,264
Investments held to maturity (held to maturity) 449,676 588,789
Investments 84,414 223,330
Securities repurchase transactions 365,262 365,459
Loans and receivables 11,780,683 11,999,353
Cash reserves 299,400 784,905
Loans and advances to banks1) 2,326,746 2,021,687
Loans and advances to customers1) 8,989,368 8,797,381
Investments 163,526 394,575
Other assets 1,643 805
Available for sale financial assets (available for sale) 3,446,717 3,727,451
Investments 3,149,622 3,463,764
Securities repurchase transactions 296,560 263,687
Other assets 536 -
Positive market value of derivative financial instruments (hedge accounting) 135,535 28,559
Liabilities
Financial liabilities measured at fair value through profit or loss 542,589 432,882
Fair value option - -
Financial liabilities held for trading (held-for-trading) 542,589 432,882
Liabilities held for trading 542,589 432,882
Liabilities measured at amortised cost 15,066,815 15,808,862
Liabilities to banks 4,880,332 5,748,734
Liabilities to customers 4,644,753 4,759,091
Securitised liabilities 5,196,321 4,939,714
Subordinated capital 308,840 319,937
Other liabilities 36,570 41,386
Negative fair values from derivative financial instruments (hedge accounting) 27,620 29,517
1) Before deducting risk provisions

148
(65) NET GAINS OR LOSSES ON FINANCIAL INSTRUMENTS
For each category, net gains or losses on fi-nancial instruments include both measure-ment gains and losses and gains or losses on disposal.
Gains amounting to EUR 31,811,000 (2013: EUR -18,383,000) on fair value measurement of available for sale financial assets was taken straight to the revaluation reserve in equity (see Note 61).
EUR ’000s Net interest income
Risk provisions Gain/loss on fair value
measurement
Gain/loss on hedge accounting
Gain/loss on investments
Total
2014 2013 2014 2013 2014 2013 2014 2013 2014 2013 2014 2013
Financial assets and liabilities measured at fair value through profit and loss
2,137 -4,015 - - 48,990 19,659 99,183 -17,372 - - 150,310 -1,728
Fair value option 7,974 9,974 - - 6,317 -1,369 - - - - 14,291 8,605
Financial assets held for trading1) -5,837 -13,989 - - 42,674 21,028 99,183 -17,372 - - 136,020 -10,333
Loans and receivables2) 282,892 308,967 -16,168 -20,004 - - 9,601 -4,244 102 -2,591 276,427 282,128
Financial assets available for sale3) 52,205 62,817 - - - - 6 -6 722 -647 52,933 62,164
Investments held to maturity 6,027 10,710 - - - - - - 101 -29 6,128 10,681
Liabilities measured at amortised cost -220,933 -257,116 - - - - -111,504 22,070 - - -332,437 -235,046
1) Including gains/losses on currency conversion2) Including financial assets in the loans and receivables category3) Including shares of profits in associated companies accounted for using the equity method

149
CORPORATE REPORT 2014 | NOTES
(66) DERIVATIVE TRANSACTIONS
Interest and foreign currency-related and other forward transactions and credit deriva-tives not settled at the balance sheet date are shown in the tables below. Most of the deals
were concluded to hedge fluctuations in in-terest rates, exchange rates or market prices and trading on behalf of customers.
Volumes
EUR ’000s Nominal value Positive fair value
Negative fair value
2014 2013 2013 2014
Interest-rate risks
Interest rate swaps 12,870,655 12,632,905 599,384 -557,163
of which interest rate swaps under hedge accounting 2,046,957 1,414,206 124,889 -24,321
Swaptions 10,000 - - -538
Caps, floors 1,504,468 1,512,129 1,214 -1,221
Futures 1,287,707 1,012,939 4,756 -4,862
Total interest rate risk 15,672,830 15,157,973 605,354 -563,784
Currency risks
Forward foreign exchange transactions 124,193 203,834 1,341 -1,159
Currency swaps, currency/interest swaps - 27,243 - -
Foreign exchange options - - - -
- Purchases - - - -
- Sales - - - -
Total currency risks 124,193 231,077 1,341 -1,159
Equity and other price risks
Index options 440,996 232,386 2,029 -2,029
- Purchases 220,498 116,193 2,029 -
- Sales 220,498 116,193 - -2,029
Equity options 106,252 87,220 2,226 -2,226
- Purchases 53,126 43,610 2,226 -
- Sales 53,126 43,610 - -2,226
Futures 54,639 46,449 843 -843
Total equity and other price risks 601,887 366,055 5,098 -5,098
Credit derivative risks
Protection buyer - - - -
Protection seller 30,000 50,000 417 -168
Total credit derivative risks 30,000 50,000 417 -168
Total 16,428,910 15,805,105 612,210 -570,209

150
Breakdown of maturities
The information is based on contractual resid-ual maturities. Please refer to the risk report
for more information in this connection.
Breakdown by counterparty
Nominal value
Interest-rate risks Currency risks Equity and other price risks
Credit derivative risks
EUR ’000s 2014 2013 2014 2013 2014 2013 2014 2013
Residual terms
up to 3 months 429,000 528,725 99,483 203,356 573,263 341,897 - 5,000
up to 1 year 2,248,022 1,435,957 24,710 27,394 28,587 24,072 - -
up to 5 years 7,271,693 7,275,573 - 327 37 86 30,000 45,000
more than 5 years 5,724,115 5,917,718 - - - - - -
Total 15,672,830 15,157,973 124,193 231,077 601,887 366,055 30,000 50,000
Nominal value Positive fair value Negative fair value
EUR ’000s 2014 2013 2014 2013 2014 2013
OECD banks 13,117,494 12,858,381 442,633 258,068 -557,542 -457,234
Public-sector entities within the OECD 360,173 340,642 20,500 3,108 -65 -468
Other counterparties 2,951,243 2,606,082 149,077 95,647 -12,602 -4,697
Total 16,428,910 15,805,105 612,210 356,823 -570,209 -462,399

151
CORPORATE REPORT 2014 | NOTES
(67) NOTES TO ITEMS IN THE CASH FLOW STATEMENT
The cash flow statement shows the cash flows resulting from operating activities, in-vesting activities and financing activities for the financial year.
Cash and cash equivalents reported are equal to the cash reserves item on the balance sheet, which comprises cash on hand and de-posits at central banks.
Cash and cash equivalents are not subject to any restrictions on the right of disposal.
Payments from loans and advances to banks/customers, securities (unless investments), derivatives and other assets are shown as cash flows from operating activities. Pay-ments from liabilities to banks/customers, securitised liabilities and other liabilities are also assigned to operating activities. Interest and dividend payments from operating activ-ities are also included under cash flows from operating activities.
Cash flows from investing activities shows payments for investments and property, plant and equipment (including intangibles).
The cash flow from financing activities in-cludes payments to silent partners and hold-ers of profit participation rights and changes in subordinated capital.
Notes to the cash flow statement

152
(68) SUBORDINATED ASSETS
The following balance sheet items contain subordinated assets:
(69) ASSETS AND LIABILITIES IN FOREIGN CURRENCIES
(70) TRANSFERRED, BUT NOT FULLY WRIT-TEN-OFF FINANCIAL ASSETS
As of 31 December 2014, SaarLB did not have any such assets.
Other notes
EUR ’000s 2014 2013
Loans and advances to banks 12,000 12,000
Investments 10,000 -
Total 22,000 12,000
EUR ’000s 2014 2013
Foreign currency assets 470,790 685,494
CAD 6,586 15,926
CHF 130,945 240,344
GBP 60,541 70,312
HKD 442 319
JPY 3,715 3,175
USD 255,427 320,005
Other currencies 13,134 35,412
Foreign currency liabilities 456,328 626,110
CAD 2,211 2,193
CHF 93,537 113,206
GBP 28,964 31,551
HKD 436 314
JPY 382 53
USD 329,571 456,518
Other currencies 1,228 22,275

153
CORPORATE REPORT 2014 | NOTES
(71) TRANSFERRED, FULLY WRITTEN-OFF FINANCIAL ASSETS
In 2012, SaarLB transferred a financial asset that was written off in full, but in which it still had ongoing exposure. The ongoing ex-posure consisted of the repayment option for the written-off receivable if the shares in the borrower are sold with income in the next 12 years. The claim was sold for EUR 1 and it could not be assumed that the shares in the borrower will be sold for a profit. For this
reason, the fair value of the ongoing exposure as of 31 December 2012 amounted to EUR 0. There is no loss risk from the ongoing expo-sure for SaarLB. At the time of the transfer of the financial asset, SaarLB incurred a loss of EUR 2,782,000.
No use was made of the option to repay in 2014.
(72) ASSETS PLEDGED AS COLLATERAL
The collateral pledged relates to securities repurchase transactions, tender transactions with the European Central Bank (ECB), trans-actions on the European Exchange (EUREX), with Clearstream Banking of Frankfurt am Main and Clearstream Banking Luxembourg.
In these cases substantially all risks and re-wards associated with ownership of the trans-ferred assets remain with the SaarLB Group.
Assets pledged as collateral relate to the fol-lowing balance sheet items:
The transferred assets back liabilities in the amount of EUR 1,620,085,000 (2013: EUR 1,405,618,000).
These transactions were executed at stand-ard market conditions.
EUR ’000s 2014 2013
Loans and advances to banks and customers 494,529 495,276
Investments 1,409,019 2,057,715
of which:Collateral that may be sold on or pledged on by the recipient 661,821 629,146
Total 1,903,548 2,552,991

154
(73) COLLATERAL RECEIVED THAT MAY BE SOLD ON OR PLEDGED ON
As part of securities repurchase transactions and securities lending transactions we re-ceive assets lodged as collateral that may be sold on or pledged on without the collateral
provider defaulting. We held no such securi-ties in the portfolio on 31 December 2014.
The leased assets are real estate. The leasing agreements include some with fixed maturi-ties and some which are open-ended. The long-est fixed maturity expires on 31 October 2025. In some cases on expiry, the lessee has the unilateral option to extend the agreement or
the option to a contractually agreed exten-sion provided the other party does not object. There are no conditional payments.
The leasing agreements mainly relate to the rental of fixtures and fittings. They have fixed
terms of three to five years. There are no op-tions or conditional payments.
The SaarLB Group as lessee:
(74) LEASING TRANSACTIONS
Operating leases
The SaarLB Group as lessor:
EUR ’000s 2014 2013
Lease agreements (residual maturities) 4,225 4,556
up to 1 year 1,082 1,237
more than 1 year and up to 5 years 2,522 2,553
more than 5 years 621 766
EUR ’000s 2014 2013
Future minimum leasing payments from non-callable lease agreements(residual maturities)
1,619 1,410
up to 1 year 735 715
more than 1 year and up to 5 years 884 695
more than 5 years - -
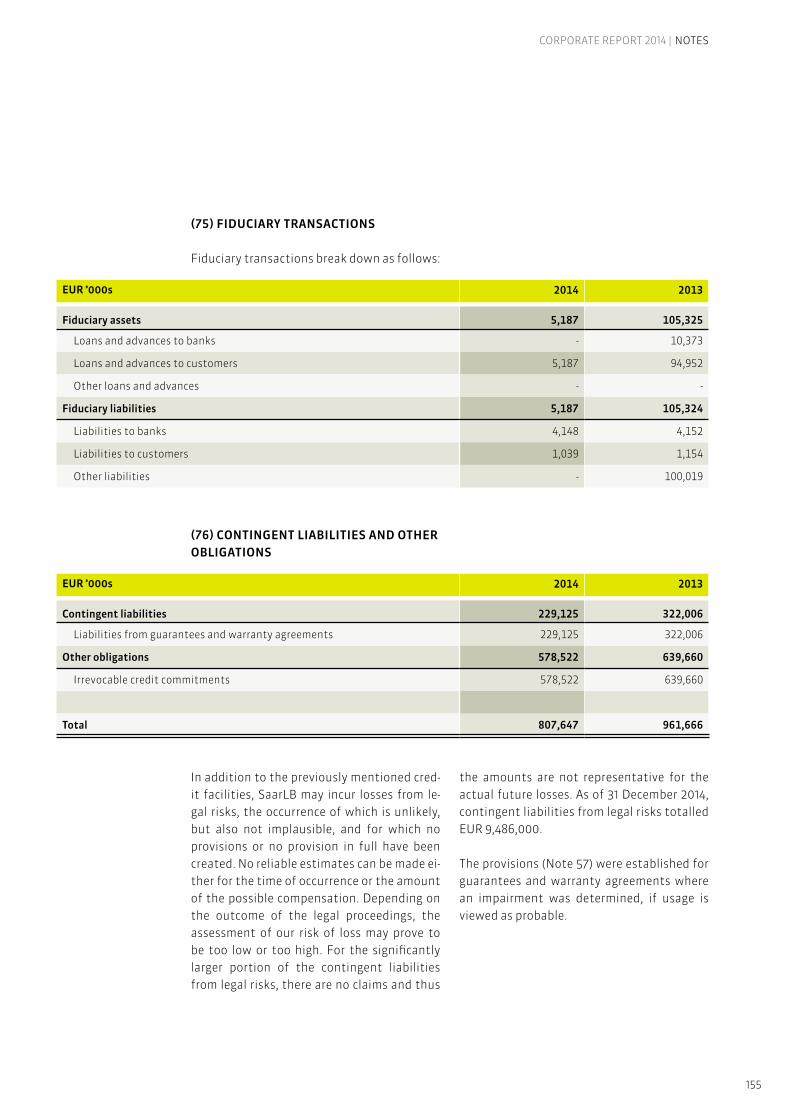
155
CORPORATE REPORT 2014 | NOTES
In addition to the previously mentioned cred-it facilities, SaarLB may incur losses from le-gal risks, the occurrence of which is unlikely, but also not implausible, and for which no provisions or no provision in full have been created. No reliable estimates can be made ei-ther for the time of occurrence or the amount of the possible compensation. Depending on the outcome of the legal proceedings, the assessment of our risk of loss may prove to be too low or too high. For the significantly larger portion of the contingent liabilities from legal risks, there are no claims and thus
the amounts are not representative for the actual future losses. As of 31 December 2014, contingent liabilities from legal risks totalled EUR 9,486,000.
The provisions (Note 57) were established for guarantees and warranty agreements where an impairment was determined, if usage is viewed as probable.
(75) FIDUCIARY TRANSACTIONS
Fiduciary transactions break down as follows:
(76) CONTINGENT LIABILITIES AND OTHER OBLIGATIONS
EUR ’000s 2014 2013
Fiduciary assets 5,187 105,325
Loans and advances to banks - 10,373
Loans and advances to customers 5,187 94,952
Other loans and advances - -
Fiduciary liabilities 5,187 105,324
Liabilities to banks 4,148 4,152
Liabilities to customers 1,039 1,154
Other liabilities - 100,019
EUR ’000s 2014 2013
Contingent liabilities 229,125 322,006
Liabilities from guarantees and warranty agreements 229,125 322,006
Other obligations 578,522 639,660
Irrevocable credit commitments 578,522 639,660
Total 807,647 961,666

156
(77) OTHER FINANCIAL OBLIGATIONS
Furthermore, there are financial obligations under operating leases and in relation to rental, usage, service and maintenance agree-ments (see Note 74).
Moreover, under the articles of the deposit insurance fund run by the Landesbanks and giro associations, SaarLB has undertaken to indemnify the Deutscher Sparkassenverband
e. V. (German Savings Bank Association), as the owner of the deposit security reserve of the Landesbanks and giro associations, against any losses which may be incurred due to measures taken in favour of banks in which SaarLB holds shares. As members of deposit protection schemes, the branches are also liable under the provisions governing those schemes.
(78) LIST OF SAARLB’S SHAREHOLDINGS
The following table contains a list of SaarLB’s shareholdings.
EUR ’000s 2014 2013
Additional funding obligations to security reserve of the Landesbanks 14,469 21,527
Additional obligations and additional co-liability for other shareholders 2,712 7,012
Commitments not yet called 2,315 2,315
Obligations to acquire shares 2,784 3,448

157
CORPORATE REPORT 2014 | NOTES
Name Notes Share in %
Equity/fund assets
Total assets
Total liabilities
Income Net income
EUR ‘000s3) EUR ‘000s EUR ‘000s EUR ‘000s EUR ‘000s4)
Special funds included in the consolidat-ed financial statements
6)
LB ImmoInvest Saar-Fonds, Hamburg 1) 100.00 40,462 42,102 1,640 1,734 557
SaarLB 1-Fonds, Munich 2) 100.00 158,428 158,533 105 918 895
SBLB-Fonds, Munich 2) 100.00 69,381 69,381 - 4,771 4,748
SBLB-2-Fonds, Munich 2) 100.00 69,266 69,266 - 4,621 4,598
SBLBHALBS-Fonds, Munich 2) 100.00 32,339 32,339 - 1,994 1,971
Subsidiaries included in the consolidated financial statements
SaarLB-Bankenbeteiligungsgesellschaft mbH, Saarbrücken
5)
6) 100.00 15,577 17,445 1,868 1,869 1,868
LBS Immobilien GmbH, Saarbrücken 5) 100.00 300 1,093 793 3,117 40
Associated companies included in the consolidated financial statements
Gekoba-Gesellschaft für Gewerbe- und Kommunalbauten mbH, Saarbrücken 38.00 6,297 19,630 13,333 922 4
GSW-Saarländische Wohnungsbau-gesellschaft mbH, Saarbrücken 28.57 8,310 15,075 6,765 2,342 -103
NBV Beteiligungs GmbH, Hamburg 21.33 14,996 15,005 9 1,324 2,218
Subsidiaries not included in the consolidated financial statements
LBS Vertriebs GmbH, Saarbrücken 5) 100.00 25 267 242 973 125
IVS Immobilien Verwaltungs GmbH Saar, Saarbrücken
7) 50.10 - - - - -
LBS Gutachter GmbH, Saarbrücken 7) 100.00 - - - - -
Joint ventures not included in the consolidated financial statements
TEGES Grundstücksvermietungs-gesellschaft mbH, Berlin 50.00 20 25 5 37 1
Associates not included in the consolidated financial statements
TEGES Grundstücksvermietungs-gesellschaft mbH & Co. Objekt Berlin KG, Berlin
47.01 -7,397 9,949 17,346 1,342 -31
Saarländische Kapitalbeteiligungs-gesellschaft mbH, Saarbrücken 33.33 6,972 39,066 32,094 3,008 115
Saarländische Wagnisfinanzierungs-gesellschaft mbH, Saarbrücken 30.43 6,695 11,647 4,952 793 -448

158
Notes:1) Income relates to rental income less admin-
istrative expenses.2) Income relates to interest income, commis-
sion income and gains or losses on fair val-ue measurement less interest expense and commission expense.
3) Equity as defined in Section 266 (3A) in con-junction with Section 272 of the German Commercial Code (HGB)
4) Net income/loss for the year as defined in Section 275 (2) No. 20 of the German Com-mercial Code (HGB)
5) There is a profit and loss transfer agreement with this company.
6) These subsidiaries, incl. the special fund, have a different financial year than the par-ent company (31 March).
7) These companies were formed in financial year 2014.
An interest of less than 20% with voting rights of more than 5% is held in Saarländi-sche Investitionskreditbank AG.

159
CORPORATE REPORT 2014 | NOTES
(79) ADMINISTRATIVE BODIES OF SAARLB
Board of Administration
Jan-Christian DreesenDeputy Chairman of the Board of Management, FC Bayern München AG, Munich, Chairman
Dr. Micheal BraunSegment Manager for Corporate Strategy and Corporate, Communication at Bayerische Landesbank, Munich(until 31 January 2014; from 03 April 2014)
Dr. Winfried FreygangTutzing(until 03 April 2014) Marcus KramerMember of the Board of Management ofBayerische Landesbank, Munich(until 03 April 2014)
Klaus MeiserMember of the Landtag of Saarland, Chairman of the CDU group of the Landtag of Saarland, Saarbrücken(from 03 April 2014)
Anke RehlingerMinister, Ministry of Economic Affairs, Labour, Energy and Traffic, Saarbrücken(from 25 February 2014)
Thomas RoßBank employeeLandesbank Saar, Saarbrücken
Stephan ToscaniMinister, Ministry of Finance and Europe,Saarbrücken
Representative of the regulatory body:
Iris JungUndersecretary, Ministry of Economic Affairs, Labour, Energy and Traffic,Saarbrücken
Dr. Alfons LauerPresident, Saar Association of Savings Banks, Saarbrücken, Deputy Chairman(from 10 February 2014)deceased on 21 February 2015
Gunar FethChairman of the Board of Management, Kreissparkasse Saarpfalz,Homburg(from 10 February 1014 until 03 April 2014)
Thomas KleinBank eymployeeLandesbank Saar, Saarbrücken
Clemens LindemannDistrict AdministratorSaarpfalz District, Homburg(from 03 April 2014)
Fred MetzkenChief Financial OfficerAG der Dillinger Hüttenwerke and Saarstahl AG, Dillingen
Susanne RiesBank employee, Landesbank Saar, Saarbrücken(until 03 April 2014)
Ralph SingerBank employee, Landesbank Saar, Saarbrücken
Luzia WelterBank employee, Landesbank Saar,Saarbrücken(from 03 April 2014)

160
Board of ManagementAs of: 31 December 2014
Thomas Christian BuchbinderChairman of the Board of Management
Frank EloyMember of the Board of Management
Board of ManagementAs of: 01 January 2015
Werner SeverinChairman of the Board of Management
Dr. Matthias BöckerMember of the Board of Management
Werner SeverinDeputy Chairman of the Board of Management
Frank EloyMember of the Board of Management

161
CORPORATE REPORT 2014 | NOTES
(80) RELATED PARTY DISCLOSURES
Companies and persons are deemed to be re-lated where one party directly or indirectly controls the other or can exercise significant influence on its operating and business deci-sions. Related parties of the SaarLB Group as of 31 December 2014 include:
• Saarland and its subsidiaries and joint ven-ture companies,
• all subsidiaries of joint ventures of Saar-land (except for the last level),
• all subsidiaries and joint ventures of sub-sidiaries of Saarland (except for the last level),
• the subsidiaries and associates of SaarLB, • all joint ventures and associates of subsid-
iaries of SaarLB (except for the last level), • all subsidiaries of associates of SaarLB (ex-
cept for the last level) • the Saar Association of Savings Banks and
its subsidiaries and joint venture compa-nies,
• people occupying key positions and close members of their families as well as com-panies controlled or significantly influ-enced by these people or their close family members or in which they hold a significant share of the voting rights; people in key positions are those with direct and indi-rect responsibility for planning, managing and monitoring the activities of SaarLB. This includes members of the Board of Management and Board of Administration of SaarLB, chief representatives and their close family members. There were mainly changes in the year under review due to the departure of BayernLB from the group of shareholders.
• the fund management company for pen-sion plans for SaarLB employees, which are used after the end of the employment relationship.
The SaarLB Group has business dealings with related companies and persons. Transactions with such persons and companies fall within the normal course of business and are always
on the same terms (including interest rates and collateral) as for comparable transactions conducted at the same time with third par-ties. These transactions did not have unusual-ly high risks of recovery or other unfavourable characteristics.
Details of the subsidiaries and associated companies in which SaarLB holds an interest can be found in the list of shareholdings.
Financial assets and liabilities as well as hy-brid capital with respect to related parties:

162
EUR ’000s 31/12/2014 31/12/2013
Loans and advances to banks 11,408 15,311
Subsidiary and joint venture company of Saarland 11,408 15,311
Loans and advances to customers 482,962 432,095
Saarland 90,682 56,173
Subsidiaries and joint venture companies of Saarland 330,887 307,768
Subsidiaries 28,104 28,631
Consolidated associated companies 7,757 5,121
Non-consolidated associated companies 25,532 34,402
Assets held for trading 11,119 10,285
Subsidiaries and joint venture companies of Saarland 11,119 10,285
Investments 71,418 72,565Saarland 71,418 72,565
EUR ’000s 31/12/2014 31/12/2013
Liabilities to banks - 707,402
Subsidiaries and joint venture companies of Saarland - 707,402
Liabilities to customers 39,266 32,482
Sparkassenverband Saar 19,836 17,475
Saarland 3,596 35
Subsidiaries and joint venture companies of Saarland 7,706 9,164
Consolidated associates 21 60
Non-consolidated associates 8,107 5,748
Liabilities held for trading 1,089 142Subsidiaries and joint venture companies of Saarland 1,089 142
EUR ’000s 31/12/2014 31/12/2013
Receivables 37 3,963
Liabilities 39,836 29,272
Liabilities to customers 19,836 21,672
Subordinated capital 20,000 7,600
EUR ’000s 31/12/2014 31/12/2013
Income 4,674 9,708
Interest 4,674 9,708
Commissions - -
Expenses 3,780 47,344
Interest 3,780 47,344
Commissions - -
Amounts due from/to ZVK
There were the following expenses and in-come from loan agreements and deposits as
well as rendered services in connection with related parties and people:
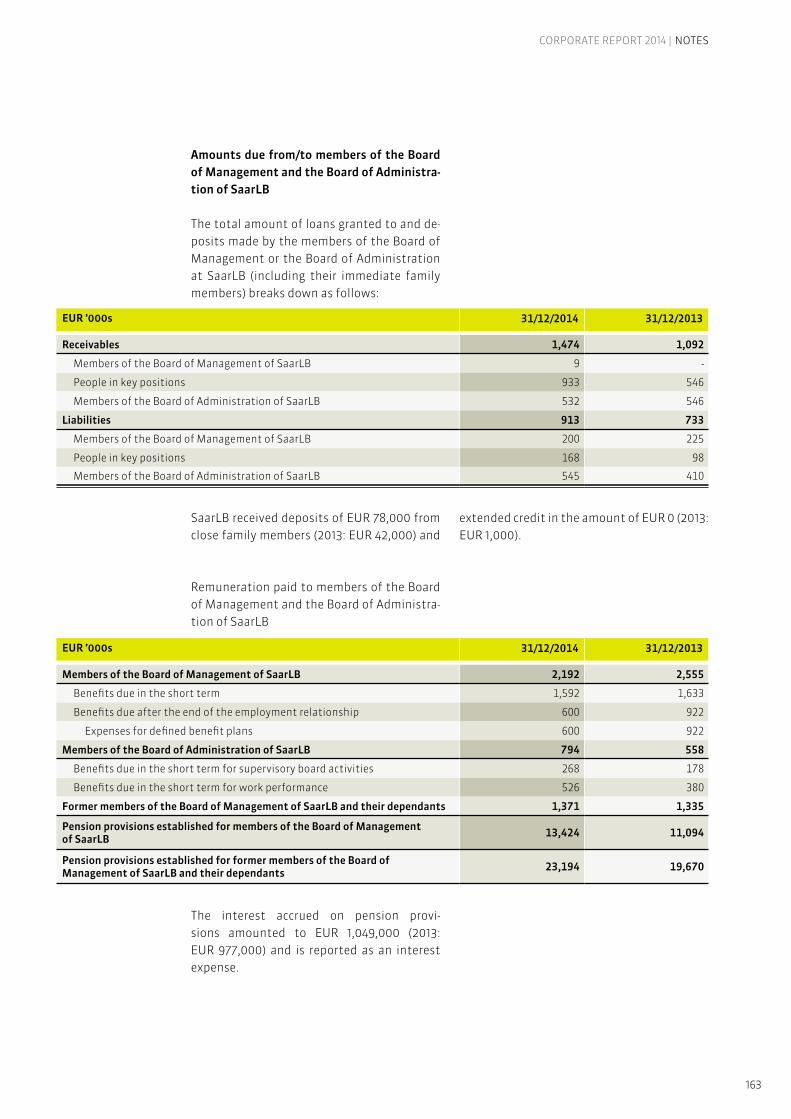
163
CORPORATE REPORT 2014 | NOTES
Amounts due from/to members of the Board of Management and the Board of Administra-tion of SaarLB
The total amount of loans granted to and de-posits made by the members of the Board of Management or the Board of Administration at SaarLB (including their immediate family members) breaks down as follows:
SaarLB received deposits of EUR 78,000 from close family members (2013: EUR 42,000) and
extended credit in the amount of EUR 0 (2013: EUR 1,000).
EUR ’000s 31/12/2014 31/12/2013
Receivables 1,474 1,092
Members of the Board of Management of SaarLB 9 -
People in key positions 933 546
Members of the Board of Administration of SaarLB 532 546
Liabilities 913 733
Members of the Board of Management of SaarLB 200 225
People in key positions 168 98
Members of the Board of Administration of SaarLB 545 410
EUR ’000s 31/12/2014 31/12/2013
Members of the Board of Management of SaarLB 2,192 2,555
Benefits due in the short term 1,592 1,633
Benefits due after the end of the employment relationship 600 922
Expenses for defined benefit plans 600 922
Members of the Board of Administration of SaarLB 794 558
Benefits due in the short term for supervisory board activities 268 178
Benefits due in the short term for work performance 526 380
Former members of the Board of Management of SaarLB and their dependants 1,371 1,335
Pension provisions established for members of the Board of Management of SaarLB 13,424 11,094
Pension provisions established for former members of the Board ofManagement of SaarLB and their dependants 23,194 19,670
Remuneration paid to members of the Board of Management and the Board of Administra-tion of SaarLB
The interest accrued on pension provi-sions amounted to EUR 1,049,000 (2013: EUR 977,000) and is reported as an interest expense.

164
(81) AUDITORS’ FEES
External auditor’s fees reported as an expense in the year under review are broken down as follows:
(82) EMPLOYEES
The average number of people employed dur-ing the year was:
The average number of people employed in associates consolidated at equity during the year was 28 (previous year: 29).
EUR ’000s 2014 2013
Audit 773 897
Other audit and valuation services 194 198
Tax consulting services - 1
Other services 240 758
Total 1,206 1,854
2014 2013
Average number of employees in the year 552 539
of which full time employees 410 415
of which part time employees 119 104
of which trainees 23 20
Female 266 263Male 286 276

165
CORPORATE REPORT 2014 | NOTES
We affirm that to the best of our knowledge and in accordance with the applicable reporting principles the consolidated financial state-ments give a true and fair view of the net assets, financial position and results of operations of the Group and the management report of the Group includes a fair review of the development and performance of the business and the position of the Group, together with a descrip-tion of the principal opportunities and risks associated with the ex-pected development of the Group.
Saarbrücken, 20 March 2015
Landesbank Saar
Board of Management
Werner Severin Frank Eloy Dr. Matthias Böcker
Responsibility statement by the Board of Management

166
We have audited the consolidated financial statements, comprising the consolidated balance sheet, the Group statement of com-prehensive income, the schedule of chang-es in equity, the cash flow statement, the Group notes to the consolidated financial statements and the Group management re-port of Landesbank Saar, Saarbrücken for the financial year from 1 January to 31 Decem-ber 2014. It is the responsibility of the Board of Management of the company to draw up the consolidated financial statements and the Group management report in accordance with IFRS as applicable in the EU, the extra legal requirements applicable under Section 315a (1) of the German Commercial Code and the additional provisions of the articles of association. Our responsibility is to express an opinion on the consolidated financial statements and the management report, based on the audit we have conducted.
We carried out our audit of the consolidat-ed financial statements in accordance with Section 317 of the Commercial Code and Ger-man generally accepted standards for the audit of financial statements promulgated by the Institut der Wirtschaftsprüfer (IDW). These require that we plan and perform the audit in such a way that misstatements ma-terially affecting the presentation of the net assets, financial position and results of operations in the consolidated financial statements under the applicable accounting standards and in the Group management report are detected with reasonable assur-ance. Knowledge of the business activities and the economic and legal environment and expectations as to possible misstatements are taken into account in setting the audit procedures. In the audit, the effectiveness of the internal accounting control system and the evidence supporting the disclosures in the consolidated financial statements and Group management report are examined pri-marily on a test basis. The audit includes ex-amining the annual financial statements of consolidated companies, setting the scope
of consolidation, assessing the accounting policies used, evaluating significant esti-mates made by the Board of Management and considering the overall presentation of the consolidated financial statements and the Group management report. We believe that our audit provides a reasonable basis for our opinion.
Our audit has not led to any reservations.
In our opinion based on the findings of our audit the consolidated financial statements are in accordance with IFRS as applicable in the EU, the extra legal requirements applica-ble under Section 315a (1) of the Commercial Code and the additional provisions of the ar-ticles of association and present a true and fair view of the net assets, financial position and results of operations of the Group. The Group management report is consistent with the consolidated financial statements and taken as a whole provides an accurate view of the state of the Group and accurate-ly presents the risks and opportunities of fu-ture developments.
Saarbrücken, 24 March 2015
PricewaterhouseCoopersAktiengesellschaftWirtschaftsprüfungsgesellschaft
Jürgen Breisch ppa. Robert Lippmann Wirtschaftsprüfer Wirtschaftsprüfer(German Public Auditor) (German Public Auditor)
Independent Auditors’ Report
167
CORPORATE REPORT 2014
In the past year, the Board of Administration monitored the Board of Management’s con-ducting of business. The Board of Administra-tion and the Risk Committee have regularly received reports on the Bank’s performance and business situation as well as on impor-tant transactions and discussed them in de-tail with the Bank’s Board of Management. The Audit Committee addressed the audit of the financial statements and the internal con-trol processes of the bank and discussed them with the Board of Management. At the meet-ings of the Board of Administration, reports were regularly given on significant matters at the meetings of the Risk Committee and the Audit Committee.
In the close and trusting collaboration with the Board of Management, the Board of Ad-ministration monitored the regular reports and the annual discussion of the business and risk strategy as well as the IT strategy and, in particular, the transfer of BayernLB’s remain-ing shares in SaarLB to the state of Saarland, the conversion of the silent reserves of the state of Rhineland-Palatinate (PLP) and the changes in the composition of the Board of Management as of 1 January 2015.
The Board of Administration and the Risk Committee have, to the extent provided by the articles of association, participated in the Bank’s business and passed the requisite res-olutions.
At their meetings on 17 April 2015, the Bank’s corporate bodies discussed compliance with the company’s own corporate governance principles, to which SaarLB voluntarily bound itself, and determined that there were no in-dications of which they were aware that were in contradiction to compliance with these principles in the financial year 2014.
The Board of Administration discussed the management report, the annual financial statements, the Group management report and the consolidated financial statements for
the period to 31 December 2014 and the pro-posed appropriation of distributable earnings with the Board of Management. The annual financial statements and the management re-port as well as the Group management report and the consolidated financial statements for the period to 31 December 2014 were audited by the auditors, PricewaterhouseCoopers AG Wirtschaftsprüfungsgesellschaft, and re-ceived an unqualified auditor’s opinion.
The Board of Administration has taken note of the audit findings and approved the annu-al financial statements in accordance with the German Commercial Code for the period ending 31 December 2014 at its meeting on 27 April 2015. The IFRS consolidated financial statements for the financial year ending 31 December 2014 were approved by the Board of Administration. The Board of Management was granted discharge.
Saarbrücken, 27 April 2015
The Chairman of the Board of AdministrationJan-Christian Dreesen
Report of the Board of Administration

168
CONTROLLING ANDDEVELOPMENT
PRODUCTION ANDRISK
MARKETS 1 MARKETS 2
Werner Severin Dr. Matthias Böcker Frank Eloy
Gunar FethSTRATEGY AND CENTRALMANAGEMENT
RISK OFFICE CORPORATE CUSTOMERS TREASURY ANDPORTFOLIO MANAGEMENT
Holger Schmitt• Communication and BoM
Support• Strategic Development• Central Services
Frank-Oliver Groß• Recourse• Renewable Energies /
Projects• Real Estate• Credit Consult• Credit Office• Credit Processing
Michael Heß• Corporate Customers
Germany• Corporate Customers
France – Branch of SaarLB, Metz – Centre d’affaires
Entreprises, Strasbourg • Payment Transactions
and Foreign Trade
Christian Mathe• Treasury• Portfolio Management
BANK MANAGEMENT LEGAL AND SERVICES REAL ESTATE AND PROJECTS
RETAIL CUSTOMERS ANDINSTITUTIONALS
Bernd Heublein• Accounting, Regulatory
and Tax• P&L Controlling
Dr. Jochen Klein• Legal• Trade Execution and
Account Service
Manfred Thinnes• Real Estate Germany• Branch Management Daniel Koebnick • Projects Roger Lang • Real Estate France • Centre d’affaires
Financement Immobilier, Paris
Andreas Hauck• Savings Banks,
Institutionals• Interest and Currency
Management• Private Banking Klaus Bingel • Wealth Management
HUMAN RESOURCES ANDORGANISATION
RISK CONTROLLING SYNDICATION AND CONSORTIUMBUSINESS
LBS MARKET
Barbara Wagner• Human Resources• Organisation• Project and
Budget Management
Dr. Jürgen Marx Evelyne Pellé-Küppers Dirk Hoffmann• Market Credit• Organisation and IT• Banking and Sales
Management
INTERNAL AUDIT COMPLIANCE CENTER LBS RISK OFFICE
Jörg Melde Jörg Welter• Accounting and
Controlling• Market Service
DATA PROTECTION AND IT SECURITY
CENTRAL BUSINESS SEGMENT MANAGEMENT
Organisational chart
As of: 24 March 2015
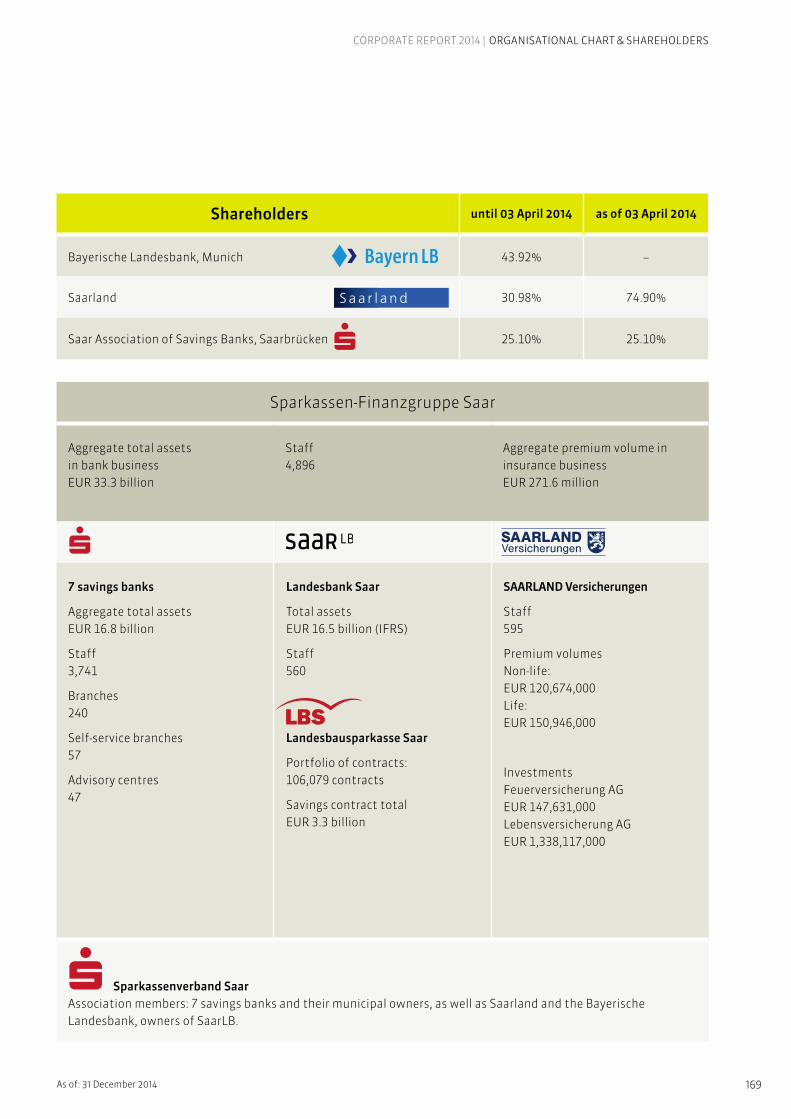
169
CORPORATE REPORT 2014 | ORGANISATIONAL CHART & SHAREHOLDERS
Shareholders until 03 April 2014 as of 03 April 2014
Bayerische Landesbank, Munich 43.92% –
Saarland 30.98% 74.90%
Saar Association of Savings Banks, Saarbrücken 25.10% 25.10%
Sparkassen-Finanzgruppe Saar
Aggregate total assetsin bank businessEUR 33.3 billion
Staff4,896
Aggregate premium volume ininsurance businessEUR 271.6 million
7 savings banks
Aggregate total assets EUR 16.8 billion
Staff 3,741
Branches 240
Self-service branches 57
Advisory centres 47
Landesbank Saar
Total assets EUR 16.5 billion (IFRS)
Staff 560
Landesbausparkasse Saar
Portfolio of contracts: 106,079 contracts
Savings contract total EUR 3.3 billion
SAARLAND Versicherungen
Staff 595
Premium volumes Non-life: EUR 120,674,000 Life: EUR 150,946,000
Investments Feuerversicherung AG EUR 147,631,000 Lebensversicherung AG EUR 1,338,117,000
Sparkassenverband SaarAssociation members: 7 savings banks and their municipal owners, as well as Saarland and the Bayerische Landesbank, owners of SaarLB.
As of: 31 December 2014

170
LIST OF ABBREVIATIONS
BayernLB Bayerische Landesbank, MunichBilMoG Bilanzrechtsmodernisierungsgesetz (German Accounting Law Modernisation Act)GDP Gross domestic productCIR Cost-Income RatioCRD Capital Requirements DirectiveCRR Capital Requirements RegulationDAX German Stock ExchangeDSGV Deutsche Sparkassen- und Giroverband e. V. (German Savings Bank Association)EBA European Banking AuthorityEE Renewable energyEK EquityEU European UnionEUR EuroECB European Central BankGmbH Gesellschaft mit beschränkter Haftung (Limited Liability Company)HGB Handelsgesetzbuch (German Commercial Code)ICAAP Internal Capital Adequacy Assessment ProcessIFRS International Financial Reporting StandardsICS Internal Control SystemIRBA Internal Ratings Based ApproachIT Information technologyKWG Kreditwesengesetz (German Banking Act)LBS Landesbausparkasse Saar, SaarbrückenMaRisk Mindestanforderungen an das Risikomanagement
(Minimum Requirements for Risk Management)MaH Mindestanforderungen an das Betreiben von Handelsgeschäften
(Minimum Requirements for Trading Activities Conducted by Banks)m Millionsb BillionsOU Organisational unitOECD Organisation for Economic Cooperation and DevelopmentOpRisk Operational RiskPPP Public Private PartnershipROE Return on EquityRWA Risk-Weighted AssetsSaarLB Landesbank Saar, SaarbrückenSNB Swiss National BankSolvV Solvabilitätsverordnung (German Solvency Ordinance)US-GAAP United States Generally Accepted Accounting PrinciplesVaR Value at RiskYtD Year to Date

171
CORPORATE REPORT 2014 | LIST OF ABBREVIATIONS & EGAL NOTICE
Legal notice
Publisher Landesbank Saar Ursulinenstraße 2 D-66111 Saarbrücken
Editors Communication and BoM Support E-mail: [email protected] This report was completed on 24 March 2015. Design FBO – Agentur für Marketing und Neue Medien Heinrich-Barth-Straße 27 D-66115 Saarbrücken
Photos Andrew Wakeford, iStock
Print repa druck GmbH Zum Gerlen 6 D-66131 Saarbrücken
Our cordial thanks goes to all colleagues whose pictures are contained in this report:Christian Bischoff, Daphnée Dinamou, Aline Christin Klein, Laurent Klein, Bettina Lämmel

172
address Landesbank Saar Ursulinenstraße 2 66111 Saarbrücken, Germanypo box 66104 Saarbrücken, Germanyphone +49 681 383-01fax +49 681 383-1200internet www.saarlb.dee-mail [email protected]/swift SALADE55sort code 590 500 00
SaarLB France, Branch of Landesbank Saaraddress 2, place Raymond Mondon 57000 Metz France phone +33 387 6968-60fax +33 387 5708-91e-mail [email protected]
SaarLB France, Centre d’affaires Entreprisesaddress 9, rue du Maréchal Joffre 67000 Strasbourg France phone +33 388 3758-70fax +33 388 3693-78e-mail [email protected]
SaarLB France, Centre d’affaires Financement Immobilieraddress 203, rue du Faubourg Saint Honoré 75008 Paris Francephone +33 145 6363-52fax +33 145 6371-22e-mail [email protected]
address LBS Landesbausparkasse Saar Beethovenstraße 35 – 39 66111 Saarbrücken, Germanypo box Postfach 10 19 62 66019 Saarbrücken, Germanyphone +49 681 383-290fax +49 681 383-2100internet www.lbs-saar.dee-mail [email protected]

173

174

DURCH NÄHEWeitsicht