corporate investor presentation – october 2018 · average daily time spent on video (min) tv and...
TRANSCRIPT
Zee Entertainment360
0Entertainment Content Company
Extraordinary Together
22
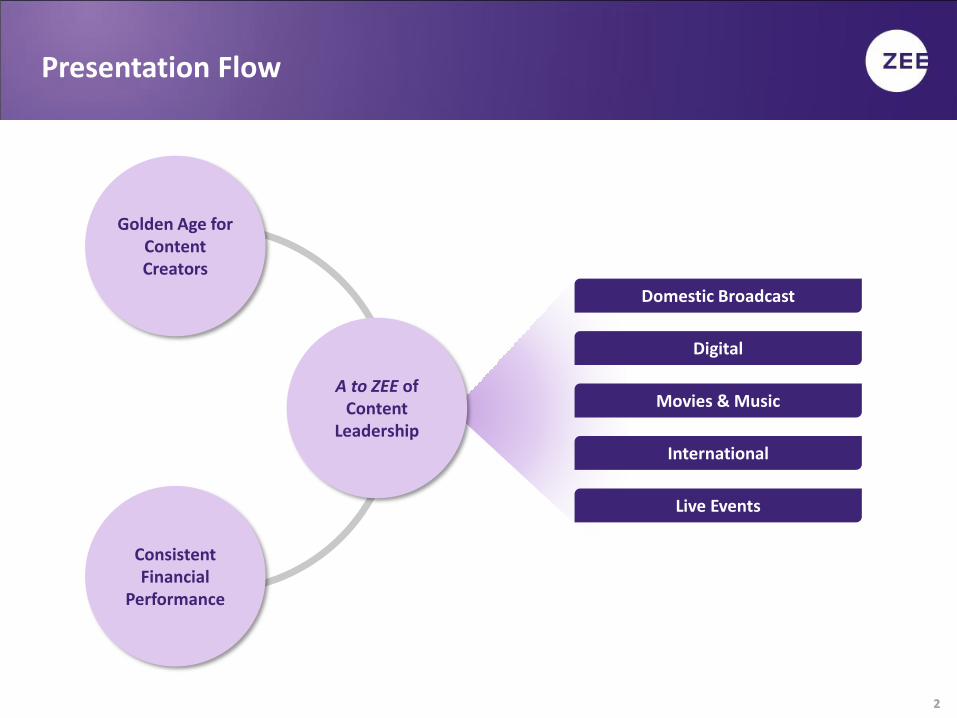
Presentation Flow
Consistent Financial
Performance
Golden Age for Content Creators
A to ZEE of Content
Leadership
Domestic Broadcast
Digital
Movies & Music
International
Live Events

33
Content consumption is at an inflection point…
TV households (mn)
CY14 CY17 CY21e
168 183 224
3G+4G subs (mn)
83 363 760
Multiplex screens
2,000 2,600
Private radio stations
324 400
Content availability has increased across all mediums and is expected to continue to grow
3,500
243
Source: TRAI, FICCI M&E report, Industry estimates

44
…with multiple levers for growth acceleration
Growth drivers in place to boost India’s low per capita entertainment consumption
EngagementOpportunity
to see
Content choice
Ability to pay
Social integration, gamification
Technological innovations
Rising discretionary spends
Customized packages
Across languages, genres and formats
Better quality content
Increasing device penetration
Anytime, Anywhere

55
M&E is witnessing an all-round growth in India
Category CY12-17 CAGR CY17-20e CAGR
Television 12.3% 9.3%
Print 6.2% 6.8%
Digital 40.5% 23.5%
Movies & Music 6.6% 7.5%
Others* 22.0% 18.2%
M&E industry 12.4% 11.3%
Television to remain the largest medium while Digital will continue to lead the growth
Source: FICCI-EY M&E Report 2018; FICCI-KPMG M&E Report 2017* - Others include Radio, Animation, VFX, Gaming and OOH
45%
27%
3%
15%
10%
45%
21%
8%
11%
15%
42%
18%
11%
10%
18%
Television
Digital
Movies & Music
Others
CY12
CY17
CY20e
M&E industry revenue break-up

66
The big debate – TV or Digital?

77
Indian market is different on two key parameters
3 612
2231 32
48
88
Ind
ia
Ch
ina
Nig
eria
Jap
an
Sin
gap
ore
Bra
zil
UK
US
Pay TV ARPU (USD per month)
Low TV ARPUs and wired broadband penetration make TV the preferred medium for content consumption
6.4%
31.3%
63.5%
75.2% 78.7% 81.8% 84.1%
Ind
ia
Thai
lan
d
Ch
ina
Jap
an
Au
stra
lia US
UK
Wired broadband penetration (% of total HHs)
Source: OFCOM Market Report 2016 Source: BofAML Research Report
Wired broadband is a prerequisite for digital to become the mainstay for content consumption
Mobile broadband is driving the digital content consumption in India
Pay TV in India offers unlimited content (200+ channels) at ~3 USD per month

88
Source: BARC data
220 225 227
27 31
2QFY17 3QFY18 1QFY19
Television Digital
Average daily time spent on video (min)
TV and Digital are growing in tandem
Mobile data consumption has grown by ~17x over the past two years, primarily driven by video
Television viewership has seen healthy growth across age groups over the last two years
21.2
26.2 28.7
1QFY17 1QFY18 1QFY19
Average weekly impressions on TV (bn)
Since 4G roll-out, TV viewership has grown by 35% and video consumption on mobile has become substantial
Time spent on TV based on BARC data representing universe of 836mn individuals; Time spent on mobile based on data of a leading telco; Total 3G+4G subs ~400mn
99
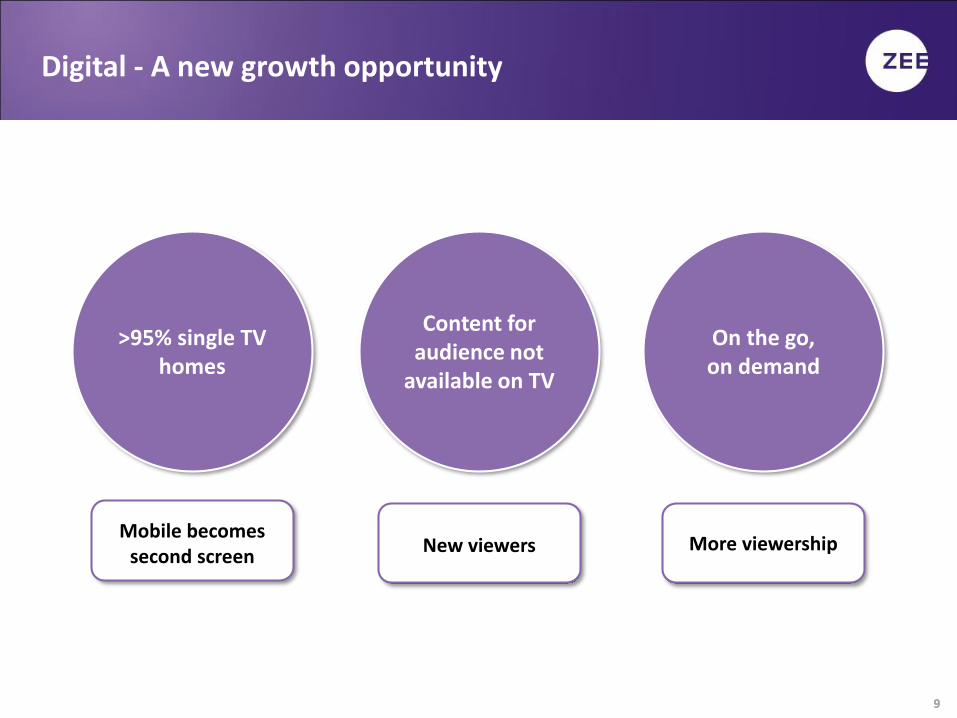
Digital - A new growth opportunity
>95% single TV homes
On the go,on demand
Mobile becomes second screen
More viewership
Content for audience not
available on TV
New viewers

1010
Incumbents to have an edge in the OTT space
Broadcasters retain the IP rights of their content; no market for content aggregation
Building a sizeable library for the multi-lingual Indian market is a long-drawn process
Original content created for TV seamlessly moves to broadcasters’ OTT for on-demand viewing
IP rights retained by the
broadcasters
~2,000 hours of original content produced every week across 10+
languages
Independent producers with limited risk appetite
Broadcasters bear the risk of the project
Collaborative process for content creation
1111
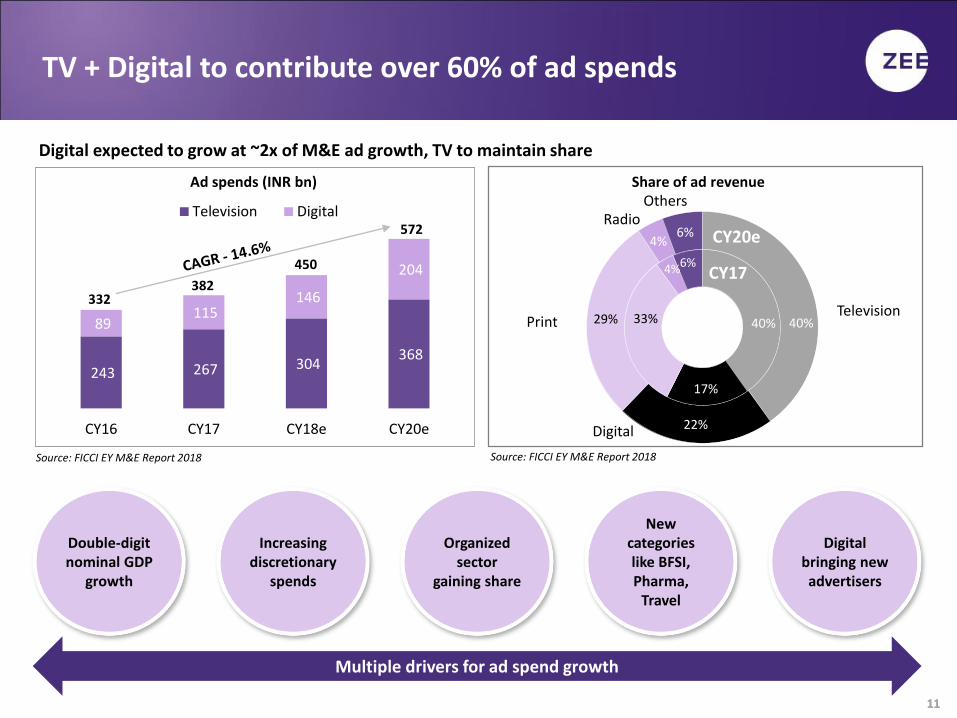
40%
22%
29%
4%6%
40%
17%
33%
4%6%
Share of ad revenueOthers
TelevisionPrint
Digital
Radio
TV + Digital to contribute over 60% of ad spends
243 267 304 368
89 115
146
204
CY16 CY17 CY18e CY20e
Television Digital
Ad spends (INR bn)
Double-digit nominal GDP
growth
Increasing discretionary
spends
Organized sector
gaining share
New categories like BFSI, Pharma,
Travel
Digital bringing new advertisers
Digital expected to grow at ~2x of M&E ad growth, TV to maintain share
CY17
CY20e
332382
450
572
Source: FICCI EY M&E Report 2018 Source: FICCI EY M&E Report 2018
Multiple drivers for ad spend growth
1212
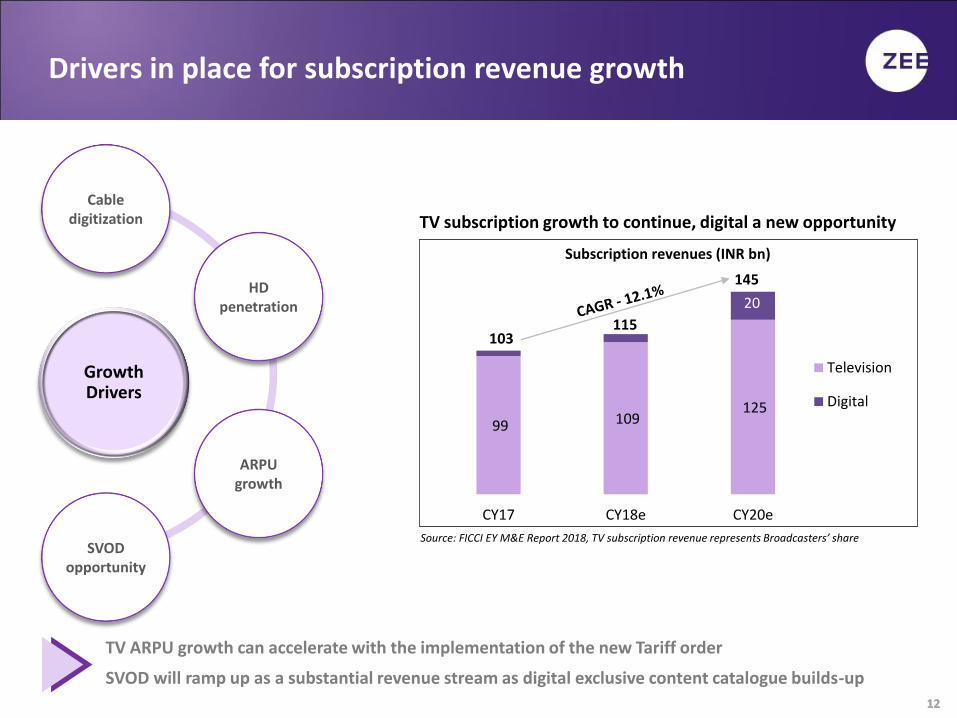
Drivers in place for subscription revenue growth
99 109 125
103115
20
CY17 CY18e CY20e
Television
Digital
Subscription revenues (INR bn)
145
Source: FICCI EY M&E Report 2018, TV subscription revenue represents Broadcasters’ share
Growth Drivers
HD penetration
SVOD opportunity
Cabledigitization
ARPU growth
TV ARPU growth can accelerate with the implementation of the new Tariff order
SVOD will ramp up as a substantial revenue stream as digital exclusive content catalogue builds-up
TV subscription growth to continue, digital a new opportunity

1313
A to ZEE of Content Leadership

1414
India’s first Hindi movie channel
launched; International
expansion begins with launch in UK
Regional portfolio nearly complete
with Tamil launch
Launch of Zee Studios, the
movie production company
Entered Live business, exit from sports
broadcasting
ZEEL has evolved into a 360o entertainment content company
With many firsts to its credits, ZEEL is the biggest homegrown entertainment network
Zee TV launched, India’s
first private entertainment
channel
Begins expansion into Indian regional
market with Marathi
Entry into sports broadcasting with acquisition of Ten
Sports
Launch of Zee Music Company,
the music publishing label
Launch of ZEE5, revamped OTT platform with
unrivalled content
catalogue
1992 1995 1999 2008 2010 2012 2014 2017 2018
1515
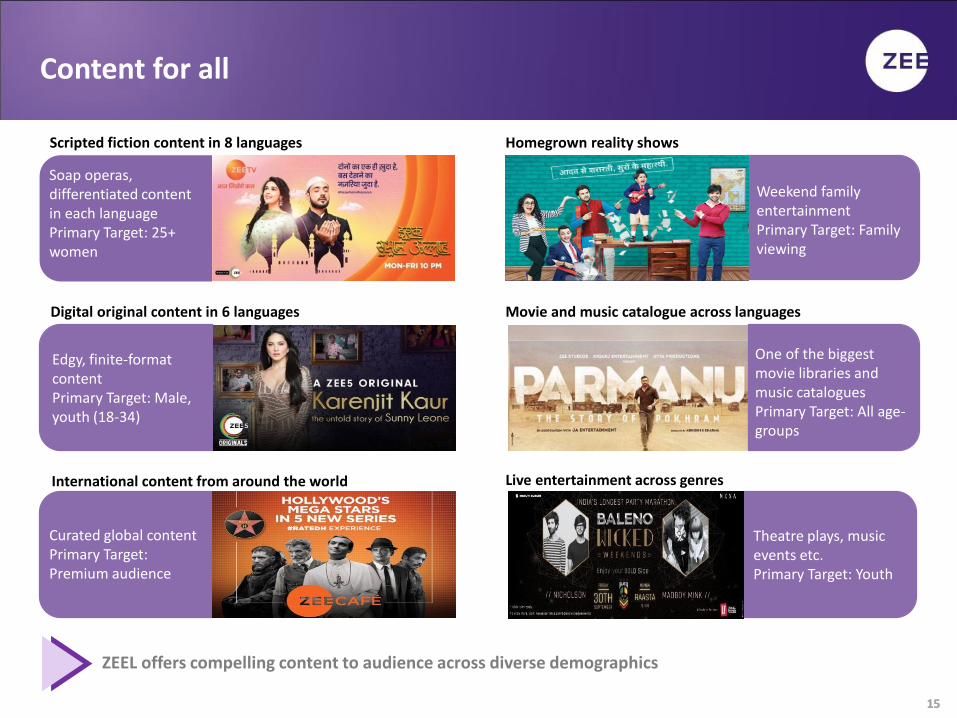
Content for all
Scripted fiction content in 8 languages Homegrown reality shows
Weekend family entertainmentPrimary Target: Family viewing
Digital original content in 6 languages
Edgy, finite-format contentPrimary Target: Male, youth (18-34)
Movie and music catalogue across languages
International content from around the world
Curated global contentPrimary Target: Premium audience
Live entertainment across genres
Theatre plays, music events etc.Primary Target: Youth
ZEEL offers compelling content to audience across diverse demographics
Soap operas, differentiated content in each language Primary Target: 25+ women
One of the biggest movie libraries and music cataloguesPrimary Target: All age-groups

1616
Strong position in the M&E eco-system
Domestic Broadcast
Digital
International
Movies & Music
Live EventsContent Creation
Content Flow
ZEEL Business Overview
❖ ~500 hours of content every week across 8 languages
❖ 25 years of institutional learnings and consumer insights
❖ Long-standing relationship with talent – writers, directors, actors
❖ Strong partnership with distributors and advertisers
❖ Content created by one business monetized by others
❖ Content creation and marketing synergy with presence across verticals
Strong content creation expertise
Synergy
Strong partnerships across the value chain
1717
Domestic Broadcast

1818
Pan-India Network - 37 channels, 9 languages
Hindi General Entertainment
Hindi Movie Cluster
Regional Movie Cluster
Niche Channels
Regional Entertainment
1919
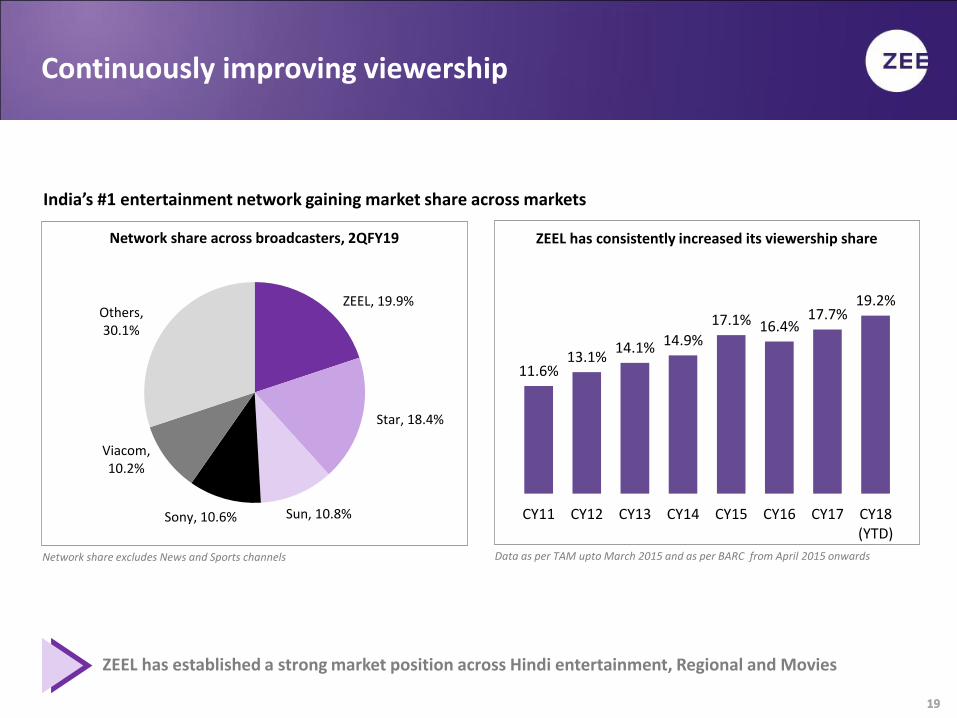
Continuously improving viewership
ZEEL has consistently increased its viewership shareNetwork share across broadcasters, 2QFY19
Network share excludes News and Sports channels Data as per TAM upto March 2015 and as per BARC from April 2015 onwards
ZEEL, 19.9%
Star, 18.4%
Sun, 10.8%Sony, 10.6%
Viacom, 10.2%
Others, 30.1%
11.6%13.1%
14.1% 14.9%
17.1% 16.4%17.7%
19.2%
CY11 CY12 CY13 CY14 CY15 CY16 CY17 CY18(YTD)
ZEEL has established a strong market position across Hindi entertainment, Regional and Movies
India’s #1 entertainment network gaining market share across markets
2020
Digital

2121
Content in 12 languages
User interface in multiple Indian languages
AVOD + SVOD revenue model
ZEE5 – the ultimate digital entertainment destination
India - a multi-lingual country
Limited familiarity with English
Low online payment penetration
ZEE5’s content and technology has been customized for the Indian consumer
2222
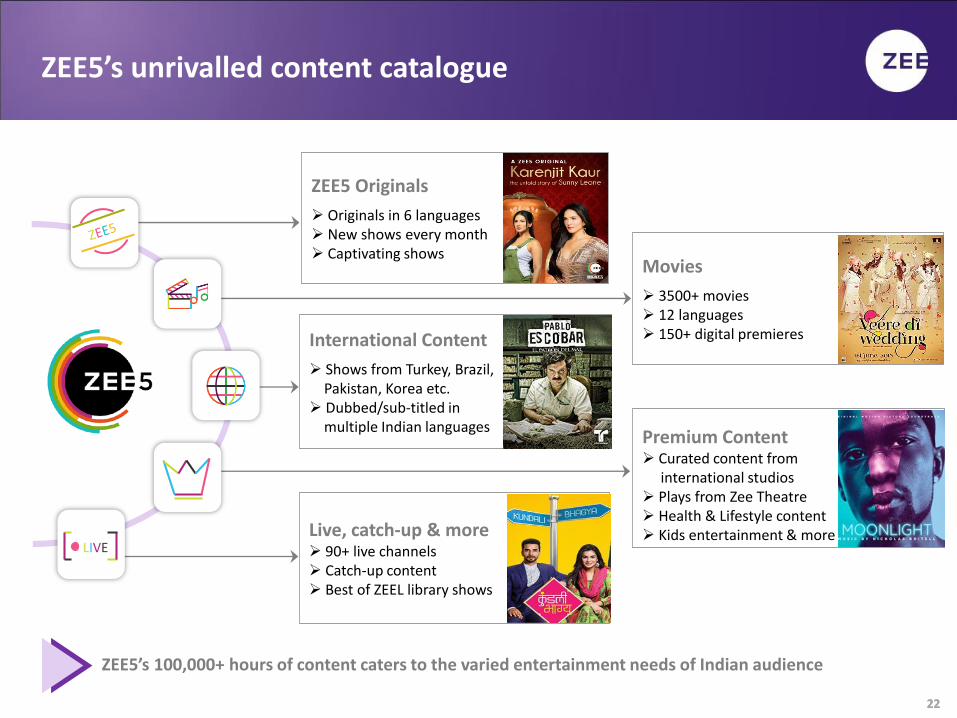
ZEE5’s unrivalled content catalogue
ZEE5 Originals
➢ Originals in 6 languages➢ New shows every month➢ Captivating shows
Premium Content➢ Curated content from
international studios➢ Plays from Zee Theatre➢ Health & Lifestyle content➢ Kids entertainment & more Live, catch-up & more
➢ 90+ live channels➢ Catch-up content➢ Best of ZEEL library shows
Movies
➢ 3500+ movies➢ 12 languages➢ 150+ digital premieresInternational Content
➢ Shows from Turkey, Brazil,Pakistan, Korea etc.
➢ Dubbed/sub-titled in multiple Indian languages
LIVE
ZEE5’s 100,000+ hours of content caters to the varied entertainment needs of Indian audience

2323
Largest producer of original content across languages
29 original content released in 6 languages till date; plan to release ~90 in FY19
Differentiated content targeted at the youth and male audience that are under-served on TV
Engaging reality shows Tentpole shows Regional shows
Never seen before movies Short-form content
12 WEEKS | 12 PREMIERES | 12 TOP DIRECTORS

2424
ZEE5 – 2nd largest digital entertainment platform in India
41.3mn MAUs in Sep’18 (190% growth over Apr’18)
340% growth in videos viewed per user over Apr’18
31 mins average time spend per user per day
Drivers for ZEE5 to be the #1 entertainment app over next 12 months
Original content &
movie premieres
Partnerships and alliance
Technology features
Strong start to ZEE5
2525
Movies and Music
2626
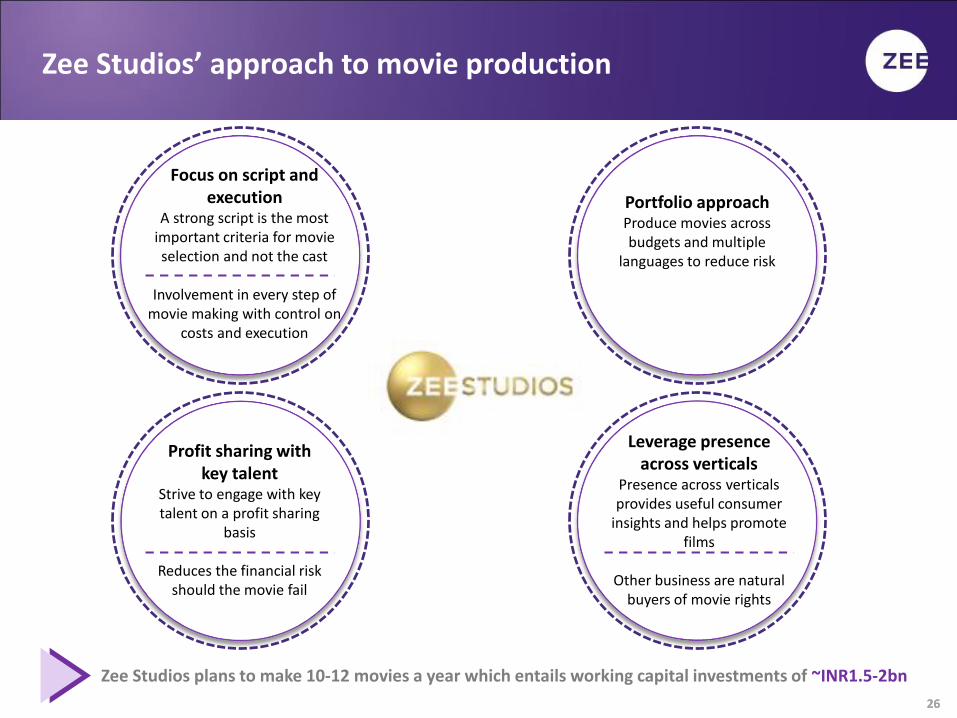
Zee Studios’ approach to movie production
Zee Studios plans to make 10-12 movies a year which entails working capital investments of ~INR1.5-2bn
Focus on script and execution
A strong script is the most important criteria for movie selection and not the cast
Involvement in every step of movie making with control on
costs and execution
Profit sharing with key talent
Strive to engage with key talent on a profit sharing
basis
Reduces the financial risk should the movie fail
Leverage presence across verticals
Presence across verticals provides useful consumer
insights and helps promote films
Other business are natural buyers of movie rights
Portfolio approachProduce movies across budgets and multiple
languages to reduce risk
2727
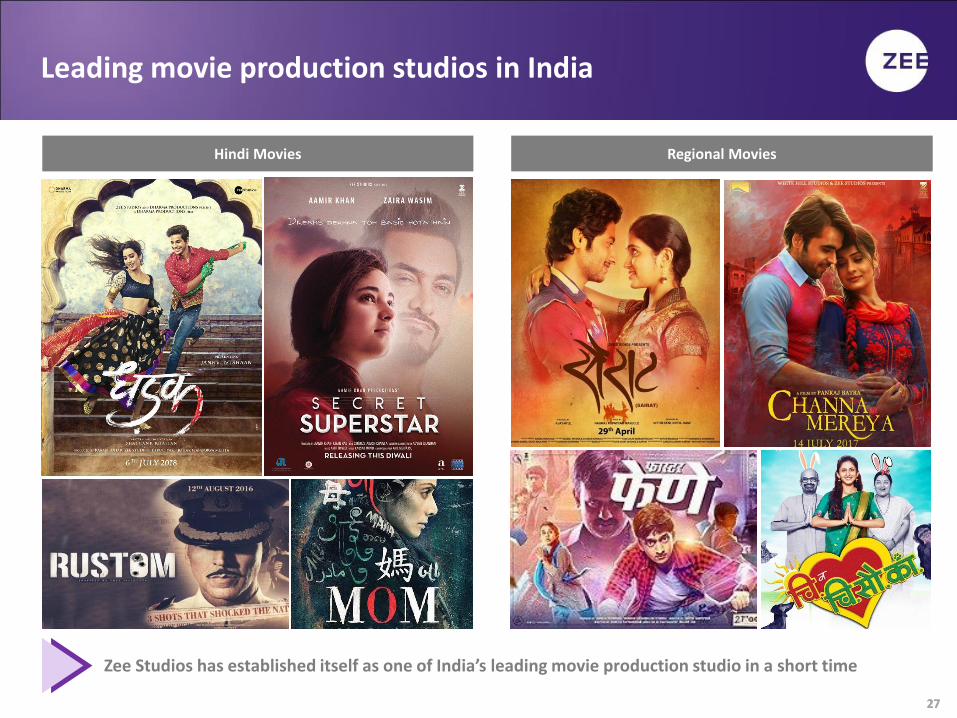
Leading movie production studios in India
Received National Film Award for The Best Actor
Hindi Movies Regional Movies
Zee Studios has established itself as one of India’s leading movie production studio in a short time

2828
India’s only pan-India
music label
Partnerships with major
movie studios
Direct relationship
with distribution
partners
ZMC Originals - creating own music
Zee Music Company – India’s fastest growing music label
Diversified Music Catalogue
Digital streaming is the primary revenue source, contributing ~70% of the revenues of music labels
Zee Music Company (ZMC) is building a strong portfolio in regional markets
ZMC Youtube channel is the third most subscribed Indian channel
2929
International

3030
Advertising, 31.1%
Subscription, 50.7%
Others, 18.2%
282
363
578
FY16 FY17 FY18
(mn)
Presence in 170+ countries with reach of 578mn
ZEE5 being rolled out in 190+ countriesServes South Asian diaspora as well as local audience in select countries
39 international channels with 13 channels in 9 non-Indian languages
International portfolio serving diaspora and local audience
Increasing reach of ZEEL’s international portfolio FY18 International revenues break-up (INR 7,683 mn)

3131
A strong global presence
39 International Channels 13 Local Language Channels
Logos of ZEEL’s channels in local languages

3232
Live Events
3333
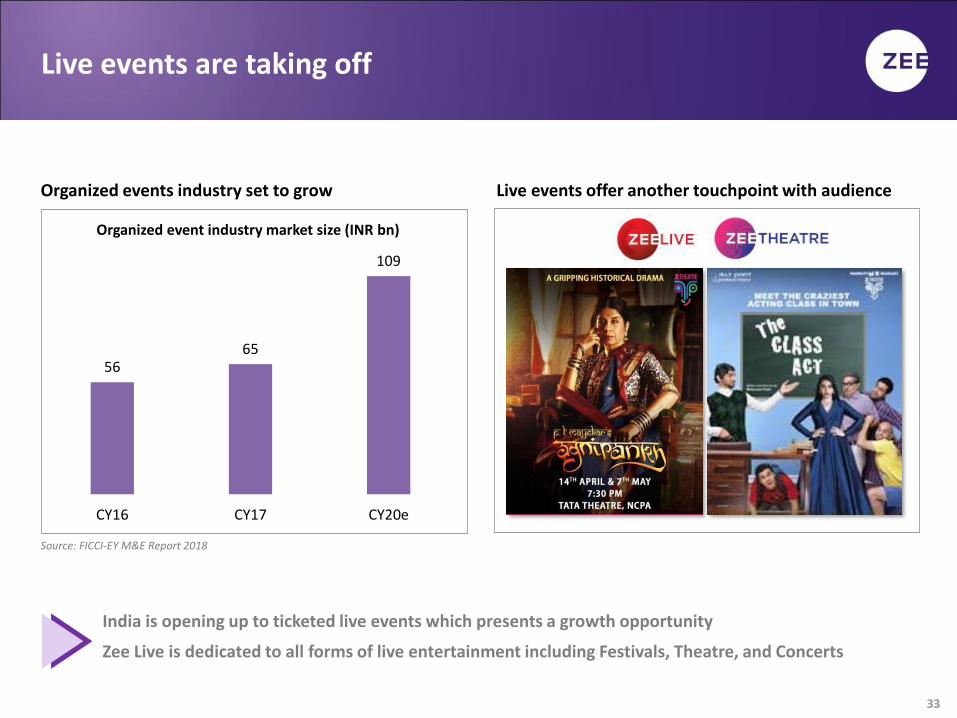
5665
109
CY16 CY17 CY20e
Live events are taking off
Source: FICCI-EY M&E Report 2018
Organized event industry market size (INR bn)
India is opening up to ticketed live events which presents a growth opportunity
Zee Live is dedicated to all forms of live entertainment including Festivals, Theatre, and Concerts
Organized events industry set to grow Live events offer another touchpoint with audience

3434
Financials
3535
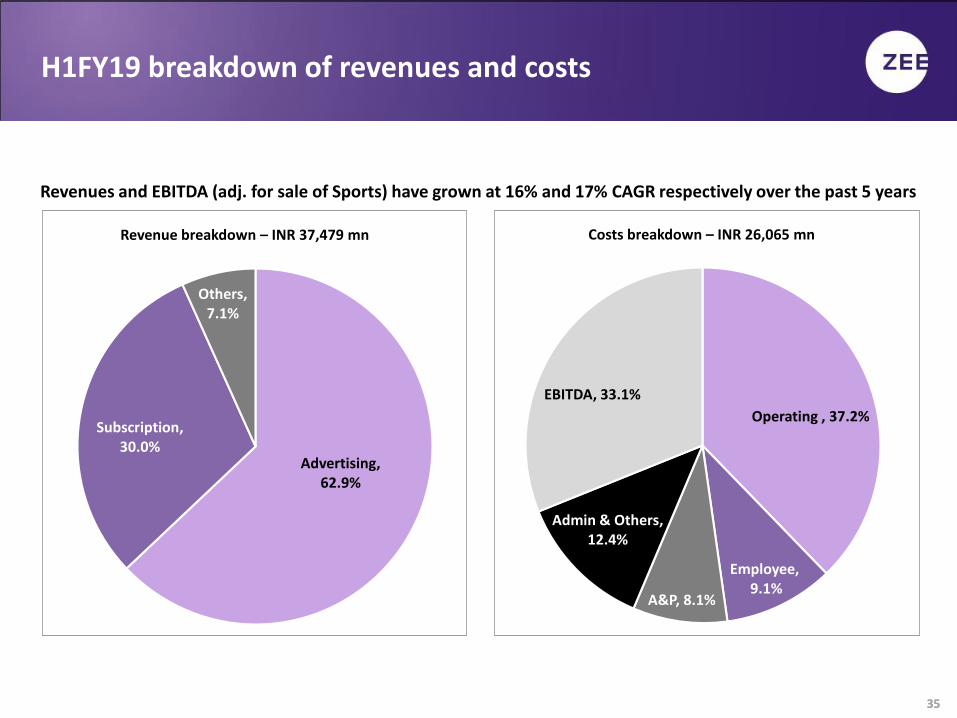
Operating , 37.2%
Employee,9.1%
A&P, 8.1%
Admin & Others, 12.4%
EBITDA, 33.1%
H1FY19 breakdown of revenues and costs
Revenue breakdown – INR 37,479 mn Costs breakdown – INR 26,065 mn
Advertising, 62.9%
Subscription, 30.0%
Others, 7.1%
Revenues and EBITDA (adj. for sale of Sports) have grown at 16% and 17% CAGR respectively over the past 5 years
3636
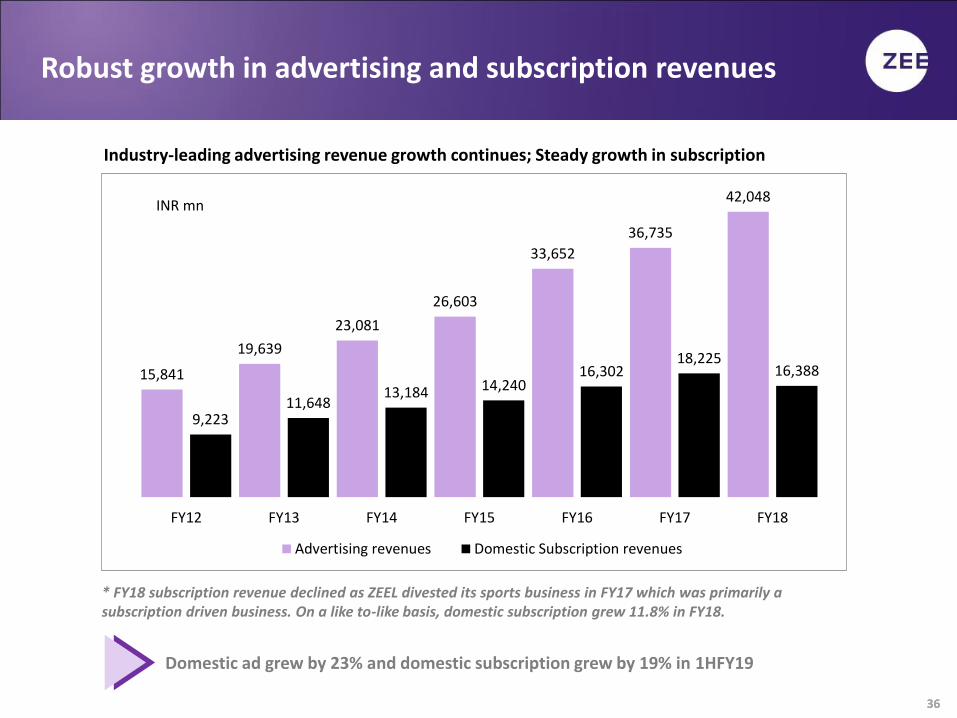
Robust growth in advertising and subscription revenues
15,841
19,639
23,081
26,603
33,652
36,735
42,048
9,223 11,648
13,184 14,240 16,302
18,225 16,388
FY12 FY13 FY14 FY15 FY16 FY17 FY18
Advertising revenues Domestic Subscription revenues
INR mn
* FY18 subscription revenue declined as ZEEL divested its sports business in FY17 which was primarily a subscription driven business. On a like to-like basis, domestic subscription grew 11.8% in FY18.
Industry-leading advertising revenue growth continues; Steady growth in subscription
Domestic ad grew by 23% and domestic subscription grew by 19% in 1HFY19
3737
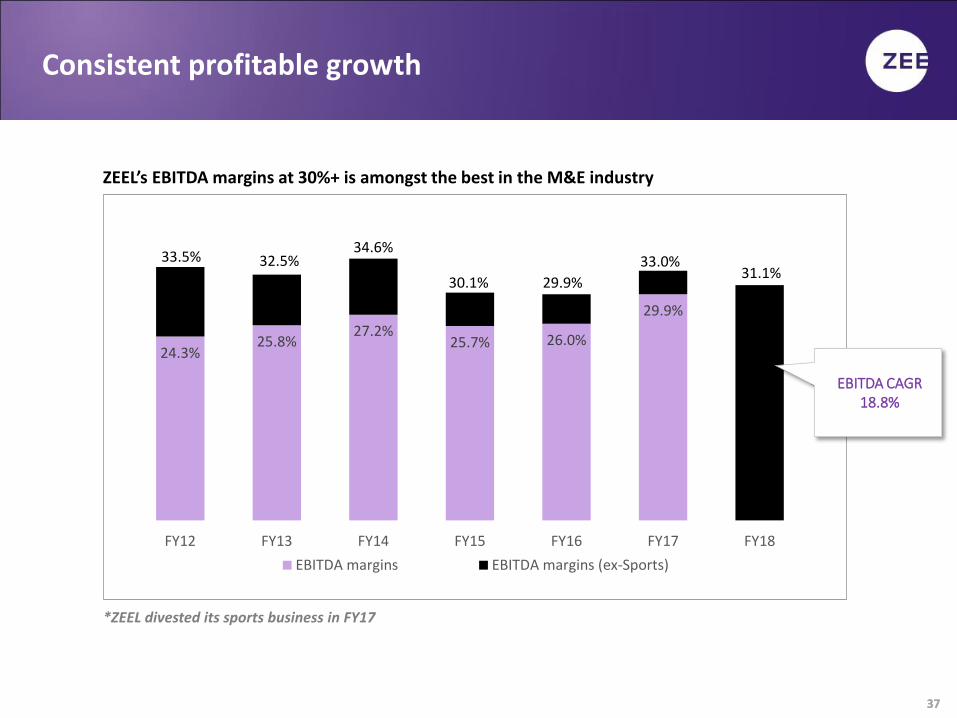
Consistent profitable growth
*ZEEL divested its sports business in FY17
*
24.3%25.8%
27.2%25.7% 26.0%
29.9%
31.1%
FY12 FY13 FY14 FY15 FY16 FY17 FY18
EBITDA margins EBITDA margins (ex-Sports)
33.5% 32.5%34.6%
30.1% 29.9%
33.0%
ZEEL’s EBITDA margins at 30%+ is amongst the best in the M&E industry
EBITDA CAGR 18.8%

3838
Consistent payout to shareholders
Equ
ity
Consistent dividend distribution
28.4%31.2%
25.2%26.6%
30.3%
26.1% 27.1%
FY12 FY13 FY14 FY15 FY16 FY17 FY18*
Equ
ity
Payout to shareholders is higher than annual equity dividend
25.7%30.2%
63.2%
Equity Equity + Buyback Equity + Buyback +RPS
FY12-18 (Cumulative)
• Dividend payout is calculated on profit after tax (excluding exceptional items)• FY18 payout is calculated on PAT after adjusting for exceptional items and
other non-recurring gains
As per Dividend policy, ZEEL will pay 25-30% of Consolidated profits or 1/3rd of Standalone profits, whichever is higher
ZEEL has used buyback and bonus preference shares in the past to boost payout to shareholders
Redeemable Preference Shares (RPS) worth INR 21 bn issued in 2014
ZEEL’s dividend payout has been consistent at 25%+ over the past 5-6 years

Thank You