corporate foreign tax credit, 1997 - internal … · 104 corporate foreign tax credit, 1997 104...
TRANSCRIPT

103
by Kathryn A. Green and Scott Luttrell
Corporate Foreign Tax Credit, 1997
Kathryn A. Green is a statistician with the SpecialStudies Returns Analysis Section. Scott Luttrell is aneconomist with the Special Studies Returns AnalysisSection. This article was prepared under the direction ofChris R. Carson, Chief.
F or 1997, U.S. corporations claiming a foreigntax credit earned $157.9 billion in foreign-source taxable income and paid $45.1 billion in
income taxes to foreign governments. After limita-tions, these corporations reported $42.2 billion inforeign tax credits, an increase of $1.9 billion from1996 [1]. Under the foreign tax credit provisions,these corporations reduced their U.S. tax liability 29.1percent, from $144.8 billion (U.S. income tax beforecredits) to $102.6 billion. Other credits, including theU.S. possessions tax credit and the general businesscredit, further reduced their U.S. income tax liabilityto $95.8 billion.
Overall, U.S. corporations claiming a foreign taxcredit reported “worldwide taxable income” (i.e.,both U.S. and foreign-source income) of $410.1billion. Approximately 38.5 percent of the “world-wide taxable income” was derived from foreignsources. Worldwide income taxes reported for thesecorporations totaled $144.8 billion, with foreignsources accounting for 31.0 percent of the total.
As in recent years, most foreign-source incomewas earned by U.S. corporations in manufacturing.Manufacturers accounted for 65.1 percent of thetotal foreign-source taxable income and 71.9 percentof both the total current-year foreign taxes paid,accrued, or deemed paid, and the total foreign taxcredit claimed for 1997. However, the 1990’s contin-ued to shift from manufacturing toward corporationsclassified in the finance, insurance, and real estateindustrial division (FIRE). This industrial division hasrapidly increased its share of foreign-source taxableincome and total foreign tax credit claimed. Theshare of the total foreign tax credit claimed by fi-nance, insurance, and real estate corporations hasmore than doubled from 6.6 percent for 1990 to 15.8percent for 1997.
As in prior years, the United Kingdom, Canada,Japan, Germany, and the Netherlands were theleading sources of foreign income for U.S. corpora-tions claiming the foreign tax credit. With $25.2billion of the $157.9 billion (or 15.9 percent) in for-
eign-source taxableincome, the UnitedKingdom provided thelargest amount of in-come. Overall, the 15nations of the EuropeanUnion combined for 37.8percent of foreign-source taxable income,22.5 percent of current-year taxes paid or accrued,and 48.3 percent of the current-year tax deemed paid.
BackgroundSince the Income Tax Law of 1913, U.S. taxpayershave been taxed on their worldwide incomes. ForU.S. corporations with multinational interests, incomeearned abroad may be taxed by the jurisdiction wherethe income is earned and also by the U.S. Govern-ment. This results in double taxation of the foreignincome. The U.S. has adopted a tax credit method toalleviate this consequence. Under the tax creditmethod, the U.S. taxes the worldwide income butallows a credit against the U.S. tax liability for theincome taxes paid to foreign countries.
The U.S. was the first country to provide a taxcredit for income taxes paid to foreign countries.From 1913 through 1917, income and profit taxespaid to foreign countries or U.S. possessions wereincluded in general deductions from gross worldwideincome. The Revenue Act of 1918 introduced theforeign tax credit. This provision allowed taxpayersan unlimited credit against U.S. income taxes for anytaxes paid to or accrued in a foreign country. Incases where the foreign tax rate exceeded the U.S.tax rate, some U.S. tax on domestic earned incomewas offset by the credit for taxes paid to a foreignjurisdiction. This loss of revenue from U.S. tax ondomestic income led to the development of a foreigntax credit limitation.
The Revenue Act of 1921 introduced the “over-all” limitation. This limitation restricts the foreign taxcredit to the lesser of 1) the product of the U.S.income tax before credits multiplied by the ratio offoreign-source taxable income to worldwide taxableincome, or 2) the actual foreign taxes paid. Forvarious periods in U.S. tax history, this limitation hasbeen a fundamental principal of the foreign tax creditprovisions.
For 1997, the U.S.corporate income taxliability was reduced29.1 percent by foreigntax credits.

104
Corporate Foreign Tax Credit, 1997
104
While the “overall” limitation restricted the ag-gregate tax credit, corporations could arrange theirbusiness activities in order to maximize the credit oftaxes paid in highly-taxed foreign jurisdictions bymoving U.S. income, such as investment income, to aforeign jurisdiction with little or no income tax. Toprevent this averaging of income from highly taxedforeign jurisdictions with income from low ornontaxed foreign jurisdictions, Congress enacted a“per country” limitation. Under the per countrylimitation, the limitation on creditable foreign incometaxes is computed separately for each country. Theper country limitation was operational in variousforms from 1932 until 1976. Historically, corpora-tions were required to use: (1) the overall limitation(1921–1932); (2) the lesser of the per country limita-tion or overall limitation (1932–1954); (3) the percountry limitation (1954–1961); or (4) an election ofthe overall or per-country limitation (1961–1976).The overall limitation remains in effect today.
Regardless of the limitation method required (percountry or overall), prior to the enactment of theRevenue Act of 1962, corporations combined alltypes of foreign income for purposes of computingtheir foreign tax credit limitations. With the passageof the 1962 Act, corporations were required to com-pute a separate foreign tax credit limitation for non-business interest income. This legislation was di-rected toward U.S. corporations with foreign-sourceincome taxed at a higher rate than the U.S. rate.The intent was to discourage these corporations fromshifting non-business lower-taxed income overseas.These interest-bearing foreign investments couldgenerate additional foreign income with very little tax,thereby, increasing the limitation on the foreign taxcredit. By separating low-taxed non-business incomefrom higher-taxed business income, U.S. corporationswere limited in their ability to arrange foreign invest-ments at the expense of U.S. tax revenue.
Subsequent legislation required additional sepa-rate foreign tax credit limitations with respect tocertain types of foreign income, especially under theTax Reform Act of 1986. The separation of incometypes continued to limit U.S. taxpayers’ ability tocross credit. The current structure of the statutorycategories requires separate treatment for differenttypes of income and income from different industries.
For 1997, taxpayers computed a separate foreigntax credit limitation for each of the following statutory
categories of foreign-source income (described in theExplanation of Selected Terms section):
r passive income,
r high withholding tax interest,
r financial services income,
r shipping income,
r income re-sourced by treaty,
r dividends from each “noncontrolled” foreigncorporation as defined in Internal Revenue Codesection 902,
r dividends from an Interest-Charge DomesticInternational Sales Corporation (IC-DISC’s) orformer DISC,
r certain distributions from a Foreign Sales Corpo-ration (FSC) or former FSC,
r taxable income attributable to foreign tradeincome [2],
r income from sanctioned countries per InternalRevenue Code section 901(j) [3], and
r all other income from outside the United States(commonly referred to as general limitationincome or overall basket).
The foreign tax credit claimed is the sum ofcredits allowed in each separate category. In certaininstances, the total foreign tax credit claimed wasreduced for participation in or for cooperation withinternational boycotts [4].
The treatment of excess or “unused” credits hasalso varied as the foreign tax credit provisions havedeveloped. From 1921 through 1931, the amount ofincome and profits taxes paid to foreign countries inexcess of that deducted as a tax credit was includedin deductions against the gross income. With theInternal Revenue Code of 1939, the foreign taxes inexcess of those deducted as a tax credit were insteadcredited against the excess profits tax. Congressintroduced a carryover of excess or “unused” foreigntax credits in the Technical Amendments Act of

105
Corporate Foreign Tax Credit, 1997
1958. These carryover provisions superceded thetreatment of excess credits as defined in the InternalRevenue Code of 1939. They directed that anyexcess taxes that could not be credited because ofthe current-year limitation could be carried back 2years (necessitating an amended return) or carriedforward 5 years, subject always to the current-yearforeign tax credit limitation. In other words, the totalforeign taxes under each separate limitation for anygiven year includes current-year foreign taxes, plustaxes that were carried forward from prior years or,in the case of an amended return, any taxes thatwere carried back from future years
The foreign tax credit is elective. If the taxpayerelects to take the credit, no deduction for foreigntaxes paid is available. In most circumstances, ataxpayer will elect to take the credit, which offsetsthe U.S. taxes dollar for dollar. Comparatively, thededuction may offset U.S. taxes by only 35 cents forevery dollar deducted if the corporation’s tax ratewere 35.0 percent [5]. To claim a foreign tax credit,a U.S. corporation must have foreign-source taxableincome, pay foreign income tax on the foreign in-come, and have a U.S. income tax liability.
Certain types of foreign taxes or levies are notcreditable under U.S. regulations. Common types ofnon-creditable taxes include soak-up taxes, levies thatyield specific economic benefit, levies to certain
foreign governments deemed ineligible for thecredit, and taxes generated by tax-motivated stockacquisitions. (See Explanation of SelectedTerms for definitions.) These taxes can be de-ducted in calculating the worldwide taxable in-come, even when the foreign tax credit is electedfor foreign income taxes.
Foreign Tax Credit, Tax Year 1993 Through TaxYear 1997For the 5-year period, 1993–1997, the number ofU.S. corporations that elected to credit foreign taxesagainst their U.S. tax liabilities varied considerably[6]. However, as shown in Figure A, the total world-wide taxable income, U.S. income tax before credits,foreign-source taxable income, current-year foreigntaxes, and foreign tax credit claimed by these corpo-rations have grown steadily. This growth is mostapparent when comparing the income and taxes for1993 and 1997. For 1993, some 6,322 corporationsreported $228.7 billion in worldwide taxable income(column 2), computed an $81.9-billion U.S. taxliability, and credited nearly $22.9 billion under theforeign tax credit provisions. The number of corpo-rations for 1997 increased less than 4 percent to6,569. Yet the income subject to U.S. tax, U.S. taxliability, and foreign tax credit amounts each in-creased by more than 75.0 percent.
Figure A
U.S. Corporation Returns with a Foreign Tax Credit: Income Subject to U.S. Tax, Foreign-Source Taxable Income, Current-Year Foreign Taxes, and Foreign Tax Credit, Tax Years 1993-1997(Money amounts are in millions of dollars)
Amount
As a percentage of income subject to U.S. tax
Amount
As a percentage of income subject to U.S. tax
Amount
As a percentage of foreign-
source taxable
income ³
Amount
As a percentage
of U.S. income tax
before credits
(1) (2) (3) (4) (5) (6) (7) (8) (9) (10)
1993..............................................................................................................6,322 228,688 81,913 35.8 94,687 41.4 23,716 25.0 22,895 28.0 1994..............................................................................................................7,199 255,439 90,786 35.5 101,521 39.7 26,470 26.1 25,419 28.0 1995..............................................................................................................6,710 303,308 107,996 35.6 120,518 39.7 30,930 25.7 30,416 28.2 1996..............................................................................................................6,100 370,049 130,748 35.3 150,826 40.8 41,177 27.3 40,255 30.8 1997..............................................................................................................6,569 410,126 144,779 35.3 157,989 38.5 45,080 28.5 42,223 29.2 ¹ "Worldwide taxable income" is used interchangeably with "Income subject to U.S. tax." ² Before adjustments. ³ The percentages shown in this column are not effective tax rates. An effective tax rate would contain a measure of economic income in the denominator and taxes on that income in the numerator. The percentages shown here are simply a tool used to determine what factors contributed to the relatively constant proportion of foreign tax credits to U.S. tax liability over the 1993-1997 period.
Foreign tax credit claimed
Tax year
Number of U.S.
corporation returns
Income subject to U.S. tax ¹
Foreign-source taxable income (less loss) ²
U.S. income tax before credits
Current-year foreign taxes
106
Corporate Foreign Tax Credit, 1997
106
Because these U.S. corporations have main-tained steady growth both in foreign and domesticsource income over this 5-year period, the effect ofthe foreign tax credit provisions has remained rela-tively constant. Worldwide income for U.S. corpora-tions increased 79.3 percent from 1993 to 1997.Domestic source income increased 88.2 percentduring this period. The foreign-source taxable in-come as a percentage of income subject to U.S. tax(column 8) remained in the 38-41 percent range, withforeign-source taxable income increasing 66.8 per-cent overall. The percent of creditable taxes to theU.S. tax liability remained relatively constant duringthis period. Using the foreign tax credit provisions,U.S. corporations reduced their U.S. tax liabilitiesannually by nearly 30.0 percent.
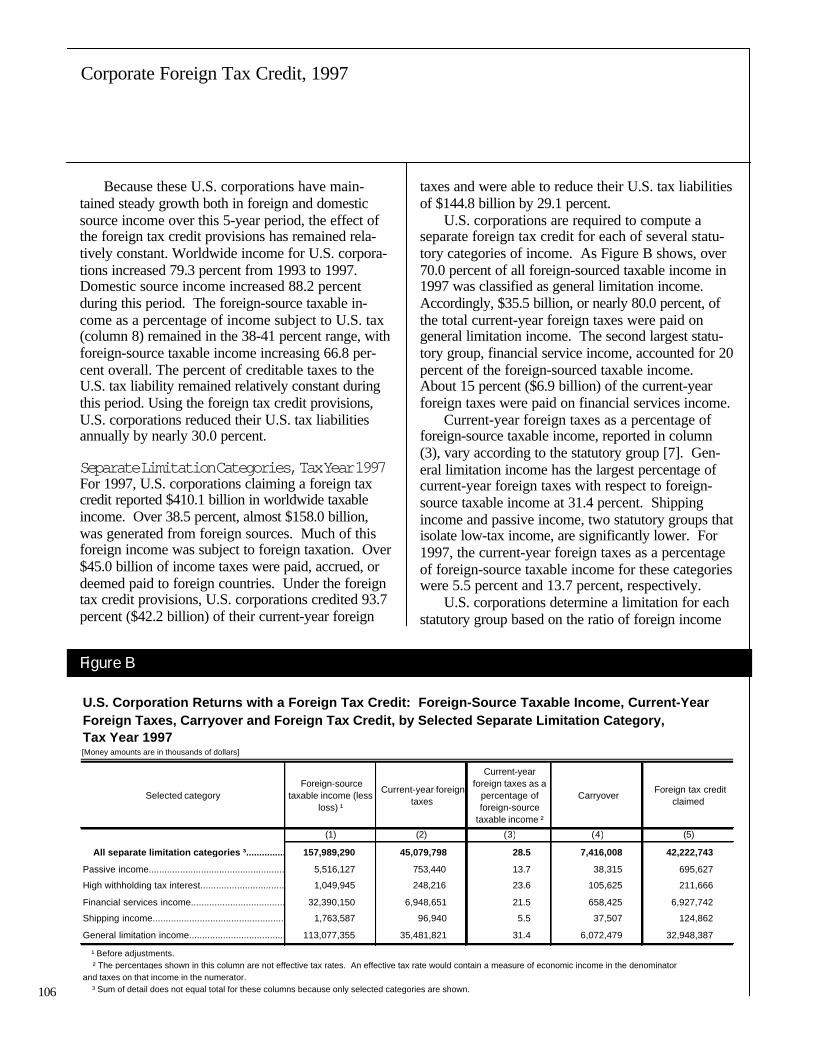
Separate Limitation Categories, Tax Year 1997For 1997, U.S. corporations claiming a foreign taxcredit reported $410.1 billion in worldwide taxableincome. Over 38.5 percent, almost $158.0 billion,was generated from foreign sources. Much of thisforeign income was subject to foreign taxation. Over$45.0 billion of income taxes were paid, accrued, ordeemed paid to foreign countries. Under the foreigntax credit provisions, U.S. corporations credited 93.7percent ($42.2 billion) of their current-year foreign
taxes and were able to reduce their U.S. tax liabilitiesof $144.8 billion by 29.1 percent.
U.S. corporations are required to compute aseparate foreign tax credit for each of several statu-tory categories of income. As Figure B shows, over70.0 percent of all foreign-sourced taxable income in1997 was classified as general limitation income.Accordingly, $35.5 billion, or nearly 80.0 percent, ofthe total current-year foreign taxes were paid ongeneral limitation income. The second largest statu-tory group, financial service income, accounted for 20percent of the foreign-sourced taxable income.About 15 percent ($6.9 billion) of the current-yearforeign taxes were paid on financial services income.
Current-year foreign taxes as a percentage offoreign-source taxable income, reported in column(3), vary according to the statutory group [7]. Gen-eral limitation income has the largest percentage ofcurrent-year foreign taxes with respect to foreign-source taxable income at 31.4 percent. Shippingincome and passive income, two statutory groups thatisolate low-tax income, are significantly lower. For1997, the current-year foreign taxes as a percentageof foreign-source taxable income for these categorieswere 5.5 percent and 13.7 percent, respectively.
U.S. corporations determine a limitation for eachstatutory group based on the ratio of foreign income
U.S. Corporation Returns with a Foreign Tax Credit: Foreign-Source Taxable Income, Current-Year Foreign Taxes, Carryover and Foreign Tax Credit, by Selected Separate Limitation Category, Tax Year 1997[Money amounts are in thousands of dollars]
Selected category Foreign-source
taxable income (less loss) ¹
Current-year foreign taxes
Current-year foreign taxes as a
percentage of foreign-source
taxable income ²
Carryover Foreign tax credit
claimed
(1) (2) (3) (4) (5)
All separate limitation categories ³..............................................................................................................157,989,290 45,079,798 28.5 7,416,008 42,222,743
Passive income..............................................................................................................5,516,127 753,440 13.7 38,315 695,627
High withholding tax interest..............................................................................................................1,049,945 248,216 23.6 105,625 211,666
Financial services income..............................................................................................................32,390,150 6,948,651 21.5 658,425 6,927,742
Shipping income..............................................................................................................1,763,587 96,940 5.5 37,507 124,862
General limitation income..............................................................................................................113,077,355 35,481,821 31.4 6,072,479 32,948,387
¹ Before adjustments. ² The percentages shown in this column are not effective tax rates. An effective tax rate would contain a measure of economic income in the denominator and taxes on that income in the numerator. ³ Sum of detail does not equal total for these columns because only selected categories are shown.
Figure B

107
Corporate Foreign Tax Credit, 1997
attributable to each income category to their world-wide incomes. For 1997, U.S. corporations wereable to credit all of the current-year foreign taxespaid in only one statutory group, shipping income. Inaddition, 74.4 percent of the carryover in this statu-tory group was credited. In contrast, U.S. corpora-tions credited 92.9 percent, or over $32.9 billion, oftheir $35.5 billion current-year foreign taxes paid ongeneral limitation income. Only 85.3 percent of thecurrent year foreign taxes paid on high withholdingtax interest income was credited.
Industry CompositionSimilar to recent years, manufacturing corporationscontinued to account for the majority of foreign-source taxable income, current-year taxes, andforeign tax credits (Figure C). U.S. manufacturerswere responsible for 65.1 percent of the total $157.9billion in foreign-source taxable income and nearly71.9 percent of the total $45.1 billion in current-yearforeign taxes. As a result, U.S. manufacturers wereable to claim $30.3 billion in foreign tax credits.Figure D shows the foreign tax credit claimed by
specific industry groups as a percentage of the totalforeign tax credit reported for selected years in the1990’s; manufacturing was the leader in 1997 with71.8 percent. Within manufacturing, the mostsignificant of the specific industries in terms offoreign-source taxable income, current-year foreigntaxes, and foreign tax credits, continued to be produc-ers of petroleum (including those integrated withextraction) and coal products. This minor industryaccounted for 16 percent of the total foreign taxcredit claimed.
Finance, insurance, and real estate (FIRE) ac-counts for the second largest source of total foreign-source taxable income (20.2 percent) and generated14.6 percent of total current-year foreign taxes.Figure D shows that FIRE was the fastest growingindustry in terms of foreign tax credits claimed duringthe 1990’s, as its share of the total foreign tax creditincreased from 6.6 percent in 1990 to 15.8 percent in1997.
Using the foreign tax credit as a measurement ofindustry activity actually understates the growingimportance of finance, insurance, and real estate
U.S. Corporation Returns with a Foreign Tax Credit: Foreign-Source Taxable Income, Current-Year Foreign Taxes, and Foreign Tax Credit, by Selected Industrial Group, Tax Year 1997[Money amounts are in millions of dollars]
Selected industrial group Number of returns Foreign-source
taxable income (less loss) ¹
Current-year foreign taxes
Foreign tax credit claimed
(1) (2) (3) (4)
All industries..............................................................................................................6,569 157,989 45,080 42,223 Agriculture, forestry, and fishing..............................................................................................................134 140 34 35 Mining.............................................................................................................. 133 3,159 1,298 907 Construction..............................................................................................................183 155 48 44 Manufacturing..............................................................................................................1,763 102,821 32,401 30,299
Food and kindred products..............................................................................................................83 9,057 2,913 2,801 Petroleum (including integrated) and coal products..............................................................................................................28 19,801 7,387 6,748 Electrical and electronic equipment..............................................................................................................327 13,430 3,205 2,963 Motor vehicles and equipment..............................................................................................................27 7,730 2,397 2,381
Transportation and public utilities..............................................................................................................159 5,373 872 803 Wholesale and retail trade..............................................................................................................1,193 5,778 1,657 1,383 Finance, insurance, and real estate..............................................................................................................1,676 31,905 6,573 6,655
Banking.............................................................................................................. 92 13,226 3,281 3,337 Insurance..............................................................................................................297 9,722 1,484 1,553
Services.............................................................................................................. 1,329 8,658 2,196 2,097 ¹ Before adjustments. NOTE: Industrial group detail may not add to the total for "All industries" because of rounding.
Figure C

108
Corporate Foreign Tax Credit, 1997
108
corporations to U.S. businesses, since income inthose industries is usually taxed at a much lower ratethan manufacturing income and, thus, would generatelower values of creditable foreign taxes. Foreign-source taxable income is a better indication of therelative importance of an industry to U.S. businesses.Since 1990, it has increased 125.8 percent for corpo-rations in finance, insurance, and real estate, com-pared to an increase of only 47.5 percent for all otherindustries.
While finance, insurance, and real estate compa-nies became more prominent from 1990 to 1997, it isnotable that manufacturing corporations saw anequally steady decline during this period. At thebeginning of the decade, manufacturing accountedfor 83.1 percent of the total foreign tax credit, but, by1997, their share had decreased to 71.8 percent.Likewise, manufacturing’s share of total foreign-source income declined from 73.9 percent in 1990 to65.1 percent in 1997.
Oil and Gas Extraction IncomeOil and gas extraction income, deductions, and taxesare reported separately from all other foreign-sourceincome by U.S. corporations claiming a foreign taxcredit related to that income. Section 907 of theInternal Revenue Code details how separate rulesrelated to oil and gas extraction income affect the
amount of foreign taxes available for corporations tocredit. These provisions disallow certain foreigntaxes and require another limitation calculationspecifically for foreign oil and gas extractionincome (FOGEI). Foreign taxes are excluded fromthe foreign tax credit calculation if they were paid,accrued, or deemed paid at a rate in excess of theapplicable U.S. tax rate. Taxes can also beexcluded if they were not, in effect, income taxes,but rather royalty payments. Under the foreign taxcredit provisions, only income taxes, as viewedthrough U.S. tax principles, are creditable. Thisexcludes voluntary payments and payments forspecific rights (such as the right to extract a naturalresource) or services.
Figure E shows gross income from foreign oiland gas extraction by both selected industry groupsand selected countries for 1997. Most FOGEI wasreported by U.S. corporations classified as manufac-turers of petroleum (including integrated) and coalproducts. For 1997, the oil and gas extraction indus-try accounted for 9.7 percent of the total oil and gasextraction-related gross income reported. Figure Ealso lists the countries generating the greatestamounts of gross income associated with foreign oiland gas extraction for 1997. For the fourth year in arow, corporations reported the most gross incomefrom the United Kingdom and Indonesia. Eight
Figure D
Selected Industry Shares of Total Foreign Tax Credit Claimed, Selected Tax Years
1990 1992 1994 1996 1997(1) (2) (3) (4) (5)
All industries..............................................................................................................100.0 100.0 100.0 100.0 100.0 Agriculture, forestry, and fishing..............................................................................................................0.1 0.2 0.2 0.2 0.1 Mining.............................................................................................................. 3.2 2.8 2.6 2.3 2.1 Construction..............................................................................................................0.4 0.4 0.3 0.5 0.1 Manufacturing..............................................................................................................83.1 71.4 70.0 72.5 71.8
Food and kindred products..............................................................................................................3.7 6.0 5.5 5.7 6.6 Petroleum (including integrated) and coal products..............................................................................................................21.5 20.3 17.1 19.0 16.0 Electrical and electronic equipment..............................................................................................................4.8 4.1 5.2 5.6 7.0 Motor vehicles and equipment..............................................................................................................6.9 1.2 6.7 5.7 5.6
Transportation and public utilities..............................................................................................................0.6 2.2 3.8 1.1 1.9 Wholesale and retail trade..............................................................................................................3.7 5.8 4.3 3.2 3.3 Finance, insurance, and real estate..............................................................................................................6.6 14.7 14.5 15.5 15.8
Banking..............................................................................................................2.1 8.1 7.6 6.7 7.9 Insurance..............................................................................................................2.5 3.5 4.0 3.6 3.7
Services..............................................................................................................2.4 2.6 4.3 4.7 5.0
NOTE: Detail may not add to totals because of rounding.
Industry's percentage share of foreign tax creditSelected industrial group

109
Corporate Foreign Tax Credit, 1997
European Union (E.U.). Collectively, the E.U.accounted for nearly twice as much foreign-sourcedtaxable income as the next largest region, Asia.
Further analysis yields that a small number ofcountries account for a significant share of foreign-source taxable income as presented in Figure F.Consistently, for the past 5 years, the United King-dom, Canada, Japan, the Netherlands, and Germanyhave accounted for approximately 42.2 percent of thetotal foreign-source taxable income. In 1997, thesefive countries accounted for over $70.2 billion of thenearly $158.0 billion foreign-source taxable income(44.5 percent). The United Kingdom and Canadacombined account for over one-fourth of the foreign-source income at $25.2 billion (16.0 percent) andnearly $16.0 billion (10.0 percent), respectively.
The industry composition of these five countriesis presented in Figure G. The largest portion offoreign-source taxable income reported in thesecountries was from manufacturers. U.S. manufac-turers in Canada, the Netherlands, and Germanyeach accounted for more than 70.5 percent of theforeign-source taxable income reported for thosecountries. Petroleum and coal product manufactur-ers with operations in the Netherlands and the UnitedKingdom were the largest single source of the manu-facturing income for these countries, accounting for27.9 percent and 30.9 percent of the aggregatemanufacturing income, respectively. Similarly, 69.2percent of the nearly $12.0-billion Japan-sourcetaxable income was from manufacturers ($8.3 bil-lion). However, the most significant sources ofincome for U.S. manufacturers operating in Japanwere from office, computing, and accounting equip-ment operations ($2.2 billion) and electrical andelectronic equipment operations ($1.9 billion).
Four of the five largest (in terms of taxableincome) countries reported that the majority of non-manufacturing foreign-source taxable income (lessloss) was from finance, insurance, and real estate(FIRE) corporations--the United Kingdom, Canada,Japan, and Germany [8]. More than one-fourth ofthe foreign-source taxable income within this industrygrouping was from corporations with operations inthe United Kingdom. Half of the $8.4 billion U.K.-sourced taxable income for this industry group wasfrom banking. In fact, nearly one-third of all foreign-source taxable income from banking was from the
Figure E
U.S. Corporation Returns with a Foreign Tax Credit: Foreign Oil and Gas Extraction Gross Income by Selected Industrial Group and Selected Country, Tax Year 1997[Money amounts are in millions of dollars]
Selected industrial group: All industries..............................................................................................................21,014 100.0 Petroleum (including integrated) and coal products manufacturing......................................................................................................17,349 82.6 Oil and gas extraction..............................................................................................................2,037 9.7 Industrial plastics and synthetic materials manufacturing......................................................................................................1,395 6.6 All other industries..............................................................................................................233 1.1 Selected country: All countries..............................................................................................................21,014 100.0 United Kingdom..............................................................................................................4,571 21.8 Indonesia..............................................................................................................1,749 8.3 Norway..............................................................................................................1,467 7.0 Australia..............................................................................................................1,438 6.8 Netherlands..............................................................................................................1,175 5.6 Malaysia..............................................................................................................*751 *3.6 Canada..............................................................................................................*725 *3.5 Nigeria..............................................................................................................*668 *3.2 Thailand..............................................................................................................*570 *2.7 Saudi Arabia..............................................................................................................*524 *2.5 Trinidad and Tobago..............................................................................................................*509 *2.4 Colombia..............................................................................................................*469 *2.2 Former Soviet Union..............................................................................................................*408 *1.9 All other countries..............................................................................................................5,990 28.5 * Data should be used with caution because of the small numberof returns on which they are based.
Selected industrial group, countryGross
income (less loss)
Percentage of total
countries, the United Kingdom, Indonesia, Norway,Australia, the Netherlands, Malaysia, Canada, andNigeria, together accounted for 59.7 percent of allgross income from foreign oil and gas extractionactivities.
Geographic FocusFor 1997, European countries accounted for aconsiderable portion of the foreign-source taxableincome and current-year taxes (Figures F, G, H, I,and Table 3) reported by U.S. corporations claiminga foreign tax credit. Europe was the source of $66.7billion (42.2 percent) in taxable income and $20.0billion (44.4 percent) of the current-year taxes.Specifically, more than one-third of the foreign-sourced taxable income and current-year taxes werereported by U.S. corporations with operations in the

110
Corporate Foreign Tax Credit, 1997
110
United Kingdom. FIRE corporations with opera-tions in Canada and Japan reported the majority oftheir foreign-source taxable incomes from insur-ance operations, 83.5 percent and 68.3 percent,respectively. Nearly one-fourth of all foreign-source taxable income from insurance operationswas from Canada.
Entity FocusU.S. corporations may establish a worldwide pres-ence via several types of entities. For example, theU.S. corporation may invest in an existing corpora-tion, form a wholly-owned subsidiary corporation orcreate a partnership under the laws of a foreign
jurisdiction, form a joint venture with a foreign entity,or operate through an unincorporated branch. For1997, more than one-third ($56.3 billion) of theforeign-sourced taxable income ($158.0 billion) fromU.S. corporations claiming a foreign tax credit isfrom foreign branch operations. Due to reportinglimitations on Form 1118, Foreign Tax Credit –Corporations, the remaining two-thirds cannot beclassified by entity type.
Foreign-Source Gross Income and Taxes (ExcludingForeign Branch Income)The composition of current-year taxes and foreign-sourced gross income, excluding foreign branch
Figure F
0% 20% 40% 60% 80% 100%
1997
1996
1995
1994
1993
Percentage of foreign-source taxable income (less loss)
United Kingdom Canada Japan Netherlands Germany Rest of world
$158.0 Billion
$150.8 Billion
$120.5 Billion
$101.5 Billion
$94.7 Billion
Percentage of Foreign-Source Taxable Income, by Selected Country, Tax Years 1993-1997
Tax year

111
Corporate Foreign Tax Credit, 1997
income, by country or area is presented in Figure H.By definition, current-year taxes consist of two parts:(1) taxes paid or accrued and (2) taxes deemed paid[9]. For 1997, current-year taxes totaled $45.1billion, with nearly two-thirds ($29.0 billion) fromtaxes deemed paid. The largest share of total taxand the largest share of taxes deemed paid werecollected by countries in the European Union (E.U.).The E.U. reported $17.6 billion of the $45.1 billion inforeign taxes paid, accrued, or deemed paid. Nearly80.0 percent of the E.U. taxes ($14.0 billion) was taxdeemed paid. In fact, almost half (48.3 percent) ofthe foreign taxes deemed paid by all U.S. corpora-tions claiming a foreign tax credit were paid tocountries in the E.U. The second highest amount offoreign taxes paid, accrued, or deemed paid ($10.2billion) was paid to Asian countries. The Asian taxeswere distributed evenly between taxes paid oraccrued and taxes deemed paid. The $5.1 billionAsian taxes paid or accrued represented almost one-third of the $16.0 billion reported by all U.S.corporations claiming a foreign tax credit.
U.S. corporations reported nearly $360.0 billion ingross foreign-sourced income. Three-fourths of thegross income were generated by entities other than
foreign branches. Of the more than $271.2 billion offoreign-sourced gross income (excluding foreignbranch income), $97.5 billion were dividend incomeand related gross-up. Interest income accounted fornearly one-fourth, or $61.5 billion. Rents, royalties,and license fees generated $48.6 million, or 17.9percent. Income related to service accounted foronly 11.6 percent, with a remaining 11.9 percentundefined.
One-third of the gross foreign-sourced income(excluding foreign branch income), $90.1 billion, wasgenerated in the European Union (E.U.). The largestshare of this E.U.-sourced gross income, 47.5 per-cent, was from dividends and related gross-up. Infact, U.S. corporations received 42.0 percent of theirdividend income from countries in the E.U., $28.8billion of $68.4 billion. Interest income generated inthe E.U. totaled nearly $23.0 billion, or one-fourth ofthe total E.U.-sourced gross income (excludingforeign branch income). Rents, royalties, and licensefees accounted for nearly 22.0 percent of the E.U.-sourced gross income. Both E.U.-sourced interestincome and E.U.-sourced rental income accountedfor a significant share of the total foreign-sourcedincome reported by U.S. corporations claiming a
U.S. Corporation Returns with a Foreign Tax Credit: Foreign-Source Taxable Income (Less Loss), by Selected Industrial Group and Selected Country, Tax Year 1997[Money amounts in thousands of dollars]
Selected industrial group All countries United
KingdomCanada Japan Netherlands Germany Rest of world
(1) (2) (3) (4) (5) (6) (7)
All industries..............................................................................................................157,989,290 25,205,763 15,906,555 11,976,713 8,607,060 8,553,809 87,739,390 Mining..............................................................................................................3,159,297 450,420 190,264 *2,156 107,892 *5,458 2,403,107 Manufacturing..............................................................................................................102,821,437 14,471,963 11,217,218 8,290,499 6,773,893 6,246,336 55,821,528 Food and kindred products..............................................................................................................9,057,195 3,302,888 491,866 764,959 512,180 523,013 3,462,289 Industrial plastics and synthetic materials..............................................................................................................5,807,726 870,459 627,733 389,755 544,675 770,802 2,604,302 Drugs..............................................................................................................7,792,900 781,170 278,818 615,808 694,541 777,938 4,644,625 Petroleum (including integrated) and coal products..............................................................................................................19,801,407 4,471,913 1,291,767 435,419 1,891,428 131,167 11,579,713 Office, computing, and accounting equipment..............................................................................................................10,424,085 558,679 1,851,630 2,150,304 933,701 456,220 4,473,551 Electrical and electronic equipment..............................................................................................................13,430,204 1,901,263 789,225 1,917,387 630,498 566,404 7,625,427 Motor vehicles and equipment..............................................................................................................7,730,127 390,522 2,485,579 394,126 133,366 622,613 3,703,921 Transportation and public utilities..............................................................................................................5,372,629 390,968 508,782 17,095 51,451 63,716 4,340,617 Wholesale and retail trade..............................................................................................................5,777,769 719,951 646,716 611,128 159,045 874,539 2,766,390 Finance, insurance, and real estate..............................................................................................................31,905,032 8,422,474 2,649,727 1,584,750 403,484 919,917 17,924,680 Banking..............................................................................................................13,225,653 4,286,312 198,576 417,785 118,289 359,955 7,844,736 Insurance..............................................................................................................9,722,081 1,206,669 2,213,080 1,082,238 182,532 145,437 4,892,125 Services..............................................................................................................8,657,696 739,088 648,697 1,465,464 1,106,764 435,114 4,262,569 Other..............................................................................................................295,430 10,899 45,151 5,621 4,531 8,729 220,499
* Data should be used with caution because of the small number of returns on which they were based.
Figure G

112
Corporate Foreign Tax Credit, 1997
112
0
2
4
6
8
10
12
14
16
18
20
Canada Latin America European Union Other Europe Africa Asia Oceania
Taxes Paid or Accrued Taxes Deemed Paid
Billions of dollars
Foreign-Source Taxes Paid or Accrued and Taxes Deemed Paid, by Selected Country or Geographic Area, Tax Year 1997
Figure H
0
200
400
600
800
1,000
Canada Latin America European Union Other Europe Africa Asia Oceania
Dividends Dividend Gross-up Interest
Rents, Royalties, and License Fees Services Other (Non-Branch Income)
Billions of dollars
Foreign-Source Gross Income (Excluding Branch Income), by Country or Geographic Area, Tax Year 1997

113
Corporate Foreign Tax Credit, 1997
foreign tax credit. Over 37.0 percent of the $61.5billion total interest from foreign sources was gener-ated in E.U. countries. Similarly, 40.1 percent of thetotal rental, royalty, and licensing fee income fromforeign sources was generated in E.U. countries.
Asian-sourced gross income totaled $47.7 billion(excluding foreign branch income) and representedthe second-largest income source by region. Morethan half of the Asian-sourced gross income wasgenerated from two sources nearly equally: (1) rents,royalties, and license fees and (2) dividend incomeand related gross-up. Rents, royalties, and licensefees generated $13.5 billion, 28.3 percent of the totalforeign-sourced rental, royalty, and licensing incomereported by U.S. corporations claiming a foreign taxcredit. Asian-sourced dividend income and gross-upcombined equaled $13.0 billion. Asian-sourced grossservice income and interest income were similarlysplit, generating over $10.0 billion each. This regiongenerated more than one-third of the total foreign-sourced service income reported by U.S. corpora-tions claiming a foreign tax credit.
Foreign Branch IncomeAn unincorporated foreign branch is not a separatelegal entity, but an extension of the domestic corpora-tion. The foreign branch is subject to the tax laws ofthe country in which it operates. Taxable income ofa foreign branch is determined separately, as if itwere independent of the domestic corporation.
Direct costs, such as cost of goods sold, are allocatedagainst the branch income, and certain indirectexpenses may be charged but are subject to thelimitation of the foreign country’s regulations.Foreign branch gross income and expenses arereported separately on Form 1118, Schedule F, andincluded in the taxable income computations for therelated basket.
From the U.S. tax perspective, foreign branchincome represents foreign-source income earneddirectly by the domestic corporation. Foreign branchprofits or losses are included directly in the taxableincome of the domestic corporation and are not aseparate taxable event for U.S. purposes. In con-trast, the income from a foreign subsidiary, in gen-eral, is not included in the taxable income of thedomestic corporation until the earnings are distributedto the U.S. parent corporation as a dividend. Branchincome is taxed by the U.S. at the regular corporaterates. Therefore, a taxpayer will owe a residualU.S. tax on the income from a branch operating in alow-tax jurisdiction, whereas a branch operating in ahigh-tax foreign jurisdiction may create excess for-eign tax credits.
Figure I presents the distribution of foreignbranch income by selected country and industry for1997. More than $35.1 billion (62.5 percent) of totalforeign branch taxable income was connected withoperations in ten countries, three of which weremembers of the E.U.: Australia, Bahamas, Brazil,
Figure I
U.S. Corporation Returns with a Foreign Tax Credit: Taxable Income (Less Loss) from Foreign Branches, by Selected Country, Tax Year 1997[Money amounts in thousands of dollars]
Petroleum All other
(1) (2) (3) (4) (5) (6)
All countries..............................................................................................................56,299,939 9,596,777 6,992,156 29,214,315 5,828,794 4,667,897 Australia..............................................................................................................1,946,472 1,259,683 322,296 277,141 25,500 61,852 Bahamas..............................................................................................................1,289,206 144,147 354 1,144,666 -- 39 Brazil..............................................................................................................1,312,350 38,401 10,328 1,226,944 -64 36,741 Germany..............................................................................................................1,291,197 81,159 878,999 217,077 11,037 102,925 Hong Kong..............................................................................................................2,722,824 14,091 174,407 2,253,983 60,828 219,515 Japan..............................................................................................................6,588,763 12,118 200,752 1,273,599 4,993,482 108,812 Mexico..............................................................................................................1,390,768 2,607 837,991 422,352 12,706 115,112 Netherlands..............................................................................................................2,383,480 1,659,538 543,369 81,325 12,641 86,607 Singapore..............................................................................................................1,685,507 11,545 4,390 1,558,983 689 109,900 United Kingdom..............................................................................................................14,557,160 3,206,181 187,186 9,696,359 213,015 1,254,419
Selected country Banking Insurance All otherManufacturing
All industries

114
Corporate Foreign Tax Credit, 1997
114
Germany, Hong Kong, Japan, Mexico, Netherlands,Singapore, and the United Kingdom [10]. In fact,corporations with branch operations in the UnitedKingdom reported one-fourth, or $14.6 billion, of thetotal taxable branch income. Corporations classifiedin three industrial groups reported most of this in-come: banking (51.9 percent), manufacturing (29.5percent), and insurance (10.4 percent).
U.S. banks reported more than half of all foreignbranch taxable income. More than one-third of theU.S. bank-related taxable branch income was re-ported by operations in the United Kingdom, $9.7billion. The U.K.-sourced taxable branch incomefrom banking accounted for nearly two-thirds of allincome from UK branch operations. In addition,U.S. banks with branch operations in the Bahamas,Brazil, Hong Kong, and Singapore contributed mostof the total taxable branch income for these countries(88.8 percent, 93.5 percent, 82.8 percent, and 92.5percent, respectively).
U.S. manufacturers accounted for $16.5 billion ofthe $56.3 billion foreign-sourced taxable branchincome, nearly 30.0 percent. Over $9.5 billion wascontributed by petroleum and coal-product manufac-turers. Specifically, U.S. petroleum and coal-productmanufacturers operating in the United Kingdomaccounted for more than one-third of the branchincome reported by all U.S. petroleum and coal-producers. U.S. petroleum and coal-product manu-facturers operating in Australia and the Netherlandsaccounted for an additional 30 percent ($1.2 billionand $1.6 billion, respectively). U.S. petroleum andcoal product manufacturers reported nearly 70.0percent of the $2.4 billion Netherlands-sourcedbranch income and nearly 65.0 percent of the $1.9billion Australia-sourced branch income. U.S. manu-facturers in the non-petroleum industries reported68.1 percent of the $1.3 billion German-sourcedbranch income and 60.3 percent of the $1.4 billionMexican-sourced branch income.
U.S. insurers were the third highest group interms of taxable branch income. Although U.S.insurers reported only 10.4 percent of the total tax-able branch income, they reported more than three-fourths ($4.9 billion) of the $6.5 billion Japan-sourcedbranch income. In fact, U.S. insurers with operationsin Japan accounted for more than 85.0 percent of the$5.8 billion foreign-sourced branch taxable incomefor this industry.
SummaryU.S. corporations claimed a record high foreign taxcredit of $42.2 billion for 1997, as income and taxesincreased across most industrial classifications andcountries. European countries, specifically those inthe European Union, continued as the largest singlesource of foreign-source taxable income and current-year taxes. One recent change, though, has been inthe relative share of foreign income and taxesclaimed by various industries. Corporations in thefinance, insurance, and real estate industries havebeen rapidly increasing their shares of aggregateforeign income and foreign tax credits since 1990.U.S. corporations with foreign tax credits can nolonger be primarily characterized as manufacturersinvolved in foreign oil and gas extraction or in theforeign production of goods. Banking and servicescompanies are gradually becoming more significantabroad and reporting an increasing share of theforeign tax credit.
Data Sources and LimitationsThe statistics in this article were derived fromcorporation income tax returns with a foreign taxcredit that were included in the 1997 Statistics ofIncome corporate sample. To be included in thesample, returns had to have accounting periodsending between July 1997 and June 1998. Thesereturns were selected prior to any audit examination.The 1997 corporation income tax return sampleincluded approximately 94,000 returns chosen fromover 4.7 million returns filed for this period.
The foreign tax credit is claimed under section901 of the Internal Revenue Code. Corporationsreport the foreign income and taxes related to thecredit on Form 1118, Computation of Foreign TaxCredit--Corporations, filed with their corporate taxreturns. The statistics in this article are based oninformation reported on Forms 1118 and relatedcorporate returns. Corporations with “alternativeminimum tax” (AMT) must compute a separate“alternative minimum foreign tax credit.” Data forthe AMT foreign tax credit computation were ex-cluded from these statistics, even if the corporationreported both the foreign tax credit and the AMTcomputation. If the corporation reported only theAMT computation, it had no regular tax and wouldnot be included in the foreign tax credit study.
There are slight differences between the more

115
Corporate Foreign Tax Credit, 1997
complete foreign tax credit data in this article andthose published in Statistics of Income--1997, Cor-poration Income Tax Returns [11]. These differ-ences can be attributed to several factors, includingbut not limited to the following reasons. Some of thecorporate returns selected for the SOI sample, re-porting a foreign tax credit, were received too late tobe included in the regular corporate statistics (al-though estimates for these returns were included).Some corporations reported preliminary data on theiroriginally filed returns because information on theiroverseas operations were not available at the time offiling. Amended returns were not used for thesestatistics. However, as necessary, additional infor-mation was obtained directly from the taxpayer.
Foreign income and taxes are understated in thisarticle to the extent that they either were not or didnot have to be reported on Form 1118. Because ofthe carryback provisions of the law, the 1997 foreigntax credit statistics presented in this article do notrepresent the final amounts credited that year. Suchan amount would have to reflect, in addition to theresults of subsequent audit, the carryback of someforeign taxes from 1998 and 1999. The foreign taxesavailable for the credit shown in this article includeonly those carried forward to 1997 from previousyears. In addition to the carryback limitations, somecorporations did not file Form 1118 because they hadno U.S. income tax liability and, consequently, wereunable to credit any foreign taxes paid or accrued for1997. Other corporations may have elected to de-duct their foreign taxes from their gross incomesinstead of claiming the foreign tax credit.
Because the estimates are based on a sample,they are subject to sampling error. Coefficients ofvariation (CV’s) are used to measure the magnitudeof this sampling error. The CV is defined in thesection on sampling variability in the SOI SamplingMethodology and Data Limitations appendix of thispublication. Figure J presents CV’s for foreign taxcredits by selected industrial groups. The smaller theCV, the more reliable the estimate is judged to be.
The industry classification used in this articleconforms to the former Enterprise Standard IndustrialClassification (ESIC) authorized by the Office ofInformation and Regulatory Affairs in the Office ofManagement and Budget (OMB). The structure ofthis classification follows closely along the underlying
Standard Industrial Classification (SIC) Manual, alsoauthorized by OMB. For Tax Year 1998, the indus-try classification will conform to the new NorthAmerican Industry Classification System (NAICS),which has recently been adopted.
Tables 1 - 3Table 1, columns 2 through 15, presents statistics onassets, receipts, income, and taxes reported on Form1120, Corporation Income Tax Return, for thosecorporations claiming a foreign tax credit. Columns16 through 52 present statistics from Form 1118,Foreign Tax Credit--Corporations. Schedulereferences indicate the parts of Form 1118 fromwhich the data were obtained. Columns 16 through36 present statistics on foreign income (i.e., incomefrom sources outside the United States) and deduc-tions, reported primarily on Form 1118, Schedule A,Income or Loss Before Adjustments.
Although the amounts of oil and gas income anddeductions (columns 23 and 36, respectively) areincluded in the summary columns (i.e., columns 16through 22 and 26 through 35), these amounts arealso reported separately (on Form 1118, Schedule I,
Figure J
Coefficients of Variation for Foreign Tax Credit,by Selected Industrial Group, Tax Year 1997
Selected industrial group
Coefficients of variation for
foreign tax credit (percentages)
All industries..............................................................................................................0.04
Agriculture, forestry, and fishing..............................................................................................................0.77 Mining..............................................................................................................0.53 Construction..............................................................................................................8.14 Manufacturing..............................................................................................................0.02 Food and kindred products..............................................................................................................0.01 Industrial, plastics, and synthetic materials..............................................................................................................0.05 Drugs..............................................................................................................0.05 Petroleum (included integrated) and coal products..............................................................................................................0.02 Office, computing and accounting equipment..............................................................................................................0.01 Electrical and electronic equipment..............................................................................................................0.05 Motor vehicles and equipment..............................................................................................................( ¹ ) Transportation and public utilities..............................................................................................................0.52 Wholesale and retail trade..............................................................................................................0.50 Finance, insurance, and real estate..............................................................................................................0.13 Banking..............................................................................................................( ¹ ) Insurance..............................................................................................................0.15 Services..............................................................................................................0.37
¹ Less than .005 percent.

116
Corporate Foreign Tax Credit, 1997
116
Reduction of Oil and Gas Extraction Taxes) be-cause oil and gas extraction income is subject tospecial rules under Internal Revenue Code section907, which effectively requires a separate limitationcalculation for taxes related to oil and gas extractionincome. This may result in a reduction of foreigntaxes available for credit. Reductions in creditable oiland gas extraction income taxes are included withseveral other types of reductions in column 41 ofTable 1 and column 27 of Table 2.
Internal Revenue Code section 863(b) income(income partly within and partly without the UnitedStates) and foreign branch income are also includedin the summary amounts reported in columns 16through 22 of Table 1, and are also reported sepa-rately (on Form 1118, Schedule F, Gross Incomeand Definitely Allocable Deductions From SourcesOutside the U.S. Under Section 863(b) and forForeign Branches) in columns 24 and 25 of Table 1.
Total deductions not definitely allocable to spe-cific types of income (column 32) are equal to thesum of Table 1, columns 33 through 35, relating toresearch and development, interest, and any other notdefinitely allocable expenses (any differences are dueto taxpayer reporting variations). Total foreign-source gross income (Table 1, column 16) less totalforeign deductions (Table 1, column 26) is equal toforeign-source taxable income before adjustments(Table 1, column 37).
Adjustments to foreign-source taxable income(reported in column 38 of Table 1) include the alloca-tion of: (1) current-year foreign-source losses, (2)overall foreign losses, and (3) current-year U.S.-source losses, as well as the recapture of prior-yearoverall foreign losses and recharacterization of prior-year foreign-source losses. These adjustments(reported on Schedule J, Separate Limitation LossAllocations and Other Adjustments Necessary ToDetermine Numerators of Limitation Fractions,Year-End Recharacterization Balances, andOverall Foreign Loss Account Balances) affectthe numerator of the limitation fraction used to com-pute the foreign tax credit. The income after adjust-ments (the numerator of the limitation fraction) isreported in column 39 of Table 1. The limitationfraction, foreign-source taxable divided by totaltaxable income from all sources, is applied to the totalU.S. tax against which the credit is allowed to deter-mine any limitation on the foreign tax credit. Taxpay-
ers are required to calculate this limitation for eachstatutory income category.
Statistics on foreign taxes are reported in col-umns 40 through 52 of Table 1. Data on foreigntaxes paid, accrued, and deemed paid (through re-lated foreign corporations or their subsidiaries) fromForm 1118, Schedule B, Foreign Tax Credit—Corporation, are reported in columns 43 through 52of Table 1. Total foreign taxes paid or accrued(Table 1, column 44) are the sum of columns 45through 51 (any differences are due to taxpayerreporting variations). Table 1, column 42 showscarryovers of excess or “unused” taxes from prioryears, which can be added to the 1996 pool of credit-able foreign taxes. Total foreign taxes paid, accrued,and deemed paid, plus carryover, are then adjustedfor certain items (e.g., reductions of foreign taxesrelated to oil and gas extraction income under Inter-nal Revenue code section 907, reductions of foreigntaxes related to income earned in sanctioned coun-tries under Internal Revenue code section 901(j), andother reductions of creditable taxes) in column 41.Thus, total foreign taxes available for credit (Table 1,column 40) are equal to total foreign taxes paid,accrued, and deemed paid (column 43), plus anycarryover of prior-year excess or “unused” foreigntaxes (column 42), less any reduction in foreign taxes(column 41).
Tables 2 and 3 are similar in column format toTable 1 except that they do not provide data fromForm 1120--U.S. Corporation Income Tax Return.Table 2 presents data reported by industrial groupingand separate statutory limitation income category,while Table 3 presents data by selected geographicregion and country.
Explanation of Selected TermsAdjustments to taxable income.--This includes
several types of adjustments reported on Schedule Jof Form 1118, Computation of Foreign Tax Credit--Corporations. These adjustments include the allo-cation of current-year foreign losses, overall foreignlosses, and current-year domestic-source losses. Inaddition, adjustments due to prior-year loss allocationsare made including the recapture of foreign-sourcelosses, and the recharacterization of foreign-sourceincome. The net results of these adjustments arereported in column 38 of Table 1 and column 24 ofTable 2.

117
Corporate Foreign Tax Credit, 1997
Carryover of foreign taxes.--Under InternalRevenue Code section 904, U.S. persons are alloweda 2-year carryback and 5-year carryforward of“excess” or “unused” foreign taxes for purposes ofcomputing the foreign tax credit for those years.Such taxes were included in the computation of thecurrent-year foreign tax credit to the extent that theydid not exceed the credit limitation for the currentyear. For 1997, “carryover” includes only thoseforeign taxes that have been carried forward fromprevious years. See column 42 of Table 1 and col-umn 28 of Table 2.
Controlled Foreign Corporation.--UnderInternal Revenue Code section 957, a foreign corpo-ration is a “Controlled Foreign Corporation” if morethan 50 percent of its outstanding voting stock, ormore than 50 percent of the value of all its outstand-ing stock, is owned (directly, indirectly, or construc-tively) by “U.S. shareholders” on any day during theforeign corporation’s tax year. A “U.S. share-holder,” as defined in Internal Revenue Code section951(b), is a U.S. person who owns 10 percent ormore of the foreign corporation’s total combinedvoting stock. Ownership attribution rules are pro-vided in Internal Revenue Code section 958.
Current-year foreign taxes.--The current-yearforeign taxes include foreign taxes paid, accrued, ordeemed paid and are reported in column 43 of Table1, column 29 of Table 2, and column 15 of Table 3.Current-year foreign taxes do not include anycarryback or carryforward of foreign taxes fromfuture or prior tax years.
European Union (E.U.).--The European Union(E.U.) is a union of fifteen independent states basedon the former European Communities and founded toenhance political, economic, and social cooperation.Formerly known as European Community (E.C.) orEuropean Economic Community (E.E.C.), the mem-ber states include Austria, Belgium, Denmark, Fin-land, France, Germany, Greece, Ireland, Italy, Lux-embourg, the Netherlands, Portugal, Spain, Sweden,and the United Kingdom.
Financial services income.--This separatelimitation category applies to income from a specificindustry--financial services (such as banking). Finan-cial services income includes all income (including“passive income”) that is produced in the activeconduct of a banking, insurance, financing, or similarbusiness, and from certain types of insurance invest-
ments. Financial services income does not includehigh withholding tax interest, dividends from non-controlled foreign corporations as defined in InternalRevenue Code section 902, or certain types of exportfinancing interest. Congress required a separatelimitation category for financial service corporationsbecause of a concern that the income generatedcould be easily shifted to low-tax jurisdictions. Thisseparate limitation category is included in Table 2.
Foreign oil and gas extraction income.--Generally, no foreign tax credit or deduction is al-lowed for foreign taxes paid or accrued in connectionwith the purchase or sale of oil or gas extracted in aforeign country if the taxpayer has no economicinterest in the oil and gas and the purchase or saleprice differs from the fair market value.
Foreign Sales Corporations (FSC).--A foreignsales corporation is a company incorporated abroad,created to promote U.S. exports, and usually con-trolled by a U.S. person (defined below). A portionof the FSC’s “foreign trade income” is exempt fromU.S. taxation. These statistics do not include FSCreturns. However, FSC dividends reported by corpo-rations claiming a foreign tax credit are included.Dividends and interest from a FSC compose a sepa-rate limitation category. In July 1999, the WorldTrade Organization deemed that the FSC provisionsconstituted an illegal export subsidy. Congress re-pealed the FSC provisions and introduced the Extra-territorial Income Exclusion in November 2000.Under this legislation, U.S. corporations may continueto operate FSCs until December 2001.
Foreign-source taxable income.--Foreign-source taxable income is equal to gross income (lessloss) less deductions from sources outside the U.S.
Foreign trade income.--Foreign trade income isthe foreign trading gross receipts earned by a ForeignSales Corporation (FSC) from 1) the sale of exportproperty, 2) leasing of export property for use outsidethe U.S., or 3) services in connection with the sale orleasing of export property. The related separatelimitation category, taxable income attributable toforeign trade income, is unusual in the SOI studybecause of the defined scope of the SOI sample.
General limitation income.--This separatelimitation category includes foreign income not in-cluded in any other separate limitation category.
Gross-up.--Because a dividend represents adistribution from after-tax earnings, the amount of

118
Corporate Foreign Tax Credit, 1997
118
income that a domestic corporation recognizes onreceiving a dividend from a foreign corporation is netof all the foreign income taxes paid by that foreigncorporation. U.S. corporations that satisfy ownershipand other requirements may take an “indirect” for-eign tax credit for taxes paid with respect to thedistribution. Under Internal Revenue Code section78, these taxes are “deemed paid” by the U.S. corpo-ration under Internal Revenue Code sections 902 and960(a). Therefore, the dividend income is grossed-upby the amount of the deemed taxes paid. This deniesthe U.S. corporation the double tax benefit of credit-ing the deemed foreign taxes and deducting the sametaxes from the foreign-sourced taxable income. Thegross-up requirement eliminates the implicit deduction.
High withholding tax interest.--This separatelimitation category includes only interest incomesubject to a withholding tax, or other gross basis tax,at a rate of 5 percent or more. Like the passiveincome basket, the high withholding tax interestbasket does not apply to interest received in theconduct of financing certain export activities.
Income re-sourced by treaty.--A few U.S.income tax treaties contain provisions which reclas-sify certain items of income from U.S.-source toforeign-source. This primarily happens when a taxtreaty gives the foreign country the right to tax whatwould otherwise be U.S.-sourced income. If thecorporation elects to apply the treaty, the income willbe treated as foreign income. Certain dividends,gains, and income from a U.S.-owned foreign corpo-ration may be included in this basket. A separateforeign tax credit limitation must be computed foreach amount re-sourced from a treaty country.
Interest-Charge Domestic International SalesCorporation (IC-DISC).--IC-DISC’s are certainsmall domestic corporations formed to export U.S.products. An IC-DISC can defer the tax liability of aportion of its income, but must ultimately pay thedeferred tax plus interest. Under the DISC provi-sions, a U.S. manufacturer could set up a DISC(located in the U.S.) whose income is not taxed atthe DISC level. Instead, the corporate shareholder istaxed directly on a portion of the DISC’s incomedeemed distributed. The portion of the income notdeemed distributed is not subject to any U.S. taxationuntil actually distributed. The U.S.’s foreign tradingpartners that are party to the General Agreement onTariffs and Trade (GATT) maintained the DISC
provisions constituted an illegal export trade subsidybecause they allowed indefinite deferral of directtaxes on income from exports earned in the U.S.Essentially, this pre-1985 system of tax deferral forexport income had been replaced by the exemptionsystem of foreign sales corporations (FSC’s). Toelect IC-DISC status, at least 95 percent of thecorporation’s gross receipts must be “qualified exportreceipts,” and at least 95 percent of its assets mustbe “qualified export assets.” Distributions from anIC-DISC are a separate limitation category.
Non-controlled section 902 corporation.--Anon-controlled foreign corporation, as defined inInternal Revenue Code section 902, is a foreigncorporation in which the U.S. corporation owns atleast 10 percent of the voting stock and the U.S.shareholders (i.e., those owning at least 10 percent ofthe voting stock), as a group, own 50 percent or lessof the stock measured by voting power or value.Sometimes, these foreign corporations are referred toas “10/50 companies.” Each non-controlled section902 corporation is treated separately. Taxpayers arerequired to place dividends from each corporationinto a separate basket to prevent averaging of high-taxed and low-taxed dividends from different non-controlled section 902 corporations.
OPEC Countries.--The members of the Organi-zation of Petroleum Exporting Countries (OPEC) for1997 were Algeria, Indonesia, Iran, Iraq, Kuwait,Libya, Nigeria, Qatar, Saudi Arabia, United ArabEmirates, and Venezuela.
Passive income.--This separate limitation cat-egory includes dividends, interest, rents, royalties,annuities, net capital gains, and commodity transac-tions. There are some important exceptions to theseinclusions. Rents and royalties derived in an activetrade or business from an unrelated person may notbe considered passive. Also, high-taxed passiveincome is excluded from the passive income basket.Specifically, interest subject to a high witholding tax isplaced in a separate basket. (See definition for highwithholding tax interest.) In addition, income thatby definition would have been classified as passiveyet is subject to a foreign tax rate exceeding thehighest applicable U.S. rate is removed from thepassive basket and placed in the General Limitationor Overall basket.
Section 901(j) income.--Internal Revenue Codesection 901(j) denies credit for taxes paid or accrued

119
Corporate Foreign Tax Credit, 1997
to certain foreign governments that the U.S. deemsineligible for the credit. Generally, these countriesinclude the following: (1) countries not recognized bythe U.S., (2) countries with which the U.S. hassevered or does not conduct diplomatic relations, or(3) countries identified by the U.S. as providingsupport for terrorism. For 1997, countries subject tothis restriction were Cuba, Iran, Iraq, Libya, NorthKorea, Sudan, and Syria. Although these taxes arenot creditable, income and deductions from InternalRevenue Code section 901(j) countries are reportedon Form 1118. A separate limitation credit is com-puted for informational purposes only and is notincluded in the foreign tax credit of the corporation.
Shipping income.--This statutory group appliesto a specific industry--shipping. Shipping incomeincludes the following: (1) all income from the use(or leasing for use) of a vessel or aircraft in foreigncommerce, (2) income from services directly relatedto the use of a vessel or aircraft, (3) gains on the saleor exchange of a vessel or aircraft used in the perfor-mance of such services, and (4) income generatedfrom other space and oceanic activities. Income thatwould be “foreign base company shipping income”for purposes of determining the income constructivelyreceived from Controlled Foreign Corporations, underInternal Revenue Code section 954(f), is also classi-fied as shipping income.
Soak-up taxes.--A soak-up tax is a tax liabilitythat depends upon the availability of a credit againstthe income tax liability to another country. In otherwords, a soak-up tax arises when a foreign taxwould not be imposed on the taxpayer unless a creditis available for the tax under the laws of anotherjurisdiction.
Specific economic benefit.--A foreign levy isnot considered a tax under U.S. regulations if theperson or corporation subject to the levy receives,either directly or indirectly, a specific economicbenefit from paying it.. Benefits include such itemsas property; services; fees and other payments; rightsto use, acquire or extract resources; patents or otherproperty owned or controlled by the foreign country;and reductions or discharge of contractual obliga-tions. The U.S. regulations determine this levy to bepayment for the specific economic benefit.
Specifically allocable income.--Internal Rev-enue Code section 863(b) provides special rules fordetermining taxable income from sources outside the
U.S. with respect to gross income derived partlywithin and partly outside the U.S. The income appor-tioned to sources outside the U.S. under these specialrules is commonly referred to as “Section 863(b)income” and is shown in column 25 of Table 1, andcolumn 11 of Tables 2 and 3.
Tax deemed paid .--See definition for Gross-up.Tax motivated stock acquisitions.--For divi-
dends paid more than 30 days after August 5, 1997,the Taxpayer Relief Act of 1997 (TRA 97) imposesa minimum holding period requirement with respect toclaiming a credit for foreign taxes associated withforeign-source dividends. This limitation is designedto prevent the transfer of foreign tax credits from ataxpayer that cannot use the credit (such as a tax-exempt organization) to one who can, simply bytransferring stock that generates foreign-sourceincome and creditable foreign taxes.
U.S. Person.--A U.S. person is any citizen orresident of the United States, domestic partnership,corporation, association, company, or any estate ortrust that is not considered “foreign.” See InternalRevenue Code section 7701 for more information onthe definition of a U.S. person.
Notes and References[1] See Ward, Nick, “Corporate Foreign Tax Credit,
1996: An Industry and Geographic Focus,”Statistics of Income Bulletin, Summer 2000,Volume 20, Number 1.
[2] Because income tax returns for FSC’s were notincluded in the sample used for the statistics, thisincome category is not included. However,distributions from FSC’s or former FSC’s arereported on the parent corporation’s return andare included in these statistics when provided bythe taxpayers. In this study, this particularstatutory category is used when corporationsreport an irregular separate category of incomethat cannot be redefined for one of the existingcategories of income.
[3] No foreign tax credit is allowed for foreign taxespaid to certain sanctioned countries. However,a foreign tax credit limitation is computed foreach such country. The sanctioned countriesfor 1997 are Cuba, Iran, Iraq, Libya, NorthKorea, Sudan, and Syria.

120
Corporate Foreign Tax Credit, 1997
120
[4] According to Internal Revenue Code section999, U.S. persons that participate or cooperatein international boycotts that are not sanctionedby U.S. law, regulation, or executive order arepenalized under the boycott provisions. Underthese boycott provisions, the penalty includes areduction of foreign tax credits, an increase inControlled Foreign Corporation’s taxable incomeunder Subpart F, and a reduction in ForeignSales Corporation (FSC) benefits and Interest-Charge Domestic International Sales Corpora-tions (IC-DISC) benefits, as applicable. Formore information on International Boycotts, seeDaly, Susan M., “International Boycott Reports,1997 and 1998,” Statistics of Income Bulletin,Winter 2000-2001, Volume 20, Number 3.
[5] U.S. corporations are subject to a graduated taxrate based on their taxable income per InternalRevenue Code section 11 and Internal RevenueCode section 1201. For 1997, the corporationtax rate was 15 percent on the first $50,000 oftaxable income, 25 percent on the next $25,000,34 percent on taxable income between $75,000and $10 million, and 35 percent on the excessover $10 million. However, a 5-percent tax wasimposed on taxable income between $100,000and $335,000 in order to phase out the benefit ofthe lower rates for high-income corporations;thus, the total marginal rate in this income rangeis 39 percent. Similarly, a 3-percent tax wasimposed on taxable income between $15 millionand $18.3 million resulting in a total marginalrate in this income range of 38 percent.
[6] U.S. corporations included in the SOI annualstudy vary from one year to the next. Theanalysis of the foreign tax credit over time is notbased on a panel of corporations. Therefore,“growth” may be due to several factors, includ-ing a different makeup of firms in each year.
[7] Current-year foreign taxes as a percentage offoreign-source taxable income should not beconstrued as a measure of the effective taxrate. An effective tax rate would contain a
measure of economic income in the denomina-tor and taxes on that income in the numerator.These percentages are simply a tool used tocompare the proportion of taxes to foreign-source taxable income in each statutory group.
[8] The majority of Netherlands-sourced taxableincome from non-manufacturing U.S. corpora-tions was from services.
[9] A U.S. corporation, which received actual orconstructive dividends from a related foreignsubsidiary, is allowed to include a portion of theforeign taxes paid by the subsidiary for pur-poses of determining the foreign tax credit.Under Internal Revenue Code section 902(a),the portion of foreign taxes deemed paid by aU.S. parent corporation equals the product ofthe foreign income taxes multiplied by the ratioof dividends to undistributed earnings. Thepurpose of this formula is to allocate a portionof the foreign income taxes paid by a foreignsubsidiary to the dividend distribution. The term“undistributed earnings” refers essentially to thecorporation’s earnings and profits accumulatedthrough the current year. The foreign taxes paidby the foreign subsidiary are considered to beindirectly, or deemed, paid by the related U.S.corporation.
[10] Four of these countries (Germany, Japan, theNetherlands, and the United Kingdom) wereincluded in the five largest countries in terms oftaxable income. Recall that the five largestcountries accounted for approximately 42.2percent of the total taxable income. More thanhalf of U.K.-sourced and Japan-sourcedtaxable income is from U.S. corporationsoperating through foreign branches in thesecountries. As expected, the industry composi-tion for these countries closely resembles theindustry composition of the foreign branchesoperating in these countries.
[11] Internal Revenue Service, Statistics of Income--1997, Corporation Income Tax Returns,Publication 16, Rev. 9-2000.
SOURCE: IRS, Statistics of Income Bulletin, Winter 2001-2002, Publication 1136 (Rev. 3-2002).

121
Corporate Foreign Tax Credit, 1997
Table 1.--U.S. Corporation Returns with a Foreign Tax Credit: Total Assets, Income, Tax, and Credits, and Foreign Income and Tax Reported on Form 1118, by Selected Industrial Group [All figures are estimates based on samples--money amounts are in thousands of dollars]
Foreign
Includable dividend
Dividends Dividends income of income
Major and selected minor industrial group Number of Total Total received from received from Controlled resulting from
returns assets receipts foreign IC-DISC's or Foreign foreign taxes
corporations former DISC's ¹ Corporations deemed paid
(gross-up)
(1) (2) (3) (4) (5) (6) (7)
All industries.....................................................................................................................6,569 14,263,224,845 5,311,659,824 39,398,674 116,806 26,163,328 29,036,369
Agriculture, forestry, and fishing.....................................................................................................................134 4,225,363 4,015,958 *38,435 -- *2,373 *21,531
Mining.....................................................................................................................133 73,651,052 33,600,411 585,646 -- 193,986 279,596 Metal mining..............................................................................................................9 *8,025,694 *3,886,090 *95,211 -- *7,629 *25,690 Coal mining..............................................................................................................5 *24,310,942 *4,930,022 *179,791 -- *11,154 *1,529 Oil and gas extraction..............................................................................................................112 35,455,594 19,867,239 288,674 -- 171,981 244,643 Nonmetallic minerals, except fuels..............................................................................................................8 *5,858,822 *4,917,061 *21,969 -- *3,222 *7,734
Construction.....................................................................................................................183 19,960,287 22,946,190 26,858 -- *15,711 *16,089 General building contractors..............................................................................................................92 6,877,597 16,698,443 *6,561 -- *8,086 *5,962 Heavy construction contractors..............................................................................................................39 11,941,741 4,004,597 *5,379 -- *7,625 *618 Special trade contractors..............................................................................................................51 1,140,950 2,243,150 *14,919 -- -- *9,509
Manufacturing.....................................................................................................................1,763 3,955,074,054 2,794,697,025 32,371,546 12,872 17,086,737 23,039,903 Food and kindred products..............................................................................................................83 291,962,500 185,153,297 3,912,886 *166 1,701,491 2,364,751 Tobacco manufactures..............................................................................................................5 *86,798,606 *55,761,730 *1,617,865 -- *793,640 *1,020,998 Textile mill products..............................................................................................................60 7,891,742 7,563,645 *46,070 -- *9,804 *25,154 Apparel and other textile products..............................................................................................................29 18,356,325 17,214,350 *219,282 *28 *170,869 *254,852 Lumber and wood products..............................................................................................................15 29,795,087 19,952,844 *50,566 -- *19,421 *35,560 Furniture and fixtures..............................................................................................................13 11,078,283 12,833,556 *44,045 -- *11,094 *22,043 Paper and allied products..............................................................................................................31 104,694,794 66,384,124 895,122 -- 272,165 521,364 Printing and publishing..............................................................................................................97 148,457,010 79,539,328 205,822 *22 48,726 157,886 Industrial plastics and synthetic material..............................................................................................................100 256,671,000 152,469,542 1,970,080 *5,260 1,120,520 1,352,440 Drugs..............................................................................................................53 208,241,502 126,313,930 4,702,171 *125 2,326,922 2,147,640 Other chemicals..............................................................................................................75 88,211,866 98,389,498 1,163,186 *767 744,798 1,084,617 Petroleum (including integrated) and coal products..............................................................................................................28 612,952,862 463,528,962 5,931,883 -- 1,513,861 3,395,084 Rubber and miscellaneous plastics products..............................................................................................................71 27,275,689 33,603,207 403,240 -- 141,314 358,362 Leather and leather products..............................................................................................................13 2,656,074 3,823,505 *690 -- *4,754 *2,005 Stone, clay, and glass products..............................................................................................................28 24,757,696 20,679,811 135,573 -- *19,930 84,332 Primary metal industries..............................................................................................................42 69,343,470 59,872,820 425,569 -- 176,352 310,314 Fabricated metal products..............................................................................................................192 69,544,707 60,810,423 528,288 *1,060 485,045 690,332 Office, computing, and accounting equipment..............................................................................................................29 91,396,346 107,297,923 3,545,730 -- 514,735 2,629,987 Other machinery, except electrical..............................................................................................................221 124,145,998 115,381,816 896,194 *3,279 638,873 642,226 Electrical and electronic equipment..............................................................................................................327 675,225,281 371,444,877 1,792,838 *802 2,861,445 2,336,637 Motor vehicles and equipment..............................................................................................................27 696,308,021 450,630,068 2,196,450 -- 2,182,373 1,989,821 Transportation equipment, except motor vehicles..............................................................................................................37 162,371,792 153,396,735 541,000 -- *294,876 397,281 Instruments and related products..............................................................................................................99 120,402,007 106,077,496 1,002,676 *322 914,587 1,067,292 Miscellaneous manufacturing and manufacturing not allocable..............................................................................................................87 26,535,396 26,573,536 144,317 *1,041 119,143 148,926
Transportation and public utilities.....................................................................................................................159 669,825,450 356,767,998 1,100,518 -- 512,233 585,820 Transportation..............................................................................................................88 151,504,474 115,205,317 88,844 -- 186,214 88,808 Water transportation.........................................................................................................36 6,235,570 5,723,969 *4,495 -- *47,977 *13,417 All other transportation.........................................................................................................52 145,268,904 109,481,348 84,349 -- 138,236 75,391 Communication..............................................................................................................17 328,346,936 166,316,586 557,380 -- 113,288 *322,130 Electric, gas, and sanitary services..............................................................................................................54 189,974,039 75,246,095 454,293 -- 212,731 174,882 Footnotes at end of table.
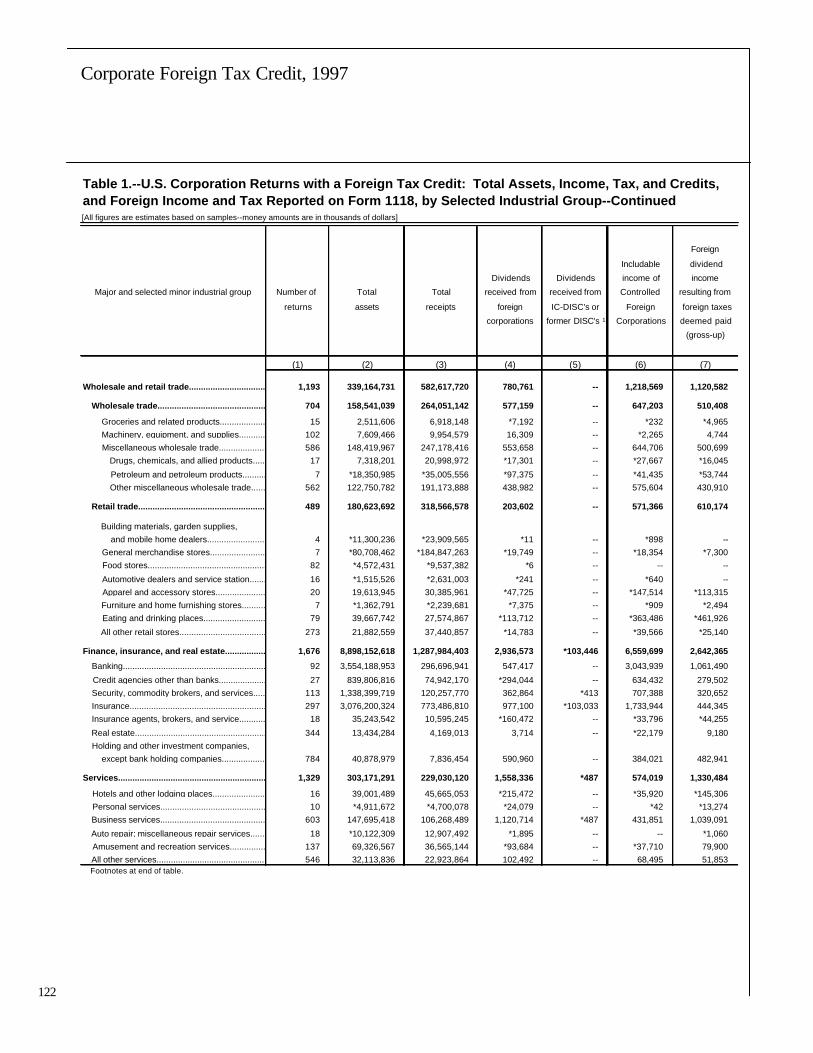
122
Corporate Foreign Tax Credit, 1997
122
Table 1.--U.S. Corporation Returns with a Foreign Tax Credit: Total Assets, Income, Tax, and Credits, and Foreign Income and Tax Reported on Form 1118, by Selected Industrial Group--Continued [All figures are estimates based on samples--money amounts are in thousands of dollars]
Foreign
Includable dividend
Dividends Dividends income of income
Major and selected minor industrial group Number of Total Total received from received from Controlled resulting from
returns assets receipts foreign IC-DISC's or Foreign foreign taxes
corporations former DISC's ¹ Corporations deemed paid
(gross-up)
(1) (2) (3) (4) (5) (6) (7)
Wholesale and retail trade.....................................................................................................................1,193 339,164,731 582,617,720 780,761 -- 1,218,569 1,120,582
Wholesale trade..............................................................................................................704 158,541,039 264,051,142 577,159 -- 647,203 510,408
Groceries and related products.....................................................................................................15 2,511,606 6,918,148 *7,192 -- *232 *4,965 Machinery, equipment, and supplies.....................................................................................................102 7,609,466 9,954,579 16,309 -- *2,265 4,744 Miscellaneous wholesale trade.....................................................................................................586 148,419,967 247,178,416 553,658 -- 644,706 500,699 Drugs, chemicals, and allied products...................................................................................................17 7,318,201 20,998,972 *17,301 -- *27,667 *16,045
Petroleum and petroleum products...................................................................................................7 *18,350,985 *35,005,556 *97,375 -- *41,435 *53,744 Other miscellaneous wholesale trade...................................................................................................562 122,750,782 191,173,888 438,982 -- 575,604 430,910
Retail trade..............................................................................................................489 180,623,692 318,566,578 203,602 -- 571,366 610,174
Building materials, garden supplies, and mobile home dealers...................................................................................................4 *11,300,236 *23,909,565 *11 -- *898 -- General merchandise stores...................................................................................................7 *80,708,462 *184,847,263 *19,749 -- *18,354 *7,300 Food stores...................................................................................................82 *4,572,431 *9,537,382 *6 -- -- --
Automotive dealers and service station...................................................................................................16 *1,515,526 *2,631,003 *241 -- *640 -- Apparel and accessory stores...................................................................................................20 19,613,945 30,385,961 *47,725 -- *147,514 *113,315 Furniture and home furnishing stores...................................................................................................7 *1,362,791 *2,239,681 *7,375 -- *909 *2,494 Eating and drinking places...................................................................................................79 39,667,742 27,574,867 *113,712 -- *363,486 *461,926
All other retail stores...................................................................................................273 21,882,559 37,440,857 *14,783 -- *39,566 *25,140
Finance, insurance, and real estate.....................................................................................................................1,676 8,898,152,618 1,287,984,403 2,936,573 *103,446 6,559,699 2,642,365
Banking..............................................................................................................92 3,554,188,953 296,696,941 547,417 -- 3,043,939 1,061,490
Credit agencies other than banks..............................................................................................................27 839,806,816 74,942,170 *294,044 -- 634,432 279,502 Security, commodity brokers, and services..............................................................................................................113 1,338,399,719 120,257,770 362,864 *413 707,388 320,652 Insurance..............................................................................................................297 3,076,200,324 773,486,810 977,100 *103,033 1,733,944 444,345 Insurance agents, brokers, and service..............................................................................................................18 35,243,542 10,595,245 *160,472 -- *33,796 *44,255
Real estate..............................................................................................................344 13,434,284 4,169,013 3,714 -- *22,179 9,180 Holding and other investment companies, except bank holding companies..............................................................................................................784 40,878,979 7,836,454 590,960 -- 384,021 482,941
Services.....................................................................................................................1,329 303,171,291 229,030,120 1,558,336 *487 574,019 1,330,484
Hotels and other lodging places..............................................................................................................16 39,001,489 45,665,053 *215,472 -- *35,920 *145,306 Personal services..............................................................................................................10 *4,911,672 *4,700,078 *24,079 -- *42 *13,274 Business services..............................................................................................................603 147,695,418 106,268,489 1,120,714 *487 431,851 1,039,091
Auto repair; miscellaneous repair services..............................................................................................................18 *10,122,309 12,907,492 *1,895 -- -- *1,060 Amusement and recreation services..............................................................................................................137 69,326,567 36,565,144 *93,684 -- *37,710 79,900 All other services..............................................................................................................546 32,113,836 22,923,864 102,492 -- 68,495 51,853 Footnotes at end of table.

123
Corporate Foreign Tax Credit, 1997
Table 1.--U.S. Corporation Returns with a Foreign Tax Credit: Total Assets, Income, Tax, and Credits, and Foreign Income and Tax Reported on Form 1118, by Selected Industrial Group--Continued [All figures are estimates based on samples--money amounts are in thousands of dollars]
U.S. income tax
before credits
Income
Major and selected minor industrial group Net income subject to Regular and Foreign tax U.S. General U.S. income
(less deficit) U.S. tax Total alternative credit possessions business tax after
minimum claimed tax credit credit credits ²
tax
(8) (9) (10) (11) (12) (13) (14) (15)
All industries.....................................................................................................................432,320,036 410,126,303 144,779,411 144,767,666 42,222,743 146,440 3,548,009 95,787,290
Agriculture, forestry, and fishing.....................................................................................................................472,180 443,557 154,284 154,284 34,696 -- *7,172 110,854
Mining.....................................................................................................................5,500,935 4,928,538 1,756,666 1,756,187 906,954 -- 14,700 767,253 Metal mining..............................................................................................................*540,859 *522,293 *194,015 *194,015 *166,282 -- -- *27,060 Coal mining..............................................................................................................*503,162 *500,781 *175,178 *175,178 *94,155 -- *42 *66,554 Oil and gas extraction..............................................................................................................3,955,653 3,421,372 1,215,068 1,214,590 637,691 -- 12,181 521,611 Nonmetallic minerals, except fuels..............................................................................................................*501,260 *484,091 *172,404 *172,404 *8,826 -- *2,477 *152,028
Construction.....................................................................................................................962,188 904,900 319,265 316,158 44,412 -- *8,435 266,016 General building contractors..............................................................................................................352,012 304,354 108,052 107,437 19,511 -- *8,221 79,917 Heavy construction contractors..............................................................................................................465,556 463,558 163,416 161,619 14,083 -- *213 149,120 Special trade contractors..............................................................................................................144,620 136,988 47,797 47,103 10,817 -- *1 36,979
Manufacturing.....................................................................................................................231,445,833 217,289,154 76,694,471 76,689,694 30,299,210 145,433 2,268,555 42,395,173 Food and kindred products..............................................................................................................15,598,040 14,708,990 5,205,414 5,203,843 2,801,304 *1,687 66,929 2,306,084 Tobacco manufactures..............................................................................................................*9,926,981 *9,531,635 *3,335,972 *3,335,972 *1,302,880 -- *26,481 *1,996,103 Textile mill products..............................................................................................................464,611 453,571 158,242 158,242 26,532 -- *6,205 125,048 Apparel and other textile products..............................................................................................................2,196,571 2,190,311 767,940 767,940 266,279 *17,291 *2,524 481,634 Lumber and wood products..............................................................................................................713,321 690,960 244,822 251,376 40,342 -- *1,042 196,202 Furniture and fixtures..............................................................................................................1,021,869 1,011,446 353,841 353,841 22,761 -- *4,411 326,058 Paper and allied products..............................................................................................................5,890,290 5,693,977 2,040,861 2,040,837 664,059 *2,154 47,050 1,316,682 Printing and publishing..............................................................................................................8,584,473 8,193,110 2,867,128 2,867,177 288,130 *408 58,228 2,507,107 Industrial plastics and synthetic material..............................................................................................................14,586,044 13,318,832 4,687,617 4,687,617 1,647,569 -- 90,037 2,743,397 Drugs..............................................................................................................16,087,449 14,156,181 5,011,193 5,011,193 2,202,041 *117,158 275,325 2,357,662 Other chemicals..............................................................................................................10,618,236 10,379,679 3,646,416 3,646,416 1,321,594 *1,611 82,607 2,239,988 Petroleum (including integrated) and coal products..............................................................................................................35,010,444 34,251,734 12,006,024 12,006,279 6,748,403 *221 322,110 3,944,902 Rubber and miscellaneous plastics products..............................................................................................................2,851,237 2,529,530 932,101 931,094 402,316 *778 25,441 491,613 Leather and leather products..............................................................................................................232,216 226,753 78,695 78,695 11,724 -- *735 66,235 Stone, clay, and glass products..............................................................................................................2,141,532 1,925,772 681,784 681,775 101,193 -- 25,302 544,744 Primary metal industries..............................................................................................................4,259,678 3,876,006 1,379,623 1,385,009 421,868 -- 7,492 886,419 Fabricated metal products..............................................................................................................6,871,096 6,567,563 2,301,922 2,302,977 694,974 *9 35,270 1,553,143 Office, computing, and accounting equipment..............................................................................................................12,652,628 12,467,999 4,489,836 4,489,836 3,150,955 -- 90,825 1,242,658 Other machinery, except electrical..............................................................................................................9,764,431 9,298,547 3,262,793 3,261,089 854,506 *236 105,219 2,275,217 Electrical and electronic equipment..............................................................................................................37,074,391 32,801,097 11,533,239 11,531,064 2,962,524 -- 597,501 7,923,717 Motor vehicles and equipment..............................................................................................................14,972,935 14,584,725 5,149,323 5,148,598 2,380,504 -- 173,533 2,588,190 Transportation equipment, except motor vehicles..............................................................................................................8,225,037 7,633,872 2,675,815 2,671,974 517,204 -- 110,079 2,002,940 Instruments and related products..............................................................................................................9,042,921 8,310,400 3,014,366 3,006,188 1,292,349 *3,878 88,749 1,622,324 Miscellaneous manufacturing and manufacturing not allocable..............................................................................................................2,659,399 2,486,462 869,504 870,661 177,199 -- 25,463 657,107
Transportation and public utilities.....................................................................................................................36,544,490 34,495,220 12,348,590 12,353,898 802,644 -- 245,999 10,865,454 Transportation..............................................................................................................7,085,504 5,322,916 2,151,865 2,151,825 187,641 -- 16,599 1,709,341 Water transportation.........................................................................................................786,138 759,474 269,228 269,225 27,947 -- *733 236,227 All other transportation.........................................................................................................6,299,367 4,563,441 1,882,637 1,882,600 159,694 -- 15,865 1,473,114 Communication..............................................................................................................19,925,850 19,742,996 6,885,103 6,890,788 451,925 -- 198,601 6,135,206 Electric, gas, and sanitary services..............................................................................................................9,533,136 9,429,308 3,311,623 3,311,285 163,078 -- 30,799 3,020,908 Footnotes at end of table.

124
Corporate Foreign Tax Credit, 1997
124
Table 1.--U.S. Corporation Returns with a Foreign Tax Credit: Total Assets, Income, Tax, and Credits, and Foreign Income and Tax Reported on Form 1118, by Selected Industrial Group--Continued [All figures are estimates based on samples--money amounts are in thousands of dollars]
U.S. income tax
before credits
Income
Major and selected minor industrial group Net income subject to Regular and Foreign tax U.S. General U.S. income
(less deficit) U.S. tax Total alternative credit possessions business tax after
minimum claimed tax credit credit credits ²
tax
(8) (9) (10) (11) (12) (13) (14) (15)
Wholesale and retail trade.....................................................................................................................26,114,386 25,492,725 8,987,993 8,985,680 1,383,247 -- 87,112 7,442,207
Wholesale trade..............................................................................................................8,902,140 8,419,564 3,013,051 3,012,306 686,471 -- 23,320 2,243,343
Groceries and related products.....................................................................................................306,665 301,656 105,210 105,210 5,902 -- -- 97,621 Machinery, equipment, and supplies.....................................................................................................582,467 536,848 188,020 188,015 9,877 -- *809 172,522 Miscellaneous wholesale trade.....................................................................................................8,013,009 7,581,059 2,719,821 2,719,081 670,692 -- 22,510 1,973,201 Drugs, chemicals, and allied products...................................................................................................424,384 420,846 184,551 184,580 88,289 -- *2,384 92,083
Petroleum and petroleum products...................................................................................................*690,872 *662,784 *231,768 *231,768 *98,437 -- *10,145 *91,295 Other miscellaneous wholesale trade...................................................................................................6,897,752 6,497,430 2,303,502 2,302,734 483,966 -- 9,981 1,789,822
Retail trade..............................................................................................................17,212,245 17,073,161 5,974,941 5,973,374 696,776 -- 63,793 5,198,864
Building materials, garden supplies, and mobile home dealers...................................................................................................*1,701,875 *1,701,413 *595,469 *595,469 *1,835 -- *451 *593,183 General merchandise stores...................................................................................................*7,794,366 *7,743,161 *2,710,699 *2,710,417 *24,769 -- *15,643 *2,670,287 Food stores...................................................................................................*282,722 *282,432 *98,716 *98,716 *6,661 -- *1,335 *90,720
Automotive dealers and service station...................................................................................................*95,270 *94,813 *32,953 *32,953 *129 -- *5,139 *14,713 Apparel and accessory stores...................................................................................................2,325,346 2,306,402 808,322 808,322 79,494 -- *1,101 727,727 Furniture and home furnishing stores...................................................................................................*128,828 *123,755 *43,072 *43,072 *3,552 -- *354 *39,165 Eating and drinking places...................................................................................................3,128,952 3,089,959 1,082,399 1,081,114 528,482 -- 31,916 520,153
All other retail stores...................................................................................................1,754,886 1,731,226 603,310 603,309 51,854 -- *7,853 542,914
Finance, insurance, and real estate.....................................................................................................................108,014,750 104,400,301 36,747,145 36,741,714 6,654,591 *31 525,692 28,684,700
Banking..............................................................................................................37,143,609 36,532,504 12,757,974 12,757,921 3,337,311 -- 281,570 9,110,182
Credit agencies other than banks..............................................................................................................6,748,939 6,572,415 2,300,161 2,299,871 457,527 -- *30,680 1,789,485 Security, commodity brokers, and services..............................................................................................................12,566,309 12,102,087 4,232,201 4,233,899 765,424 -- 31,849 3,365,430 Insurance..............................................................................................................45,361,782 43,037,841 15,296,430 15,290,783 1,552,984 *31 169,659 12,835,673 Insurance agents, brokers, and service..............................................................................................................1,741,357 1,929,969 675,117 675,117 50,162 -- *6,648 616,521
Real estate..............................................................................................................614,551 555,055 201,049 201,049 9,759 -- *626 178,398 Holding and other investment companies, except bank holding companies..............................................................................................................3,838,203 3,670,430 1,284,212 1,283,073 481,423 -- *4,660 789,010
Services.....................................................................................................................23,265,274 22,171,907 7,770,999 7,770,053 2,096,990 *976 390,344 5,255,633
Hotels and other lodging places..............................................................................................................2,192,769 2,090,256 733,791 733,644 177,348 *976 *36,141 514,725 Personal services..............................................................................................................*447,064 *444,511 *155,379 *155,379 *14,819 -- *1,002 *138,598 Business services..............................................................................................................14,596,239 13,808,738 4,850,636 4,850,144 1,601,492 -- 312,273 2,925,825
Auto repair; miscellaneous repair services..............................................................................................................465,363 451,629 157,784 157,702 1,322 -- *676 155,786 Amusement and recreation services..............................................................................................................4,156,090 3,950,605 1,380,888 1,380,888 204,541 -- *24,706 1,142,071 All other services..............................................................................................................1,407,749 1,426,169 492,521 492,295 97,468 -- 15,547 378,629 Footnotes at end of table.

125
Corporate Foreign Tax Credit, 1997
Table 1.--U.S. Corporation Returns with a Foreign Tax Credit: Total Assets, Income, Tax, and Credits, and Foreign Income and Tax Reported on Form 1118, by Selected Industrial Group--Continued [All figures are estimates based on samples--money amounts are in thousands of dollars]
Foreign income and taxes reported on Form 1118
Gross income (less loss)
Foreign
dividend
Major and selected minor industrial group income Rents,
Total Dividends resulting from Interest royalties, Service Other
foreign taxes and income income
deemed paid license fees
(gross-up)
(16) (17) (18) (19) (20) (21) (22)
All industries.....................................................................................................................359,898,600 68,480,746 29,020,456 61,505,751 48,610,292 31,387,624 120,893,731
Agriculture, forestry, and fishing.....................................................................................................................238,033 54,572 *21,774 *19,744 *14,007 -- *127,936
Mining.....................................................................................................................8,292,326 769,336 279,548 221,170 310,547 3,073,644 3,638,080 Metal mining..............................................................................................................*1,842,738 *102,841 *25,690 *58,968 *5,255 *216,428 *1,433,557 Coal mining..............................................................................................................*882,770 *188,394 *1,529 *58,789 *32,068 *-5,239 *607,229 Oil and gas extraction..............................................................................................................5,508,205 452,910 244,644 92,837 271,660 2,861,612 1,584,542 Nonmetallic minerals, except fuels..............................................................................................................*58,613 *25,191 *7,686 *10,576 *1,564 *843 *12,752
Construction.....................................................................................................................449,484 85,149 *16,088 *9,344 23,555 195,865 119,483 General building contractors..............................................................................................................217,131 *57,205 *5,962 *4,151 *12,720 *116,958 *20,136 Heavy construction contractors..............................................................................................................135,803 *13,019 *618 *3,540 *2,978 *58,228 *57,420 Special trade contractors..............................................................................................................96,550 *14,925 *9,509 *1,653 *7,857 *20,680 *41,927
Manufacturing.....................................................................................................................188,632,881 52,156,799 23,031,191 8,366,129 33,953,415 3,733,558 67,391,789 Food and kindred products..............................................................................................................13,689,338 5,725,052 2,363,100 242,803 2,054,826 *197,065 3,106,492 Tobacco manufactures..............................................................................................................*6,301,840 *2,409,557 *1,020,175 *70,454 *1,016,244 *7,054 *1,778,356 Textile mill products..............................................................................................................134,199 *55,839 *25,154 *3,535 *17,548 *594 *31,529 Apparel and other textile products..............................................................................................................1,072,953 *389,563 *254,620 *7,410 320,759 *11,058 *89,542 Lumber and wood products..............................................................................................................216,099 *68,009 *35,533 *38,249 *11,653 *150 *62,506 Furniture and fixtures..............................................................................................................183,348 *54,589 *22,043 *8,896 15,133 *9,974 *72,711 Paper and allied products..............................................................................................................3,343,913 1,302,738 521,416 73,976 533,801 *57,331 854,652 Printing and publishing..............................................................................................................4,916,174 257,955 158,002 37,208 2,421,093 54,105 1,987,810 Industrial plastics and synthetic material..............................................................................................................11,448,415 3,568,707 1,350,852 414,493 1,773,306 354,457 3,986,600 Drugs..............................................................................................................16,247,439 6,852,075 2,147,856 253,898 2,784,874 *92,065 4,116,672 Other chemicals..............................................................................................................6,940,225 1,912,289 1,084,618 116,757 1,717,717 33,956 2,074,888 Petroleum (including integrated) and coal products..............................................................................................................34,726,319 7,444,356 3,395,725 3,661,334 687,722 *135,735 19,401,447 Rubber and miscellaneous plastics products..............................................................................................................1,914,920 547,831 358,333 51,422 439,837 *1,406 516,091 Leather and leather products..............................................................................................................137,581 *8,431 *2,005 *4,918 58,924 *12,587 *50,716 Stone, clay, and glass products..............................................................................................................702,088 221,602 84,332 30,230 147,743 *44,539 173,642 Primary metal industries..............................................................................................................2,389,004 635,810 310,309 114,964 151,540 *19,440 1,156,941 Fabricated metal products..............................................................................................................3,448,092 1,019,606 694,109 154,931 337,368 63,442 1,178,637 Office, computing, and accounting equipment..............................................................................................................17,124,711 4,104,545 2,629,650 165,280 7,189,193 *304,791 2,731,252 Other machinery, except electrical..............................................................................................................7,450,265 1,607,925 642,113 376,011 705,574 141,730 3,976,912 Electrical and electronic equipment..............................................................................................................27,323,241 5,844,142 2,336,386 1,354,714 5,139,642 555,468 12,092,889 Motor vehicles and equipment..............................................................................................................13,028,265 4,355,007 1,981,592 453,655 2,215,662 *540,803 3,481,547 Transportation equipment, except motor vehicles..............................................................................................................4,695,527 1,064,354 397,281 471,914 651,303 747,740 1,362,935 Instruments and related products..............................................................................................................9,976,595 2,423,756 1,067,059 243,554 3,165,308 326,712 2,750,206 Miscellaneous manufacturing and manufacturing not allocable..............................................................................................................1,222,332 283,062 148,927 15,524 396,647 21,357 356,815
Transportation and public utilities.....................................................................................................................22,221,685 1,606,457 585,276 320,490 426,902 9,220,380 10,062,180 Transportation..............................................................................................................13,704,989 271,889 88,808 43,022 83,274 8,925,407 4,292,590 Water transportation.........................................................................................................320,690 *52,469 *13,417 *549 *31 *219,255 *34,968 All other transportation.........................................................................................................13,384,299 219,420 75,391 42,473 83,242 8,706,151 4,257,621 Communication..............................................................................................................7,261,024 671,676 *322,130 *192,035 *287,698 *196,704 *5,590,781 Electric, gas, and sanitary services..............................................................................................................1,255,671 662,892 174,338 85,434 *55,931 98,269 178,808 Footnotes at end of table.

126
Corporate Foreign Tax Credit, 1997
126
Table 1.--U.S. Corporation Returns with a Foreign Tax Credit: Total Assets, Income, Tax, and Credits, and Foreign Income and Tax Reported on Form 1118, by Selected Industrial Group--Continued [All figures are estimates based on samples--money amounts are in thousands of dollars]
Foreign income and taxes reported on Form 1118
Gross income (less loss)
Foreign
dividend
Major and selected minor industrial group income Rents,
Total Dividends resulting from Interest royalties, Service Other
foreign taxes and income income
deemed paid license fees
(gross-up)
(16) (17) (18) (19) (20) (21) (22)
Wholesale and retail trade.....................................................................................................................13,921,240 1,997,340 1,121,448 2,054,128 1,450,456 414,872 6,882,996
Wholesale trade..............................................................................................................9,486,444 1,224,310 510,674 1,848,267 424,144 148,570 5,330,479
Groceries and related products.....................................................................................................61,489 *7,424 *4,965 *1,437 *1,795 *2,319 *43,550 Machinery, equipment, and supplies.....................................................................................................235,439 18,574 4,744 3,334 *13,237 *4,627 190,922 Miscellaneous wholesale trade.....................................................................................................9,189,516 1,198,312 500,965 1,843,497 409,112 141,623 5,096,007 Drugs, chemicals, and allied products...................................................................................................1,102,131 *44,931 *16,312 *5,516 *3,907 *18,212 *1,013,252
Petroleum and petroleum products...................................................................................................*2,164,090 *137,794 *53,744 *1,468,833 *10,665 *709 *492,346 Other miscellaneous wholesale trade...................................................................................................5,923,295 1,015,587 430,909 369,147 394,539 122,703 3,590,409
Retail trade..............................................................................................................4,434,796 773,030 610,774 205,860 1,026,312 266,303 1,552,517
Building materials, garden supplies, and mobile home dealers...................................................................................................*10,428 *11 -- -- *10,418 -- -- General merchandise stores...................................................................................................*452,001 *38,139 *7,300 *21,818 *103,710 *187,127 *93,907 Food stores...................................................................................................*77,019 *23 -- *5,821 *71,121 -- *53
Automotive dealers and service station...................................................................................................*1,169 *241 -- *591 *91 *47 *198 Apparel and accessory stores...................................................................................................435,712 *194,739 *113,315 *4,337 *54,279 -- *69,042 Furniture and home furnishing stores...................................................................................................*27,945 *8,284 *2,494 *195 *11,367 -- *5,606 Eating and drinking places...................................................................................................2,839,366 *477,165 *462,507 *152,079 662,263 *6,040 1,079,313
All other retail stores...................................................................................................591,155 54,428 *25,159 21,019 113,063 *73,089 304,397
Finance, insurance, and real estate.....................................................................................................................102,621,003 9,539,627 2,636,478 49,935,328 1,923,139 9,976,238 28,610,193
Banking..............................................................................................................52,894,722 3,648,589 1,055,611 31,926,026 1,217,318 *1,933,550 13,113,629
Credit agencies other than banks..............................................................................................................8,858,262 947,618 279,502 2,388,198 *118,648 *30,821 5,093,475 Security, commodity brokers, and services..............................................................................................................13,336,865 1,065,400 320,652 8,325,109 *21,833 398,894 3,204,977 Insurance..............................................................................................................24,599,962 2,685,225 444,350 6,866,178 510,999 7,236,052 6,857,159 Insurance agents, brokers, and service..............................................................................................................448,845 *193,598 *44,255 *15,483 -- *187,313 *8,196
Real estate..............................................................................................................71,603 26,037 9,180 11,073 *14,708 *4,899 *5,706 Holding and other investment companies, except bank holding companies..............................................................................................................2,410,746 973,161 482,929 403,262 *39,633 *184,710 327,051
Services.....................................................................................................................23,521,948 2,271,466 1,328,651 579,418 10,508,272 4,773,067 4,061,074
Hotels and other lodging places..............................................................................................................1,494,584 *251,427 *144,531 96,072 *361,875 *76,766 *563,913 Personal services..............................................................................................................*183,347 *24,122 *13,274 *2,873 *8,616 *132,621 *1,842 Business services..............................................................................................................15,820,544 1,542,152 1,038,858 287,651 7,015,616 2,882,667 3,053,601
Auto repair; miscellaneous repair services..............................................................................................................11,023 *1,897 *1,060 *861 *5,613 *917 *675 Amusement and recreation services..............................................................................................................4,131,202 280,102 79,132 *188,204 2,830,579 *575,038 178,147 All other services..............................................................................................................1,881,249 171,767 51,796 3,757 285,974 1,105,059 262,897 Footnotes at end of table.

127
Corporate Foreign Tax Credit, 1997
Table 1.--U.S. Corporation Returns with a Foreign Tax Credit: Total Assets, Income, Tax, and Credits, and Foreign Income and Tax Reported on Form 1118, by Selected Industrial Group--Continued [All figures are estimates based on samples--money amounts are in thousands of dollars]
Foreign income and taxes reported on Form 1118--Continued
Deductions
Deductions allocable to specific types of income
Oil and gas Specifically Rental, royalty, and
Major and selected minor industrial group extraction Foreign allocable licensing expenses
income branch income Total Depreciation, Service
(less loss) ³ income ³ [section Total depletion, expenses
863(b)] ³ and Other
amortization
(23) (24) (25) (26) (27) (28) (29) (30)
All industries.....................................................................................................................21,013,968 88,607,770 24,971,121 201,909,309 107,480,799 1,257,812 7,358,799 13,663,474
Agriculture, forestry, and fishing.....................................................................................................................-- *673 *92,236 *98,061 *59,042 -- *521 --
Mining.....................................................................................................................2,037,440 3,126,813 *378,536 5,133,029 4,199,314 117,568 66,502 1,266,808 Metal mining..............................................................................................................-- *182,890 -- *1,354,276 *1,013,529 *874 *933 *1,063 Coal mining..............................................................................................................-- *173,008 -- *575,397 *548,549 *13,438 *5,882 -- Oil and gas extraction..............................................................................................................2,037,440 2,765,767 *354,548 3,186,103 2,630,430 103,257 59,687 1,261,520 Nonmetallic minerals, except fuels..............................................................................................................-- *5,146 *23,989 *17,253 *6,806 -- -- *4,225
Construction.....................................................................................................................-- *83,784 *40,924 294,026 228,015 *349 *1,281 131,860 General building contractors..............................................................................................................-- *27,218 *40,924 150,124 119,147 *150 *508 *74,977 Heavy construction contractors..............................................................................................................-- *38,583 -- *91,323 *61,372 - *460 *43,766 Special trade contractors..............................................................................................................-- *17,982 -- *52,579 *47,496 *200 *313 *13,117
Manufacturing.....................................................................................................................18,743,589 27,638,925 17,567,896 85,811,444 48,178,233 298,396 3,113,488 2,125,735 Food and kindred products..............................................................................................................-- 1,531,208 517,916 4,632,143 2,513,109 *1,271 *786,114 *1,867 Tobacco manufactures..............................................................................................................-- *1,068,525 *718,717 *2,464,893 *1,680,497 -- *37,383 -- Textile mill products..............................................................................................................-- *904 *30,789 47,970 *26,657 -- -- *301 Apparel and other textile products..............................................................................................................-- *52,217 *10,788 *210,758 *108,597 *71 *9,729 *1,956 Lumber and wood products..............................................................................................................-- *12,452 *2,983 76,157 *36,416 -- -- -- Furniture and fixtures..............................................................................................................-- *29,775 *33,952 *106,435 *71,617 *216 *2,918 *1,944 Paper and allied products..............................................................................................................-- *26,739 474,619 1,299,730 472,386 *620 *19,947 *56,472 Printing and publishing..............................................................................................................-- *314,801 *61,357 3,366,082 1,823,944 *2,892 350,370 *35,935 Industrial plastics and synthetic material..............................................................................................................*1,394,900 1,828,270 1,632,453 5,640,689 3,132,183 *4,827 18,085 *170,175 Drugs..............................................................................................................-- 1,414,540 1,449,375 8,454,539 5,624,402 *8 *769,599 *19,115 Other chemicals..............................................................................................................-- 1,298,847 552,709 2,895,692 1,690,790 *354 *2,144 *10,268 Petroleum (including integrated) and coal products..............................................................................................................17,348,689 *14,093,770 *190,579 14,924,911 12,667,712 *8,536 *147,312 *234,590 Rubber and miscellaneous plastics products..............................................................................................................-- 97,681 50,542 704,508 436,016 *3,758 *6,524 *333 Leather and leather products..............................................................................................................-- *853 *4,365 *63,404 *14,037 -- *1,187 *371 Stone, clay, and glass products..............................................................................................................-- *53,447 *135,532 387,642 171,408 *16 *1,104 *41,425 Primary metal industries..............................................................................................................-- 724,469 116,468 1,059,985 501,595 *159,211 *65,016 -- Fabricated metal products..............................................................................................................-- 140,547 334,411 1,241,234 646,658 *2,466 *11,173 *49,644 Office, computing, and accounting equipment..............................................................................................................-- *1,506,613 *836,332 6,700,626 2,153,977 *1,333 *2,936 *1,945 Other machinery, except electrical..............................................................................................................-- 789,711 919,857 4,144,570 1,990,970 *662 61,786 185,236 Electrical and electronic equipment..............................................................................................................-- 819,692 5,655,989 13,893,037 7,179,468 *796 260,198 206,656 Motor vehicles and equipment..............................................................................................................-- *998,434 1,053,508 5,298,138 1,344,068 *1,241 *305,446 *532,719 Transportation equipment, except motor vehicles..............................................................................................................-- *367,002 464,594 2,560,215 2,073,629 *103,305 *82,546 *557,084 Instruments and related products..............................................................................................................-- 358,610 2,117,560 5,063,276 1,531,697 *1,302 *67,996 *13,245 Miscellaneous manufacturing and manufacturing not allocable..............................................................................................................-- 109,819 202,503 574,811 286,404 *5,512 *103,974 *4,457
Transportation and public utilities.....................................................................................................................*41,616 4,476,116 2,615,529 16,849,056 14,832,180 33,657 60,222 5,797,057 Transportation..............................................................................................................-- *4,084,653 *2,516,237 11,584,803 10,940,760 *1,848 *5,542 5,548,311 Water transportation.........................................................................................................-- -- *23,532 *115,069 *98,127 *409 *3,207 *93,256 All other transportation.........................................................................................................-- *4,084,653 *2,492,704 11,469,734 10,842,633 *1,439 *2,336 5,455,055 Communication..............................................................................................................-- *292,337 *13,515 4,656,524 3,663,007 *1 *54,668 *184,200 Electric, gas, and sanitary services..............................................................................................................*41,616 *99,126 *85,777 607,729 228,414 *31,808 *12 *64,546 Footnotes at end of table.

128
Corporate Foreign Tax Credit, 1997
128
Table 1.--U.S. Corporation Returns with a Foreign Tax Credit: Total Assets, Income, Tax, and Credits, and Foreign Income and Tax Reported on Form 1118, by Selected Industrial Group--Continued [All figures are estimates based on samples--money amounts are in thousands of dollars]
Foreign income and taxes reported on Form 1118--Continued
Deductions
Deductions allocable to specific types of income
Oil and gas Specifically Rental, royalty, and
Major and selected minor industrial group extraction Foreign allocable licensing expenses
income branch income Total Depreciation, Service
(less loss) ³ income ³ [section Total depletion, expenses
863(b)] ³ and Other
amortization
(23) (24) (25) (26) (27) (28) (29) (30)
Wholesale and retail trade.....................................................................................................................*21,791 2,983,585 196,739 8,143,471 5,880,777 8,652 315,244 159,090
Wholesale trade..............................................................................................................*21,791 1,704,490 180,946 6,187,407 4,461,434 7,091 181,708 59,965
Groceries and related products.....................................................................................................-- *37,787 -- *41,000 *39,659 *161 *951 *2,085 Machinery, equipment, and supplies.....................................................................................................-- *44,084 *5,784 158,239 100,781 *5,576 *10,312 *1,489 Miscellaneous wholesale trade.....................................................................................................*21,791 1,622,619 175,162 5,988,168 4,320,995 *1,353 170,445 56,391 Drugs, chemicals, and allied products...................................................................................................-- *903,109 *56,465 810,817 791,439 -- -- *17,228
Petroleum and petroleum products...................................................................................................*21,791 *272,400 -- *1,402,555 *568,747 -- -- -- Other miscellaneous wholesale trade...................................................................................................-- 447,110 118,696 3,774,796 2,960,808 *1,353 170,445 39,163
Retail trade..............................................................................................................-- 1,279,096 *15,792 1,956,063 1,419,342 *1,561 133,536 *99,125
Building materials, garden supplies, and mobile home dealers...................................................................................................-- -- -- *2,656 -- -- -- -- General merchandise stores...................................................................................................-- *83,406 -- *242,788 *135,548 *388 - *70,149 Food stores...................................................................................................-- -- *13 *4,153 *3,449 -- *2,658 --
Automotive dealers and service station...................................................................................................-- -- -- -- -- -- -- -- Apparel and accessory stores...................................................................................................-- *37,300 -- *125,147 *80,190 -- *373 -- Furniture and home furnishing stores...................................................................................................-- -- -- *10,207 *4,732 -- *1,929 -- Eating and drinking places...................................................................................................-- *899,542 *836 1,262,250 925,979 -- *15,055 *3,594
All other retail stores...................................................................................................-- *258,848 *14,944 308,862 269,444 *1,174 *113,521 *25,382
Finance, insurance, and real estate.....................................................................................................................*169,532 46,773,056 3,040,235 70,715,971 24,358,750 551,075 1,551,966 1,008,729
Banking..............................................................................................................-- 32,930,336 *2,520,932 39,669,069 7,873,266 *403,901 488,406 *68,402
Credit agencies other than banks..............................................................................................................-- *3,153,617 *19,409 6,704,041 4,824,157 *56,245 *3,428 *42,909 Security, commodity brokers, and services..............................................................................................................-- *159,241 *2,279 8,440,162 2,056,750 *85 *545,215 219,290 Insurance..............................................................................................................-- 10,509,334 452,503 14,877,880 8,752,969 *88,339 497,258 489,676 Insurance agents, brokers, and service..............................................................................................................-- *1,407 -- *204,978 *180,890 *358 *4,242 *12,675
Real estate..............................................................................................................-- *6,896 *8,452 26,100 19,715 *1,804 *10,039 *4,250 Holding and other investment companies, except bank holding companies..............................................................................................................*169,532 *12,225 *36,661 793,741 651,002 *343 *3,378 *171,527
Services.....................................................................................................................-- 3,524,818 1,039,026 14,864,252 9,744,488 248,114 2,249,574 3,174,195
Hotels and other lodging places..............................................................................................................-- *297,942 -- 914,712 553,882 *4,553 *12,606 *9,787 Personal services..............................................................................................................-- *22,938 *291 *125,905 *119,710 -- -- *117,789 Business services..............................................................................................................-- 2,552,818 635,938 9,032,948 5,157,554 12,276 461,536 1,877,405
Auto repair; miscellaneous repair services..............................................................................................................-- -- *3,347 *2,253 *1,347 *356 *10 *469 Amusement and recreation services..............................................................................................................-- *495,870 *234,220 3,450,600 2,848,448 *230,806 1,696,939 *365,003 All other services..............................................................................................................-- 155,251 *165,231 1,337,835 1,063,546 *122 78,483 803,743 Footnotes at end of table.

129
Corporate Foreign Tax Credit, 1997
Table 1.--U.S. Corporation Returns with a Foreign Tax Credit: Total Assets, Income, Tax, and Credits, and Foreign Income and Tax Reported on Form 1118, by Selected Industrial Group--Continued [All figures are estimates based on samples--money amounts are in thousands of dollars]
Foreign income and taxes reported on Form 1118--Continued
Deductions not allocable to
Other specific types of income Deductions Taxable
Major and selected minor industrial group deductions from oil income Adjustments
allocable Research and gas (less loss) to taxable
to specific Total and Interest Other extraction before income
types of development income4 adjustments
income
(31) (32) (33) (34) (35) (36) (37) (38)
All industries.....................................................................................................................85,200,714 94,428,510 9,565,637 43,342,264 40,176,836 8,915,360 157,989,290 7,715,086
Agriculture, forestry, and fishing.....................................................................................................................*58,521 *39,019 *20,993 *8,934 *90,93 -- 139,972 *4,133
Mining.....................................................................................................................2,748,435 933,715 *38,287 302,159 589,613 1,032,644 3,159,297 288,600 Metal mining..............................................................................................................*1,010,659 *340,747 -- *98,566 *242,182 -- *488,462 *5,310 Coal mining..............................................................................................................*529,229 *26,848 -- *25,751 -- -- *307,372 -- Oil and gas extraction..............................................................................................................1,205,966 555,672 *38,287 169,871 346,379 1,032,644 2,322,103 283,290 Nonmetallic minerals, except fuels..............................................................................................................*2,581 *10,447 -- *7,971 *1,053 -- *41,360 --
Construction.....................................................................................................................94,524 66,011 *1,015 *9,348 *34,612 -- 155,458 *6,287 General building contractors..............................................................................................................*43,513 *30,977 *179 *3,248 *27,532 -- 67,007 *2,403 Heavy construction contractors..............................................................................................................*17,145 *29,951 -- *4,438 *5,875 -- 44,480 -- Special trade contractors..............................................................................................................*33,866 *5,083 *836 *1,662 *1,206 -- 43,971 *3,885
Manufacturing.....................................................................................................................42,640,613 37,633,211 7,834,168 12,397,235 16,818,994 7,836,010 102,821,437 4,235,398 Food and kindred products..............................................................................................................1,723,856 2,119,034 50,435 783,997 1,270,577 -- 9,057,195 134,739 Tobacco manufactures..............................................................................................................*1,643,114 *784,396 *57,775 *313,781 *412,840 -- *3,836,947 *( ) Textile mill products..............................................................................................................*26,356 21,314 *1,919 *14,510 *4,492 -- 86,228 *700 Apparel and other textile products..............................................................................................................*96,840 *102,161 *5,397 *67,938 *26,571 -- 862,195 *44,756 Lumber and wood products..............................................................................................................*36,416 *39,741 *399 *22,088 *17,192 -- 139,943 *( ) Furniture and fixtures..............................................................................................................*66,539 *34,818 *4,426 *23,354 *6,582 -- 76,913 *1,107 Paper and allied products..............................................................................................................395,347 827,344 124,072 200,269 499,898 -- 2,044,183 *38,928 Printing and publishing..............................................................................................................1,434,747 1,542,138 *17,717 192,317 1,294,902 -- 1,550,092 354,886 Industrial plastics and synthetic material..............................................................................................................2,939,096 2,508,506 506,875 1,317,191 669,543 *536,615 5,807,726 341,991 Drugs..............................................................................................................4,835,681 2,830,137 726,805 935,282 953,100 -- 7,792,900 465,238 Other chemicals..............................................................................................................1,678,023 1,204,902 345,898 367,840 474,129 -- 4,044,534 84,122 Petroleum (including integrated) and coal products..............................................................................................................12,277,274 2,257,200 143,030 1,556,901 557,242 7,299,395 19,801,407 129,124 Rubber and miscellaneous plastics products..............................................................................................................425,401 268,493 78,867 103,100 85,280 -- 1,210,411 19,292 Leather and leather products..............................................................................................................*12,480 *49,367 *1,260 *6,876 *39,636 -- 74,177 -- Stone, clay, and glass products..............................................................................................................*128,863 216,234 *33,135 96,151 *85,634 -- 314,446 *( ) Primary metal industries..............................................................................................................277,367 558,391 9,476 184,443 345,538 -- 1,329,018 11,043 Fabricated metal products..............................................................................................................583,374 594,576 78,327 292,676 211,494 -- 2,206,858 118,428 Office, computing, and accounting equipment..............................................................................................................*2,147,762 4,546,649 1,786,323 491,793 2,266,819 -- 10,424,085 *801,571 Other machinery, except electrical..............................................................................................................1,743,286 2,153,600 292,562 526,380 1,157,116 -- 3,305,695 87,521 Electrical and electronic equipment..............................................................................................................6,711,819 6,713,569 1,626,595 1,997,431 3,047,823 -- 13,430,204 915,992 Motor vehicles and equipment..............................................................................................................504,662 3,954,070 460,521 2,147,313 1,342,840 -- 7,730,127 31,245 Transportation equipment, except motor vehicles..............................................................................................................1,330,694 486,586 133,758 181,469 171,265 -- 2,135,312 *26,305 Instruments and related products..............................................................................................................1,449,154 3,531,579 1,268,596 503,284 1,748,345 -- 4,913,319 558,748 Miscellaneous manufacturing and manufacturing not allocable..............................................................................................................172,462 288,407 80,000 70,851 130,136 -- 647,521 *69,663
Transportation and public utilities.....................................................................................................................8,941,243 2,016,875 *57,203 1,002,896 951,350 *35,759 5,372,629 941,262 Transportation..............................................................................................................5,385,058 644,043 *7,874 159,933 474,034 -- 2,120,187 851,056 Water transportation.........................................................................................................*1,255 *16,942 -- *16,406 *416 -- 205,621 *51,065 All other transportation.........................................................................................................5,383,803 627,101 *7,874 143,527 473,618 -- 1,914,565 799,991 Communication..............................................................................................................*3,424,138 993,517 *49,218 *492,785 *451,514 -- 2,604,500 *65,795 Electric, gas, and sanitary services..............................................................................................................132,048 379,315 *110 350,178 *25,803 *35,759 647,943 24,411 Footnotes at end of table.
Deductions--Continued
5
5
5

130
Corporate Foreign Tax Credit, 1997
130
Table 1.--U.S. Corporation Returns with a Foreign Tax Credit: Total Assets, Income, Tax, and Credits, and Foreign Income and Tax Reported on Form 1118, by Selected Industrial Group--Continued [All figures are estimates based on samples--money amounts are in thousands of dollars]
Foreign income and taxes reported on Form 1118--Continued
Deductions not allocable to
Other specific types of income Deductions Taxable
Major and selected minor industrial group deductions from oil income Adjustments
allocable Research and gas (less loss) to taxable
to specific Total and Interest Other extraction before income
types of development income4
adjustments
income
(31) (32) (33) (34) (35) (36) (37) (38)
Wholesale and retail trade.....................................................................................................................5,397,790 2,262,694 24,693 1,459,232 719,208 *10,947 5,777,769 910,079
Wholesale trade..............................................................................................................4,212,670 1,725,973 24,284 1,158,259 506,770 *10,947 3,299,037 774,933
Groceries and related products.....................................................................................................*36,461 *1,341 -- *280 *638 -- 20,489 *( ) Machinery, equipment, and supplies.....................................................................................................*83,404 57,458 *49 *6,319 *47,736 -- 77,199 *20,300 Miscellaneous wholesale trade.....................................................................................................4,092,805 1,667,173 24,235 1,151,660 458,397 *10,947 3,201,349 754,633 Drugs, chemicals, and allied products...................................................................................................*774,212 *19,378 -- *2,301 *8,476 -- 291,314 *17,077
Petroleum and petroleum products...................................................................................................*568,747 *833,808 -- *762,332 *71,462 *10,947 *761,536 *324,892 Other miscellaneous wholesale trade...................................................................................................2,749,846 813,988 24,235 387,027 378,458 -- 2,148,499 412,664
Retail trade..............................................................................................................1,185,120 536,721 *409 300,973 212,438 -- 2,478,732 135,147
Building materials, garden supplies, and mobile home dealers...................................................................................................-- *2,656 -- -- -- -- *7,772 -- General merchandise stores...................................................................................................*65,012 *107,240 *6 *80,490 *26,744 -- *209,213 *5,699 Food stores...................................................................................................*791 *704 -- *468 *218 -- *72,866 *50,064
Automotive dealers and service station...................................................................................................-- -- -- -- -- -- *1,169 -- Apparel and accessory stores...................................................................................................*79,817 *44,957 *171 *30,655 *12,949 -- 310,565 *25,154 Furniture and home furnishing stores...................................................................................................*2,803 *5,476 -- *965 *2,742 -- *17,738 *( ) Eating and drinking places...................................................................................................*907,331 336,271 *12 *175,733 *158,093 -- 1,577,116 *15,149
All other retail stores...................................................................................................129,367 39,418 *221 12,661 *11,692 -- 282,293 *39,081
Finance, insurance, and real estate.....................................................................................................................21,246,980 46,357,221 *106,260 27,300,990 18,442,444 -- 31,905,032 717,773
Banking..............................................................................................................6,912,557 31,795,803 *99,921 18,942,052 12,279,487 -- 13,225,653 69,232
Credit agencies other than banks..............................................................................................................4,721,575 1,879,884 -- 1,222,764 *657,120 -- 2,154,220 *9,418 Security, commodity brokers, and services..............................................................................................................1,292,161 6,383,412 -- 5,892,346 488,979 -- 4,896,703 48,264 Insurance..............................................................................................................7,677,696 6,124,911 *944 1,154,868 4,942,605 -- 9,722,081 563,665 Insurance agents, brokers, and service..............................................................................................................*163,615 *24,088 *5,394 *15,316 *3,373 -- 243,867 --
Real estate..............................................................................................................3,622 *6,384 -- *5,586 *798 -- 45,503 *3,295 Holding and other investment companies, except bank holding companies..............................................................................................................475,755 142,738 -- 68,057 70,081 -- 1,617,005 23,898
Services.....................................................................................................................4,072,605 5,119,764 1,483,018 861,470 2,611,521 -- 8,657,696 611,554
Hotels and other lodging places..............................................................................................................*526,937 360,830 -- *154,879 *192,524 -- 579,872 *29,028 Personal services..............................................................................................................*1,921 *6,195 *317 *3,385 *221 -- *57,442 -- Business services..............................................................................................................2,806,337 3,875,394 1,445,526 250,159 2,053,030 -- 6,787,596 377,714
Auto repair; miscellaneous repair services..............................................................................................................*512 *905 *1 *95 *689 -- 8,770 *465 Amusement and recreation services..............................................................................................................*555,700 602,152 *16,487 *427,521 *152,531 -- 680,603 29,987 All other services..............................................................................................................181,198 274,289 *20,688 25,431 212,527 -- 543,414 174,360 Footnotes at end of table.
Deductions--Continued
5
5

131
Corporate Foreign Tax Credit, 1997
Table 1.--U.S. Corporation Returns with a Foreign Tax Credit: Total Assets, Income, Tax, and Credits, and Foreign Income and Tax Reported on Form 1118, by Selected Industrial Group--Continued [All figures are estimates based on samples--money amounts are in thousands of dollars]
Foreign income and taxes reported on Form 1118--Continued
Foreign taxes available for credit
Paid or accrued
Taxable
Major and selected minor industrial group income Reduction Total paid, Taxes
(less loss) Total for certain Carryover accrued, Total withheld at
after foreign and deemed source on
adjustments taxes paid dividends
(39) (40) (41) (42) (43) (44) (45)
All industries.....................................................................................................................150,274,204 49,979,466 2,516,340 7,416,008 45,079,798 16,056,942 2,767,327
Agriculture, forestry, and fishing.....................................................................................................................135,839 38,313 -- *3,837 34,476 12,702 2,521
Mining.....................................................................................................................2,870,696 1,416,118 444,333 562,043 1,298,408 1,018,859 53,846 Metal mining..............................................................................................................*483,152 *417,581 *1,703 *121,791 *297,492 *271,803 *26,875 Coal mining..............................................................................................................*307,372 *134,825 *26,791 *16,450 *145,166 *143,637 *1,408 Oil and gas extraction..............................................................................................................2,038,812 854,837 410,416 418,289 846,964 602,320 *25,198 Nonmetallic minerals, except fuels..............................................................................................................*41,360 *8,875 *5,423 *5,512 *8,785 *1,099 *366
Construction.....................................................................................................................149,171 63,431 -- 15,329 48,103 32,014 1,490 General building contractors..............................................................................................................64,605 34,284 -- *4,967 29,317 23,355 *420 Heavy construction contractors..............................................................................................................44,480 14,103 -- *8,397 5,706 5,088 *624 Special trade contractors..............................................................................................................40,086 15,045 -- *1,965 13,080 3,571 *446
Manufacturing.....................................................................................................................98,586,039 35,792,177 2,059,580 5,450,727 32,401,030 9,367,486 2,203,741 Food and kindred products..............................................................................................................8,922,456 3,042,404 -- 128,921 2,913,483 550,383 241,284 Tobacco manufactures..............................................................................................................*3,836,947 *1,379,627 -- *67,626 *1,312,000 *291,825 *208,396 Textile mill products..............................................................................................................85,528 28,485 *75 *474 28,086 2,933 *1,790 Apparel and other textile products..............................................................................................................817,439 291,790 -- *306 291,484 36,864 *13,082 Lumber and wood products..............................................................................................................139,943 52,370 -- *11,604 40,766 5,233 *1,468 Furniture and fixtures..............................................................................................................75,806 41,940 -- *15,666 26,274 4,231 *2,671 Paper and allied products..............................................................................................................2,005,255 716,140 -- 77,341 638,799 117,383 44,923 Printing and publishing..............................................................................................................1,195,206 331,423 -- 9,504 321,919 163,917 14,125 Industrial plastics and synthetic material..............................................................................................................5,465,735 1,861,492 -- 97,854 1,763,639 412,787 115,894 Drugs..............................................................................................................7,327,662 2,815,266 -- 105,561 2,709,705 561,850 323,897 Other chemicals..............................................................................................................3,960,412 1,471,640 -- 20,667 1,450,973 366,355 94,684 Petroleum (including integrated) and coal products..............................................................................................................19,672,283 9,102,941 2,054,206 3,770,305 7,386,841 3,991,117 331,267 Rubber and miscellaneous plastics products..............................................................................................................1,191,120 440,363 -- 16,549 423,814 65,481 23,181 Leather and leather products..............................................................................................................74,177 11,896 -- *208 11,688 9,683 *14 Stone, clay, and glass products..............................................................................................................314,446 144,642 -- *34,489 110,153 25,765 7,981 Primary metal industries..............................................................................................................1,317,975 701,061 *5,049 265,146 440,963 130,654 13,007 Fabricated metal products..............................................................................................................2,088,431 844,557 -- 47,490 797,067 102,958 29,376 Office, computing, and accounting equipment..............................................................................................................9,622,515 3,376,725 -- *81,825 3,294,900 665,251 268,408 Other machinery, except electrical..............................................................................................................3,218,174 985,714 -- 133,257 852,457 210,339 35,824 Electrical and electronic equipment..............................................................................................................12,514,212 3,437,298 -- 232,766 3,204,532 865,853 147,954 Motor vehicles and equipment..............................................................................................................7,698,882 2,624,433 -- *227,137 2,397,296 415,704 186,852 Transportation equipment, except motor vehicles..............................................................................................................2,109,007 527,783 -- *16,440 511,343 114,062 31,947 Instruments and related products..............................................................................................................4,354,571 1,344,804 -- 63,803 1,281,000 213,941 55,038 Miscellaneous manufacturing and manufacturing not allocable..............................................................................................................577,858 217,384 *251 25,789 191,846 42,919 10,677
Transportation and public utilities.....................................................................................................................4,431,367 969,683 *122 97,772 872,033 286,757 22,552 Transportation..............................................................................................................1,269,130 213,860 -- 56,636 157,224 68,415 5,879 Water transportation.........................................................................................................154,556 29,694 -- *4,015 25,679 12,262 *1,138 All other transportation.........................................................................................................1,114,574 184,166 -- 52,621 131,544 56,153 4,740 Communication..............................................................................................................2,538,706 539,130 -- *26,238 512,893 190,763 *5,799 Electric, gas, and sanitary services..............................................................................................................623,531 216,693 *122 *14,898 201,917 27,579 10,875 Footnotes at end of table.

132
Corporate Foreign Tax Credit, 1997
132
Table 1.--U.S. Corporation Returns with a Foreign Tax Credit: Total Assets, Income, Tax, and Credits, and Foreign Income and Tax Reported on Form 1118, by Selected Industrial Group--Continued [All figures are estimates based on samples--money amounts are in thousands of dollars]
Foreign income and taxes reported on Form 1118--Continued
Foreign taxes available for credit
Paid or accrued
Taxable
Major and selected minor industrial group income Reduction Total paid, Taxes
(less loss) Total for certain Carryover accrued, Total withheld at
after foreign and deemed source on
adjustments taxes paid dividends
(39) (40) (41) (42) (43) (44) (45)
Wholesale and retail trade.....................................................................................................................4,867,690 1,894,147 *( ) 237,214 1,656,933 535,490 90,146
Wholesale trade..............................................................................................................2,524,104 980,300 *( ) 170,654 809,646 298,976 65,388
Groceries and related products.....................................................................................................20,489 7,462 -- *1,043 6,420 *1,454 *279 Machinery, equipment, and supplies.....................................................................................................56,899 16,579 -- *4,651 11,928 7,185 1,055 Miscellaneous wholesale trade.....................................................................................................2,446,716 956,258 *( ) 164,961 791,298 290,337 64,053 Drugs, chemicals, and allied products...................................................................................................274,237 108,659 -- *13,893 94,766 78,454 *1,759
Petroleum and petroleum products...................................................................................................*436,644 *143,801 -- *22,910 *120,891 *67,147 *24,466 Other miscellaneous wholesale trade...................................................................................................1,735,835 703,798 *( ) 128,157 575,642 144,737 37,828
Retail trade..............................................................................................................2,343,586 913,847 -- 66,559 847,287 236,513 24,758
Building materials, garden supplies, and mobile home dealers...................................................................................................7,772 *1,835 -- -- *1,835 *1,835 *2 General merchandise stores...................................................................................................*203,515 *46,648 -- *15,794 *30,854 *23,554 *6,269 Food stores...................................................................................................*22,802 *7,987 -- -- *7,987 *7,987 *4
Automotive dealers and service station...................................................................................................*1,169 *137 -- *12 *125 *125 *32 Apparel and accessory stores...................................................................................................285,411 135,143 -- *13,361 121,782 8,467 *907 Furniture and home furnishing stores...................................................................................................*17,738 *3,573 -- *7 *3,566 *1,072 *373 Eating and drinking places...................................................................................................1,561,967 654,592 -- *32,467 622,125 159,618 *12,459
All other retail stores...................................................................................................243,212 63,932 -- *4,918 59,014 33,855 *4,712
Finance, insurance, and real estate.....................................................................................................................31,187,259 7,370,111 *12,176 809,000 6,573,288 3,936,806 319,619
Banking..............................................................................................................13,156,420 3,672,822 -- 391,946 3,280,877 2,225,266 149,514
Credit agencies other than banks..............................................................................................................2,144,802 505,543 -- 39,738 465,804 186,303 17,133 Security, commodity brokers, and services..............................................................................................................4,848,439 801,877 -- 56,838 745,040 424,387 39,477 Insurance..............................................................................................................9,158,416 1,703,013 -- 219,370 1,483,643 1,039,290 85,587 Insurance agents, brokers, and service..............................................................................................................243,867 50,660 -- *400 50,260 6,005 *3,186
Real estate..............................................................................................................42,208 16,188 -- *4,203 11,984 2,805 303 Holding and other investment companies, except bank holding companies..............................................................................................................1,593,107 620,007 *12,176 96,504 535,680 52,750 24,419
Services.....................................................................................................................8,046,142 2,435,487 *129 240,087 2,195,529 866,829 73,412
Hotels and other lodging places..............................................................................................................550,843 264,248 -- *49,004 215,244 70,713 *1,205 Personal services..............................................................................................................*57,442 *30,576 -- *13,520 *17,056 *3,782 *1,386 Business services..............................................................................................................6,409,883 1,717,946 *129 85,634 1,632,440 593,583 65,420
Auto repair; miscellaneous repair services..............................................................................................................8,305 1,779 -- *232 1,547 486 *( ) Amusement and recreation services..............................................................................................................650,615 245,618 -- *12,378 233,240 154,108 *3,681 All other services..............................................................................................................369,054 175,320 -- 79,319 96,001 44,156 1,720 Footnotes at end of table.
5
5
5
5
5

133
Corporate Foreign Tax Credit, 1997
Table 1.--U.S. Corporation Returns with a Foreign Tax Credit: Total Assets, Income, Tax, and Credits, and Foreign Income and Tax Reported on Form 1118, by Selected Industrial Group--Continued [All figures are estimates based on samples--money amounts are in thousands of dollars]
Foreign income and taxes reported on Form 1118--Continued
Foreign taxes available for credit--Continued
Paid or accrued--Continued
Other taxes paid or accrued on--
Major and selected minor industrial group Specifically Taxes
Rents, allocable deemed
royalties, Branch income Service Other paid
Interest and license income [section income income
fees 863(b)]
(46) (47) (48) (49) (50) (51) (52)
All industries.....................................................................................................................640,883 2,238,232 6,063,443 29,802 292,786 4,024,468 29,022,856
Agriculture, forestry, and fishing.....................................................................................................................*484 *3,076 *1,724 -- -- *4,897 *21,774
Mining.....................................................................................................................9,917 12,595 286,739 -- *12,908 642,854 279,548 Metal mining..............................................................................................................*5,538 *1,235 *109,919 -- *8,171 *120,065 *25,690 Coal mining..............................................................................................................*1,674 -- *9,278 -- -- *131,276 *1,529 Oil and gas extraction..............................................................................................................*2,231 11,360 167,282 -- *4,737 391,513 244,644 Nonmetallic minerals, except fuels..............................................................................................................*474 -- *260 -- -- -- *7,686
Construction.....................................................................................................................*490 835 *4,455 -- 22,826 1,918 *16,088 General building contractors..............................................................................................................*89 *383 *2,765 -- *18,459 *1,238 *5,962 Heavy construction contractors..............................................................................................................*285 *183 *334 -- *3,121 *542 *618 Special trade contractors..............................................................................................................*116 *269 *1,356 -- *1,246 *137 *9,509
Manufacturing.....................................................................................................................140,905 1,580,966 2,945,132 15,116 83,972 2,397,654 23,033,544 Food and kindred products..............................................................................................................9,642 99,894 *162,714 *817 *6,964 29,068 2,363,100 Tobacco manufactures..............................................................................................................*8,255 *58357 *10,898 -- *839 *5,079 *1,020,175 Textile mill products..............................................................................................................*346 *657 *46 -- *9 *84 *25,154 Apparel and other textile products..............................................................................................................*71 16,908 *6,168 -- *379 *256 *254,620 Lumber and wood products..............................................................................................................*1,274 *579 *1,890 -- *15 *7 *35,533 Furniture and fixtures..............................................................................................................*438 620 -- -- *253 *249 *22,043 Paper and allied products..............................................................................................................2,740 36,249 *32,486 *509 *460 *16 521,416 Printing and publishing..............................................................................................................1,267 125,236 *9,591 *40 *1,146 12,511 158,002 Industrial plastics and synthetic material..............................................................................................................5,733 81,070 143,821 *93 *3,051 63,124 1,350,852 Drugs..............................................................................................................7,394 99,741 89,468 *317 *5,979 35,053 2,147,856 Other chemicals..............................................................................................................3,928 116,233 145,395 -- *4,763 1,351 1,084,618 Petroleum (including integrated) and coal products..............................................................................................................31,842 36,099 *1,956,226 -- *361 1,635,322 3,395,725 Rubber and miscellaneous plastics products..............................................................................................................2,187 31,172 *8,542 *78 *98 *223 358,333 Leather and leather products..............................................................................................................*192 *8,531 *931 -- *12 *4 *2,005 Stone, clay, and glass products..............................................................................................................3,625 7,907 *181 *71 *2,616 *3,385 84,388 Primary metal industries..............................................................................................................2,432 10,388 *38,517 -- *2,151 64,158 310,309 Fabricated metal products..............................................................................................................3,115 15,271 4,741 -- *279 50,176 694,109 Office, computing, and accounting equipment..............................................................................................................*2,462 328,268 *51,561 -- *4,557 *9,995 2,629,650 Other machinery, except electrical..............................................................................................................9,760 34,078 50,600 *358 19,169 60,550 642,117 Electrical and electronic equipment..............................................................................................................19,519 247,921 91,340 *12,051 9,582 337,487 2,338,679 Motor vehicles and equipment..............................................................................................................15,393 63,905 *72,561 -- *10,972 *66,022 1,981,592 Transportation equipment, except motor vehicles..............................................................................................................1,637 29,585 *41,522 *232 *7,866 *1,273 397,281 Instruments and related products..............................................................................................................6,464 118,933 20,193 *549 *2,405 10,360 1,067,059 Miscellaneous manufacturing and manufacturing not allocable..............................................................................................................1,191 13,363 5,741 -- *47 11,901 148,927
Transportation and public utilities.....................................................................................................................7,467 21,541 36,575 *6,887 22,252 169,482 585,276 Transportation..............................................................................................................2,091 4,353 *27,786 *6,788 15,868 *5,651 88,808 Water transportation.........................................................................................................*85 *1,198 -- -- *4,709 *5,131 *13,417 All other transportation.........................................................................................................2,006 3,154 *27,786 *6,788 11,158 *520 75,391 Communication..............................................................................................................*855 *15,739 *5,716 *98 *2,369 *160,187 *322,130 Electric, gas, and sanitary services..............................................................................................................*4,522 *1,450 *3,074 -- *4,015 3,644 174,338 Footnotes at end of table.
Taxes withheld at source on--
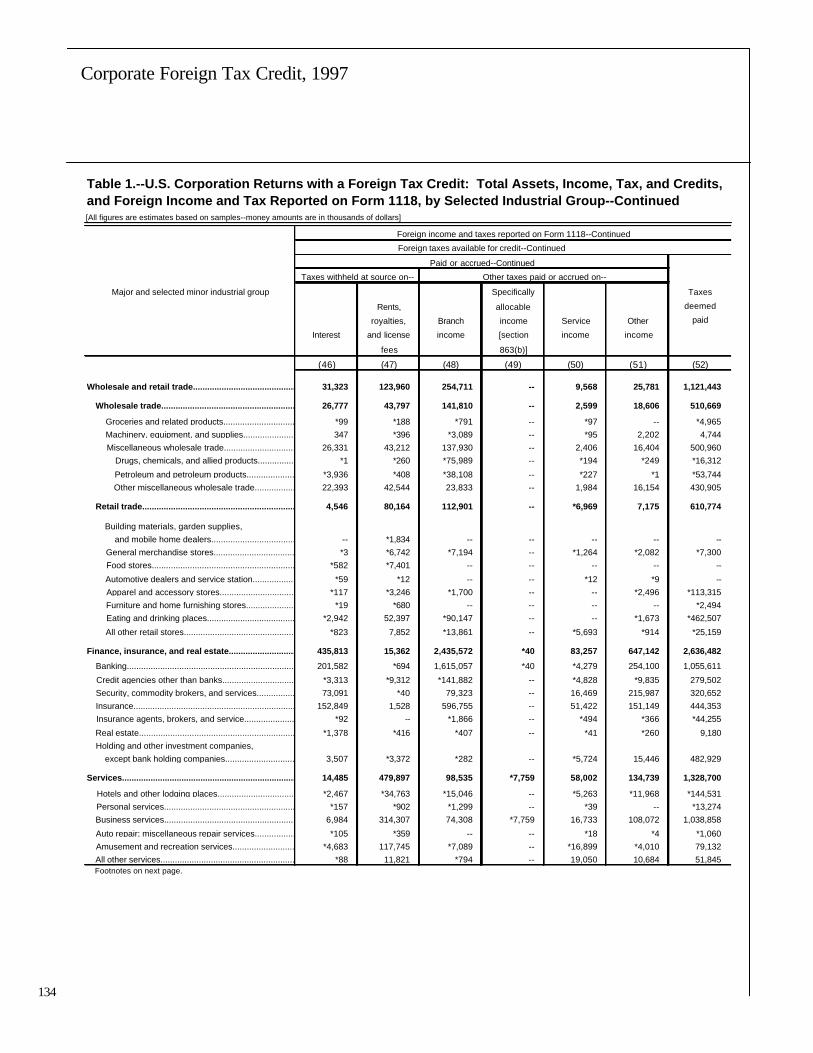
134
Corporate Foreign Tax Credit, 1997
134
Table 1.--U.S. Corporation Returns with a Foreign Tax Credit: Total Assets, Income, Tax, and Credits, and Foreign Income and Tax Reported on Form 1118, by Selected Industrial Group--Continued [All figures are estimates based on samples--money amounts are in thousands of dollars]
Foreign income and taxes reported on Form 1118--Continued
Foreign taxes available for credit--Continued
Paid or accrued--Continued
Other taxes paid or accrued on--
Major and selected minor industrial group Specifically Taxes
Rents, allocable deemed
royalties, Branch income Service Other paid
Interest and license income [section income income
fees 863(b)]
(46) (47) (48) (49) (50) (51) (52)
Wholesale and retail trade.....................................................................................................................31,323 123,960 254,711 -- 9,568 25,781 1,121,443
Wholesale trade..............................................................................................................26,777 43,797 141,810 -- 2,599 18,606 510,669
Groceries and related products.....................................................................................................*99 *188 *791 -- *97 -- *4,965 Machinery, equipment, and supplies.....................................................................................................347 *396 *3,089 -- *95 2,202 4,744 Miscellaneous wholesale trade.....................................................................................................26,331 43,212 137,930 -- 2,406 16,404 500,960 Drugs, chemicals, and allied products...................................................................................................*1 *260 *75,989 -- *194 *249 *16,312
Petroleum and petroleum products...................................................................................................*3,936 *408 *38,108 -- *227 *1 *53,744 Other miscellaneous wholesale trade...................................................................................................22,393 42,544 23,833 -- 1,984 16,154 430,905
Retail trade..............................................................................................................4,546 80,164 112,901 -- *6,969 7,175 610,774
Building materials, garden supplies, and mobile home dealers...................................................................................................-- *1,834 -- -- -- -- -- General merchandise stores...................................................................................................*3 *6,742 *7,194 -- *1,264 *2,082 *7,300 Food stores...................................................................................................*582 *7,401 -- -- -- -- --
Automotive dealers and service station...................................................................................................*59 *12 -- -- *12 *9 -- Apparel and accessory stores...................................................................................................*117 *3,246 *1,700 -- -- *2,496 *113,315 Furniture and home furnishing stores...................................................................................................*19 *680 -- -- -- -- *2,494 Eating and drinking places...................................................................................................*2,942 52,397 *90,147 -- -- *1,673 *462,507
All other retail stores...................................................................................................*823 7,852 *13,861 -- *5,693 *914 *25,159
Finance, insurance, and real estate.....................................................................................................................435,813 15,362 2,435,572 *40 83,257 647,142 2,636,482
Banking..............................................................................................................201,582 *694 1,615,057 *40 *4,279 254,100 1,055,611
Credit agencies other than banks..............................................................................................................*3,313 *9,312 *141,882 -- *4,828 *9,835 279,502 Security, commodity brokers, and services..............................................................................................................73,091 *40 79,323 -- 16,469 215,987 320,652 Insurance..............................................................................................................152,849 1,528 596,755 -- 51,422 151,149 444,353 Insurance agents, brokers, and service..............................................................................................................*92 -- *1,866 -- *494 *366 *44,255
Real estate..............................................................................................................*1,378 *416 *407 -- *41 *260 9,180 Holding and other investment companies, except bank holding companies..............................................................................................................3,507 *3,372 *282 -- *5,724 15,446 482,929
Services.....................................................................................................................14,485 479,897 98,535 *7,759 58,002 134,739 1,328,700
Hotels and other lodging places..............................................................................................................*2,467 *34,763 *15,046 -- *5,263 *11,968 *144,531 Personal services..............................................................................................................*157 *902 *1,299 -- *39 -- *13,274 Business services..............................................................................................................6,984 314,307 74,308 *7,759 16,733 108,072 1,038,858
Auto repair; miscellaneous repair services..............................................................................................................*105 *359 -- -- *18 *4 *1,060 Amusement and recreation services..............................................................................................................*4,683 117,745 *7,089 -- *16,899 *4,010 79,132 All other services..............................................................................................................*88 11,821 *794 -- 19,050 10,684 51,845 Footnotes on next page.
Taxes withheld at source on--

135
Corporate Foreign Tax Credit, 1997
Footnotes and Notes to Table 1: * Data should be used with caution because of the small number of returns on which they were based. ¹ Interest-Charge Domestic International Sales Corporation (IC-DISC) and Domestic International Sales Corporation (DISC). ² In addition to the credits shown in columns 12-14, this is after reduction by other credits, such as the jobs credit and the investment credit, which are not shown separately in this table. ³ Included in gross income (less loss), columns 16-22. See notes below. Included in deductions, columns 26-35. See notes below.
Less than $500. NOTES: Columns 2 through 15 present statistics on assets, receipts, income, and taxes reported on Form 1120 (Corporation Income Tax Return) series for corporations claiming a foreign tax credit. Columns 16 through 52 present statistics from Form 1118, Foreign Tax Credit--Corporations. Schedule references indicate the schedule of Form 1118 from which the data were obtained. Columns 16 through 36 present statistics on foreign income (i.e.,
income from sources outside the United States) and deductions reported primarily on Schedule A, Form 1118. Although the amounts of oil and gas income and deductions (columns 23 and 36, respectively) are contained in the summary columns (i.e., columns 16 through 22 and 26 through 35), these amounts are alsoreported separately (on Schedule I) because oil and gas income is subject to special rules under Internal Revenue Code section 907, which may result in a reduction of foreign taxes available for credit. Code section 863(b) income (income partly within and partly without the United States) and foreign branch income
are also included in the summary amounts reported in columns 16 through 22 and are also reported separately (on Schedule F) in columns 24 and 25. Total deductions not allocable to specific types of income (column 32) are equal to the sum of columns 33 through 35 (any differences are due to taxpayerreporting practices). Total foreign-source gross income (column 16) less total foreign deductions (column 26) is equal to foreign-source taxable income before adjustments (column 37).
Adjustments to foreign-source taxable income (reported in column 38) include allocations of current-year U.S.-source losses and recapture of foreign losses,as well as other adjustments. These adjustments (reported on Schedule J) affect the numerator of the limitation fraction used to compute the foreign tax credit. The foreign-source taxable income after adjustments (the numerator of the limitation fraction) is reported in column 39. The limitation fraction, which representsthe ratio of foreign-source taxable income after adjustments to total (U.S. and foreign) taxable income after adjustments, is applied to the total U.S. tax againstwhich the credit is allowed to determine any limitation on the foreign tax credit.
Statistics on foreign taxes are reported in columns 40 through 52. Data on foreign taxes paid, accrued, and deemed paid (through related foreign corporations or their subsidiaries) from Schedule B, Form 1118, are reported in columns 43 through 52. Total foreign taxes paid or accrued (column 44) are the sum of columns45 through 51 (any differences are due to taxpayer reporting practices). Total foreign taxes paid, accrued, and deemed paid (column 43) are equal to the sum of total taxes paid or accrued (column 44) and taxes deemed paid (column 52). Total foreign taxes paid, accrued, and deemed paid are then adjusted for certain items (e.g., reductions of foreign taxes under Code section 907 related to oil and gas income), which are reported in column 41, as well as carryovers of foreign taxes not credited in prior years, which are reported in column 42. Thus, total foreign taxes available for credit (column 40) are equal to total foreign taxes paid, accrued, and deemed paid (column 43) less certain foreign taxes (column 41), plus any carryover of prior-year foreign taxes (column 42).
4
5

136
Corporate Foreign Tax Credit, 1997
136
Table 2.--U.S. Corporation Returns with a Foreign Tax Credit: Foreign Income and Tax Reported on Form 1118, by Industrial Division and Income Type[All figures are estimates based on samples--money amounts are in thousands of dollars]
Foreign income and taxes reported on Form 1118
Gross income (less loss)Foreign
Number dividend
of income Rents,
returns Total Dividends resulting from Interest royalties, Service Other
foreign taxes and income incomedeemed paid license fees
(gross-up)
(1) (2) (3) (4) (5) (6) (7) (8)
ALL INDUSTRIES
All income types..............................................................................................................6,569 359,898,600 68,480,746 29,020,456 61,505,751 48,610,292 31,387,624 120,893,731 Passive income................................................................................2,471 7,771,190 4,066,867 544,062 2,374,840 365,338 18,093 401,990 High withholding tax interest................................................................................375 1,956,124 54,709 30,281 1,870,093 -- -- *1,041 Financial services income................................................................................429 105,293,627 9,486,835 2,947,844 50,393,059 2,637,891 9,779,560 30,048,438 Shipping income................................................................................58 12,178,158 325,879 58,023 55,040 505,464 6,933,462 4,300,288 Dividends from noncontrolled section 902 corp………. 676 4,303,132 2,780,784 1,286,523 23,101 6,440 *235 206,051 Dividends from an IC-DISC or former DISC ¹................................................................................5 *1,029 *1,029 -- -- -- -- -- Miscellaneous separately calculated limitation................................................................................28 595,700 81,800 *18,114 *25,023 *32 -- *470,731 Certain distributions from a FSC or former FSC ²................................................................................84 3,268,813 3,268,712 *102 -- -- -- -- General limitation income................................................................................3,974 224,530,827 48,414,131 24,135,507 6,764,595 45,095,127 14,656,274 85,465,192
AGRICULTURE, FORESTRY, AND FISHING All income types..............................................................................................................134 238,033 54,572 *21,774 *19,744 *14,007 -- 127,936 Passive income................................................................................76 *7,705 *2,043 *465 *5,241 -- -- * -44 High withholding tax interest................................................................................-- -- -- -- -- -- -- -- Financial services income................................................................................-- -- -- -- -- -- -- -- Shipping income................................................................................-- -- -- -- -- -- -- -- Dividends from noncontrolled section 902 corp………. 53 *3,346 *3,082 *263 -- -- -- *2 Dividends from an IC-DISC or former DISC ¹................................................................................-- -- -- -- -- -- -- -- Miscellaneous separately calculated limitation................................................................................-- -- -- -- -- -- -- -- Certain distributions from a FSC or former FSC ²................................................................................** ** ** ** ** ** ** ** General limitation income................................................................................11 213,244 *35,709 *21,047 *14,503 *14,007 -- *127,978
MINING All income types..............................................................................................................133 8,292,326 769,336 279,548 221,170 310,547 3,073,644 3,638,080 Passive income................................................................................34 76,275 19,906 *765 27,737 *9,311 *6,732 *11,824 High withholding tax interest................................................................................** ** ** ** ** ** ** ** Financial services income................................................................................** ** ** ** ** ** ** ** Shipping income................................................................................-- -- -- -- -- -- -- -- Dividends from noncontrolled section 902 corp………. 6 *20,693 *19,700 *993 -- -- -- -- Dividends from an IC-DISC or former DISC ¹................................................................................-- -- -- -- -- -- -- -- Miscellaneous separately calculated limitation................................................................................-- -- -- -- -- -- -- -- Certain distributions from a FSC or former FSC ²................................................................................-- -- -- -- -- -- -- -- General limitation income................................................................................117 8,151,080 726,680 275,973 154,024 301,236 3,066,912 3,626,256
CONSTRUCTION All income types..............................................................................................................183 449,484 85,149 *16,088 *9,344 23,555 195,865 119,483 Passive income................................................................................40 14,025 4,974 *221 *7,538 *1,248 -- *45 High withholding tax interest................................................................................** ** ** ** ** ** ** ** Financial services income................................................................................-- -- -- -- -- -- -- -- Shipping income................................................................................-- -- -- -- -- -- -- -- Dividends from noncontrolled section 902 corp………. 29 *10,789 *6,854 *3,595 -- -- -- *339 Dividends from an IC-DISC or former DISC ¹................................................................................-- -- -- -- -- -- -- -- Miscellaneous separately calculated limitation................................................................................-- -- -- -- -- -- -- -- Certain distributions from a FSC or former FSC ²................................................................................** ** ** ** ** ** ** ** General limitation income................................................................................123 381,977 30,765 *12,272 *1,669 *22,307 195,865 119,099 Footnotes at end of table.
Industrial division and income type

137
Corporate Foreign Tax Credit, 1997
Table 2.--U.S. Corporation Returns with a Foreign Tax Credit: Foreign Income and Tax Reported on Form 1118, by Industrial Division and Income Type--Continued[All figures are estimates based on samples--money amounts are in thousands of dollars]
Foreign income and taxes reported on Form 1118Gross income (less loss)
ForeignNumber dividend
of income Rents,
returns Total Dividends resulting from Interest royalties, Service Other
foreign taxes and income incomedeemed paid license fees
(gross-up)
(1) (2) (3) (4) (5) (6) (7) (8)
MANUFACTURING All income types..............................................................................................................1,763 188,632,881 52,156,799 23,031,191 8,366,129 33,953,415 3,733,558 67,391,789 Passive income................................................................................636 6,135,387 3,468,764 465,443 1,821,678 220,793 *1,097 157,612 High withholding tax interest................................................................................88 198,554 *1,904 *569 196,082 -- -- -- Financial services income................................................................................74 6,383,961 1,561,353 966,332 963,743 *733,193 *3,578 2,155,762 Shipping income................................................................................27 592,555 135,806 *8,174 *29,934 *323,831 *9,895 84,915 Dividends from noncontrolled section 902 corp………. 235 1,705,839 1,094,929 490,053 5,127 6,419 *36 109,274 Dividends from an IC-DISC or former DISC ¹................................................................................5 *1,029 *1,029 -- -- -- -- -- Miscellaneous separately calculated limitation................................................................................20 73,114 *41,573 *5,715 *24,904 *32 -- *891 Certain distributions from a FSC or former FSC ²................................................................................59 2,911,583 2,911,481 *102 -- -- -- -- General limitation income................................................................................1,459 170,630,859 42,939,961 21,094,803 5,324,661 32,669,147 3,718,953 64,883,334
TRANSPORTATION AND PUBLIC UTILITIES All income types..............................................................................................................159 22,221,685 1,606,457 585,276 320,490 426,902 9,220,380 10,062,180 Passive income................................................................................73 175,218 92,212 7,115 58,319 *12,004 *1,424 *4,143 High withholding tax interest................................................................................15 18,281 -- -- 18,281 -- -- -- Financial services income................................................................................** ** ** ** ** ** ** ** Shipping income................................................................................20 11,489,126 178,167 *49,627 *17,095 *124,433 6,923,568 *4,196,236 Dividends from noncontrolled section 902 corp………. 18 826,456 549,236 266,052 *5,755 -- -- *5,414 Dividends from an IC-DISC or former DISC ¹................................................................................-- -- -- -- -- -- -- -- Miscellaneous separately calculated limitation................................................................................** ** ** ** ** ** ** ** Certain distributions from a FSC or former FSC ²................................................................................** ** ** ** ** ** ** ** General limitation income................................................................................109 9,202,669 781,178 262,482 221,041 251,149 2,282,998 5,403,820
WHOLESALE AND RETAIL TRADE All income types..............................................................................................................1,193 13,921,240 1,997,340 1,121,448 2,054,128 1,450,456 414,872 6,882,996 Passive income................................................................................598 491,426 128,725 15,911 133,748 97,553 *87 115,403 High withholding tax interest................................................................................61 122,391 *8,926 *3,421 110,043 -- -- -- Financial services income................................................................................91 *2,187,197 *133,190 *55,235 *1,515,395 *10,084 -- *473,292 Shipping income................................................................................** ** ** ** ** ** ** ** Dividends from noncontrolled section 902 corp………. 49 51,991 39,423 12,554 *3 -- -- *10 Dividends from an IC-DISC or former DISC ¹................................................................................-- -- -- -- -- -- -- -- Miscellaneous separately calculated limitation................................................................................** ** ** ** ** ** ** ** Certain distributions from a FSC or former FSC ²................................................................................** ** ** ** ** ** ** ** General limitation income................................................................................507 11,010,755 1,642,248 1,021,838 294,818 1,342,818 414,786 6,294,248
FINANCE, INSURANCE, AND REAL ESTATE All income types..............................................................................................................1,676 102,621,003 9,539,627 2,636,478 49,935,328 1,923,139 9,976,238 28,610,193 Passive income................................................................................833 593,561 306,763 48,071 191,537 *1,642 *4,507 41,042 High withholding tax interest................................................................................128 1,544,689 41,008 *24,474 1,478,166 -- -- *1,041 Financial services income................................................................................197 96,455,210 7,770,290 1,921,146 47,850,987 1,838,877 9,762,719 27,311,191 Shipping income................................................................................** ** ** ** ** ** ** ** Dividends from noncontrolled section 902 corp………. 170 894,591 561,250 243,327 *1,265 -- *199 88,550 Dividends from an IC-DISC or former DISC ¹................................................................................-- -- -- -- -- -- -- -- Miscellaneous separately calculated limitation................................................................................** ** ** ** ** ** ** ** Certain distributions from a FSC or former FSC ²................................................................................9 *122,936 *122,936 -- -- -- -- -- General limitation income................................................................................567 2,998,106 729,418 399,329 408,229 82,620 208,814 1,169,698 Footnotes at end of table.
Industrial division and income type

138
Corporate Foreign Tax Credit, 1997
138
Table 2.--U.S. Corporation Returns with a Foreign Tax Credit: Foreign Income and Tax Reported on Form 1118, by Industrial Division and Income Type--Continued[All figures are estimates based on samples--money amounts are in thousands of dollars]
Foreign income and taxes reported on Form 1118Gross income (less loss)
ForeignNumber dividend
of income Rents,
returns Total Dividends resulting from Interest royalties, Service Other
foreign taxes and income income
deemed paid license fees(gross-up)
(1) (2) (3) (4) (5) (6) (7) (8)
SERVICES
All income types..............................................................................................................1,329 23,521,948 2,271,466 1,328,651 579,418 10,508,272 4,773,067 4,061,074 Passive income................................................................................182 277,594 43,482 6,071 129,041 22,788 *4,246 71,965 High withholding tax interest................................................................................74 28,666 *692 -- 27,974 -- -- -- Financial services income................................................................................57 209,953 *16,403 *5,130 *62,934 *16,420 *874 *108,192 Shipping income................................................................................5 *82,051 *1,621 -- *2,807 *57,200 -- *20,423 Dividends from noncontrolled section 902 corp………. 117 789,428 506,310 269,686 *10,950 *21 -- *2,461 Dividends from an IC-DISC or former DISC ¹................................................................................-- -- -- -- -- -- -- -- Miscellaneous separately calculated limitation................................................................................3 *17,699 *365 *( ³ ) *60 -- -- *17,274 Certain distributions from a FSC or former FSC ²................................................................................11 *174,421 *174,421 -- -- -- -- -- General limitation income................................................................................1,082 21,942,137 1,528,172 1,047,764 345,652 10,411,842 4,767,947 3,840,759 Footnotes at end of table.
Industrial division and income type

139
Corporate Foreign Tax Credit, 1997
Table 2.--U.S. Corporation Returns with a Foreign Tax Credit: Foreign Income and Tax Reported on Form 1118, by Industrial Division and Income Type--Continued[All figures are estimates based on samples--money amounts are in thousands of dollars]
Foreign income and taxes reported on Form 1118--Continued
DeductionsDeductions allocable to specific types of income
Oil and gas Specifically Rental, royalty, and
Industrial division and income type extraction Foreign allocable licensing expenses
income branch income Total Depreciation, Service
(less loss) income [section Total depletion, expenses863(b)] and Other
amortization
(9) (10) (11) (12) (13) (14) (15) (16)
ALL INDUSTRIES
All income types..............................................................................................................21,013,968 88,607,770 24,971,121 201,909,309 107,480,799 1,257,812 7,358,799 13,663,474 Passive income................................................................................-- 187,088 16,983 2,255,063 759,775 5,752 55,715 10,830 High withholding tax interest................................................................................-- *359,043 *135,978 906,179 82,995 *4 *5,840 *609 Financial services income................................................................................-- 46,970,762 2,825,988 72,903,477 25,566,714 561,435 1,826,735 740,505 Shipping income................................................................................-- *3,638,420 *2,104,614 10,414,571 9,707,115 *155,955 *35,384 *3,816,460 Dividends from noncontrolled section 902 corp………. -- *2,471 *9,576 770,800 88,682 *620 *7,155 *11,855 Dividends from an IC-DISC or former DISC ¹................................................................................-- -- -- -- -- -- -- -- Miscellaneous separately calculated limitation................................................................................-- -- -- 44,960 *28,723 -- -- -- Certain distributions from a FSC or former FSC ²................................................................................-- -- -- 3,160,787 3,149,741 *7,367 -- -- General limitation income................................................................................21,013,968 37,449,987 19,877,982 111,453,471 68,097,054 526,679 5,427,970 9,083,216
AGRICULTURE, FORESTRY, AND FISHING All income types..............................................................................................................-- *673 *92,236 *98,061 *59,042 -- *521 -- Passive income................................................................................-- -- -- *3,598 -- -- -- -- High withholding tax interest................................................................................-- -- -- -- -- -- -- -- Financial services income................................................................................-- -- -- -- -- -- -- -- Shipping income................................................................................-- -- -- -- -- -- -- -- Dividends from noncontrolled section 902 corp………. -- -- -- *1,086 -- -- -- -- Dividends from an IC-DISC or former DISC ¹................................................................................-- -- -- -- -- -- -- -- Miscellaneous separately calculated limitation................................................................................-- -- -- -- -- -- -- -- Certain distributions from a FSC or former FSC ²................................................................................** ** ** ** ** ** ** ** General limitation income................................................................................-- *673 *92,236 *79,640 *45,304 -- *521 --
MINING All income types..............................................................................................................2,037,440 3,126,813 *378,536 5,133,029 4,199,314 117,568 66,502 1,266,808 Passive income................................................................................-- *2,022 *10,937 24,236 13,830 *3,344 *1,151 -- High withholding tax interest................................................................................** ** ** ** ** ** ** ** Financial services income................................................................................** ** ** ** ** ** ** ** Shipping income................................................................................-- -- -- -- -- -- -- -- Dividends from noncontrolled section 902 corp………. -- -- -- *7,305 -- -- -- -- Dividends from an IC-DISC or former DISC ¹................................................................................-- -- -- -- -- -- -- -- Miscellaneous separately calculated limitation................................................................................-- -- -- -- -- -- -- -- Certain distributions from a FSC or former FSC ²................................................................................-- -- -- -- -- -- -- -- General limitation income................................................................................2,037,440 3,124,791 *366,463 5,098,389 4,185,255 114,224 65,352 1,266,794
CONSTRUCTION All income types..............................................................................................................-- *83,784 *40,924 294,026 228,015 *349 *1,281 131,860 Passive income................................................................................-- -- -- *1,880 *184 *141 -- -- High withholding tax interest................................................................................** ** ** ** ** ** ** ** Financial services income................................................................................-- -- -- -- -- -- -- -- Shipping income................................................................................-- -- -- -- -- -- -- -- Dividends from noncontrolled section 902 corp………. -- -- -- *461 *105 -- -- -- Dividends from an IC-DISC or former DISC ¹................................................................................-- -- -- -- -- -- -- -- Miscellaneous separately calculated limitation................................................................................-- -- -- -- -- -- -- -- Certain distributions from a FSC or former FSC ²................................................................................** ** ** ** ** ** ** ** General limitation income................................................................................-- *83,784 *40,924 249,103 185,171 *208 *1,281 131,860 Footnotes at end of table.
Gross income (less loss)--Continued
4 4
4

140
Corporate Foreign Tax Credit, 1997
140
Table 2.--U.S. Corporation Returns with a Foreign Tax Credit: Foreign Income and Tax Reported on Form 1118, by Industrial Division and Income Type--Continued[All figures are estimates based on samples--money amounts are in thousands of dollars]
Foreign income and taxes reported on Form 1118--ContinuedDeductions
Deductions allocable to specific types of incomeOil and gas Specifically Rental, royalty, and
Industrial division and income type extraction Foreign allocable licensing expenses
income branch income Total Depreciation, Service
(less loss) income [section Total depletion, expenses863(b)] and Other
amortization
(9) (10) (11) (12) (13) (14) (15) (16)
MANUFACTURING
All income types..............................................................................................................18,743,589 27,638,925 17,567,896 85,811,444 48,178,233 298,396 3,113,488 2,125,735 Passive income................................................................................-- 182,711 *3,178 1,752,167 629,523 *1,049 15,640 *7,374 High withholding tax interest................................................................................-- *410 -- 45,303 12,029 -- -- -- Financial services income................................................................................-- *505,418 -- 3,423,787 1,946,883 *4,486 *303,956 -- Shipping income................................................................................-- *34,629 -- 504,692 403,850 *84,878 *35,300 *9,389 Dividends from noncontrolled section 902 corp………. -- *1,219 *458 470,660 30,263 *620 *1,779 *1,138 Dividends from an IC-DISC or former DISC ¹................................................................................-- -- -- -- -- -- -- -- Miscellaneous separately calculated limitation................................................................................-- -- -- 15,565 *4,728 -- -- -- Certain distributions from a FSC or former FSC ²................................................................................-- -- -- 2,853,457 2,853,381 -- -- -- General limitation income................................................................................18,743,589 26,914,538 17,564,260 76,745,814 42,297,578 207,362 2,756,813 2,107,835
TRANSPORTATION AND PUBLIC UTILITIES All income types..............................................................................................................*41,616 4,476,116 2,615,529 16,849,056 14,832,180 33,657 *60,222 5,797,057 Passive income................................................................................-- *9 *18 61,163 24,919 -- ( ³ ) *238 High withholding tax interest................................................................................-- *21 -- 9,747 *373 -- -- -- Financial services income................................................................................** ** ** ** ** ** ** ** Shipping income................................................................................-- *3,603,791 *2,104,614 9,794,483 9,203,762 *8,817 *84 *3,807,071 Dividends from noncontrolled section 902 corp………. -- -- -- 94,928 *26,312 -- -- *743 Dividends from an IC-DISC or former DISC ¹................................................................................-- -- -- -- -- -- -- -- Miscellaneous separately calculated limitation................................................................................** ** ** ** ** ** ** ** Certain distributions from a FSC or former FSC ²................................................................................** ** ** ** ** ** ** ** General limitation income................................................................................*41,616 869,527 506,995 6,806,748 5,500,531 4,801 *60,138 1,976,082
WHOLESALE AND RETAIL TRADE All income types..............................................................................................................*21,791 2,983,585 196,739 8,143,471 5,880,777 8,652 315,244 159,090 Passive income................................................................................-- *626 *13 231,366 45,419 *63 *24,465 *82 High withholding tax interest................................................................................-- *10 *2,218 29,872 *9,078 -- *40 -- Financial services income................................................................................-- *274,325 -- *1,371,162 *564,538 -- -- -- Shipping income................................................................................** ** ** ** ** ** ** ** Dividends from noncontrolled section 902 corp………. -- -- -- 17,249 *218 -- ( ³ ) -- Dividends from an IC-DISC or former DISC ¹................................................................................-- -- -- -- -- -- -- -- Miscellaneous separately calculated limitation................................................................................** ** ** ** ** ** ** ** Certain distributions from a FSC or former FSC ²................................................................................** ** ** ** ** ** ** ** General limitation income................................................................................*21,791 2,708,624 194,508 6,486,254 5,258,794 8,589 290,738 159,008
FINANCE, INSURANCE, AND REAL ESTATE All income types..............................................................................................................169,532 46,773,056 3,040,235 70,715,971 24,358,750 551,075 1,551,966 1,008,729 Passive income................................................................................-- *26 *2,582 71,728 32,950 *150 11,279 *281 High withholding tax interest................................................................................-- *358,309 *132,624 806,082 61,108 *4 *5,800 *203 Financial services income................................................................................-- 46,188,249 2,822,086 67,898,438 22,968,615 536,909 1,495,140 726,886 Shipping income................................................................................** ** ** ** ** ** ** ** Dividends from noncontrolled section 902 corp………. -- *1,252 *9,049 151,092 25,985 -- * -5 *9,974 Dividends from an IC-DISC or former DISC ¹................................................................................-- -- -- -- -- -- -- -- Miscellaneous separately calculated limitation................................................................................** ** ** ** ** ** ** ** Certain distributions from a FSC or former FSC ²................................................................................-- -- -- *72,776 *62,066 *7,367 -- -- General limitation income................................................................................169,532 225,221 *73,893 1,707,619 1,199,792 6,644 39,752 271,385 Footnotes at end of table.
Gross income (less loss)--Continued
4 4
4
4 4

141
Corporate Foreign Tax Credit, 1997
Table 2.--U.S. Corporation Returns with a Foreign Tax Credit: Foreign Income and Tax Reported on Form 1118, by Industrial Division and Income Type--Continued[All figures are estimates based on samples--money amounts are in thousands of dollars]
Foreign income and taxes reported on Form 1118--ContinuedDeductions
Deductions allocable to specific types of incomeOil and gas Specifically Rental, royalty, and
Industrial division and income type extraction Foreign allocable licensing expenses
income branch income Total Depreciation, Service
(less loss) income [section Total depletion, expenses
863(b)] and Otheramortization
(9) (10) (11) (12) (13) (14) (15) (16)
SERVICES
All income types..............................................................................................................-- 3,524,818 1,039,026 14,864,252 9,744,488 248,114 2,249,574 3,174,195 Passive income................................................................................-- *1,695 *254 108,925 12,951 *1,005 *3,180 *2,856 High withholding tax interest................................................................................-- *293 -- 12,453 *392 -- -- *392 Financial services income................................................................................-- -- -- 154,633 *35,083 -- *27,640 *696 Shipping income................................................................................-- -- -- *105,580 *91,182 *62,259 -- -- Dividends from noncontrolled section 902 corp………. -- -- *69 28,020 *5,800 -- *5,381 -- Dividends from an IC-DISC or former DISC ¹................................................................................-- -- -- -- -- -- -- -- Miscellaneous separately calculated limitation................................................................................-- -- -- *55 *31 -- -- -- Certain distributions from a FSC or former FSC ²................................................................................-- -- -- *174,681 *174,421 -- -- -- General limitation income................................................................................-- 3,522,830 1,038,703 14,279,905 9,424,628 184,850 2,213,374 3,170,251
Footnotes at end of table.
Gross income (less loss)--Continued
4 4
4
4 4

142
Corporate Foreign Tax Credit, 1997
142
Table 2.--U.S. Corporation Returns with a Foreign Tax Credit: Foreign Income and Tax Reported on Form 1118, by Industrial Division and Income Type--Continued[All figures are estimates based on samples--money amounts are in thousands of dollars]
Foreign income and taxes reported on Form 1118--Continued
Deductions not allocable toOther specific types of income Deductions Taxable
Industrial division and income type deductions from oil income Adjustments
allocable Research and gas (less loss) to taxable
to specific Total and Interest Other extraction before incometypes of development income
5 adjustmentsincome
(17) (18) (19) (20) (21) (22) (23) (24)
ALL INDUSTRIES
All income types..............................................................................................................85,200,714 94,428,510 9,565,637 43,342,264 40,176,836 8,915,360 157,989,290 7,715,086 Passive income................................................................................687,478 1,495,288 121,376 922,728 396,393 -- 5,516,127 272,876 High withholding tax interest................................................................................76,541 823,185 3,021 615,070 202,520 -- 1,049,945 106,148 Financial services income................................................................................22,438,039 47,336,763 129,790 28,784,352 17,944,631 -- 32,390,150 928,988 Shipping income................................................................................5,699,316 707,456 *13,478 212,589 478,765 -- 1,763,587 732,350 Dividends from noncontrolled section 902 corp………. 69,053 682,118 21,132 551,970 101,067 -- 3,532,332 -138,004 Dividends from an IC-DISC or former DISC ¹................................................................................-- -- -- -- -- -- *1,029 * -41 Miscellaneous separately calculated limitation................................................................................*28,723 16,236 *1,156 *4,275 *2,086 -- 550,740 41,888 Certain distributions from a FSC or former FSC ²................................................................................3,142,374 *11,046 -- -- *11,046 -- 108,026 15,365 General limitation income................................................................................53,059,189 43,356,417 9,275,684 12,251,279 21,040,328 8,915,360 113,077,355 5,755,516
AGRICULTURE, FORESTRY, AND FISHING All income types..............................................................................................................*58,521 *39,019 *20,993 *8,934 *9,093 -- 139,972 *4,133 Passive income................................................................................-- *3,598 *166 *3,252 *180 -- *4,107 *1,129 High withholding tax interest................................................................................-- -- -- -- -- -- -- -- Financial services income................................................................................-- -- -- -- -- -- -- -- Shipping income................................................................................-- -- -- -- -- -- -- -- Dividends from noncontrolled section 902 corp………. -- *1,086 *299 *725 *62 -- *2,260 *252 Dividends from an IC-DISC or former DISC ¹................................................................................-- -- -- -- -- -- -- -- Miscellaneous separately calculated limitation................................................................................-- -- -- -- -- -- -- -- Certain distributions from a FSC or former FSC ²................................................................................** ** ** ** ** ** ** ** General limitation income................................................................................*44,783 *34,336 *20,529 *4,956 *8,851 -- 133,604 *2,752
MINING All income types..............................................................................................................2,748,435 933,715 *38,287 302,159 589,613 1,032,644 3,159,297 288,600 Passive income................................................................................*9,335 10,407 *68 4,207 *5,583 -- 52,039 *388 High withholding tax interest................................................................................** ** ** ** ** ** ** ** Financial services income................................................................................** ** ** ** ** ** ** ** Shipping income................................................................................-- -- -- -- -- -- -- -- Dividends from noncontrolled section 902 corp………. -- *7,305 -- *5,485 *1,819 -- *13,388 * -148 Dividends from an IC-DISC or former DISC ¹................................................................................-- -- -- -- -- -- -- -- Miscellaneous separately calculated limitation................................................................................-- -- -- -- -- -- -- -- Certain distributions from a FSC or former FSC ²................................................................................-- -- -- -- -- -- -- -- General limitation income................................................................................2,738,886 913,134 *38,219 291,044 580,764 1,032,644 3,052,691 288,290
CONSTRUCTION All income types..............................................................................................................94,524 66,011 *1,015 *9,348 *34,612 -- 155,458 *6,287 Passive income................................................................................*43 *1,696 -- *560 *1,118 -- 12,145 -- High withholding tax interest................................................................................** ** ** ** ** ** ** ** Financial services income................................................................................-- -- -- -- -- -- -- -- Shipping income................................................................................-- -- -- -- -- -- -- -- Dividends from noncontrolled section 902 corp………. *105 *356 -- *324 *32 -- *10,328 * -200 Dividends from an IC-DISC or former DISC ¹................................................................................-- -- -- -- -- -- -- -- Miscellaneous separately calculated limitation................................................................................-- -- -- -- -- -- -- -- Certain distributions from a FSC or former FSC ²................................................................................** ** ** ** ** ** ** ** General limitation income................................................................................51,822 63,931 *1,015 *8,443 *33,455 -- 132,874 *6,487 Footnotes at end of table.
Deductions--Continued

143
Corporate Foreign Tax Credit, 1997
Table 2.--U.S. Corporation Returns with a Foreign Tax Credit: Foreign Income and Tax Reported on Form 1118, by Industrial Division and Income Type--Continued[All figures are estimates based on samples--money amounts are in thousands of dollars]
Foreign income and taxes reported on Form 1118--Continued
Deductions not allocable toOther specific types of income Deductions Taxable
Industrial division and income type deductions from oil income Adjustments
allocable Research and gas (less loss) to taxable
to specific Total and Interest Other extraction before incometypes of development income 5 adjustments
income
(17) (18) (19) (20) (21) (22) (23) (24)
MANUFACTURING
All income types..............................................................................................................42,640,613 37,633,211 7,834,168 12,397,235 16,818,994 7,836,010 102,821,437 4,235,398 Passive income................................................................................605,460 1,122,644 118,708 696,692 301,145 -- 4,383,220 244,344 High withholding tax interest................................................................................12,029 33,274 538 26,925 4,354 -- 153,252 1,098 Financial services income................................................................................1,638,440 1,476,905 25,185 1,358,997 90,770 -- 2,960,174 -172,838 Shipping income................................................................................274,284 100,841 *4,896 85,240 10,705 -- 87,863 -7,733 Dividends from noncontrolled section 902 corp………. 26,726 440,397 19,593 361,015 55,248 -- 1,235,180 -164,380 Dividends from an IC-DISC or former DISC ¹................................................................................-- -- -- -- -- -- *1,029 * -41 Miscellaneous separately calculated limitation................................................................................*4,728 *10,838 *294 *1,403 *422 -- 57,549 -8,608 Certain distributions from a FSC or former FSC ²................................................................................2,853,381 *76 -- -- *76 -- *58,127 15,634 General limitation income................................................................................37,225,567 34,448,236 7,664,954 9,866,963 16,356,274 7,836,010 93,885,045 4,327,921
TRANSPORTATION AND PUBLIC UTILITIES All income types..............................................................................................................8,941,243 2,016,875 *57,203 1,002,896 951,350 35,759 5,372,629 941,262 Passive income................................................................................24,682 36,244 *559 34,271 1,413 -- 114,055 -7,552 High withholding tax interest................................................................................*373 *9,374 -- *4,378 *4,996 -- 8,534 * -1,120 Financial services income................................................................................** ** ** ** ** ** ** ** Shipping income................................................................................*5,387,789 590,721 *8,582 114,097 *465,418 -- 1,694,643 772,737 Dividends from noncontrolled section 902 corp………. *25,569 68,616 *4 65,781 *2,831 -- 731,528 29,567 Dividends from an IC-DISC or former DISC ¹................................................................................-- -- -- -- -- -- -- -- Miscellaneous separately calculated limitation................................................................................** ** ** ** ** ** ** ** Certain distributions from a FSC or former FSC ²................................................................................** ** ** ** ** ** ** ** General limitation income................................................................................3,459,510 1,306,217 *47,714 779,768 475,933 *35,759 2,395,920 116,018
WHOLESALE AND RETAIL TRADE All income types..............................................................................................................5,397,790 2,262,694 24,693 1,459,232 719,208 *10,947 5,777,769 910,079 Passive income................................................................................20,809 185,947 *531 88,500 69,533 -- 260,060 12,105 High withholding tax interest................................................................................*9,038 20,794 *732 16,057 *3,569 -- 92,519 *58,974 Financial services income................................................................................*564,538 *806,624 -- *804,470 *2,154 -- *816,035 *455,180 Shipping income................................................................................** ** ** ** ** ** ** ** Dividends from noncontrolled section 902 corp………. *218 17,031 *12 13,016 3,844 -- 34,741 -1,142 Dividends from an IC-DISC or former DISC ¹................................................................................-- -- -- -- -- -- -- -- Miscellaneous separately calculated limitation................................................................................** ** ** ** ** ** ** ** Certain distributions from a FSC or former FSC ²................................................................................** ** ** ** ** ** ** ** General limitation income................................................................................4,800,458 1,227,460 22,814 534,673 638,390 *10,947 4,524,501 381,000
FINANCE, INSURANCE, AND REAL ESTATE All income types..............................................................................................................21,246,980 46,357,221 *106,260 27,300,990 18,442,444 -- 31,905,032 717,773 Passive income................................................................................21,240 38,778 -- 14,379 8,062 -- 521,833 7,506 High withholding tax interest................................................................................55,101 744,974 *1,751 554,583 188,072 -- 738,607 46,998 Financial services income................................................................................20,209,680 44,929,823 *104,493 26,556,947 17,792,598 -- 28,556,772 660,579 Shipping income................................................................................** ** ** ** ** ** ** ** Dividends from noncontrolled section 902 corp………. 16,016 125,107 ( ³ ) 90,675 32,015 -- 743,499 -17,085 Dividends from an IC-DISC or former DISC ¹................................................................................-- -- -- -- -- -- -- -- Miscellaneous separately calculated limitation................................................................................** ** ** ** ** ** ** ** Certain distributions from a FSC or former FSC ²................................................................................*54,699 *10,710 -- -- *10,710 -- *50,160 *115 General limitation income................................................................................882,011 507,826 *16 84,403 410,986 -- 1,290,488 29,219 Footnotes at end of table.
Deductions--Continued

144
Corporate Foreign Tax Credit, 1997
144
Table 2.--U.S. Corporation Returns with a Foreign Tax Credit: Foreign Income and Tax Reported on Form 1118, by Industrial Division and Income Type--Continued[All figures are estimates based on samples--money amounts are in thousands of dollars]
Foreign income and taxes reported on Form 1118--Continued
Deductions not allocable toOther specific types of income Deductions Taxable
Industrial division and income type deductions from oil income Adjustments
allocable Research and gas (less loss) to taxable
to specific Total and Interest Other extraction before incometypes of development income
5 adjustmentsincome
(17) (18) (19) (20) (21) (22) (23) (24)
SERVICES
All income types..............................................................................................................4,072,605 5,119,764 1,483,018 861,470 2,611,521 -- 8,657,696 611,554 Passive income................................................................................5,910 95,974 *1,344 80,867 9,359 -- 168,669 14,955 High withholding tax interest................................................................................( ³ ) 12,061 -- *11,735 *214 -- 16,213 *127 Financial services income................................................................................*6,747 *119,550 *28 *60,716 *58,554 -- 55,320 *1,297 Shipping income................................................................................*28,923 *14,397 -- *12,177 *2,220 -- * -23,529 * -23,529 Dividends from noncontrolled section 902 corp………. *419 22,220 *1,224 14,949 5,215 -- 761,408 15,132 Dividends from an IC-DISC or former DISC ¹................................................................................-- -- -- -- -- -- -- -- Miscellaneous separately calculated limitation................................................................................*31 *25 -- -- *25 -- *17,643 *2 Certain distributions from a FSC or former FSC ²................................................................................*174,421 *260 -- -- *260 -- * -260 * -260 General limitation income................................................................................3,856,154 4,855,276 1,480,423 681,027 2,535,674 -- 7,662,232 603,829
Footnotes at end of table.
Deductions--Continued

145
Corporate Foreign Tax Credit, 1997
Table 2.--U.S. Corporation Returns with a Foreign Tax Credit: Foreign Income and Tax Reported on Form 1118, by Industrial Division and Income Type--Continued[All figures are estimates based on samples--money amounts are in thousands of dollars]
Foreign income and taxes reported on Form 1118--Continued
Foreign taxes available for credit
Taxable Foreign taxes paid or accrued
Industrial division and income type income Reduction
(less loss) Total for certain Carryover Total Taxes
after foreign Total withheld atadjustments taxes source on
dividends
(25) (26) (27) (28) (29) (30) (31)
ALL INDUSTRIES
All income types..............................................................................................................150,274,204 49,979,466 2,516,340 7,416,008 45,079,798 16,056,942 2,767,327 Passive income................................................................................5,243,251 791,754 -- 38,315 753,440 207,992 93,869 High withholding tax interest................................................................................943,797 353,841 -- 105,625 248,216 217,934 2,516 Financial services income................................................................................31,461,161 7,607,076 -- 658,425 6,948,651 4,000,803 324,094 Shipping income................................................................................1,031,236 134,447 -- 37,507 96,940 38,917 *2,079 Dividends from noncontrolled section 902 corp………. 3,670,337 1,896,351 -- 499,917 1,396,434 109,911 75,997 Dividends from an IC-DISC or former DISC ¹................................................................................*1,070 -- -- -- -- -- -- Miscellaneous separately calculated limitation................................................................................508,852 157,924 ( ³ ) *3,730 154,195 *136,081 2,252 Certain distributions from a FSC or former FSC ²................................................................................92,661 *112 -- *10 *102 ( ³ ) ( ³ ) General limitation income................................................................................107,321,839 39,037,960 2,516,340 6,072,479 35,481,821 11,345,304 2,266,519
AGRICULTURE, FORESTRY, AND FISHING All income types..............................................................................................................135,839 38,313 -- *3,837 34,476 12,702 2,521 Passive income................................................................................*2,979 *542 -- *36 *506 *41 *39 High withholding tax interest................................................................................-- -- -- -- -- -- -- Financial services income................................................................................-- -- -- -- -- -- -- Shipping income................................................................................-- -- -- -- -- -- -- Dividends from noncontrolled section 902 corp………. *2,008 *1,758 -- *1,421 *337 *74 *74 Dividends from an IC-DISC or former DISC ¹................................................................................-- -- -- -- -- -- -- Miscellaneous separately calculated limitation................................................................................-- -- -- -- -- -- -- Certain distributions from a FSC or former FSC ²................................................................................** ** ** ** ** ** ** General limitation income................................................................................130,852 36,013 -- *2,379 33,634 *12,587 *2,408
MINING All income types..............................................................................................................2,870,696 1,416,118 444,333 562,043 1,298,408 1,018,859 53,846 Passive income................................................................................51,650 *4,655 -- *705 3,950 3,185 *28 High withholding tax interest................................................................................** ** ** ** ** ** ** Financial services income................................................................................** ** ** ** ** ** ** Shipping income................................................................................-- -- -- -- -- -- -- Dividends from noncontrolled section 902 corp………. *13,536 *3,826 -- *9 *3,817 *2,824 *2,824 Dividends from an IC-DISC or former DISC ¹................................................................................-- -- -- -- -- -- -- Miscellaneous separately calculated limitation................................................................................-- -- -- -- -- -- -- Certain distributions from a FSC or former FSC ²................................................................................-- -- -- -- -- -- -- General limitation income................................................................................2,764,401 1,400,421 444,333 558,578 1,286,175 1,010,203 50,994
CONSTRUCTION All income types..............................................................................................................149,171 63,431 -- 15,329 48,103 32,014 1,490 Passive income................................................................................12,145 835 -- 37 798 577 21 High withholding tax interest................................................................................** ** ** ** ** ** ** Financial services income................................................................................-- -- -- -- -- -- -- Shipping income................................................................................-- -- -- -- -- -- -- Dividends from noncontrolled section 902 corp………. *10,528 3,875 -- 41 3,834 238 *211 Dividends from an IC-DISC or former DISC ¹................................................................................-- -- -- -- -- -- -- Miscellaneous separately calculated limitation................................................................................-- -- -- -- -- -- -- Certain distributions from a FSC or former FSC ²................................................................................** ** ** ** ** ** ** General limitation income................................................................................126,387 58,701 -- 15,250 43,450 31,178 *1,258 Footnotes at end of table.
Foreign taxes paid, accrued, and deemed paid

146
Corporate Foreign Tax Credit, 1997
146
Table 2.--U.S. Corporation Returns with a Foreign Tax Credit: Foreign Income and Tax Reported on Form 1118, by Industrial Division and Income Type--Continued[All figures are estimates based on samples--money amounts are in thousands of dollars]
Foreign income and taxes reported on Form 1118--ContinuedForeign taxes available for credit
Taxable Foreign taxes paid or accrued
Industrial division and income type income Reduction
(less loss) Total for certain Carryover Total Taxes
after foreign Total withheld at
adjustments taxes source on
dividends
(25) (26) (27) (28) (29) (30) (31)
MANUFACTURING
All income types..............................................................................................................98,586,039 35,792,177 2,059,580 5,450,727 32,401,030 9,367,486 2,203,741 Passive income................................................................................4,138,876 652,673 -- 29,460 623,213 156,394 78,191 High withholding tax interest................................................................................152,154 35,805 -- 6,129 29,676 29,107 *134 Financial services income................................................................................3,133,012 1,326,286 -- 116,124 1,210,162 243,829 *27,931 Shipping income................................................................................95,595 23,223 -- 11,127 12,096 3,922 *614 Dividends from noncontrolled section 902 corp………. 1,399,560 950,359 -- 378,785 571,573 81,520 53,911 Dividends from an IC-DISC or former DISC ¹................................................................................*1,070 -- -- -- -- -- -- Miscellaneous separately calculated limitation................................................................................66,157 7,917 -- 535 7,382 1,667 *125 Certain distributions from a FSC or former FSC ²................................................................................42,492 112 -- 10 102 -- -- General limitation income................................................................................89,557,124 32,795,803 2,059,580 4,908,557 29,946,825 8,851,045 2,042,834
TRANSPORTATION AND PUBLIC UTILITIES All income types..............................................................................................................4,431,367 969,683 122 97,772 872,033 286,757 22,552 Passive income................................................................................121,607 11,210 -- 607 10,603 3,488 479 High withholding tax interest................................................................................9,654 1,776 -- 138 1,638 1,638 -- Financial services income................................................................................** ** ** ** ** ** ** Shipping income................................................................................921,906 110,993 -- 26,380 84,613 34,986 *1,457 Dividends from noncontrolled section 902 corp………. 701,961 273,381 -- 1,902 271,479 5,427 *5,413 Dividends from an IC-DISC or former DISC ¹................................................................................-- -- -- -- -- -- -- Miscellaneous separately calculated limitation................................................................................** ** ** ** ** ** ** Certain distributions from a FSC or former FSC ²................................................................................** ** ** ** ** ** ** General limitation income................................................................................2,279,903 443,210 122 68,436 374,897 112,415 14,278
WHOLESALE AND RETAIL TRADE All income types..............................................................................................................4,867,690 1,894,147 ( ³ ) 237,214 1,656,933 535,490 90,146 Passive income................................................................................247,955 37,293 -- 1,851 35,442 19,531 4,033 High withholding tax interest................................................................................33,544 22,563 -- *427 22,136 18,715 *9 Financial services income................................................................................*360,855 *118,903 -- *815 *118,088 *62,853 *18,381 Shipping income................................................................................** ** ** ** ** ** ** Dividends from noncontrolled section 902 corp………. 35,883 22,263 -- 7,746 14,517 1,963 1,963 Dividends from an IC-DISC or former DISC ¹................................................................................-- -- -- -- -- -- -- Miscellaneous separately calculated limitation................................................................................** ** ** ** ** ** ** Certain distributions from a FSC or former FSC ²................................................................................** ** ** ** ** ** ** General limitation income................................................................................4,143,501 1,675,368 -- 223,180 1,452,189 430,356 63,687
FINANCE, INSURANCE, AND REAL ESTATE All income types..............................................................................................................31,187,259 7,370,111 *12,176 809,000 6,573,288 3,936,806 319,619 Passive income................................................................................514,326 72,828 -- 4,278 68,550 20,480 10,023 High withholding tax interest................................................................................691,609 282,259 -- 95,646 186,613 162,140 *1,909 Financial services income................................................................................27,896,193 6,147,237 -- 540,662 5,606,575 3,685,426 276,689 Shipping income................................................................................** ** ** ** ** ** ** Dividends from noncontrolled section 902 corp………. 760,584 351,081 -- 91,770 259,310 15,983 9,723 Dividends from an IC-DISC or former DISC ¹................................................................................-- -- -- -- -- -- -- Miscellaneous separately calculated limitation................................................................................** ** ** ** ** ** ** Certain distributions from a FSC or former FSC ²................................................................................*50,045 ( ³ ) -- -- ( ³ ) ( ³ ) ( ³ ) General limitation income................................................................................1,261,269 516,566 *12,176 76,645 452,098 52,769 21,267 Footnotes at end of table.
Foreign taxes paid, accrued, and deemed paid

147
Corporate Foreign Tax Credit, 1997
Table 2.--U.S. Corporation Returns with a Foreign Tax Credit: Foreign Income and Tax Reported on Form 1118, by Industrial Division and Income Type--Continued[All figures are estimates based on samples--money amounts are in thousands of dollars]
Foreign income and taxes reported on Form 1118--ContinuedForeign taxes available for credit
Taxable Foreign taxes paid or accrued
Industrial division and income type income Reduction
(less loss) Total for certain Carryover Total Taxes
after foreign Total withheld at
adjustments taxes source ondividends
(25) (26) (27) (28) (29) (30) (31)
SERVICES
All income types..............................................................................................................8,046,142 2,435,487 *129 240,087 2,195,529 866,829 73,412 Passive income................................................................................153,713 11,719 -- *1,341 10,378 4,297 1,055 High withholding tax interest................................................................................16,086 4,202 -- *535 3,667 3,667 *463 Financial services income................................................................................54,023 12,672 -- *515 *12,157 *7,027 *168 Shipping income................................................................................-- *1 -- *1 -- -- -- Dividends from noncontrolled section 902 corp………. 746,276 289,808 -- 18,241 271,567 1,881 1,878 Dividends from an IC-DISC or former DISC ¹................................................................................-- -- -- -- -- -- -- Miscellaneous separately calculated limitation................................................................................*17,641 *5,206 -- -- *5,206 *5,206 *55 Certain distributions from a FSC or former FSC ²................................................................................-- -- -- -- -- -- -- General limitation income................................................................................7,058,403 2,111,878 *129 219,454 1,892,553 844,750 69,793
Footnotes at end of table.
Foreign taxes paid, accrued, and deemed paid

148
Corporate Foreign Tax Credit, 1997
148
Table 2.--U.S. Corporation Returns with a Foreign Tax Credit: Foreign Income and Tax Reported on Form 1118, by Industrial Division and Income Type--Continued[All figures are estimates based on samples--money amounts are in thousands of dollars]
Foreign income and taxes reported on Form 1118--Continued
Foreign taxes available for credit--Continued
Foreign taxes paid or accrued--Continued
Industrial division and income type Taxes withheld at source on-- Other taxes paid or accrued on--
Rents, Specifically Taxes
royalties, Branch allocable Service Other deemedInterest and license income income income income paid
fees [section 863(b)]
(32) (33) (34) (35) (36) (37) (38)
ALL INDUSTRIES
All income types..............................................................................................................640,883 2,238,232 6,063,443 29,802 292,786 4,024,468 29,022,856 Passive income................................................................................24,133 37,246 13,337 *85 1,931 37,391 545,447 High withholding tax interest................................................................................215,266 -- -- -- -- *152 30,281 Financial services income................................................................................279,275 12,994 2,492,839 *40 75,259 816,302 2,947,847 Shipping income................................................................................*244 *2,291 *14,239 *6,744 *7,372 *5,948 58,023 Dividends from noncontrolled section 902 corp………. *27 *532 *456 -- -- 32,899 1,286,523 Dividends from an IC-DISC or former DISC ¹................................................................................-- -- -- -- -- -- -- Miscellaneous separately calculated limitation................................................................................-- -- -- -- -- *133,829 *18,114 Certain distributions from a FSC or former FSC ²................................................................................-- -- -- -- -- -- *102 General limitation income................................................................................121,939 2,185,169 3,542,571 22,933 208,224 2,997,948 24,136,517
AGRICULTURE, FORESTRY, AND FISHING All income types..............................................................................................................*484 *3,076 *1,724 -- -- *4,897 21,774 Passive income................................................................................*2 -- -- -- -- -- 465 High withholding tax interest................................................................................-- -- -- -- -- -- -- Financial services income................................................................................-- -- -- -- -- -- -- Shipping income................................................................................-- -- -- -- -- -- -- Dividends from noncontrolled section 902 corp………. -- -- -- -- -- -- *263 Dividends from an IC-DISC or former DISC ¹................................................................................-- -- -- -- -- -- -- Miscellaneous separately calculated limitation................................................................................-- -- -- -- -- -- -- Certain distributions from a FSC or former FSC ²................................................................................** ** ** ** ** ** ** General limitation income................................................................................*482 *3,076 *1,724 -- -- *4,897 21,047
MINING All income types..............................................................................................................9,917 12,595 286,739 -- *12,908 642,854 279,548 Passive income................................................................................*692 *1,036 *78 -- -- *1,351 *765 High withholding tax interest................................................................................** ** ** ** ** ** ** Financial services income................................................................................** ** ** ** ** ** ** Shipping income................................................................................-- -- -- -- -- -- -- Dividends from noncontrolled section 902 corp………. -- -- -- -- -- -- *993 Dividends from an IC-DISC or former DISC ¹................................................................................-- -- -- -- -- -- -- Miscellaneous separately calculated limitation................................................................................-- -- -- -- -- -- -- Certain distributions from a FSC or former FSC ²................................................................................-- -- -- -- -- -- -- General limitation income................................................................................6,577 11,559 286,661 -- *12,908 641,503 275,973
CONSTRUCTION All income types..............................................................................................................*490 835 *4,455 -- 22,826 1,918 *16,088 Passive income................................................................................*355 *123 -- -- -- *78 *221 High withholding tax interest................................................................................** ** ** ** ** ** ** Financial services income................................................................................-- -- -- -- -- -- -- Shipping income................................................................................-- -- -- -- -- -- -- Dividends from noncontrolled section 902 corp………. -- -- -- -- -- *28 *3,595 Dividends from an IC-DISC or former DISC ¹................................................................................-- -- -- -- -- -- -- Miscellaneous separately calculated limitation................................................................................-- -- -- -- -- -- -- Certain distributions from a FSC or former FSC ²................................................................................** ** ** ** ** ** ** General limitation income................................................................................*115 *712 *4,455 -- 22,826 *1,812 *12,272 Footnotes at end of table.
Foreign taxes paid, accrued, and deemed paid--Continued

149
Corporate Foreign Tax Credit, 1997
Table 2.--U.S. Corporation Returns with a Foreign Tax Credit: Foreign Income and Tax Reported on Form 1118, by Industrial Division and Income Type--Continued[All figures are estimates based on samples--money amounts are in thousands of dollars]
Foreign income and taxes reported on Form 1118--ContinuedForeign taxes available for credit--Continued
Foreign taxes paid or accrued--Continued
Industrial division and income type Taxes withheld at source on-- Other taxes paid or accrued on--
Rents, Specifically Taxes
royalties, Branch allocable Service Other deemed
Interest and license income income income income paid
fees [section 863(b)]
(32) (33) (34) (35) (36) (37) (38)
MANUFACTURING
All income types..............................................................................................................140,905 1,580,966 2,945,132 15,116 83,972 2,397,654 23,033,544 Passive income................................................................................18,226 20,183 12,428 *85 *24 27,258 466,819 High withholding tax interest................................................................................28,973 -- -- -- -- -- *569 Financial services income................................................................................*1,705 *3,067 *22,011 -- *904 *188,212 966,332 Shipping income................................................................................*117 -- -- -- -- *3,192 *8,174 Dividends from noncontrolled section 902 corp………. *12 *530 *456 -- -- 26,611 490,053 Dividends from an IC-DISC or former DISC ¹................................................................................-- -- -- -- -- -- -- Miscellaneous separately calculated limitation................................................................................-- -- -- -- -- *1,542 *5,715 Certain distributions from a FSC or former FSC ²................................................................................-- -- -- -- -- -- *102 General limitation income................................................................................91,873 1,557,185 2,910,237 15,031 83,045 2,150,840 21,095,780
TRANSPORTATION AND PUBLIC UTILITIES All income types..............................................................................................................7,467 21,541 36,575 *6,887 22,252 169,482 585,276 Passive income................................................................................*477 -- -- -- *1,765 *768 7,115 High withholding tax interest................................................................................1,638 -- -- -- -- -- -- Financial services income................................................................................** ** ** ** ** ** ** Shipping income................................................................................*127 *2,291 *14,239 *6,744 *7,372 *2,756 *49,627 Dividends from noncontrolled section 902 corp………. *14 -- -- -- -- -- 266,052 Dividends from an IC-DISC or former DISC ¹................................................................................-- -- -- -- -- -- -- Miscellaneous separately calculated limitation................................................................................** ** ** ** ** ** ** Certain distributions from a FSC or former FSC ²................................................................................** ** ** ** ** ** ** General limitation income................................................................................5,212 19,251 21,723 *143 12,985 38,824 262,482
WHOLESALE AND RETAIL TRADE All income types..............................................................................................................31,323 123,960 254,711 -- 9,568 25,781 1,121,443 Passive income................................................................................1,412 13,920 *25 -- *22 *119 15,911 High withholding tax interest................................................................................18,705 -- -- -- -- -- *3,421 Financial services income................................................................................*3,837 -- *40,631 -- -- *4 *55,235 Shipping income................................................................................** ** ** ** ** ** ** Dividends from noncontrolled section 902 corp………. -- -- -- -- -- -- 12,554 Dividends from an IC-DISC or former DISC ¹................................................................................-- -- -- -- -- -- -- Miscellaneous separately calculated limitation................................................................................** ** ** ** ** ** ** Certain distributions from a FSC or former FSC ²................................................................................** ** ** ** ** ** ** General limitation income................................................................................7,369 110,041 214,055 -- 9,546 25,658 1,021,833
FINANCE, INSURANCE, AND REAL ESTATE All income types..............................................................................................................435,813 15,362 2,435,572 *40 83,257 647,142 2,636,482 Passive income................................................................................2,395 *260 *329 -- *77 7,395 48,071 High withholding tax interest................................................................................160,078 -- -- -- -- *152 *24,474 Financial services income................................................................................271,045 9,785 2,429,584 *40 74,168 624,115 1,921,150 Shipping income................................................................................** ** ** ** ** ** ** Dividends from noncontrolled section 902 corp………. -- -- -- -- -- *6,261 243,327 Dividends from an IC-DISC or former DISC ¹................................................................................-- -- -- -- -- -- -- Miscellaneous separately calculated limitation................................................................................** ** ** ** ** ** ** Certain distributions from a FSC or former FSC ²................................................................................-- -- -- -- -- -- -- General limitation income................................................................................2,295 5,317 5,659 -- 9,012 9,219 399,328 Footnotes at end of table.
Foreign taxes paid, accrued, and deemed paid--Continued

150
Corporate Foreign Tax Credit, 1997
150
Table 2.--U.S. Corporation Returns with a Foreign Tax Credit: Foreign Income and Tax Reported on Form 1118, by Industrial Division and Income Type--Continued[All figures are estimates based on samples--money amounts are in thousands of dollars]
Foreign income and taxes reported on Form 1118--ContinuedForeign taxes available for credit--Continued
Foreign taxes paid or accrued--Continued
Industrial division and income type Taxes withheld at source on-- Other taxes paid or accrued on--
Rents, Specifically Taxes
royalties, Branch allocable Service Other deemed
Interest and license income income income income paidfees [section 863(b)]
(32) (33) (34) (35) (36) (37) (38)
SERVICES
All income types..............................................................................................................14,485 479,897 98,535 *7,759 58,002 134,739 1,328,700 Passive income................................................................................576 1,724 *478 -- *43 *422 6,081 High withholding tax interest................................................................................3,204 -- -- -- -- -- -- Financial services income................................................................................*2,688 *142 -- -- *57 *3,971 *5,130 Shipping income................................................................................-- -- -- -- -- -- -- Dividends from noncontrolled section 902 corp………. *1 *2 -- -- -- -- 269,686 Dividends from an IC-DISC or former DISC ¹................................................................................-- -- -- -- -- -- -- Miscellaneous separately calculated limitation................................................................................-- -- -- -- -- *5,152 ( ³ ) Certain distributions from a FSC or former FSC ²................................................................................-- -- -- -- -- -- -- General limitation income................................................................................8,016 478,028 98,057 *7,759 57,902 125,194 1,047,804
* Data should be used with caution because of the small number of returns on which they were based. ** Not shown to avoid disclosure of information about specific taxpayers. However, the data are included in the appropriate totals. ¹ Interest-Charge Domestic International Sales Corporation (IC-DISC) and Domestic International Sales Corporation (DISC). ² Foreign Sales Corporation (FSC). ³ Less than $500. Included in gross income (less loss), columns 2-8. Included in deductions, columns 12-21. NOTE: Detail may not add to totals because of rounding.
Foreign taxes paid, accrued, and deemed paid--Continued
4
5

151
Corporate Foreign Tax Credit, 1997
Table 3.--U.S. Corporation Returns with a Foreign Tax Credit: Foreign Income and Tax Reportedon Form 1118, by Selected Country to Which Foreign Tax Was Paid[All figures are estimates based on samples--money amounts are in thousands of dollars]
Foreign income and taxes reported on Form 1118
Gross income (less loss)
Foreign
Selected country Number of dividend income Rents,returns Total Dividends resulting from Interest royalties,
foreign taxes anddeemed paid license fees
(gross-up)
(1) (2) (3) (4) (5) (6)
All countries.....................................................................................................................6,569 359,898,600 68,480,746 29,020,456 61,505,751 48,610,292
Canada.....................................................................................................................2,021 27,612,506 6,957,260 4,788,555 4,364,665 2,996,418
Latin America, total.....................................................................................................................1,422 38,647,969 7,713,452 2,160,036 10,039,766 3,515,659 Mexico......................................................................................................... 948 8,609,287 1,524,863 687,938 1,484,816 1,192,777 Central America, total.........................................................................................................300 1,416,661 306,098 48,762 261,021 147,513 Belize..................................................................................................... 41 40,118 *3,008 *64 *586 *26,331 Costa Rica.....................................................................................................152 124,531 18,083 3,579 15,080 31,698 El Salvador.....................................................................................................107 188,967 7,689 *2,965 43,331 14,150 Guatemala.....................................................................................................142 262,725 25,023 8,462 38,511 19,486 Honduras.....................................................................................................105 77,093 *5,878 *3,795 5,962 5,248 Nicaragua.....................................................................................................59 33,374 *11 *5 4,538 1,088 Panama.....................................................................................................195 684,831 246,405 29,892 153,014 49,513 Caribbean countries, total.........................................................................................................346 3,297,056 1,051,409 112,234 694,369 135,529 Cayman Islands (British).....................................................................................................186 1,721,166 879,227 60,340 625,418 89,272 Dominican Republic.....................................................................................................119 299,310 61,966 21,320 34,270 14,802 Haiti..................................................................................................... 37 74,360 *5,041 *638 *1,306 *854 Jamaica.....................................................................................................105 143,907 *5,772 *4,892 14,161 18,618 Trinidad and Tobago.....................................................................................................107 683,366 29,183 *6,574 13,468 6,615 Other Caribbean countries.....................................................................................................106 374,948 70,219 18,470 5,746 5,368 South America, total.........................................................................................................869 20,250,271 4,831,082 1,311,101 4,762,498 1,925,249 Argentina.....................................................................................................470 4,457,984 423,107 195,085 1,694,589 432,424 Bolivia..................................................................................................... 93 93,988 *3,318 *1,960 10,654 7,583 Brazil..................................................................................................... 523 8,641,685 3,114,325 908,341 1,896,461 973,054 Chile..................................................................................................... 323 2,249,046 740,818 40,601 553,376 114,178 Colombia.....................................................................................................306 1,859,778 140,603 60,652 140,519 117,100 Ecuador.....................................................................................................195 308,242 19,463 3,700 40,352 20,817 Paraguay.....................................................................................................70 55,853 *2,171 *716 *6,039 7,508 Peru..................................................................................................... 228 824,476 73,695 29,047 172,633 46,964 Uruguay.....................................................................................................116 214,312 43,331 6,521 78,959 14,951 Venezuela.....................................................................................................337 1,425,201 268,234 62,798 168,762 189,563 Other South America.....................................................................................................47 119,705 *2,016 *1,680 *154 *1,108 Latin America not allocable.........................................................................................................18 5,074,694 -- -- *2,837,062 *114,590
Other Western Hemisphere, total.....................................................................................................................347 8,193,575 2,326,003 181,696 1,937,062 70,374 Bahamas.........................................................................................................106 3,197,883 309,171 13,101 1,074,725 5,938 Bermuda.........................................................................................................209 2,863,323 1,582,682 113,162 757,135 29,872 Netherlands Antilles.........................................................................................................79 511,562 345,215 33,526 69,810 8,387 Other British West Indies.........................................................................................................131 219,256 86,431 20,307 30,150 21,876 All other Western Hemisphere.........................................................................................................61 1,401,551 *2,505 *1,599 *5,243 4,301
Europe, total.....................................................................................................................2,570 138,694,624 35,098,049 15,241,896 23,947,037 21,143,159 European Union, total.........................................................................................................2,486 121,236,653 28,801,773 14,005,507 22,797,042 19,509,169 Austria..................................................................................................... 239 906,511 264,758 128,066 70,600 240,670 Belgium.....................................................................................................371 5,937,525 1,504,825 706,151 717,541 787,061 Denmark.....................................................................................................250 997,811 116,851 85,067 49,927 243,554 Finland.....................................................................................................220 724,270 92,424 29,814 75,884 253,614 France.....................................................................................................604 8,527,013 1,998,102 1,091,350 750,162 2,562,930 Germany.....................................................................................................662 15,030,010 3,666,345 2,458,264 1,256,570 3,816,546 Greece.....................................................................................................182 840,785 40,748 22,158 507,113 76,695 Ireland.....................................................................................................247 4,361,949 895,847 109,915 198,496 2,533,007 Italy..................................................................................................... 534 6,114,891 1,408,794 1,073,049 1,061,272 1,162,699 Luxembourg.....................................................................................................82 721,433 363,301 189,300 32,014 65,118 Footnotes at end of table.

152
Corporate Foreign Tax Credit, 1997
152
Table 3.--U.S. Corporation Returns with a Foreign Tax Credit: Foreign Income and Tax Reportedon Form 1118, by Selected Country to Which Foreign Tax Was Paid--Continued[All figures are estimates based on samples--money amounts are in thousands of dollars]
Foreign income and taxes reported on Form 1118
Gross income (less loss)
Foreign
Selected country Number of dividend income Rents,returns Total Dividends resulting from Interest royalties,
foreign taxes anddeemed paid license fees
(gross-up)
(1) (2) (3) (4) (5) (6)
Europe--continued European Union--continued Netherlands.....................................................................................................826 12,338,820 4,970,694 2,511,824 499,714 2,123,467 Portugal.....................................................................................................193 539,247 173,816 52,957 14,758 167,725 Spain..................................................................................................... 542 3,219,432 909,143 534,569 439,952 881,579 Sweden.....................................................................................................386 1,998,485 584,443 300,474 180,430 486,407 United Kingdom.....................................................................................................1,691 58,929,455 11,811,300 4,712,471 16,942,608 4,105,740 European Union, not allocable.....................................................................................................4 *49,015 *382 *78 -- *2,358
Other West European countries, total.........................................................................................................515 12,340,246 5,891,495 1,128,819 845,439 1,023,511 Liechtenstein.....................................................................................................15 10,995 *9,600 *264 *2 *30 Monaco.....................................................................................................14 17,007 *83 *36 *1,235 *9 Norway.....................................................................................................223 3,133,427 529,257 256,494 203,069 146,432 Switzerland.....................................................................................................394 8,203,643 5,256,597 827,963 248,926 720,656 Turkey..................................................................................................... 197 899,802 92,341 43,037 377,615 144,416 Other West European countries.....................................................................................................69 37,160 *3,618 *1,024 14,592 9,271 West European countries not allocable.....................................................................................................4 *38,211 -- -- -- *2,697 East European countries, total.........................................................................................................341 2,917,101 404,531 107,569 304,550 572,214 Romania.....................................................................................................57 76,978 *12,558 *11,200 14,340 9,100 Former Soviet Union.....................................................................................................217 1,586,555 238,739 *21,287 224,095 171,891 Other East Europe.....................................................................................................264 1,253,568 153,233 75,082 66,115 391,223 Europe not allocable.........................................................................................................29 2,200,624 *251 -- *6 *38,265
Africa, total.....................................................................................................................504 5,858,919 930,572 322,168 350,788 509,306
North Africa, total.........................................................................................................166 1,487,901 72,707 24,027 103,845 49,853 Algeria..................................................................................................... 32 142,092 *1,356 *274 *1,227 *3,449 Egypt..................................................................................................... 126 1,242,948 60,934 16,859 79,624 42,642 Libya..................................................................................................... 5 *684 -- -- *397 -- Morocco.....................................................................................................58 50,259 *5,329 *3,557 2,660 2,860 Other North Africa.....................................................................................................50 51,918 *5,088 *3,337 *19,937 901
East Africa, total.........................................................................................................129 214,269 26,594 12,301 38,965 27,224
Ethiopia..................................................................................................... 22 37,990 *5 -- *1,353 *266 Kenya..................................................................................................... 73 55,810 7,557 *4,295 11,985 7,203 Tanzania.....................................................................................................23 32,715 *3,048 *901 *541 *1,004 Uganda..................................................................................................... 17 2,422 -- -- *224 *1,323 Other East Africa.....................................................................................................81 85,332 15,984 *7,105 24,862 17,429
West and Central Africa, total.........................................................................................................176 3,237,100 696,861 208,553 110,578 64,268
Gabon..................................................................................................... 45 149,883 *76,933 *879 *48,205 *751 Ghana..................................................................................................... 35 108,778 *15,617 *9,857 *590 *83 Liberia..................................................................................................... 43 241,396 157,694 *14,762 29,097 -- Nigeria..................................................................................................... 78 1,864,320 391,881 161,996 7,810 28,209 Zaire..................................................................................................... 15 69,523 *2,946 *1,429 *81 *5,978 Other West and Central Africa.....................................................................................................89 803,200 *51,790 *19.631 24,796 29,246
Southern Africa, total.........................................................................................................364 919,237 134,409 77,286 97,400 367,772 Malawi..................................................................................................... 9 *2,121 *952 *809 *1 *1 Zimbabwe.....................................................................................................53 35,406 15,803 *11,906 *939 2,712 South Africa (including Namibia).....................................................................................................351 828,446 113,930 62,853 93,164 327,155 Zambia..................................................................................................... 26 7,635 *3,100 *1,434 *332 *1,447 Other Southern Africa.....................................................................................................24 45,629 *624 *285 *2,964 *36,457 Africa not allocable.........................................................................................................7 *412 -- -- -- *189
Footnotes at end of table.

153
Corporate Foreign Tax Credit, 1997
Table 3.--U.S. Corporation Returns with a Foreign Tax Credit: Foreign Income and Tax Reportedon Form 1118, by Selected Country to Which Foreign Tax Was Paid--Continued[All figures are estimates based on samples--money amounts are in thousands of dollars]
Foreign income and taxes reported on Form 1118
Gross income (less loss)
Foreign
Number of dividend income Rents,Selected country returns Total Dividends resulting from Interest royalties,
foreign taxes anddeemed paid license fees
(gross-up)
(1) (2) (3) (4) (5) (6)
Asia, total.....................................................................................................................1,988 76,430,221 8,037,560 5,048,513 10,407,296 13,522,718 Middle East, total.........................................................................................................478 4,800,957 357,376 152,430 569,577 386,318 Bahrain..................................................................................................... 64 280,804 *1,045 *177 256,758 1,781 Iran..................................................................................................... 13 8,187 *1,314 ( ¹ ) ( ¹ ) *79 Iraq..................................................................................................... 5 *1,008 -- -- -- *-289 Israel..................................................................................................... 347 640,765 106,355 43,604 41,525 164,781 Kuwait..................................................................................................... 79 147,254 *884 *275 *2,272 27,406 Lebanon.....................................................................................................56 68,221 *875 *72 *12,337 21,095 Qatar..................................................................................................... 60 201,389 -- -- *33,741 8,597 Saudi Arabia.....................................................................................................158 1,942,925 80,090 35,795 98,330 82,468 United Arab Emirates.....................................................................................................120 652,179 57,302 *231 104,509 27,163 Other areas of the Arabian Peninsula.....................................................................................................59 685,416 *100,035 *71,538 *5,274 47,198 Other Middle East .....................................................................................................97 172,811 9,475 *738 14,832 6,038
Southern and Southeast Asia, total.........................................................................................................859 19,939,786 2,872,321 1,034,817 3,670,226 2,634,071 Bangladesh.....................................................................................................34 60,988 -- -- *15,718 *840 India..................................................................................................... 356 1,263,336 51,614 26,997 417,794 101,465 Indonesia.....................................................................................................289 5,562,349 551,313 370,595 443,457 215,006 Malaysia.....................................................................................................328 2,207,948 281,664 86,993 316,667 250,292 Pakistan.....................................................................................................97 400,595 8,667 6,228 234,721 6,804 Philippines.....................................................................................................289 1,786,443 261,941 125,538 382,875 139,920 Singapore.....................................................................................................463 6,219,800 1,163,645 228,854 1,285,333 1,715,839 Sri Lanka.....................................................................................................43 32,692 *1,561 *723 *9,792 *1,927 Thailand.....................................................................................................312 2,199,920 545,846 187,739 447,779 196,076 Vietnam.....................................................................................................59 30,431 -- -- 13,599 1,424 Other Southern and Southeast Asia.....................................................................................................79 175,285 *6,071 *1,151 102,491 4,479
Eastern Asia, total.........................................................................................................1,604 48,627,764 4,807,810 3,861,258 6,167,239 10,373,000 China..................................................................................................... 365 1,939,917 105,042 22,572 126,834 611,189 Hong Kong.....................................................................................................539 8,403,379 1,163,343 188,975 2,180,477 639,933 Japan.....................................................................................................1,246 30,105,885 2,882,885 3,372,016 2,273,587 7,373,485 South Korea.....................................................................................................417 3,741,513 277,319 168,230 831,796 1,062,889 Taiwan..................................................................................................... 408 3,826,384 379,220 109,465 747,231 672,996 Other Eastern Asia.....................................................................................................29 610,685 -- -- *7,314 *12,507 Asia not allocable.........................................................................................................26 3,061,713 *53 *7 *254 *129,330 Oceania, total.....................................................................................................................812 11,348,972 2,305,933 924,224 1,646,360 1,322,050 Australia.........................................................................................................748 9,291,969 1,629,277 677,609 1,458,557 1,026,064 New Zealand.........................................................................................................327 1,514,937 583,627 236,054 177,744 283,897 Other Oceania.........................................................................................................68 542,065 93,029 *10,562 10,059 12,088 Puerto Rico and U.S. Possessions, total.....................................................................................................................513 4,389,004 473,020 83,810 1,087,862 471,543 Puerto Rico.........................................................................................................446 3,737,089 448,196 80,897 865,176 441,404 U.S. Possessions, total.........................................................................................................175 651,915 24,824 2,913 222,686 30,139 American Samoa.....................................................................................................21 11,017 -- -- *5,862 *930 Guam..................................................................................................... 132 332,340 *9,511 *1,109 82,073 23,061 Virgin Islands.....................................................................................................81 290,565 *6,766 *1,222 128,804 5,252 Other U.S. Possessions.....................................................................................................19 17,992 *8,546 *583 *5,947 *895 Country not stated.....................................................................................................................2,641 45,452,969 1,369,157 269,455 7,724,915 5,059,066 Foreign Sales Corporation dividends ².....................................................................................................................81 3,268,813 3,268,712 *102 -- -- Interest-Charge Domestic International Sales Corporation dividends ²..............................................................................................................3 *1,029 *1,029 -- -- -- Footnotes at end of table.

154
Corporate Foreign Tax Credit, 1997
154
Table 3.--U.S. Corporation Returns with a Foreign Tax Credit: Foreign Income and Tax Reportedon Form 1118, by Selected Country to Which Foreign Tax Was Paid--Continued[All figures are estimates based on samples--money amounts are in thousands of dollars]
Foreign income and taxes reported on Form 1118--Continued
Gross income (less loss)--Continued
Oil and gas Specifically
Selected country extraction Foreign allocable TotalService Other income branch income deductionsincome income (less loss) ³ income ³ [section
863(b)] ³
(7) (8) (9) (10) (11) (12)
All countries.....................................................................................................................31,387,624 120,893,731 21,013,968 88,607,771 24,971,121 201,909,309
Canada.....................................................................................................................1,138,265 7,367,344 *725,158 2,618,225 1,445,918 11,705,951
Latin America, total.....................................................................................................................4,279,820 10,939,237 1,345,580 11,214,336 2,037,512 22,367,820 Mexico.........................................................................................................474,223 3,244,670 *4,496 1,933,731 852,632 4,028,595 Central America, total.........................................................................................................92,059 561,208 -- 344,403 24,856 798,420 Belize.....................................................................................................*3,333 6,797 -- *2,872 547 37,729 Costa Rica.....................................................................................................17,882 38,209 -- *1,942 6,078 72,464 El Salvador.....................................................................................................5,501 115,331 -- *27,788 2,960 108,836 Guatemala.....................................................................................................25,436 145,807 -- *106,448 3,152 155,885 Honduras.....................................................................................................5,827 50,383 -- *19,523 2,160 52,947 Nicaragua.....................................................................................................*319 27,414 -- *7,412 3,113 15,069 Panama.....................................................................................................33,761 172,245 -- 173,506 6,846 353,942 Caribbean countries, total.........................................................................................................249,453 1,054,062 *508,768 656,591 65,929 1,830,242 Cayman Islands (British).....................................................................................................*7,479 59,430 -- 186,856 5,162 776,739 Dominican Republic.....................................................................................................27,283 139,668 -- 135,041 11,734 130,781 Haiti.....................................................................................................*6,054 60,468 -- *14,450 *453 58,777 Jamaica.....................................................................................................18,423 82,040 -- 50,348 20,671 92,546 Trinidad and Tobago.....................................................................................................41,403 586,121 *508,768 113,220 2,445 541,337 Other Caribbean countries.....................................................................................................148,810 126,334 -- *156,676 25,463 230,063 South America, total.........................................................................................................1,650,362 5,769,978 832,316 6,417,710 1,087,288 12,013,533 Argentina.....................................................................................................482,221 1,230,558 *240,629 1,654,036 565,017 2,681,917 Bolivia.....................................................................................................34,412 36,061 -- *25,832 6,880 60,422 Brazil.....................................................................................................231,423 1,518,081 *430 2,352,381 291,672 5,034,096 Chile.....................................................................................................159,338 640,735 *4 527,528 79,601 1,248,534 Colombia.....................................................................................................158,645 1,242,259 *469,286 712,930 61,989 1,176,849 Ecuador.....................................................................................................28,869 195,040 *104,223 59,597 17,834 177,991 Paraguay.....................................................................................................8,245 31,174 -- *60,631 1,682 51,125 Peru.....................................................................................................47,507 454,630 *102 452,738 25,467 523,044 Uruguay.....................................................................................................34,446 36,104 -- 124,216 5,872 138,526 Venezuela.....................................................................................................461,339 274,505 *17,641 397,065 30,807 873,598 Other South America.....................................................................................................3,917 110,831 -- 50,755 468 47,430 Latin America not allocable.........................................................................................................*1,813,724 309,318 -- *1,861,901 *6,807 3,697,030
Other Western Hemisphere, total.....................................................................................................................1,457,840 2,220,599 *59,063 3,140,218 16,095 5,091,089 Bahamas.........................................................................................................15,098 1,779,850 *12 1,347,831 38,618 2,290,342 Bermuda.........................................................................................................61,043 319,430 *59,051 339,117 16,713 1,164,777 Netherlands Antilles.........................................................................................................*4,695 49,930 -- *64.874 758 342,841 Other British West Indies.........................................................................................................9,154 51,338 -- 22,942 3,341 127,613 All other Western Hemisphere.........................................................................................................1,367,851 20,053 -- *1,365,454 1,711 1,165,517
Europe, total.....................................................................................................................5,777,798 37,486,684 7,898,566 34,728,658 5,604,072 71,980,216 European Union, total.........................................................................................................4,963,599 31,159,562 6,023,088 31,129,589 5,082,947 61,563,138 Austria.....................................................................................................17,263 185,153 -- 134,412 21,518 518,782 Belgium.....................................................................................................189,981 2,031,965 *99 1,873,225 165,801 3,229,699 Denmark.....................................................................................................30,782 471,630 *274,567 407,832 16,156 577,419 Finland.....................................................................................................17,541 254,994 -- *26,870 96,630 421,593 France.....................................................................................................267,571 1,856,898 *1,937 1,172,824 243,395 4,663,220 Germany.....................................................................................................479,106 3,353,178 *481 2,287,800 457,391 6,476,201 Greece.....................................................................................................64,212 129,859 -- 595,548 10,305 525,540 Ireland.....................................................................................................99,959 524,723 -- 137,860 35,449 1,796,177 Italy.....................................................................................................217,138 1,191,940 ( ¹ ) 1,296,027 326,107 3,078,235 Luxembourg.....................................................................................................*14,167 57,533 -- *6,956 *515 279,069 Footnotes at end of table.

155
Corporate Foreign Tax Credit, 1997
Table 3.--U.S. Corporation Returns with a Foreign Tax Credit: Foreign Income and Tax Reportedon Form 1118, by Selected Country to Which Foreign Tax Was Paid--Continued[All figures are estimates based on samples--money amounts are in thousands of dollars]
Foreign income and taxes reported on Form 1118--Continued
Gross income
(less loss)--Continued
Oil and gas Specifically
extraction Foreign allocable TotalSelected country Service Other income branch income deductions
income income (less loss) ³ income ³ [section863(b)] ³
(7) (8) (9) (10) (11) (12)
Europe--continued European Union--continued Netherlands.....................................................................................................224,141 2,008,981 *1,175,166 2,757,305 230,266 3,731,761 Portugal.....................................................................................................24,700 105,291 -- 79,926 20,484 252,838 Spain.....................................................................................................55,464 398,725 -- 485,060 97,764 1,368,428 Sweden.....................................................................................................67,408 379,322 -- 158,410 42,198 875,443 United Kingdom.....................................................................................................3,194,164 18,163,172 4,570,839 19,664,135 3,318,966 33,723,692 Other European Economic Community.....................................................................................................-- *46,197 -- *45,398 -- *45,042
Other West European countries, total.........................................................................................................379,006 3,071,976 *1,467,404 2,773,405 241,009 7,243,334 Liechtenstein.....................................................................................................*881 *219 -- -- ( ¹ ) 2,672 Monaco.....................................................................................................*8,810 *6,833 -- *5,844 *3 17,452 Norway.....................................................................................................103,187 1,894,988 *1,467,404 1,547,063 14,957 968,656 Switzerland.....................................................................................................213,129 936,371 -- 859,454 180,711 5,634,796 Turkey.....................................................................................................51,657 190,736 -- 359,786 43,409 576,996 Other West European countries.....................................................................................................*1,341 7,314 -- *711 1,929 18,733 West European countries not allocable.....................................................................................................-- *35,515 -- *546 -- *24,030 East European countries, total.........................................................................................................429,191 1,099,047 *408,073 779,731 222,646 1,782,458 Romania.....................................................................................................*6,516 23,263 * -352 *30,088 *1,046 72,699 Former Soviet Union.....................................................................................................126,223 804,321 *408,425 390,270 163,333 984,252 Other East Europe.....................................................................................................296,452 271,462 -- 359,373 58,266 725,507 Europe not allocable.........................................................................................................*6,003 2,156,099 -- *45,933 *57,471 1,391,286
Africa, total.....................................................................................................................1,084,205 2,661,880 1,312,129 1,233,350 149,986 2,709,675
North Africa, total.........................................................................................................402,611 834,857 *425,590 536,124 40,417 891,286 Algeria.....................................................................................................*243,313 -107,528 *45,555 *131,789 *872 86,890 Egypt.....................................................................................................143,017 899,871 *382,850 336,388 31,978 738,432 Libya..................................................................................................... -- *287 -- -- -- *7,160 Morocco.....................................................................................................*1,756 34,098 -- *22,465 5,025 21,240 Other North Africa.....................................................................................................*14,526 8,129 * -2,814 45,482 2,541 37,564
East Africa, total.........................................................................................................5,440 103,744 -- 73,178 1,367 158,158
Ethiopia..................................................................................................... *1 36,365 -- *13,674 *60 39,076 Kenya.....................................................................................................*5,787 18,983 -- *38,721 511 41,138 Tanzania.....................................................................................................*27 27,195 -- *2,662 *386 35,798 Uganda..................................................................................................... *4 875 -- -- *152 2,276 Other East Africa.....................................................................................................* -376 20,327 -- *18,122 *258 39,870
West and Central Africa, total.........................................................................................................602,749 1,554,091 *886,015 465,011 64,061 1,162,771
Gabon.....................................................................................................*18,559 4,557 *75,299 *8,408 *1,001 27,607 Ghana.....................................................................................................*2,237 80,394 -- *1 *1,161 39,684 Liberia.....................................................................................................*33,022 *6,821 -- *23,219 *770 82,462 Nigeria.....................................................................................................197,844 1,076,580 *668,261 *120,178 20,050 448,026 Zaire..................................................................................................... *13 *59,075 *55,601 ( ¹ ) *103 48,542 Other West and Central Africa.....................................................................................................351,073 326,664 *86,854 313,206 40,975 516,449
Southern Africa, total.........................................................................................................73,405 168,966 *524 159,036 44,071 497,167 Malawi..................................................................................................... *43 *316 -- -- *190 *913 Zimbabwe.....................................................................................................*521 3,525 -- *49 *73 12,562 South Africa (including Namibia).....................................................................................................70,205 161,140 *524 *158,887 37,377 434,025 Zambia..................................................................................................... *8 1,314 -- *5 *90 4,240 Other Southern Africa.....................................................................................................*2,628 2,671 -- *95 *6,341 45,427 Africa not allocable.........................................................................................................-- *222 -- -- *71 *293
Footnotes at end of table.
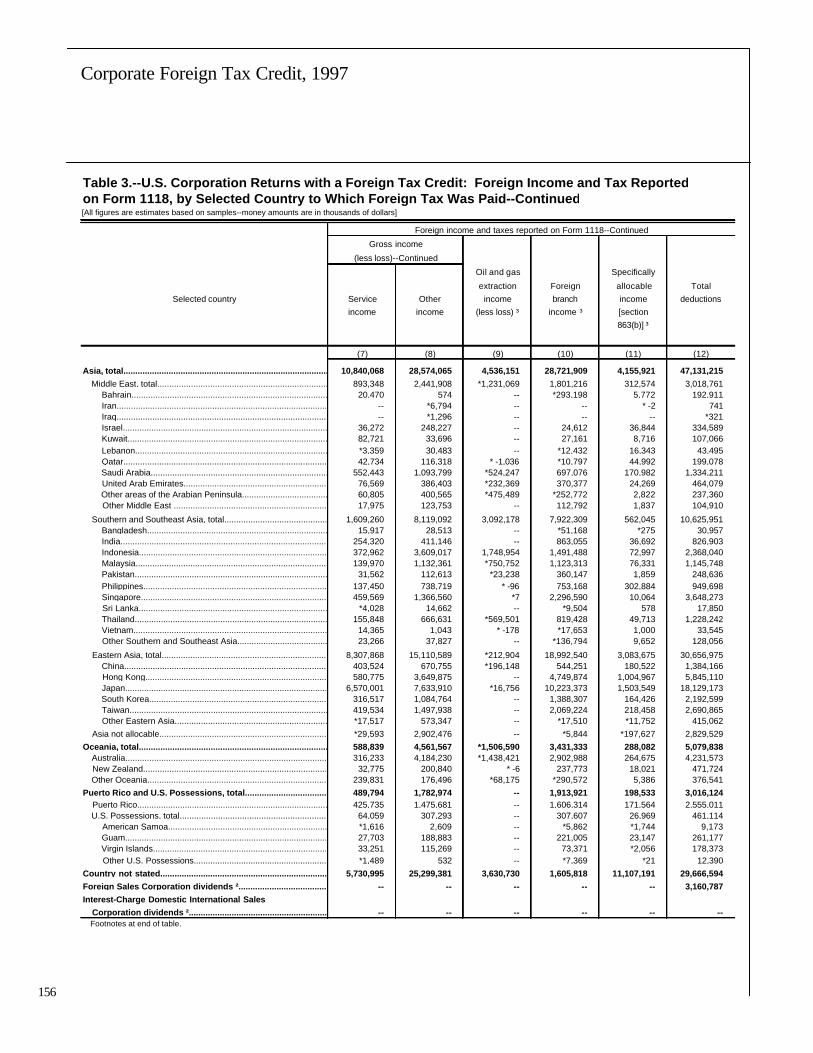
156
Corporate Foreign Tax Credit, 1997
156
Table 3.--U.S. Corporation Returns with a Foreign Tax Credit: Foreign Income and Tax Reportedon Form 1118, by Selected Country to Which Foreign Tax Was Paid--Continued[All figures are estimates based on samples--money amounts are in thousands of dollars]
Foreign income and taxes reported on Form 1118--Continued
Gross income (less loss)--Continued
Oil and gas Specifically
extraction Foreign allocable TotalSelected country Service Other income branch income deductions
income income (less loss) ³ income ³ [section863(b)] ³
(7) (8) (9) (10) (11) (12)
Asia, total.....................................................................................................................10,840,068 28,574,065 4,536,151 28,721,909 4,155,921 47,131,215 Middle East, total.........................................................................................................893,348 2,441,908 *1,231,069 1,801,216 312,574 3,018,761 Bahrain.....................................................................................................20,470 574 -- *293,198 5,772 192,911 Iran..................................................................................................... -- *6,794 -- -- * -2 741 Iraq..................................................................................................... -- *1,296 -- -- -- *321 Israel.....................................................................................................36,272 248,227 -- 24,612 36,844 334,589 Kuwait.....................................................................................................82,721 33,696 -- 27,161 8,716 107,066 Lebanon.....................................................................................................*3,359 30,483 -- *12,432 16,343 43,495 Qatar.....................................................................................................42,734 116,318 * -1,036 *10,797 44,992 199,078 Saudi Arabia.....................................................................................................552,443 1,093,799 *524,247 697,076 170,982 1,334,211 United Arab Emirates.....................................................................................................76,569 386,403 *232,369 370,377 24,269 464,079 Other areas of the Arabian Peninsula.....................................................................................................60,805 400,565 *475,489 *252,772 2,822 237,360 Other Middle East .....................................................................................................17,975 123,753 -- 112,792 1,837 104,910
Southern and Southeast Asia, total.........................................................................................................1,609,260 8,119,092 3,092,178 7,922,309 562,045 10,625,951 Bangladesh.....................................................................................................15,917 28,513 -- *51,168 *275 30,957 India.....................................................................................................254,320 411,146 -- 863,055 36,692 826,903 Indonesia.....................................................................................................372,962 3,609,017 1,748,954 1,491,488 72,997 2,368,040 Malaysia.....................................................................................................139,970 1,132,361 *750,752 1,123,313 76,331 1,145,748 Pakistan.....................................................................................................31,562 112,613 *23,238 360,147 1,859 248,636 Philippines.....................................................................................................137,450 738,719 * -96 753,168 302,884 949,698 Singapore.....................................................................................................459,569 1,366,560 *7 2,296,590 10,064 3,648,273 Sri Lanka.....................................................................................................*4,028 14,662 -- *9,504 578 17,850 Thailand.....................................................................................................155,848 666,631 *569,501 819,428 49,713 1,228,242 Vietnam.....................................................................................................14,365 1,043 * -178 *17,653 1,000 33,545 Other Southern and Southeast Asia.....................................................................................................23,266 37,827 -- *136,794 9,652 128,056
Eastern Asia, total.........................................................................................................8,307,868 15,110,589 *212,904 18,992,540 3,083,675 30,656,975 China.....................................................................................................403,524 670,755 *196,148 544,251 180,522 1,384,166 Hong Kong.....................................................................................................580,775 3,649,875 -- 4,749,874 1,004,967 5,845,110 Japan.....................................................................................................6,570,001 7,633,910 *16,756 10,223,373 1,503,549 18,129,173 South Korea.....................................................................................................316,517 1,084,764 -- 1,388,307 164,426 2,192,599 Taiwan.....................................................................................................419,534 1,497,938 -- 2,069,224 218,458 2,690,865 Other Eastern Asia.....................................................................................................*17,517 573,347 -- *17,510 *11,752 415,062 Asia not allocable.........................................................................................................*29,593 2,902,476 -- *5,844 *197,627 2,829,529 Oceania, total.....................................................................................................................588,839 4,561,567 *1,506,590 3,431,333 288,082 5,079,838 Australia.........................................................................................................316,233 4,184,230 *1,438,421 2,902,988 264,675 4,231,573 New Zealand.........................................................................................................32,775 200,840 * -6 237,773 18,021 471,724 Other Oceania.........................................................................................................239,831 176,496 *68,175 *290,572 5,386 376,541 Puerto Rico and U.S. Possessions, total.....................................................................................................................489,794 1,782,974 -- 1,913,921 198,533 3,016,124 Puerto Rico.........................................................................................................425,735 1,475,681 -- 1,606,314 171,564 2,555,011 U.S. Possessions, total.........................................................................................................64,059 307,293 -- 307,607 26,969 461,114 American Samoa.....................................................................................................*1,616 2,609 -- *5,862 *1,744 9,173 Guam.....................................................................................................27,703 188,883 -- 221,005 23,147 261,177 Virgin Islands.....................................................................................................33,251 115,269 -- 73,371 *2,056 178,373 Other U.S. Possessions.....................................................................................................*1,489 532 -- *7,369 *21 12,390 Country not stated.....................................................................................................................5,730,995 25,299,381 3,630,730 1,605,818 11,107,191 29,666,594 Foreign Sales Corporation dividends ².....................................................................................................................-- -- -- -- -- 3,160,787 Interest-Charge Domestic International Sales Corporation dividends ²..............................................................................................................-- -- -- -- -- -- Footnotes at end of table.

157
Corporate Foreign Tax Credit, 1997
Table 3.--U.S. Corporation Returns with a Foreign Tax Credit: Foreign Income and Tax Reportedon Form 1118, by Selected Country to Which Foreign Tax Was Paid--Continued[All figures are estimates based on samples--money amounts are in thousands of dollars]
Foreign income and taxes reported on Form 1118--Continued
Foreign taxes paid, accrued, and deemed paid
Foreign taxes paid or accruedDeductions Taxable Taxes withheld at source on--
from oil incomeSelected country and gas (less loss) Total
extraction before Total Dividends Interestincome
4adjustments
(13) (14) (15) (16) (17) (18)
All countries.....................................................................................................................8,915,360 157,989,290 45,079,798 16,056,942 2,767,327 640,883
Canada.....................................................................................................................459,331 15,906,555 5,655,560 866,979 337,193 42,976
Latin America, total.....................................................................................................................898,475 16,280,149 4,295,619 2,135,588 382,548 221,276 Mexico.........................................................................................................*3,192 4,580,692 1,098,347 410,408 7,774 40,062 Central America, total.........................................................................................................* -32 618,242 100,219 51,457 4,687 826 Belize..................................................................................................... -- 2,390 *318 *254 200 -- Costa Rica.....................................................................................................-- 52,067 14,356 10,777 2,344 *305 El Salvador.....................................................................................................-- 80,131 7,742 4,777 *54 *107 Guatemala.....................................................................................................* -32 106,841 25,936 17,474 *384 *290 Honduras.....................................................................................................-- 24,145 7,997 4,202 *867 *27 Nicaragua.....................................................................................................-- 18,306 494 *489 -- *65 Panama..................................................................................................... -- 330,890 41,724 11,832 785 *31 Caribbean countries, total.........................................................................................................*454,045 1,466,814 183,402 71,168 4,962 *406 Cayman Islands (British).....................................................................................................-- 944,427 60,340 -- -- -- Dominican Republic.....................................................................................................-- 168,529 37,331 16,011 *1,819 *45 Haiti..................................................................................................... -- 15,584 *6,644 *6,006 *650 -- Jamaica..................................................................................................... -- 51,361 12,554 7,662 *431 *230 Trinidad and Tobago.....................................................................................................*454,045 142,029 47,038 40,464 *2,062 *94 Other Caribbean countries.....................................................................................................-- 144,885 19,496 1,025 ( ¹ ) *37 South America, total.........................................................................................................441,271 8,236,737 2,897,805 1,586,709 365,124 170,094 Argentina.....................................................................................................*119,217 1,776,068 467,406 272,321 1,138 32,576 Bolivia.....................................................................................................*132 33,566 5,803 3,843 *126 *350 Brazil..................................................................................................... *539 3,607,589 1,565,006 656,665 289,759 127,490 Chile..................................................................................................... -- 1,000,511 265,777 225,176 61,619 5,931 Colombia.....................................................................................................243,895 682,929 315,351 254,704 11,546 *380 Ecuador.....................................................................................................*63,202 130,251 14,125 10,426 *393 *207 Paraguay.....................................................................................................*1,860 4,727 9,007 8,291 *37 *78 Peru..................................................................................................... *599 301,432 111,359 82,311 -- 740 Uruguay..................................................................................................... -- 75,785 12,532 6,011 -- -- Venezuela.....................................................................................................*11,827 551,603 113,242 50,444 *506 2,342 Other South America.....................................................................................................-- 72,275 *18,195 *16,516 -- -- Latin America not allocable.........................................................................................................-- 1,377,664 *15,846 *15,846 -- *9,888
Other Western Hemisphere, total.....................................................................................................................* -14,931 3,102,486 188,052 6,356 *1,083 -- Bahamas......................................................................................................... -- 907,541 13,101 -- -- -- Bermuda.........................................................................................................* -15,442 1,698,546 113,162 -- -- -- Netherlands Antilles.........................................................................................................-- 168,722 36,326 *2,800 *1,065 -- Other British West Indies.........................................................................................................-- 91,643 22,449 2,142 *15 -- All other Western Hemisphere.........................................................................................................*511 236,035 *3,013 *1,414 *3 --
Europe, total.....................................................................................................................2,863,553 66,714,408 20,036,867 4,794,348 1,392,987 99,250 European Union, total.........................................................................................................2,272,049 59,673,515 17,615,094 3,609,501 1,118,104 67,496 Austria.....................................................................................................* -343 387,729 159,034 30,968 22,278 *37 Belgium.....................................................................................................*201 2,707,827 904,440 198,289 25,978 16,120 Denmark.....................................................................................................*143,727 420,392 139,772 54,701 6,592 -- Finland..................................................................................................... -- 302,678 44,511 14,698 3,768 *26 France.....................................................................................................*325 3,863,793 1,321,863 230,514 71,751 1,456 Germany.....................................................................................................*230 8,553,809 2,794,842 336,549 133,058 *68 Greece..................................................................................................... *53 315,246 34,423 12,265 *256 ( ¹ ) Ireland..................................................................................................... *70 2,565,771 117,440 7,525 1,820 *501 Italy.....................................................................................................*11,821 3,036,657 1,406,620 333,571 25,762 29,212 Luxembourg.....................................................................................................-- 442,364 203,177 13,877 13,498 -- Footnotes at end of table.

158
Corporate Foreign Tax Credit, 1997
158
Table 3.--U.S. Corporation Returns with a Foreign Tax Credit: Foreign Income and Tax Reportedon Form 1118, by Selected Country to Which Foreign Tax Was Paid--Continued[All figures are estimates based on samples--money amounts are in thousands of dollars]
Foreign income and taxes reported on Form 1118--Continued
Foreign taxes paid, accrued, and deemed paid
Foreign taxes paid or accrued
Deductions Taxable Taxes withheld at source on--
from oil incomeSelected country and gas (less loss) Total
extraction before Total Dividends Interestincome
4adjustments
(13) (14) (15) (16) (17) (18)
Europe--continued European Union--continued Netherlands.....................................................................................................-- 8,607,060 2,762,987 251,159 149,731 *858 Portugal.....................................................................................................*112 286,410 82,885 29,917 5,602 *228 Spain..................................................................................................... -- 1,851,004 732,516 197,947 94,000 1,576 Sweden.....................................................................................................2,021,989 1,123,042 343,309 42,835 32,071 *20 United Kingdom.....................................................................................................-- 25,205,763 6,567,123 1,854,613 531,939 17,392 Other European Economic Community.....................................................................................................*449,701 *3,972 *152 *73 -- --
Other West European countries, total.........................................................................................................-- 5,096,912 2,198,268 1,068,912 269,294 30,105 Liechtenstein.....................................................................................................-- 8,324 *264 ( ¹ ) ( ¹ ) -- Monaco.....................................................................................................*449,701 -445 *158 *122 -- -- Norway..................................................................................................... -- 2,164,771 955,912 699,419 10,103 *42 Switzerland.....................................................................................................-- 2,568,847 1,118,716 290,215 258,344 2,637 Turkey..................................................................................................... -- 322,807 121,479 78,442 *844 *27,427 Other West European countries.....................................................................................................-- 18,427 1,739 *714 *2 -- West European countries not allocable.....................................................................................................*141,803 *14,182 -- -- -- -- East European countries, total.........................................................................................................*17,497 1,134,643 221,210 113,640 5,476 *1,649 Romania.....................................................................................................*124,306 4,279 17,722 6,522 *77 *500 Former Soviet Union.....................................................................................................-- 602,304 98,346 77,059 1,544 *281 Other East Europe.....................................................................................................-- 528,061 105,142 30,059 3,854 *867 Europe not allocable.........................................................................................................533,293 809,337 *2,295 *2,295 *113 --
Africa, total.....................................................................................................................*334,403 3,149,243 938,103 615,935 11,833 *961
North Africa, total.........................................................................................................*23,230 596,615 223,591 199,564 *1,229 *724 Algeria.....................................................................................................*304,512 55,202 *18,454 *18,179 *947 -- Egypt..................................................................................................... -- 504,516 192,662 175,803 -- *709 Libya..................................................................................................... -- * -6,476 -- -- -- -- Morocco.....................................................................................................*6,661 29,019 7,460 3,904 *282 *15 Other North Africa.....................................................................................................*8 14,354 *5,015 *1,678 -- --
East Africa, total.........................................................................................................-- 56,111 21,566 9,264 970 *201
Ethiopia..................................................................................................... *8 -1,085 *2,012 *2,012 -- -- Kenya..................................................................................................... -- 14,672 10,481 6,185 *747 *128 Tanzania..................................................................................................... -- -3,084 *1,164 *263 -- -- Uganda..................................................................................................... -- 146 *200 *200 -- -- Other East Africa.....................................................................................................*198,837 45,462 7,708 *603 *223 *73
West and Central Africa, total.........................................................................................................*8,858 2,074,330 565,998 357,444 5,482 *36
Gabon..................................................................................................... -- 122,276 *2,980 *2,101 *319 -- Ghana..................................................................................................... -- 69,094 *10,635 *778 *688 ( ¹ ) Liberia.....................................................................................................*81,164 158,934 *14,762 -- -- -- Nigeria.....................................................................................................*41,368 1,416,294 405,220 243,223 *1,547 *36 Zaire.....................................................................................................*67,447 20,981 *7,878 *6,450 *315 -- Other West and Central Africa.....................................................................................................*44 286,752 124,523 104,892 *2,614 --
Southern Africa, total.........................................................................................................-- 422,070 126,948 49,662 4,152 -- Malawi..................................................................................................... -- *1,208 *809 -- -- -- Zimbabwe.....................................................................................................*44 22,844 14,998 3,093 *2,553 -- South Africa (including Namibia).....................................................................................................-- 394,422 102,836 39,983 978 -- Zambia..................................................................................................... -- 3,395 *1,752 *318 *112 -- Other Southern Africa.....................................................................................................-- 202 *6,553 *6,268 *510 -- Africa not allocable.........................................................................................................-- *118 -- -- -- --
Footnotes at end of table.

159
Corporate Foreign Tax Credit, 1997
Table 3.--U.S. Corporation Returns with a Foreign Tax Credit: Foreign Income and Tax Reportedon Form 1118, by Selected Country to Which Foreign Tax Was Paid--Continued[All figures are estimates based on samples--money amounts are in thousands of dollars]
Foreign income and taxes reported on Form 1118--Continued
Foreign taxes paid, accrued, and deemed paid
Foreign taxes paid or accrued
Deductions Taxable Taxes withheld at source on--
Selected country from oil incomeand gas (less loss) Total
extraction before Total Dividends Interestincome
4adjustments
(13) (14) (15) (16) (17) (18)
Asia, total.....................................................................................................................1,897,901 29,299,006 10,228,323 5,178,054 465,167 165,211 Middle East, total.........................................................................................................*801,751 1,782,197 608,311 455,881 19,487 604 Bahrain..................................................................................................... -- 87,893 *179 *3 -- -- Iran..................................................................................................... -- 7,446 ( ¹ ) -- -- -- Iraq..................................................................................................... -- *686 -- -- -- -- Israel..................................................................................................... -- 306,176 81,493 37,889 9,205 508 Kuwait.....................................................................................................*8,306 40,188 8,043 7,768 -- -- Lebanon..................................................................................................... -- 24,727 971 *899 *45 -- Qatar.....................................................................................................*5,135 2,311 *2,744 *2,744 -- -- Saudi Arabia.....................................................................................................*501,889 608,714 267,264 231,469 *135 *96 United Arab Emirates.....................................................................................................*167,307 188,100 65,182 64,951 *10,092 -- Other areas of the Arabian Peninsula.....................................................................................................*119,115 448,055 177,593 106,055 -- -- Other Middle East .....................................................................................................-- 67,901 4,842 4,104 *9 --
Southern and Southeast Asia, total.........................................................................................................1,007,014 9,313,835 2,910,136 1,875,316 108,186 26,071 Bangladesh.....................................................................................................*260 30,031 *6,164 *6,164 -- -- India..................................................................................................... *1 436,433 179,096 152,099 882 *553 Indonesia.....................................................................................................554,961 3,194,309 1,451,437 1,080,843 44,719 8,981 Malaysia.....................................................................................................*315,229 1,062,199 255,562 168,568 3,587 1,336 Pakistan.....................................................................................................*5,729 151,959 52,571 46,343 3,324 *57 Philippines.....................................................................................................*571 836,744 269,933 144,395 43,011 11,259 Singapore.....................................................................................................*49 2,571,526 359,282 130,425 1,895 1,365 Sri Lanka.....................................................................................................-- 14,842 2,751 2,029 *233 -- Thailand.....................................................................................................*129,705 971,678 319,447 131,708 10,535 2,519 Vietnam.....................................................................................................*509 -3,114 568 568 -- -- Other Southern and Southeast Asia.....................................................................................................-- 47,229 *13,324 *12,173 -- --
Eastern Asia, total.........................................................................................................*89,136 17,970,789 6,709,839 2,846,828 337,494 138,535 China.....................................................................................................*89,047 555,751 67,950 45,378 47,007 6,237 Hong Kong.....................................................................................................-- 2,558,269 616,411 425,864 6,698 *115,164 Japan..................................................................................................... *88 11,976,713 5,105,043 1,733,027 256,096 10,033 South Korea.....................................................................................................-- 1,548,915 597,712 429,313 *5 4,347 Taiwan..................................................................................................... -- 1,135,519 322,723 213,246 27,688 2,754 Other Eastern Asia.....................................................................................................-- 195,624 ( ¹ ) ( ¹ ) -- -- Asia not allocable.........................................................................................................-- 232,184 *36 *29 -- -- Oceania, total.....................................................................................................................558,489 6,269,134 1,959,607 1,035,383 43,276 11,644 Australia.........................................................................................................*517,700 5,060,397 1,619,917 942,308 32,651 10,424 New Zealand.........................................................................................................*11 1,043,213 286,467 50,413 8,458 1,085 Other Oceania.........................................................................................................*407,78 165,524 53,224 42,663 *2,167 *135 Puerto Rico and U.S. Possessions, total.....................................................................................................................*68 1,372,879 292,760 208,950 10,380 15,217 Puerto Rico.........................................................................................................-- 1,182,078 260,022 179,125 10,380 7,433 U.S. Possessions, total.........................................................................................................*68 190,801 32,738 29,825 -- *7,784 American Samoa.....................................................................................................-- 1,843 *770 *770 -- -- Guam..................................................................................................... *68 71,163 19,036 17,927 -- -- Virgin Islands.....................................................................................................-- 112,192 12,183 10,961 -- *7,778 Other U.S. Possessions.....................................................................................................-- 5,602 *750 *168 -- *6 Country not stated.....................................................................................................................1,719,182 15,786,375 1,484,789 1,215,334 122,853 84,347 Foreign Sales Corporation dividends ².....................................................................................................................-- 108,026 *102 ( ¹ ) ( ¹ ) -- Interest-Charge Domestic International Sales Corporation dividends ²..............................................................................................................-- *1,029 -- -- -- -- Footnotes at end of table.

160
Corporate Foreign Tax Credit, 1997
160
Table 3.--U.S. Corporation Returns with a Foreign Tax Credit: Foreign Income and Tax Reportedon Form 1118, by Selected Country to Which Foreign Tax Was Paid--Continued[All figures are estimates based on samples--money amounts are in thousands of dollars]
Foreign income and taxes reported on Form 1118--Continued
Foreign taxes paid, accrued, and deemed paid--Continued
Foreign taxes paid or accrued--ContinuedTaxes withheld Other taxes paid or accrued on--
at source on Specifically TaxesSelected country --Continued allocable deemed
Rents, royalties, Branch income Service Other paidand license income [section income income
fees 863(b)]
(19) (20) (21) (22) (23) (24)
All countries.....................................................................................................................2,238,232 6,063,443 29,802 292,786 4,024,468 29,022,856
Canada.....................................................................................................................107,054 238,117 *1,227 28,563 111,851 4,788,581
Latin America, total.....................................................................................................................399,454 444,300 *530 68,044 619,437 2,160,031 Mexico.........................................................................................................109,216 191,862 *352 14,854 46,289 687,938 Central America, total.........................................................................................................15,852 22,742 -- 3,799 3,551 48,762 Belize..................................................................................................... -- *54 -- -- -- *64 Costa Rica.....................................................................................................5,066 *999 -- *227 *1,835 3,579 El Salvador.....................................................................................................2,166 *1,584 -- *73 *794 *2,965 Guatemala.....................................................................................................4,799 *8,718 -- *2,680 *603 8,462 Honduras.....................................................................................................926 *1,625 -- *700 *56 *3,795 Nicaragua.....................................................................................................*171 *178 -- *33 *42 *5 Panama.....................................................................................................2,723 *7,984 -- *86 *222 29,892 Caribbean countries, total.........................................................................................................2,867 23,821 *170 5,357 *33,586 112,234 Cayman Islands (British).....................................................................................................-- -- -- -- -- 60,340 Dominican Republic.....................................................................................................1,694 *11,467 *170 *234 *582 21,320 Haiti..................................................................................................... *32 *1,011 -- -- *4,313 *638 Jamaica.....................................................................................................814 4,794 -- *815 *579 *4,892 Trinidad and Tobago.....................................................................................................*230 *6,142 -- *3,822 *28,112 *6,574 Other Caribbean countries.....................................................................................................*97 *406 -- *485 -- 18,470 South America, total.........................................................................................................265,583 205,874 *8 44,035 535,989 1,311,097 Argentina.....................................................................................................74,345 72,001 -- 21,018 71,244 195,085 Bolivia.....................................................................................................*217 *2,391 -- *509 *249 *1,960 Brazil.....................................................................................................96,708 21,257 -- 12,872 108,579 908,341 Chile.....................................................................................................26,790 *7,242 -- *1,042 122,552 40,601 Colombia.....................................................................................................26,346 55,034 -- 2,184 159,214 60,648 Ecuador.....................................................................................................5,555 *675 *8 *378 3,210 3,700 Paraguay.....................................................................................................*434 *7,732 -- -- *10 *716 Peru.....................................................................................................10,690 5,069 -- *863 64,949 29,047 Uruguay.....................................................................................................3,057 *2,750 -- *110 *95 6,521 Venezuela.....................................................................................................21,441 15,209 -- 5,059 5,888 62,798 Other South America.....................................................................................................( ¹ ) *16,515 -- ( ¹ ) -- *1,680 Latin America not allocable.........................................................................................................*5,937 -- -- -- *22 --
Other Western Hemisphere, total.....................................................................................................................*171 *3,051 *130 *264 *1,657 181,696 Bahamas......................................................................................................... -- -- -- -- -- 13,101 Bermuda......................................................................................................... -- -- -- -- -- 113,162 Netherlands Antilles.........................................................................................................-- *1,225 -- -- *510 33,526 Other British West Indies.........................................................................................................*31 *555 *130 *264 *1,147 20,307 All other Western Hemisphere.........................................................................................................*140 *1,271 -- -- -- *1,599
Europe, total.....................................................................................................................330,447 2,046,379 *4,759 79,993 840,534 15,242,519 European Union, total.........................................................................................................284,990 1,324,405 *3,666 74,563 736,276 14,005,593 Austria.....................................................................................................1,339 *6,331 -- -- *983 128,066 Belgium.....................................................................................................5,162 76,062 *797 *2,213 71,956 706,151 Denmark.....................................................................................................*33 43,083 -- *4,819 *174 85,071 Finland.....................................................................................................7,147 *166 -- *6 *3,585 29,814 France.....................................................................................................68,498 20,878 *2,082 3,906 61,943 1,091,349 Germany.....................................................................................................1,140 157,090 -- 16,228 28,965 2,458,293 Greece.....................................................................................................1,567 10,356 -- *85 -- 22,158 Ireland.....................................................................................................*1,039 *669 -- *3,143 *353 109,915 Italy.....................................................................................................90,059 158,936 -- *2,540 27,062 1,073,049 Luxembourg.....................................................................................................-- -- *132 *247 -- 189,300 Footnotes at end of table.

161
Corporate Foreign Tax Credit, 1997
Table 3.--U.S. Corporation Returns with a Foreign Tax Credit: Foreign Income and Tax Reportedon Form 1118, by Selected Country to Which Foreign Tax Was Paid--Continued[Money amounts are in thousands of dollars]
Foreign income and taxes reported on Form 1118--Continued
Foreign taxes paid, accrued, and deemed paid--Continued
Foreign taxes paid or accrued--Continued
Taxes withheld Other taxes paid or accrued on--
at source on Specifically TaxesSelected country --Continued allocable deemed
Rents, royalties, Branch income Service Other paidand license income [section income income
fees 863(b)]
(19) (20) (21) (22) (23) (24)
Europe--continued European Union--continued Netherlands.....................................................................................................8,357 35,397 * -355 *1,506 55,664 2,511,828 Portugal.....................................................................................................17,218 5,151 -- *250 *1,467 52,967 Spain.....................................................................................................70,087 22,956 -- 1,319 8,010 534,569 Sweden.....................................................................................................*1,705 7,434 -- *1,050 554 300,474 United Kingdom.....................................................................................................11,567 779,896 *1,010 37,249 475,561 4,712,510 Other European Economic Community.....................................................................................................*73 -- -- -- -- *78
Other West European countries, total.........................................................................................................25,007 686,528 *975 3,086 53,915 1,129,357 Liechtenstein.....................................................................................................-- -- -- -- -- *264 Monaco..................................................................................................... -- -- -- *122 -- *36 Norway..................................................................................................... *28 657,014 *2 *478 *31,752 256,494 Switzerland.....................................................................................................*212 11,865 *973 *1,591 14,594 828,501 Turkey.....................................................................................................24,721 *17,614 -- *895 *6.940 43,037 Other West European countries.....................................................................................................*47 *35 -- -- *629 *1,024 West European countries not allocable.....................................................................................................-- -- -- -- -- -- East European countries, total.........................................................................................................20,332 33,417 *81 2,344 50,342 107,569 Romania.....................................................................................................2,025 *3,819 -- *98 *3 *11,200 Former Soviet Union.....................................................................................................1,652 25,264 *81 *867 *47,369 *21,287 Other East Europe.....................................................................................................16,655 *4,334 ( ¹ ) *1,378 *2,970 75,082 Europe not allocable.........................................................................................................*117 *2,030 *36 -- -- --
Africa, total.....................................................................................................................34,280 375,832 -- 10,589 182,439 322,168
North Africa, total.........................................................................................................2,881 26,645 -- 831 *167,255 24,027 Algeria..................................................................................................... *57 *6,994 -- *137 *10,044 *274 Egypt.....................................................................................................2,566 *15,326 -- *621 *156,582 16,859 Libya..................................................................................................... -- -- -- -- -- -- Morocco.....................................................................................................*216 *2,766 -- *69 *555 *3,557 Other North Africa.....................................................................................................*42 *1,558 -- *5 *73 *3,337
East Africa, total.........................................................................................................1,509 *6,156 -- *425 *4 12,301
Ethiopia..................................................................................................... -- *2,012 -- -- -- -- Kenya..................................................................................................... *807 *4,082 -- *418 *4 *4,295 Tanzania.....................................................................................................*263 -- -- -- -- *901 Uganda.....................................................................................................*200 -- -- -- -- -- Other East Africa.....................................................................................................*238 *62 -- *7 -- *7,105
West and Central Africa, total.........................................................................................................1,133 340,913 -- *1,652 *8,229 208,553
Gabon..................................................................................................... -- *1,511 -- -- *271 *879 Ghana..................................................................................................... *90 -- -- -- -- *9,857 Liberia..................................................................................................... -- -- -- -- -- *14,762 Nigeria.....................................................................................................*479 *239,673 -- *1,458 *30 161,996 Zaire..................................................................................................... -- -- -- -- *6,135 *1,429 Other West and Central Africa.....................................................................................................*564 99,729 -- *194 *1,792 *19,631
Southern Africa, total.........................................................................................................28,758 2,118 -- *7,681 *6,952 77,286 Malawi..................................................................................................... -- -- -- -- -- *809 Zimbabwe.....................................................................................................439 -- -- *101 -- *11,906 South Africa (including Namibia).....................................................................................................22,921 *1,916 -- *7,217 *6,952 62,853 Zambia..................................................................................................... *4 *202 -- -- -- *1,434 Other Southern Africa.....................................................................................................*5,394 -- -- *364 -- *285 Africa not allocable.........................................................................................................-- -- -- -- -- --
Footnotes at end of table.

162
Corporate Foreign Tax Credit, 1997
162
Table 3.--U.S. Corporation Returns with a Foreign Tax Credit: Foreign Income and Tax Reportedon Form 1118, by Selected Country to Which Foreign Tax Was Paid--Continued[Money amounts are in thousands of dollars]
Foreign income and taxes reported on Form 1118--Continued
Foreign taxes paid, accrued, and deemed paid--Continued
Foreign taxes paid or accrued--Continued
Taxes withheld Other taxes paid or accrued on--
Selected country at source on Specifically Taxes--Continued allocable deemed
Rents, royalties, Branch income Service Other paidand license income [section income income
fees 863(b)]
(19) (20) (21) (22) (23) (24)
Asia, total.....................................................................................................................1,048,674 2,503,082 *13,036 42,823 940,061 5,050,269 Middle East, total.........................................................................................................31,083 231,876 *1,625 9,396 161,809 152,430 Bahrain..................................................................................................... *1 -- -- -- *1 *177 Iran..................................................................................................... -- -- -- -- -- ( ¹ ) Iraq..................................................................................................... -- -- -- -- -- -- Israel.....................................................................................................25,361 *439 -- *10 2,366 43,604 Kuwait..................................................................................................... *50 *4,096 *142 *76 *3,404 *275 Lebanon.....................................................................................................*36 *818 -- -- -- *72 Qatar..................................................................................................... -- *2,444 -- -- *300 -- Saudi Arabia.....................................................................................................4,794 188,481 *1,484 *8,733 *27,744 35,795 United Arab Emirates.....................................................................................................*337 30,958 -- -- *23,564 *231 Other areas of the Arabian Peninsula.....................................................................................................*198 *1,723 -- *425 *103,709 *71,538 Other Middle East .....................................................................................................306 *2,916 -- *152 *721 *738
Southern and Southeast Asia, total.........................................................................................................138,190 1,093,519 *268 16,091 492,991 1,034,820 Bangladesh.....................................................................................................-- *6,164 -- -- ( ¹ ) -- India.....................................................................................................9,635 131,869 -- 2,963 6,197 26,997 Indonesia.....................................................................................................12,431 690,374 *16 3,329 320,993 370,595 Malaysia.....................................................................................................16,879 5,592 *32 629 140,513 86,993 Pakistan.....................................................................................................*174 *41,150 -- *181 *1,457 6,228 Philippines.....................................................................................................13,732 66,859 *136 3,562 5,836 125,538 Singapore.....................................................................................................60,400 57,435 -- 1,400 7,931 228,857 Sri Lanka.....................................................................................................*72 *1,709 -- *15 -- *723 Thailand.....................................................................................................24,788 79,529 *80 3,996 10,261 187,739 Vietnam.....................................................................................................*69 *479 *5 *17 ( ¹ ) -- Other Southern and Southeast Asia.....................................................................................................*10 *12,359 -- -- * -196 *1,151
Eastern Asia, total.........................................................................................................879,401 1,177,687 *11,143 17,336 285,232 3,863,012 China.....................................................................................................62,581 85,059 -- 2,232 5,107 22,572 Hong Kong.....................................................................................................8,081 119,974 *2,386 *440 173,121 190,547 Japan.....................................................................................................670,584 687,677 *8,493 7,736 92,408 3,372,016 South Korea.....................................................................................................29,055 4,571 *61 2,687 6,476 168,400 Taiwan.....................................................................................................109,100 280,406 *203 4,242 8,121 109,477 Other Eastern Asia.....................................................................................................( ¹ ) -- -- -- -- -- Asia not allocable.........................................................................................................-- -- -- -- *29 *7 Oceania, total.....................................................................................................................95,598 127,147 ( ¹ ) 7,252 750,466 924,224 Australia.........................................................................................................67,484 115,105 ( ¹ ) 4,800 711,844 677,609 New Zealand.........................................................................................................27,461 10,196 ( ¹ ) *1,714 1,498 236,054 Other Oceania.........................................................................................................*654 *1,846 -- *738 *37,124 *10,562 Puerto Rico and U.S. Possessions, total.....................................................................................................................68,380 73,708 -- 8,809 32,456 83,810 Puerto Rico.........................................................................................................67,715 57,916 -- 7,805 27,875 80,897 U.S. Possessions, total.........................................................................................................*665 15,791 -- 1,004 4,581 2,913 American Samoa.....................................................................................................-- *684 -- *86 -- -- Guam..................................................................................................... *94 12,612 -- *669 4,552 *1,109 Virgin Islands.....................................................................................................*571 2,352 -- *249 *10 *1,222 Other U.S. Possessions.....................................................................................................-- *143 -- -- *19 *583 Country not stated.....................................................................................................................154,172 251,829 10,120 46,449 545,564 269,455 Foreign Sales Corporation dividends ².....................................................................................................................-- -- -- -- -- *102 Interest-Charge Domestic International Sales Corporation dividends ²..............................................................................................................-- -- -- -- -- --
* Data should be used with caution because of the small number of returns on which they are based. ¹ Less than $500. ² Dividends from an Interest-Charge Domestic International Sales Corporation or a Foreign Sales Corporation were not reported for specific foreign countries. ³ Included in gross income (less loss), columns 2-8. 4 Included in total deductions, column 12. NOTE: Detail may not add to totals because of rounding.