corporate finance cost of capital and impairment test ......3.3 which balance sheet items are...
TRANSCRIPT

CORPORATE FINANCE
Cost of Capital and Impairment Test Study 2009Empirical survey of companies in Germany, the Netherlands, Austria, Switzerland and Spain
ADVISORY


© 2010 KPMG International Cooperative (“KPMG International”), a Swiss entity. Member firms of the KPMG network of independent firms are affiliated with KPMG Inter-national. KPMG International provides no client services. No member firm has any authority to obligate or bind KPMG International or any other member firm vis-à-vis third parties, nor does KPMG International have any such authority to obligate or bind any member firm. All rights reserved. KPMG and the KPMG logo are registered trademarks of KPMG International.
Table of contents
Foreword 2 Summary of findings 4 1 About this study 7 1.1 Basic principles and aims of the study 7 1.2 Data collection 8 2 Significance of the impairment test 10 3 Organisation and execution of the impairment test 13 3.1 According to which criteria and at which level are CGUs defined? How many different CGUs have been defined? 13 3.2 How is the recoverable amount determined and which
valuation methods are used? 15 3.3 Which balance sheet items are included when determining the carrying amount? 20
4 Measurement of cash flows 22 4.1 When is the group budget prepared and what modifications are
made to the budget for the impairment test? 22 4.2 Which principles are applied to currency translation (IAS 36.54)? 25 4.3 What is the basis for computing the tax expense for measuring
the cash flows? 28
5 Determination of the cost of capital 29 5.1 In what detail has the cost of capital been derived for the
impairment test and which methods were used? 29 5.2 How is the requirement of the IASB dealt with to perform
the impairment test on a pre-tax basis? 30
6 Cost of capital parameters 32 6.1 Risk-free rate of return 33 6.2 Market risk premium 35 6.3 Beta 37 6.4 Cost of equity 40 6.5 Cost of debt 40 6.6 Capital structure 43 6.7 Weighted cost of capital 44 6.8 Growth rate 45
List of abbreviations 47
About KPMG 48

2 Cost of Capital and Impairment Test Study 2009
© 2010 KPMG International Cooperative (“KPMG International”), a Swiss entity. Member firms of the KPMG network of independent firms are affiliated with KPMG Inter-national. KPMG International provides no client services. No member firm has any authority to obligate or bind KPMG International or any other member firm vis-à-vis third parties, nor does KPMG International have any such authority to obligate or bind any member firm. All rights reserved. KPMG and the KPMG logo are registered trademarks of KPMG International.
The ongoing financial market crisis has destroyed billions of assets in the international capital markets over the last one and a half years. Not only the capital markets but also the real economies have been greatly affected. Many countries around the globe are facing declining economic growth, rising unemployment figures and an increased number of company insolvencies; the short to medium-term prospects have worsened dramatically.
In view of the fact that stock markets are starting to rise again and first quarter profits in the banking sector are reaching pre-crisis levels, one question that is being frequently asked is whether we have finally reached the bottom of the slump and are coming out of the recession or whether this is merely an interim recovery.
Irrespective of how individuals may answer this question for themselves, the uncertainty and the risk remain. Many companies around the world are facing the effects of the financial crisis; particularly with their short to medium-term planning.
161,179 million euros in goodwill from company purchases have accumulated on the balance sheets of German DAX-30 companies. This is contrasted by 447,392 million euros in equity. Is the financial market crisis clouding this bet on future prospects?
It is precisely against this background that the Cost of Capital and Impairment Test Study 2009 provides the opportunity to understand the actual effects of the financial market crisis on the accounting and valuation practice of companies and to derive valuable conclusions from these.
In the tradition of our studies in 2006, 2007 and 2008 we are delighted to be able to present you with the current Cost of Capital and Impairment Test Study 2009.
We have once again chosen an international scope. In addition to the core countries (Germany, Austria and Switzerland), the Netherlands was included for the first time in 2008, and now in 2009 we have added Spain.
Our analysis is divided into the following four main areas:
• Organisation and execution of impairment tests;
• Measurement of cash flows;
• Determination of cost of capital; and the
• Level of the cost of capital parameters.
Foreword

© 2010 KPMG International Cooperative (“KPMG International”), a Swiss entity. Member firms of the KPMG network of independent firms are affiliated with KPMG Inter-national. KPMG International provides no client services. No member firm has any authority to obligate or bind KPMG International or any other member firm vis-à-vis third parties, nor does KPMG International have any such authority to obligate or bind any member firm. All rights reserved. KPMG and the KPMG logo are registered trademarks of KPMG International.
3
In addition to the current analyses and our comments, brief supplementary summaries of the essential rules of IAS 36 are provided for the impairment test as in the previous year.
We conducted our survey in August 2009. Consequently, we have sought to fully consider the effects of the financial market crisis on the impairment tests and the cost of capital.
This study is an empirical investigation aimed at a presentation of company practice. Information and remarks in this study will not provide a complete picture of the proper handling or interpretation of the regulations for impairment tests.
We would like to thank all participating companies and the relevant staff in particular. It was due to them that we were able once again to increase our response rate and therefore improve the results of this study.

4 Cost of Capital and Impairment Test Study 2009
Summary of findings
Data collected
Questionnaires were sent to a total of 592 companies for this year’s Cost of Capital study, with an overall response rate of 18.8 percent. The highest response rate was achieved with German companies (29.6 percent), followed by Swiss companies (19 percent). As in previous years, the participation rate for those companies in the leading indices in both Germany and Switzerland was higher than average. All in all, two thirds of the DAX-30 companies and 40.9 per- cent of the SMI companies participated in the study.
Significance of the impairment test
37 percent of the surveyed companies said that they had recognised a goodwill impairment for the previous business year 2008 which had been already hit by the financial market crisis. Just under one fifth of goodwill (19.5 percent) was written off.
By contrast, 40 percent of the surveyed companies stated that they had recognised an asset impairment. 17 percent of companies recognised both a goodwill and an asset impairment. This means that 60 percent of the surveyed compa-nies recognised at least a goodwill or an asset impairment in the 2008 fiscal year, corresponding to an increase of 20 percentage points compared to 2008.
As anticipated, both the number and the extent of impairments recognised has therefore risen in comparison to the previous year.
Organisation and execution of the impairment test
Over 70 percent of the surveyed companies create a maximum of ten CGUs for the purpose of performing goodwill impairment tests. For the asset impairment test 29 percent of the participating companies form more than ten GCUs, and 16 percent even more than 50 CGUs.
In terms of the chosen valuation method 62 percent of companies prefer to apply the value in use and only 18 percent the fair value less costs to sell. It is striking that only 20 percent of the companies use both criteria to deter-mine the recoverable amount. 79 per- cent of these companies stated that the value in use is higher than the fair value less costs to sell.
Compared to the DCF methods used, market price-oriented multiplier methods – if at all – are of only minor importance and are primarily used to determine the fair value.
© 2010 KPMG International Cooperative (“KPMG International”), a Swiss entity. Member firms of the KPMG network of independent firms are affiliated with KPMG Inter-national. KPMG International provides no client services. No member firm has any authority to obligate or bind KPMG International or any other member firm vis-à-vis third parties, nor does KPMG International have any such authority to obligate or bind any member firm. All rights reserved. KPMG and the KPMG logo are registered trademarks of KPMG International.

5
Measurement of cash flows
59 percent of all surveyed companies use their unadjusted group budget to determine the relevant cash flows. Only half as many companies, 32 per- cent, adjust their group budget accordingly for the purposes of performing impair-ment tests.
In order to allow for the additional risks arising from the crisis on the financial markets in determining the cash flows, the companies use various techniques for budget adjustment and the majority rely on scenario analyses.
The picture is also relatively clear with respect to the handling of foreign currencies in planning. 58 percent of the surveyed companies first translate their cash flows to their reporting currency and then discount these. As many as 83 percent do so if several foreign currencies exist.
Determination of the cost of capital
The cost of capital plays a decisive role when determining the recoverable amount. 97 percent of the participating companies use the Capital Asset Pricing Model to determine the recoverable amount. Around two thirds of compa-nies perform a CGU-specific derivation.
The great majority of surveyed compa-nies (value in use: 76.1 percent; fair value less costs to sell: 82.4 percent) initially base their impairment test on an after-tax calculation. Subsequently, a pre-tax value is derived by using goal
seeking or grossing up (value in use: 40 percent; fair value less costs to sell: 32 percent).
Cost of capital parameters
55 percent of surveyed companies derive the risk-free rate of return from the yield on national government bonds. Use is also made – to an increased extent in Germany (45 percent) – of bond yield curves. The average risk-free rate of return used by the surveyed companies in the 2008 fiscal year is 4.3 percent.
The average market risk premium used by the surveyed companies in the 2008 fiscal year is 5.1 percent.
44 percent of the surveyed companies derive their betas over an observation period of several years – four years on average. The majority of companies also base the derivation of the beta on peer group data (value in use: 51 percent; fair value less costs to sell: 79.5 percent). The average levered beta used by the surveyed companies for the 2008 fiscal year is 1.04.
The levered cost of equity is derived from the factors risk-free rate of return, market risk premium and beta. Depend-ing on the industry, the average cost of equity applied by the surveyed companies for the 2008 fiscal year ranges between 8.8 percent and 11.0 percent, and is 9.9 percent as an overall average (previous year 9.5 percent).
© 2010 KPMG International Cooperative (“KPMG International”), a Swiss entity. Member firms of the KPMG network of independent firms are affiliated with KPMG Inter-national. KPMG International provides no client services. No member firm has any authority to obligate or bind KPMG International or any other member firm vis-à-vis third parties, nor does KPMG International have any such authority to obligate or bind any member firm. All rights reserved. KPMG and the KPMG logo are registered trademarks of KPMG International.

6 Cost of Capital and Impairment Test Study 2009
For the purpose of determining the cost of debt to measure the value in use, 51 percent of the surveyed companies make use of capital market data. In contrast, 44 percent rely on the actual cost of debt of the company or of the CGU. By comparison, 77 percent of companies base their determination of the cost of debt to measure the fair value less costs to sell on capital market data. The average cost of debt recognised by the surveyed companies for the 2008 fiscal year is 6.4 percent and varies between 6.1 percent and 7.3 percent depending on the industry.
To determine the degree of indebted-ness for the purpose of deriving the value in use, 22 percent of surveyed companies use their peer group. 56 per- cent do so for the fair value less costs to sell. The average debt to equity ratio applied by the surveyed companies for the 2008 fiscal year is 66 percent.
Taking the surveyed companies as a whole, an average WACC of 8.0 percent is applied which is on par with the previous year’s level and which ranges from 6.9 percent to 8.8 percent depending on the industry.
To derive the infinite cash flows the majority of surveyed companies use a growth rate in the form of a growth discount on the WACC. 68 percent do so to determine the value in use and 76 percent to determine the fair value less costs to sell. The growth of product/ product group turnover is stated most frequently (35 percent) as a basis to determine the rate of growth. The majority of surveyed companies applied a growth rate of between 1.1 percent and 2.0 percent for the 2008 fiscal year.
© 2010 KPMG International Cooperative (“KPMG International”), a Swiss entity. Member firms of the KPMG network of independent firms are affiliated with KPMG Inter-national. KPMG International provides no client services. No member firm has any authority to obligate or bind KPMG International or any other member firm vis-à-vis third parties, nor does KPMG International have any such authority to obligate or bind any member firm. All rights reserved. KPMG and the KPMG logo are registered trademarks of KPMG International.
© 2010 KPMG International Cooperative (“KPMG International”), a Swiss entity. Member firms of the KPMG network of independent firms are affiliated with KPMG Inter-national. KPMG International provides no client services. No member firm has any authority to obligate or bind KPMG International or any other member firm vis-à-vis third parties, nor does KPMG International have any such authority to obligate or bind any member firm. All rights reserved. KPMG and the KPMG logo are registered trademarks of KPMG International.
7
1 About this study
1.1 Basic principles and aims of the study
The IAS Impairment Test according to IAS 36 is a complex process described in detail in the standard, but which nonetheless raises many questions. The central issue guiding all the analyses of our investigation is therefore how the IFRS rules are actually implemented in the impairment test given the fact that sometimes formulations are unclear and detailed interpretation is frequently needed. Both the impairment test and the rules in IAS 36 have gained signifi- cance as a result of the financial market crisis. In addition to the different modes of action resulting from the room for interpretation provided by IAS 36, this study also presents the current diffi- culties in the practical interpretation of the impairment test as a result of the financial crisis.
We have summarised our analysis in a distinct section pertaining to each of the following issues:
• Organisation and execution;
• Measurement of forecasted cash flows for the impairment test;
• Determination of cost of capital for the impairment test; and
• Cost of capital used and parameters applied.
The purpose of each question is described briefly at the beginning of each section. Where we believe it to be necessary, we have outlined the essence of the applicable IFRS rules to permit better comprehension.
With a few exceptions, the basis of the survey was provided by IFRS financial statements which have been prepared throughout the EU by capital market- oriented companies over the past four years. Accordingly, the majority of the study participants (98 percent) report in accordance with IFRS/IAS.
To the extent possible and where it makes sense we have also assessed the cost of capital by country, industry and stock market segment. Additionally, we have compared our findings with last year’s results.

8 Cost of Capital and Impairment Test Study 2009
© 2010 KPMG International Cooperative (“KPMG International”), a Swiss entity. Member firms of the KPMG network of independent firms are affiliated with KPMG Inter-national. KPMG International provides no client services. No member firm has any authority to obligate or bind KPMG International or any other member firm vis-à-vis third parties, nor does KPMG International have any such authority to obligate or bind any member firm. All rights reserved. KPMG and the KPMG logo are registered trademarks of KPMG International.
111companies took part in this year’s Cost of Capital Study.
1.2 Data collection
This year we contacted a total of 592 companies. The response rate of 18.8 percent is distinctly higher than that of the previous year of 14.9 per- cent. In Spain the response rate was notably lower which is amongst other things attributable to the first-time participation of this country.
At 29.6 percent, the response rate in Germany was once again above the previous year’s level. In the leading indices in Germany and in Switzerland an above-average participation was achieved once again. 66.7 percent of DAX-30 companies participated in the study this year.
Classification of study participants
Segment of stock exchange Number of companies contacted
Number of responses
Response rate
DAX 30 30 20 66.7%
SDAX 33 6 18.2%
MDAX 47 16 34.0%
TecDAX 25 4 16.0%
Madrid General Index (E) 109 6 5.5%
Euronext (NL) 60 9 15.0%
ATX (A) 41 5 12.2%
SMI (CH) 22 9 40.9%
SPI (CH) 103 14 13.6%
Not listed (D, NL, A, CH) 119 21 17.6%
Other 3 1 33.3%
Total 592 111 18.8%
Table 2: Classification of study participants per stock exchange segment
Classification of study participants
Country Number of companies contacted
Number of responses
Response rate
Germany 203 60 29.6%
The Netherlands 93 11 11.8%
Austria 47 7 14.9%
Switzerland 137 26 19.0%
Spain 110 6 5.5%
Others 2 1 50.0%
Total 592 111 18.8%
Table 1: Classification of study participants per country
66.7%of DAX-30 companies participated in the study.

9
© 2010 KPMG International Cooperative (“KPMG International”), a Swiss entity. Member firms of the KPMG network of independent firms are affiliated with KPMG Inter-national. KPMG International provides no client services. No member firm has any authority to obligate or bind KPMG International or any other member firm vis-à-vis third parties, nor does KPMG International have any such authority to obligate or bind any member firm. All rights reserved. KPMG and the KPMG logo are registered trademarks of KPMG International.
Fig. 1: Composition of the sample by industry – Total
Automotive Banking/insurance Chemicals, pharma & health Retail/consumer goods Energy supply Industrial Transport & logistic Others
5%
14%
16%
13%9%
16%
6%
21%
The companies contacted were primarily listed companies with a market capitali- sation exceeding 100 million euros in April 2009. In Germany this totalled 135 companies (including one company from Luxembourg), in the Netherlands 60, in Austria 41, in Switzerland 125 (including a company from Liechtenstein) and in Spain 109. In addition, a further 119 unlisted companies were contacted.
Due to the response rates it was not possible to perform separate statistical assessments for the Netherlands, Austria and Spain. There were similar restrictions in place for special assess-ments, especially those pertaining to the stock market and industry segments. The companies were surveyed from June to September 2009. The fiscal years shown below cover four consoli-dated balance sheet dates: 30 Septem-ber 2008, 31 December 2008 as well as 31 March 2009 and 30 June 2009.
The “Industry” segment consists of industrial enterprises engaged in several different industrial fields as well
as enterprises that manufacture predomi- nantly intermediate industrial products. The “Others” segment comprises companies in other industries that could not be separately evaluated due to the lack of an adequate sample. This includes the sectors construction, media as well as software and technology (all < three percent).

10 Cost of Capital and Impairment Test Study 2009
© 2010 KPMG International Cooperative (“KPMG International”), a Swiss entity. Member firms of the KPMG network of independent firms are affiliated with KPMG Inter-national. KPMG International provides no client services. No member firm has any authority to obligate or bind KPMG International or any other member firm vis-à-vis third parties, nor does KPMG International have any such authority to obligate or bind any member firm. All rights reserved. KPMG and the KPMG logo are registered trademarks of KPMG International.
2 Significance of the impairment test
The influence of the financial market crisis on the impairment test also becomes clear when looking at this year’s results and, in particular, when comparing them with the results of the previous year.
The majority (60 percent) of the surveyed companies stated that they recorded an impairment in the 2008 fiscal year. Around one third of these companies recorded either a goodwill or an asset impairment or even both. A steep rise is therefore evident compared to the previous year (40 percent). Even the number of participating companies who recorded at least a goodwill impairment
rose from 19 percent in the previous year to 37 percent in the 2008 fiscal year. The surveyed companies wrote off their goodwill in the 2008 fiscal year by an average of 19.5 percent (previous year: 14.3 percent).
It is noticeable that 90 percent of the non-listed participating companies stated that they recorded at least an impairment. Almost 50 percent of these companies stated that they recorded at least a goodwill impairment. In 2007, 31 percent of the non-listed companies still stated that they had not made any impairment.
19.5%is the amount by which goodwill was written off on average.
Fig. 2: Execution of an impairment – Total
Goodwill impairment Asset impairment Both No impairment
20%
23%
17%
40%
Fig. 3: Execution of an impairment – Not listed
Goodwill impairment Asset impairment Both No impairment
29%
42%
19%
10%
The significance of the impairment test has basically increased against the background of the ongoing financial market crisis. The short and medium-term planning for the majority of companies is more pessimistic than one year ago. The altered circumstances on the capital markets also influence the cost of capital and multiples which in their turn are frequently used to determine the recoverable amount.

11
© 2010 KPMG International Cooperative (“KPMG International”), a Swiss entity. Member firms of the KPMG network of independent firms are affiliated with KPMG Inter-national. KPMG International provides no client services. No member firm has any authority to obligate or bind KPMG International or any other member firm vis-à-vis third parties, nor does KPMG International have any such authority to obligate or bind any member firm. All rights reserved. KPMG and the KPMG logo are registered trademarks of KPMG International.
Examples of triggering events• Slump in orders• Drop in price• Order cancellations• Sustained under-utilisation of
capacity
Fig. 4: Performance of an impairment due to a triggering event – Total
Goodwill impairment Asset impairment Both No impairment
13%
16%
24%
47%
Fig. 5: Criteria to determine a triggering event – Total
Specific events were defined and quantified, and monitored
Events mentioned in IAS 36 are checked Company-specific material events are checked Other
17%
32%
47%
4%
Particularly against the background of the financial market crisis the question arises as to the extent to which the surveyed companies performed their impairment tests by virtue of triggering events. 53 percent of all surveyed companies stated that they performed an impairment due to a triggering event. A large proportion is attributable to asset impairments.
Considerably more of the surveyed Swiss companies (67 percent) performed an impairment due to a triggering event than the surveyed German companies (43 percent). With 35 percent, this share is smaller once again amongst the DAX-30 companies.
A triggering event may be determined in different ways. In the 2008 fiscal year the majority of surveyed companies spontaneously assessed material events to determine whether they constitute a triggering event. 32 percent of all surveyed companies made a specific test of the events outlined in IAS 36 whilst only 17 percent implemented their own monitoring process.
Of the Swiss surveyed companies there were no considerable differences between the spontaneous assessment of material events (39 percent) and the checking of the events stated in IAS 36 (36 percent).

12 Cost of Capital and Impairment Test Study 2009
© 2010 KPMG International Cooperative (“KPMG International”), a Swiss entity. Member firms of the KPMG network of independent firms are affiliated with KPMG Inter-national. KPMG International provides no client services. No member firm has any authority to obligate or bind KPMG International or any other member firm vis-à-vis third parties, nor does KPMG International have any such authority to obligate or bind any member firm. All rights reserved. KPMG and the KPMG logo are registered trademarks of KPMG International.
Background IFRS – When must an impairment test be performed?
• Goodwill and intangible assets with an indefinite useful life are not to be subjected to scheduled amortisation but only to be amortised in the event of impairment (so-called impairment-only approach). Goodwill, intangible assets with indefinite useful life and corporate assets are to be subjected to an annual impairment test and at further intervals if there are grounds which suggest an impairment (so-called triggering events).
• This is intended to ensure that assets are not valued at more than their recoverable amount. To the extent that book value exceeds the recoverable amount it is necessary to recognise an impairment. As of every balance sheet date all assets are to be tested in order to ascertain if there are indications that the value of these assets has declined.
• IAS 36.12–14 contains a not finalised list of indicators which, if they occur, require the performance of an impairment test. Generally a distinction is made between internal indicators (the origin of which lies in the CGU and/or the enterprise itself), and external indicators (for example, a slump in orders or cancellations of orders, drop in price, sustained under-utilisation of capacity). Ultimately, an enterprise ought to identify the respective relevant indicators and test these at regular intervals.
13
© 2010 KPMG International Cooperative (“KPMG International”), a Swiss entity. Member firms of the KPMG network of independent firms are affiliated with KPMG Inter-national. KPMG International provides no client services. No member firm has any authority to obligate or bind KPMG International or any other member firm vis-à-vis third parties, nor does KPMG International have any such authority to obligate or bind any member firm. All rights reserved. KPMG and the KPMG logo are registered trademarks of KPMG International.
3 Organisation and execution of the impairment test
In general, IAS 36 provides companies with a great degree of freedom in the recognition of operational reality. CGUs may be tailor-made to the planning and control systems in operation in the respective companies – at least within the given framework. In addition to the definition of CGUs, two subjects are frequently discussed within the framework of the organisation and execution of impairment tests in practice despite comparatively clear requirements in the standard: the consistent determination of (a) the recoverable amount and of (b) the carrying amounts in line with the standard. In order to show the prevalent practice more closely with respect to the above subjects, we investigated the following questions:
• According to which criteria and at which level are CGUs defined? How many different CGUs have been defined? (Section 3.1)
• How is the recoverable amount determined and which valuation methods are used? (Section 3.2)• Which balance sheet items are included when determining the carrying amount? (Section 3.3)
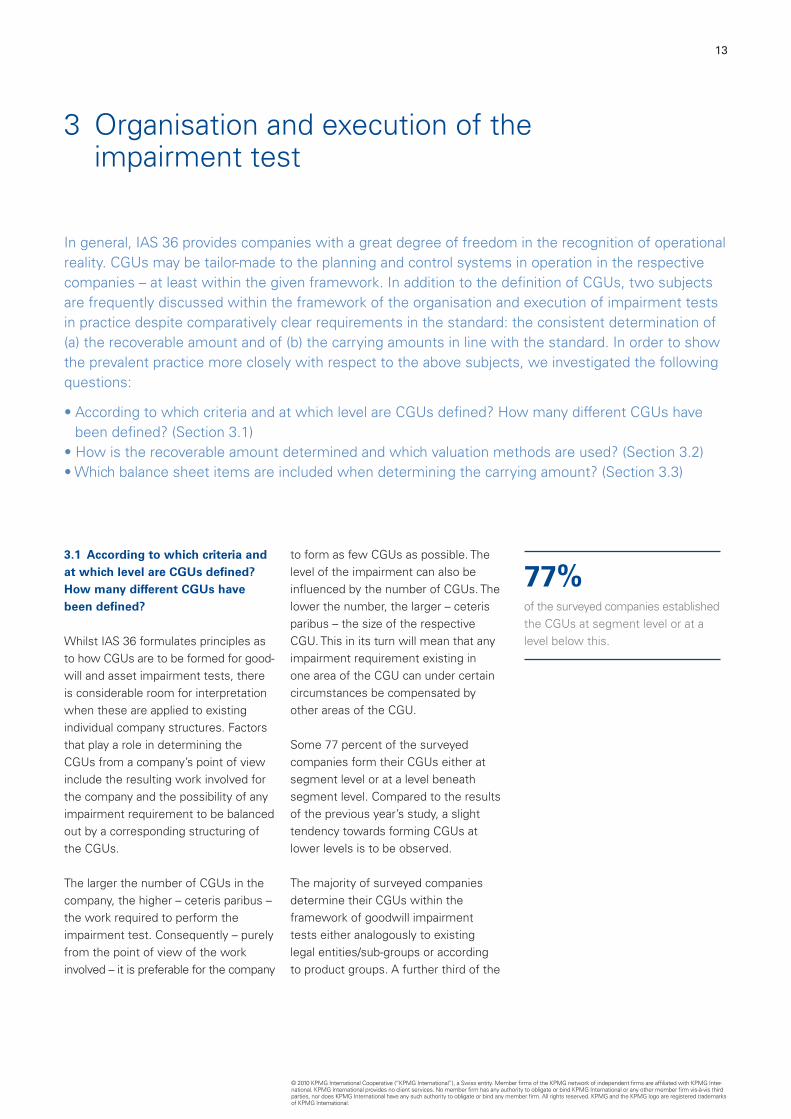
3.1 According to which criteria and at which level are CGUs defined? How many different CGUs have been defined?
Whilst IAS 36 formulates principles as to how CGUs are to be formed for good- will and asset impairment tests, there is considerable room for interpretation when these are applied to existing individual company structures. Factors that play a role in determining the CGUs from a company’s point of view include the resulting work involved for the company and the possibility of any impairment requirement to be balanced out by a corresponding structuring of the CGUs.
The larger the number of CGUs in the company, the higher – ceteris paribus – the work required to perform the impairment test. Consequently – purely from the point of view of the work involved – it is preferable for the company
to form as few CGUs as possible. The level of the impairment can also be influenced by the number of CGUs. The lower the number, the larger – ceteris paribus – the size of the respective CGU. This in its turn will mean that any impairment requirement existing in one area of the CGU can under certain circumstances be compensated by other areas of the CGU.
Some 77 percent of the surveyed companies form their CGUs either at segment level or at a level beneath segment level. Compared to the results of the previous year’s study, a slight tendency towards forming CGUs at lower levels is to be observed.
The majority of surveyed companies determine their CGUs within the framework of goodwill impairment tests either analogously to existing legal entities/sub-groups or according to product groups. A further third of the
77%of the surveyed companies established the CGUs at segment level or at a level below this.

14 Cost of Capital and Impairment Test Study 2009
© 2010 KPMG International Cooperative (“KPMG International”), a Swiss entity. Member firms of the KPMG network of independent firms are affiliated with KPMG Inter-national. KPMG International provides no client services. No member firm has any authority to obligate or bind KPMG International or any other member firm vis-à-vis third parties, nor does KPMG International have any such authority to obligate or bind any member firm. All rights reserved. KPMG and the KPMG logo are registered trademarks of KPMG International.
Fig. 6: Level of CGUs for goodwill impairment – Total
Segment level One level below segment level Two levels below segment level Others
40%
37%
16%
7%
Background IFRS – What are the criteria to use when determining CGUs?
• As a rule the impairment test for goodwill is to be performed at CGU level.
• According to IAS 36.6 a CGU is defined as the smallest identifiable group of assets that generates cash inflows from continuous use that are largely independent of the cash inflows from other assets or groups of assets.
• In testing a CGU for impairment, the purchased and identified assets and liabilities as well as the goodwill must be allocated to the buyers’ CGUs at the time of purchase. Goodwill is therefore allocated to those CGUs that are likely to profit from the expected synergy effects at the time of the business combination regardless of whether other assets or liabilities have been allocated to these CGUs (IAS 36.80).
• The CGUs or groups of CGUs to which goodwill is allocated, must in compliance with the so-called management approach, at the same time also constitute the lowest management level at which the goodwill is controlled for internal management purposes. However, they may not be larger than a segment in terms of IAS 14 (and as of 1 January 2009 not larger than an operating segment in terms of IFRS 8).
surveyed companies use either sales markets/customer groups or geographi-cal distribution to determine the CGUs. A similar picture was also observable in the previous years.
It is noticeable that the responses to the question as to the criteria applied to determine the CGUs for the goodwill impairment test differed greatly in the
various countries. Whilst in Germany the product group is the most frequently stated decision-making criterion (41 per- cent), the geographical position is stated in Spain (34 percent), in the Netherlands the sales markets (37 per- cent) and in Austria and Switzerland the legal entity/sub-group (67 percent and 37 percent, respectively).
Fig. 7: Criteria for the determination of CGUs for goodwill impairment – Total
Legal entities/sub-groups 39%
Functions 5%
Product groups 37%
Sales markets/customer groups 21%
Geographic 20%
Others 9%
0 10 20 30 40 50As percentage

15
© 2010 KPMG International Cooperative (“KPMG International”), a Swiss entity. Member firms of the KPMG network of independent firms are affiliated with KPMG Inter-national. KPMG International provides no client services. No member firm has any authority to obligate or bind KPMG International or any other member firm vis-à-vis third parties, nor does KPMG International have any such authority to obligate or bind any member firm. All rights reserved. KPMG and the KPMG logo are registered trademarks of KPMG International.
With respect to the number of CGUs selected for the goodwill impairment test, over 90 percent of participating companies stated that they define a maximum of 20 CGUs for their goodwill impairment test, while 70 percent determine a maximum of ten CGUs.
By contrast to the generally observable trend, one company stated that it defines more than 70 CGUs for the goodwill impairment test.
The difference in the number of CGUs is more distinct for the asset impairment test than for the goodwill impairment test. This shows that the goodwill is usually only distributed across the larger valuation units. 29 percent of partici-pating companies define over 20 CGUs for the asset impairment test with 16 percent forming even more than 50 CGUs.
Fig. 8: Number of CGUs – Total
50%
40%
30%
20%
10%
0%0 to 5 5 to 10 10 to 20 20 to 30 30 to 40 40 to 50 50 to 60 70
46
43
25
17
20
11 5
5 3 52
16
2 1
Number of CGUs Goodwill impairment test Asset impairment test
70%of the surveyed companies determine a maximum of ten CGUs for their goodwill impairment tests.
3.2 How is the recoverable amount determined and which valuation methods are used?
According to IAS 36.18, the recoverable amount is the higher of the fair value less costs to sell and value in use. It is relevant to the reporting companies for efficiency reasons that the value in use and fair value less costs to sell need not be calculated in parallel if the first value measured already exceeds the carrying amount (IAS 36.19). This gives companies the latitude to select which valuation concept they wish to use in a first step.
But what are the decision-making criteria that essentially influence the selection of one of the two valuation concepts? Both concepts are based on different valuation perspectives which must be taken into consideration in the specific application and which entail corresponding advantages and disad-vantages with respect to feasibility and amount of work.
The value in use reflects the perspective of the company using the asset or CGU. The income approach is to be applied here. For the corresponding derivation of the cash flows this perspective means that the company must consider real synergy effects between CGUs and assets. On the other hand cash flows from not yet specifically planned future restructuring and from the extension investments of the CGU or of the asset must be eliminated. In addition cash flows from financing and taxes are not considered.

16 Cost of Capital and Impairment Test Study 2009
© 2010 KPMG International Cooperative (“KPMG International”), a Swiss entity. Member firms of the KPMG network of independent firms are affiliated with KPMG Inter-national. KPMG International provides no client services. No member firm has any authority to obligate or bind KPMG International or any other member firm vis-à-vis third parties, nor does KPMG International have any such authority to obligate or bind any member firm. All rights reserved. KPMG and the KPMG logo are registered trademarks of KPMG International.
By contrast the fair value less costs to sell basically corresponds to the market price or the value derived from market prices. Contrary to the derivation of the value in use, when determining the fair value less costs to sell it must first be checked whether a market price-oriented method (e.g. the multiple method) can be used. Any such market-oriented valuation usually fails due to the fact that corresponding information does not exist for the specific case of valuing a CGU. In these cases recourse may be made to the income approach also for the fair value less costs to sell. Contrary to deriving the cash flows for purpose of the value in use, when measuring the cash flows for purpose of the fair value less costs to sell real synergy effects included in the forecast must be eliminated.
All in all the respective company must consider the work associated with the choice of the valuation concept in every individual case. Essential questions are as follows: do sufficiently reliable market data exist to be able to reliably perform a valuation using a market price-oriented method? Which adjustments must be made with respect to the budgets if a income approach is selected, be this to derive the value in use or the fair value less costs to sell? Is it at all possible to perform these adjustments reliably and with an acceptable level of work?
Our study shows that the majority of surveyed companies, this year 80 per- cent, have merely derived either the value in use or the fair value less costs to sell to determine the recoverable amount.
With 62 percent, the majority of all surveyed companies calculated the value in use exclusively. Only about 18 percent of the companies base their impairment tests exclusively on the fair value less costs to sell. Accordingly, this leaves 20 percent of companies who have determined both the value in use and the fair value less costs to sell.
If the companies registered in Germany are viewed exclusively, the comparison to the previous year shows that consid- erably more of the surveyed companies determined a value in use (58 percent compared to 49 percent). This trend can be recognised particularly amongst the DAX-30 companies. 38 percent of the DAX-30 companies determined only the value in use in 2008. This year 55 percent of these companies stated that they calculated the value in use exclusively and only 15 percent (previous year 31 percent) exclusively determine the fair value less costs to sell.
80 percent of the Swiss companies determined a value in use and only eight percent exclusively determined a fair value less costs to sell.
One main reason for a rise in the share of companies who exclusively determine a value in use is probably that when selecting a valuation concept in view of the “credit crunch” the companies assume that a transaction price-oriented valuation will lead to lower values than a comparable valuation with assumed own use of the CGU or asset.
82%of the surveyed companies determine the value in use to measure the recoverable amount.
Fig. 9: Applied measure of value – Total
Value in use Fair value less costs to sell Both
62%18%
20%
Fig. 10: Applied measure of value – Switzerland
Value in use Fair value less costs to sell Both
80%
8%
12%

17
© 2010 KPMG International Cooperative (“KPMG International”), a Swiss entity. Member firms of the KPMG network of independent firms are affiliated with KPMG Inter-national. KPMG International provides no client services. No member firm has any authority to obligate or bind KPMG International or any other member firm vis-à-vis third parties, nor does KPMG International have any such authority to obligate or bind any member firm. All rights reserved. KPMG and the KPMG logo are registered trademarks of KPMG International.
According to IAS 36.25 the fair value less costs to sell is primarily to be determined by market price-oriented methods. Since stock market prices have dropped greatly due to the financial market crisis, a fair value less costs to sell derived from market prices would be presumably far below the carrying amount. In practice the fair value less costs to sell is regularly determined on the basis of the income approach due to a lack of market data comparable with CGUs. It is precisely in these cases that it is expedient to compare the total of fair value less costs to sell of all CGUs with the market capitalisation. The fair value less costs to sell per CGU may need to be adjusted accordingly to ensure that the fair value less costs to sell per CGU actually reflects current market assessments.
If a material part of a company is subjected to an impairment test with application of the value in use, then similar to the fair value less costs to sell, it makes sense to compare the overall value in use, i.e. the total of value in use of all CGUs, with market capitali-sation (plus interest-bearing liabilities) in order to check the correctness of the valuations. There may be a number of reasons as to why the two values differ. A plausibility check of the value in use compared to the stock market price at a higher aggregation level will prove, however, that the assumptions made as part of the capitalised earnings calculation do not contradict the market assessment.
Also due to possible market exaggera-tions, the fair value less costs to sell tends to be below the value in use in times of crisis. This was also confirmed by our study. 79 percent of companies who determined both the fair value less costs to sell and the value in use state that the value in use was higher. Against this background an impairment test based on fair value less costs to sell will frequently lead to an impairment. This is certainly one reason why the majority of companies exclusively calculate the value in use. Our empirical survey also shows that the preference of companies for the value in use has increased in view of the financial crisis.
79%of the surveyed companies who determined both value in use and fair value less costs to sell stated that the value in use is the higher of the two values.

18 Cost of Capital and Impairment Test Study 2009
© 2010 KPMG International Cooperative (“KPMG International”), a Swiss entity. Member firms of the KPMG network of independent firms are affiliated with KPMG Inter-national. KPMG International provides no client services. No member firm has any authority to obligate or bind KPMG International or any other member firm vis-à-vis third parties, nor does KPMG International have any such authority to obligate or bind any member firm. All rights reserved. KPMG and the KPMG logo are registered trademarks of KPMG International.
89%of the surveyed companies use a income approach to determine the fair value less costs to sell.
Background IFRS – Which valuation methods are used to specify recoverable amount?
• According to IAS 36.18, the recoverable amount is the higher of either fair value less costs to sell or value in use. It conforms to the amount a rational merchant would obtain from an asset/ CGU under examination. He compares the value from the further use (value in use) with a price recoverable from a sale to a third party. If he acts rationally he will obtain the higher value.
How is fair value less costs to sell determined?
• Fair value less costs to sell is the amount obtainable from the sale of an asset or CGU in an arm’s-length transaction between knowledgeable, willing parties less costs of disposal (IAS 36.6; IDW RS HFA 16 Txt. 8). Here the perspective of a typified market participant is assumed. The costs to be deducted are legal fees or similar transaction costs, transport costs as well as expenses incurred to make the asset or CGU ready for sale (IAS 36.28).
In practice, costs to sell are often determined at one to two percent of fair value for purposes of simplification.
• Pursuant to IAS 36.25 f., market price-oriented methods are preferred when determining fair value less costs to sell. Accordingly there must be an active market for the asset and/or the CGU or at least for a comparable asset and/or CGU, whose market price could be applied to the asset or the CGU. If there are no such market prices, then the income approach is to be used.
• In particular in selecting the income approach it must be ensured that all main planning parameters (e.g. price and volume development, profit margin development etc.) are not determined by the internal perspective of management but are to be substantiated by observable market data (industry reports, analysis reports, peer group analyses).
As in the previous year there is a clear trend of all participating companies in favour of the entity/WACC valuation method irrespective of whether a value in use or a fair value less costs to sell was determined. The share was 90 per- cent for the value in use calculation and 76 percent for determination of the fair value less costs to sell.
The equity approach was used pre-dominantly by banks and insurers.
The prime use of the entity/WACC approach is derived from the concept and the purpose of the impairment
test: an operational value is to be determined for an asset or a CGU that results from the recoverable payment surpluses (either from use or sale). This value should be independent of the specific financing structure realised by the accounting entity.
The use of the equity approach by banks and insurers is attributable to the fact that their assets can only be assessed in connection with the pertinent financing because financing is part of the operative business. Therefore these sectors generally apply the equity approach for impairment tests.

19
© 2010 KPMG International Cooperative (“KPMG International”), a Swiss entity. Member firms of the KPMG network of independent firms are affiliated with KPMG Inter-national. KPMG International provides no client services. No member firm has any authority to obligate or bind KPMG International or any other member firm vis-à-vis third parties, nor does KPMG International have any such authority to obligate or bind any member firm. All rights reserved. KPMG and the KPMG logo are registered trademarks of KPMG International.
The use of the multiples-based approach to determine the fair value has declined by about half to nine per cent compared to the previous year (18 percent). One reason for this could be the assessment that the existing data reflect comparably low market prices due to the financial crisis. The number of company trans-actions and consequently the availability of corresponding data – similarly caused by the financial crisis – also declined steeply last year.
Background IFRS – How is value in use determined?
Value in use corresponds to the present value of estimated future cash flows that can be expected from the continued use of an asset, CGU or group of CGUs and their disposal at the end of the useful life (IAS 36.31). Value in use reflects the knowledge and expectations of the reporting enterprise as well as enterprise-specific factors that, if applicable, only pertain to the reporting enterprise and are not generally applicable to other enterprises.
Altogether it was found that DCF approaches were used overwhelmingly for both value standards, namely the entity/WACC approach and the equity approach. The multiples-based approach is attributed only a subordinate role even to determine the fair value.
Fig. 11: Valuation method used – Total
100%
80%
60%
40%
20%
0% Entity/WACC method Equity method Multiples-based approach Others
90
76
1013 3
9 1 7
Value in use Fair value less costs to sell

20 Cost of Capital and Impairment Test Study 2009
© 2010 KPMG International Cooperative (“KPMG International”), a Swiss entity. Member firms of the KPMG network of independent firms are affiliated with KPMG Inter-national. KPMG International provides no client services. No member firm has any authority to obligate or bind KPMG International or any other member firm vis-à-vis third parties, nor does KPMG International have any such authority to obligate or bind any member firm. All rights reserved. KPMG and the KPMG logo are registered trademarks of KPMG International.
3.3 Which balance sheet items are included when determining the carrying amount?
After determining the recoverable amount it is compared to the carrying amount to determine whether there is any need to recognise an impairment of the CGU. A main principle in deriving the carrying amount is the so-called equivalence principle. According to this principle it must be ensured that the assets grouped in the carrying amount of a CGU and any debts to be incorpo-rated are causally connected with the cash flows on which the calculation of the recoverable amount is based.
The overwhelming majority, more than nine of ten companies, incorporate the working capital in the calculation of the carrying amount. By contrast distinctly fewer than half the surveyed companies do so for pension provisions, deferred taxes from purchase price allocations and tax loss carryforwards.
Companies basically comply with the equivalence principle by including working capital in the carrying amount. This applies if the cash flows on which the recoverable amount is based include changes in working capital.
Those surveyed companies who did not include the working capital in the carrying amount must consider the buildup of the recoverable amount in the cash flows when determining the recoverable amount. Only in this way can the equivalence principle be ensured. Ultimately, the selection of one of the two described approaches does not alter the result of the impairment test.
One third of the surveyed companies include pension provisions in the calcu- lation of the carrying amount. If this is the case the cash flows must be reduced by the outpayments attributable to pensions to determine the recover-able amount. However, the majority of companies follow the requirements of the IAS 36 according to which this deduction need not be made. In this case the pension provisions are then not to be recognised as part of the carrying amount of the CGU.
The equivalence principle is also pertinent in connection with deferred taxes from a purchase price allocation. The higher value of assets for tax purposes has an impact on the cash flows through the level of depreciation and the resultant tax saving. Most companies do not include the deferred taxes from the purchase price allocation in the carrying amount. In these cases it is necessary to make sure that the (fictitious) depre- ciation-induced tax advantages from the (new) valuation are included in the recoverable amount when performing the impairment test. If, however, deferred taxes are included in the book value, then the depreciation and resultant tax advantages are to be reduced accordingly.
Fig. 12: Carrying amount – Total
0 10 20 30 40 50 60 70 80 90 100
Considered in the carrying amount Not considered in the carrying amount
Tax loss carryforwards 22% 63%
Deferred taxes ofprecedent PPAs 36% 54%
Pension provisions 33% 55%
Working capital 92% 5%
As percentage

21
© 2010 KPMG International Cooperative (“KPMG International”), a Swiss entity. Member firms of the KPMG network of independent firms are affiliated with KPMG Inter-national. KPMG International provides no client services. No member firm has any authority to obligate or bind KPMG International or any other member firm vis-à-vis third parties, nor does KPMG International have any such authority to obligate or bind any member firm. All rights reserved. KPMG and the KPMG logo are registered trademarks of KPMG International.
Background IFRS – What is the composition of the carrying amount?
• When measuring the carrying amount of a CGU it is necessary to ensure that those assets are included that are found in cash flows which are also the basis for the recoverable amount (so-called equivalence principle, see IAS 36.75 and 79).
• According to IAS 36.50 assets and liabilities pertaining to income taxes, such as deferred tax assets and liabilities, tax refund claims or tax liabilities and provisions are not to be considered in the carrying amount for a CGU or in the cash flows of its recoverable amount. Only future setoff possibilities that arise from planned losses of the CGU in particular years and which are balanced in the planning horizon by carryforward and thus are not subject to IAS 12 are to be considered.
• However deferred taxes determined in the context of a purchase price allocation can be considered in the carrying amount for reasons of consistency. At the same time, when determining the cash flows to be discounted, the valuation base for the adjusted taxes (EBIT) is to be adjusted for depreciation related to the part of the item for which the deferred taxes were accrued in the purchase price allocation.
• The deferred tax liabilities arising from the purchase price allocation are included since a depreciation-induced tax advantage is recognised in the purchase price allocation as appreciation of the individual assets. Hence one takes into account first of all that the depreciation pertaining to the asset recognised ceteris paribus leads to a reduction in the tax burden. Yet this tax advantage does actually have no effect in most cases. For these cases deferred taxes are applied.
• Financial liabilities are not allocated to a CGU in accordance with IAS 36.76 (b). Pension provisions are therefore not considered in the carrying amount of the CGU since they represent an external financing component.
• Pursuant to IAS 36.79, for example, trade receivables and payables as well as other obligations (working capital) may be included in the carrying amount for practical reasons.
As of the valuation date tax loss carry- forwards do not constitute part of the carrying amount. One of the reasons here is the pre-tax perspective require-ment for the impairment test by the IASB. When determining cash flows, future setoff possibilities arising from the CGU’s forecasted losses can be included.
All in all no essential changes compared to the previous year arose with respect to the (non-)consideration of the above- mentioned balance sheet items in the carrying amount. The overall picture does also not change essentially when considering the results of the individual countries.

22 Cost of Capital and Impairment Test Study 2009
© 2010 KPMG International Cooperative (“KPMG International”), a Swiss entity. Member firms of the KPMG network of independent firms are affiliated with KPMG Inter-national. KPMG International provides no client services. No member firm has any authority to obligate or bind KPMG International or any other member firm vis-à-vis third parties, nor does KPMG International have any such authority to obligate or bind any member firm. All rights reserved. KPMG and the KPMG logo are registered trademarks of KPMG International.
4 Measurement of cash flows
Our analyses (Section 3.3) show that DCF methods to determine the recoverable amount of a CGU or of an asset are of great importance in practice. This observation does not depend on whether a value in use or a fair value less costs to sell has been determined.
If the recoverable amount is calculated using a DCF method, then it will correspond to the present value of the future cash flows expected from the CGU examined. The cash flows are usually derived from the company budget prepared for the entire group. This basis may possibly be modified depend-ing on the selected valuation concept. The equivalence principle already mentioned is also of decisive importance in determining cash flows. Attention should be given to ensuring a consistent approach both in the determination of the cash flows and the cost of capital and in calculating the recoverable amount and carrying amount. In the light of this the following issues are discussed:
• When is the group budget prepared and what modifications are made to the budget for the impairment test? (Section 4.1)
• Which principles are applied to currency translation (IAS 36.54)? (Section 4.2)• What is the basis for computing the tax expense for measuring the cash flows? (Section 4.3)
4.1 When is the group budget prepared and what modifications are made to the budget for the impairment test?
IAS 36 requires current measurement parameters both to determine a value in use and a fair value less costs to sell. Accordingly, IAS 36.33 requires that the current budget or management budget be used to determine the cash flows for the calculation of a value in use. By contrast, the standard refers to the current market prices or comparable transactions for the calculation of a fair value less costs to sell. In the light of this the question that arises is how up to date group budgets are if they serve as a basis for the impairment test.
All in all the majority of all surveyed companies (91 percent) prepared their original group budget a maximum of three months before performing the impairment test. This percentage was even higher for Germany, Spain, the Netherlands and Austria. Switzerland was one exception where just under 21 percent of participating companies prepared their original group budget between four and nine months before performing the impairment test.
The non-listed surveyed companies prepared their original budget without exception up to three months before performing the impairment test. This shows that the reporting practice predominantly satisfies the requirements set out in the standard for current data to be used.
91%of the surveyed companies consider a company budget for the impairment test that is a maximum of three months old.

23
© 2010 KPMG International Cooperative (“KPMG International”), a Swiss entity. Member firms of the KPMG network of independent firms are affiliated with KPMG Inter-national. KPMG International provides no client services. No member firm has any authority to obligate or bind KPMG International or any other member firm vis-à-vis third parties, nor does KPMG International have any such authority to obligate or bind any member firm. All rights reserved. KPMG and the KPMG logo are registered trademarks of KPMG International.
Depending on the valuation concept, IAS 36 makes specific requirements to determine the recoverable amount. Therefore in a second step it must be asked whether this group budget is used to calculate a value in use or a fair value less costs to sell or which corrections may have been made by the company.
Fig. 13: Time of preparing group budget – Total
60%
40%
20%
0% Up to one month 2 to 3 months 4 to 6 months 7 to 9 months More than 9 months before the before the before the before the before the impairment test impairment test impairment test impairment test impairment test
54
38
5 2 2
All in all 59 percent of the surveyed companies stated that they used their group budget in an unmodified form to perform impairment tests and to break these down to the CGUs or assets. Only 32 percent stated that they make adjustments to the group budget and only nine percent of all participating companies prepare their own budget for the purposes of performing impair-ment tests. 16 percent of Swiss sur- veyed companies prepare their own budget.
The surveyed companies reacted differently with respect to adjustments of their budgets to the current financial
Fig. 14: Use of group budget for the good- will impairment test – Total
Yes, unchanged group budget allocated to CGUs Yes, group budget is first modified and then allocated to CGUs
No, separate budget for impairment test purposes
59%
32%
9%
market crisis. A few of the surveyed companies adjusted their budgets in more than one way.
At just under 55 percent, the majority of participating companies perform scenario analyses due to the altered overall economic framework conditions for the underlying budget. Where adjustments were made to the budget in reaction to the financial market crisis, some 34 percent of the surveyed companies made these corrections to the main value drivers in a top-down manner. Conversely, a good 23 percent of companies corrected their value drivers on the basis of bottom-up adjustments.
The same trend emerges for the German companies (65 percent scenario analy- ses; 42 percent top-down corrections; 15 percent bottom-up corrections) as for the entirety of responding compa-nies. It is noticeable by contrast that 31 percent of the DAX-30 companies prepared a completely new budget. This is a distinctly higher share com-pared to the percentage of all surveyed companies.
A different trend was observable with the Swiss companies. Only 36 percent of the Swiss surveyed companies stated that they had performed a scenario analysis. 45 percent of the Swiss sur- veyed companies performed bottom-up corrections of material value drivers for the underlying budget due to the financial crisis.

24 Cost of Capital and Impairment Test Study 2009
© 2010 KPMG International Cooperative (“KPMG International”), a Swiss entity. Member firms of the KPMG network of independent firms are affiliated with KPMG Inter-national. KPMG International provides no client services. No member firm has any authority to obligate or bind KPMG International or any other member firm vis-à-vis third parties, nor does KPMG International have any such authority to obligate or bind any member firm. All rights reserved. KPMG and the KPMG logo are registered trademarks of KPMG International.
The most important question in the budget analysis in this context was the extent to which these were only short and medium-term impacts or long-term/ sustained changes. Frequently, it could be rather short or medium-term impacts such as slumps in turnover and a corre- sponding decline in profits.
In many cases it may be expedient to make a two-stage extrapolation of the cash flows forecasts beyond the period covered by detailed financial planning (detailed planning horizon maximum five years according to IAS 36) in view of the recession. Ultimately, a three-phase model will result from the usual two- phase model (detailed planning and terminal value) whereby only a rough planning phase is inserted as the
Fig. 15: Impacts of the financial crisis on the group budget – Total
60%
40%
20%
0% Budget is Bottom-up Top-down Extension of Scenario completely adjustments of adjustments of detailed planning analyses revised material value material value horizon drivers drivers
25 23
34
11
55
second phase in order to guarantee that a sustainable result and not one impaired by the financial crisis is considered as basis for the terminal value.
In all circumstances it may be expected that the financial market crisis will have a negative effect in the majority of companies on at least the short and medium-term detailed planning.
The results of our study show that the entirety of the surveyed companies reacted to the financial market crisis in the preparation of their budgets and made appropriate adjustments. More- over, the surveyed companies use scenario analyses or completely redraft their budgets.
55%of the surveyed companies react to the financial market crisis by performing scenario analyses in their budget planning.

25
© 2010 KPMG International Cooperative (“KPMG International”), a Swiss entity. Member firms of the KPMG network of independent firms are affiliated with KPMG Inter-national. KPMG International provides no client services. No member firm has any authority to obligate or bind KPMG International or any other member firm vis-à-vis third parties, nor does KPMG International have any such authority to obligate or bind any member firm. All rights reserved. KPMG and the KPMG logo are registered trademarks of KPMG International.
4.2 Which principles are applied to currency translation (IAS 36.54)?
A company is always confronted with the subject of foreign currency translation if it generates cash flows in a currency that differs from the reporting currency. If this is the case two approaches are available if the DCF method is used:
Background IFRS – Which adjustments are to be made to the budget for value in use and fair value less costs to sell?
• The point of measuring value in use is to determine the value to the enterprise from the continued use of the relevant asset/respective CGU. However, this perspective only includes the earnings potential of the asset/respective CGU without modification at the time when the impairment test is made. Therefore it is necessary to ensure that when measuring value in use the estimated cash flows include no effects that would be caused by future restructuring which the company has not yet undertaken or by future new investment that would increase the earnings capacity of the asset/CGU (IAS 36.33 (b), IAS 36.44 ff.).
• If changes in future cash flows are expected due to new investments that have already been started as of the valuation date and for which material outflows of funds have already occurred, then these cash flows changes are indeed to be considered when measuring an impairment (IAS 36.48).
• Corresponding budget elements are however not to be eliminated when measuring fair value less costs to sell. Rather, planning premises are to be reviewed when measuring fair value less costs to sell to determine whether they conform to market expectations. Accordingly, a management budget may not – in contrast to value in use – be adopted without further examination. Instead central assumptions, such as sales growth, profit margin development and long-term growth, should be derived from market expectations (e.g. industry or analyst reports). Genuine synergy effects that are enterprise-specific and would not apply to potential buyers or not applied in the same amount, are also not considered.
(a) the cash flows are discounted in the foreign currency and the total of present values of these are then converted to the reporting currency; (b) the foreign currency cash flows are directly converted to the reporting currency and then discounted.
As in the previous year, the majority of all surveyed companies, some 58 percent, selected the alternative to first convert their cash flows to the reporting currency and then to discount them. The share of the surveyed companies choosing this method increases to 84 percent if the company is required to convert from more than one foreign currency. This increase would appear to be logical because this alternative
Fig. 16: Currency translation – Total1
0 20 40 60 80 100
Discounting in reporting currency Discounting in foreign currency
Several foreign currencies 84% 17%
One foreign currency 59% 43%
As percentage
Note 1: Multiple answers were possible in response to this question so that it is possible that the total deviatesfrom 100 percent.

26 Cost of Capital and Impairment Test Study 2009
© 2010 KPMG International Cooperative (“KPMG International”), a Swiss entity. Member firms of the KPMG network of independent firms are affiliated with KPMG Inter-national. KPMG International provides no client services. No member firm has any authority to obligate or bind KPMG International or any other member firm vis-à-vis third parties, nor does KPMG International have any such authority to obligate or bind any member firm. All rights reserved. KPMG and the KPMG logo are registered trademarks of KPMG International.
usually means comparatively less work if cash flows arise in more than one foreign currency.
The share of companies among the German surveyed companies who trans- late the cash flows directly to their reporting currency is even higher than for the entirety of the sample. An overall 67 percent do so if only one foreign currency exists and 95 percent if several foreign currencies exist.
By contrast the majority of Swiss sur- veyed companies (56 percent) who have only one foreign currency differing from the reporting currency discount their cash flows in the foreign currency and translate the present value to the reporting currency. If there are several foreign currencies 67 percent of the Swiss surveyed companies directly translate their cash flows to the report- ing currency and then discount these translated cash flows.
95%of the German surveyed companies translate cash flows in several foreign currencies to their reporting currency first and then perform discounting.
If a company selects the alternative of first translating its cash flows into its reporting currency, the question to be asked following this selection concerns the conversion rate to be used. In principle there are spot rates, forward rates or the given forecasted exchange rates of the company. The respective choice of translation rate must above all guarantee that the same inflation expectations are taken into considera-tion in discounting the future cash flows in the numerator and in the denominator (see also “Background IFRS” on the following page).
All in all there are no essential differ-ences between companies with one and companies with several foreign currencies with respect to the type of exchange rate used. The overwhelming majority of all surveyed companies state that they use the given forecasted exchange rate of the group.
Fig. 17: Exchange rates – Total
Cash flows discountedin foreign currency and present valuetranslated
Cash flows converted into reporting currency and discounted
27% 73%
Spot rate Forward rate for the planning period
Given exchange rate of the group
8%7%
58%

27
© 2010 KPMG International Cooperative (“KPMG International”), a Swiss entity. Member firms of the KPMG network of independent firms are affiliated with KPMG Inter-national. KPMG International provides no client services. No member firm has any authority to obligate or bind KPMG International or any other member firm vis-à-vis third parties, nor does KPMG International have any such authority to obligate or bind any member firm. All rights reserved. KPMG and the KPMG logo are registered trademarks of KPMG International.
Background IFRS – What is the rule for handling currency differences within a CGU?
• If there is a difference between the reporting currency, i.e. the currency in which the carrying amount is presented, and the currency in which the corresponding cash flows occur, then a corresponding translation is required for the impairment test. The general rule is first to discount the expected cash flows in the currency in which they occur (IAS 36.54). Here attention must be paid to the fact that individual inflation expectations in each currency region, as well as other factors, lead to different costs of capital. Therefore discounting the cash flows in the corresponding currency region should be based on a reasonable cost of capital. The resulting recoverable amount is then translated into the reporting currency at the spot rate on the day of the impairment test and compared with the carrying amount.
• More extensive considerations are necessary if a CGU generates cash flows in several currencies. In this case it is advisable to first translate the different expected cash flows into the reporting currency. Forward rates are recommended, in particular those for the respective planning year. For example the cash flows of the third planning year should be translated at the corresponding three-year forward rate. If the forward rate of the reporting currency is used then the influences mentioned which lead to individual costs of capital for each currency region are considered. Then the cash flows expressed in the reporting currency can be discounted with the cost of capital for the reporting currency region without further adjustments. Finally the resulting recoverable amount must then be compared to the carrying amount.
• Only under special circumstances are constant translation rates for future foreign currency cash flows to be used (please refer to our remarks in the main text, too).
It should be emphasised that if a foreign currency exists none of the German surveyed companies, and in the event of several foreign currencies only three percent of them, use forward rates to translate the foreign currency
into the reporting currency. The compa- nies who did not use the forward rate must guarantee consistency of cash flows with respect to the inflation expectations considered when deter-mining cost of capital.

28 Cost of Capital and Impairment Test Study 2009
© 2010 KPMG International Cooperative (“KPMG International”), a Swiss entity. Member firms of the KPMG network of independent firms are affiliated with KPMG Inter-national. KPMG International provides no client services. No member firm has any authority to obligate or bind KPMG International or any other member firm vis-à-vis third parties, nor does KPMG International have any such authority to obligate or bind any member firm. All rights reserved. KPMG and the KPMG logo are registered trademarks of KPMG International.
Background IFRS – What is important in determining the corporate tax rate when computing value in use and fair value less costs to sell?
• If the enterprise bases its calculation on an after-tax view, then the tax effects should also be considered in the cash flows. The rule is that a pre-tax calculation is required as the basis for the impairment test. If there are tax effects, individual company circumstances, e.g. from loss carryforwards, should not be considered, also in the value in use calculation. A corporate tax rate should be determined, both for measuring fair value less costs to sell and for measuring value in use, that corresponds to the tax rate for a typical enterprise operating at the same location. It makes sense here to define a tax rate for each CGU.
• If foreign sales are generated by the CGU then a corresponding typical tax rate has to be determined for these countries. For example, the KPMG Tax Rate Survey (“KPMG’s Corporate and Indirect Tax Rate Survey 2009”)1 can serve as a source of information here. Ideally the foreign tax rate must be weighted with the EBIT (Earnings before Interest and Taxes) generated in the respective country, and from that a tax rate can be determined that can be used both for derivation of the free cash flows and when determining the cost of capital.
4.3 What is the basis for computing the tax expense for measuring the cash flows?
The question of the applied corporate tax rate arises in the event that the surveyed companies perform after-tax calculations to determine the recover-able amount.
All in all 43 percent of all surveyed companies stated that they use individual tax rates for the respective CGUs. A further 36 percent of all participating companies stated that
they use their group tax rate. Only 20 percent use a country-specific marginal tax rate.
The Swiss surveyed companies largely use individual tax rates for the CGUs. By contrast only 19 percent of the Swiss surveyed companies use the group tax rate to determine the cash flows.
Fig. 18: Applied tax rate – Total
Group tax rate Individual tax rate of the CGU Country-specific marginal tax rate Others
36%
43%
20%
1%
1 http://www.kpmg.com/Global/en/WhatWeDo/Tax/Pages/default.aspx

29
© 2010 KPMG International Cooperative (“KPMG International”), a Swiss entity. Member firms of the KPMG network of independent firms are affiliated with KPMG Inter-national. KPMG International provides no client services. No member firm has any authority to obligate or bind KPMG International or any other member firm vis-à-vis third parties, nor does KPMG International have any such authority to obligate or bind any member firm. All rights reserved. KPMG and the KPMG logo are registered trademarks of KPMG International.
5 Determination of the cost of capital
The cost of capital plays a significant role if the capitalised earnings method is used. Pertinent literature provides numerous methods to determine it which are used in practice with different methodical foundations. In light of this we investigated how companies proceed to determine the cost of capital. In addition we placed our focus on the practical implementation of IAS 36 in the performance of a pre-tax calculation. We specified the question of how a company derives its cost of capital as follows:
• In what detail has the cost of capital been derived for the impairment test and which methods were used? (Section 5.1)
• How is the requirement of the IASB dealt with to perform the impairment test on a pre-tax basis? (Section 5.2)
5.1 In what detail has the cost of capital been derived for the impair-ment test and which methods were used?
Basically different approaches are available to companies to determine the cost of capital. Scientifically founded theories such as the Capital Asset Pricing Model (CAPM), the Arbitrage Pricing Theory (APT), the real option
Fig. 19: Concepts used to determine the cost of capital – Total
CAPM Cost of capital as usually incurred in the past Others
97%
2% 1%
97%of the surveyed companies use the CAPM to determine their cost of capital.
approach or the new Market-derived Capital Pricing Model (MCPM) are available on the one hand. These are contrasted by other approaches such as the simple use of historical cost of capital or internal yield requirements.
The overwhelming majority of all participating companies (97 percent) derive their cost of capital using the CAPM. Compared to the previous year this is an increase of two percentage points and at the same time proof of the significance of CAPM in entrepre-neurial practice.
A further point of interest is the question as to the level at which companies derive their cost of capital. Basically it is conceivable for only a group cost of capital rate to be determined. However, if the risk structures of the individual CGUs or assets differ from each other, a CGU or asset-specific derivation is necessary.
All in all just over two-thirds of the responding companies stated that they derived their cost of capital in a

30 Cost of Capital and Impairment Test Study 2009
© 2010 KPMG International Cooperative (“KPMG International”), a Swiss entity. Member firms of the KPMG network of independent firms are affiliated with KPMG Inter-national. KPMG International provides no client services. No member firm has any authority to obligate or bind KPMG International or any other member firm vis-à-vis third parties, nor does KPMG International have any such authority to obligate or bind any member firm. All rights reserved. KPMG and the KPMG logo are registered trademarks of KPMG International.
85%of the DAX-30 companies determine CGU-specific cost of capital.
39%of the surveyed companies selecting a pure after-tax calculation to determine a value in use do not make any retrograde calculation to pre-tax figures.
Fig. 20: Determination of CGU-specific cost of capital – Total
Yes No
67%
33%
Fig. 21: Corporate taxes – Total
0 20 40 60 80 100
Cash flows before tax Cash flows after tax
Fair Value less costs to sell 15% 85%
Value in Use 22% 78%
As percentage
CGU-specific manner. Of the Swiss surveyed companies 71 percent determine their cost of capital specifi-cally for a CGU or asset and the figure is even 85 percent amongst the DAX-30 companies.
5.2 How is the requirement of the IASB dealt with to perform the impairment test on a pre-tax basis?
A clear preference is recognised amongst the surveyed companies for a post-tax view in determining the value in use (78 percent) and the fair value less costs to sell (85 percent). In many cases the post-tax value determined is then trans-formed to a pre-tax figure in order to satisfy the requirements of IAS 36. Differences in the treatment of corporate taxes are recognisable between the derivation of a value in use and a fair value less costs to sell.
When determining a value in use 22 per- cent of the surveyed companies use a pre-tax approach. A further 40 percent use an after-tax approach in a first step but then determine a pre-tax figure in a second step by way of goal seeking (some 26 percent) or grossing up (some 14 percent). The remaining
39 percent of the surveyed companies determine an after-tax figure exclusively however. According to IASB this should comply with a pre-tax figure insofar as the assumptions are reasonable (see also “Background IFRS” on the following page).
The picture presented by the surveyed companies is different in the calculation of the fair value less costs to sell. Only some 15 percent of the companies make a pre-tax computation whilst half base their approach on a purely after- tax calculation. This approach is correct because the standard for the fair value less costs to sell does not require any pre-tax computation and market prices result from post-tax calculations in practice. The remaining companies similarly performed an after-tax compu- tation but then derived a pre-tax figure by goal seeking or grossing up.

31
© 2010 KPMG International Cooperative (“KPMG International”), a Swiss entity. Member firms of the KPMG network of independent firms are affiliated with KPMG Inter-national. KPMG International provides no client services. No member firm has any authority to obligate or bind KPMG International or any other member firm vis-à-vis third parties, nor does KPMG International have any such authority to obligate or bind any member firm. All rights reserved. KPMG and the KPMG logo are registered trademarks of KPMG International.
Fig. 22: Retrograde calculation to pre-tax cost of capital – in the case of cash flows after tax then …
60%
50%
40%
30%
20%
10%
0% Goal seeking Grossing up Without recalculation
26
15
1418
Value in use Fair value less costs to sell
39 53
Background IFRS – How can the IASB requirement that a pre-tax calculation be made for the impairment test be properly satisfied?
• IAS 36 dictates that corporate tax should not be considered in the determination of value in use both with respect to cash flows and the discount rate. The prevailing opinion is that fair value less costs to sell is determined after tax since market prices usually also reflect tax effects.
• The problem with a pre-tax perspective is that there is no empirical capital market data on the risk premium before (corporate) taxes. Significant capital market studies are generally based on an after-tax perspective. In these cases a distinction is made, if applicable, as to whether or not the shareholder’s income tax is considered along with corporate taxes.
• Therefore in light of the available empirical data an after-tax model is applied in compliance with IDW RS HFA 16. Indirectly IAS 36 also permits an after-tax calculation for value in use since according to IASB, it is assumed that the present value of an after-tax calculation and a pre-tax calculation must lead to the same result if the assumptions are correct (IAS 36.BCZ85). In accordance with this consideration, value in use or fair value less costs to sell is determined on an after-tax basis as a first step. In a second step the pre-tax discount rate is determined by means of a retrograde calculation that leads to the same result as with an appropriate after-tax model.
• Grossing up is a simplification for the reconciliation of after-tax and pre-tax perspectives. IAS 36 merely makes reference to this method (IAS 36.BCZ85). There is a detailed discussion found in HFA 16, Rn. 111. This contains the conditions that must be fulfilled so that grossing up actually leads to proper results. In particular it is especially important that the valuation is based on constant cash flows (nil growth in all budget years) with no net planned investment.
As in the previous year the German surveyed companies prefer a differenti-ated measurement by goal seeking instead of simple grossing up when
converting from an after-tax to a pre-tax figure. By contrast, the Swiss compa-nies give preference to a retrograde calculation by grossing up.

32 Cost of Capital and Impairment Test Study 2009
© 2010 KPMG International Cooperative (“KPMG International”), a Swiss entity. Member firms of the KPMG network of independent firms are affiliated with KPMG Inter-national. KPMG International provides no client services. No member firm has any authority to obligate or bind KPMG International or any other member firm vis-à-vis third parties, nor does KPMG International have any such authority to obligate or bind any member firm. All rights reserved. KPMG and the KPMG logo are registered trademarks of KPMG International.
6 Cost of capital parameters
In addition to the question of the basic method to determine the cost of capital (Chapter 5), we ana-lysed the questions as to the total cost of capital and its constituent parts. Accordingly we analysed each parameter and then the WACC. Firstly the following questions were asked:
• What value was used for – the risk-free rate of return (Section 6.1); – the market risk premium (Section 6.2); – the betas used by the company (Section 6.3); – the cost of equity (Section 6.4); and – the cost of debt (Section 6.5) of the company?• What capital structure is included in the calculation? (Section 6.6)• How much was the company’s WACC? (Section 6.7)• Was a growth discount used and if so in which amount? (Section 6.8)
In addition to questions concerning the pure parameter values, we also addressed the approaches used to derive the respective values. In particular, we examined how the approaches to derive the cost of capital for the measurement of a value in use differ from those to determine a fair value less costs to sell.
Background IFRS – How does the determination of the cost of capital parameters depend on the choice between fair value less costs to sell and value in use?
• In contrast to the cash flows to be discounted, the parameters considered in the WACC as a rule do not depend on the choice between the valuation measures value in use or fair value less costs to sell. Despite the difference in perspectives of the valuation measures, the cost of capital parameters should reflect a market estimate, i.e. should conform to the view of a potential buyer.
• Above all the refinancing conditions of a potential buyer should be considered next to the company’s financing conditions (IAS 36.A16 f.). The company’s own gearing should not be used as a basis for the debt-equity ratio, instead companies should use a typical market debt level (IAS 36.A19), as determined for example by a peer group analysis.

33
© 2010 KPMG International Cooperative (“KPMG International”), a Swiss entity. Member firms of the KPMG network of independent firms are affiliated with KPMG Inter-national. KPMG International provides no client services. No member firm has any authority to obligate or bind KPMG International or any other member firm vis-à-vis third parties, nor does KPMG International have any such authority to obligate or bind any member firm. All rights reserved. KPMG and the KPMG logo are registered trademarks of KPMG International.
• The correct measurement of the individual parameters can be seen in the following table:
• It should be emphasised, however, that when using the value in use the discount rate must be equivalent to that of the cash flows. This is important because unlike the situation with the fair value less costs to sell it is not the market view that is decisive but the management view. Accordingly, optimistic planning would have to be discounted with a markup on the standard cost of capital whilst pessimistic capital would have to be discounted with an appropriate markdown.
Measuring cost of capital
Cost of equity • Risk-free rate of return: Bond yield curve/period-adequate government bonds• MRP without personal taxes• Beta from peer group
Cost of debt • Financing costs of potential purchaser• For example derived from
– ratings – coverage ratios of peer group companies
Debt-equity ratio • Financing structure of a potential purchaser• For example, as derived from the capital structure of the peer group companies
Tax rate • Marginal,tax rate of each country (weighted average if applicable)
6.1 Risk-free rate of return
Just under two-thirds of all surveyed companies rely on the use of govern-ment bonds to determine the risk-free rate of return. A large proportion of these companies, some 64 percent, use national government bonds. This share is distinctly above the previous year’s figure (54 percent). The average residual term of the underlying national government bonds is some 13 years.
The remaining surveyed companies, some 21 percent, stated that they determine the risk-free rate of return using the bond yield curve. This is an increase of ten percentage points compared to the previous year.
It is noticeable that the surveyed companies in Switzerland use foreign government bonds to determine the risk-free rate of return considerably more frequently than in other partici-pating countries. All in all this was 38 percent of the surveyed companies. The foreign government bonds used have an average residual term of some eleven years.
51%of German surveyed companies base the determination of the risk-free rate of return on bond yield curve data.

34 Cost of Capital and Impairment Test Study 2009
© 2010 KPMG International Cooperative (“KPMG International”), a Swiss entity. Member firms of the KPMG network of independent firms are affiliated with KPMG Inter-national. KPMG International provides no client services. No member firm has any authority to obligate or bind KPMG International or any other member firm vis-à-vis third parties, nor does KPMG International have any such authority to obligate or bind any member firm. All rights reserved. KPMG and the KPMG logo are registered trademarks of KPMG International.
Compared to the companies in the remaining countries the bond yield curve has a comparatively large importance amongst German companies. 51 percent (previous year 35 percent) of the German surveyed companies stated that they use the bond yield curve to calculate the risk-free rate of return. The com-
Note 1: Multiple answers were possible in response to this question so that it is possible that the total deviates from 100 percent.
paratively high importance of the bond yield curve for Germany is presumably attributable to a corresponding recom-mendation by the IDW.
The risk-free rate of return used on average by the entirety of surveyed companies was 4.3 percent in the 2008 fiscal year and therefore on par with the level of the previous year.
In the 2008 fiscal year the German surveyed companies used a 0.1 per- centage point lower average risk-free rate of return compared with 2007. The risk-free rate of return used by German companies in 2008 was 4.5 percent and is therefore at the top end of the range between 3.8 percent and 4.5 percent based on the bond yield curve of the Deutsche Bundesbank in the fourth quarter 2008/first quarter 2009. As in the 2007 fiscal year, 77 percent of German surveyed companies also used a risk-free rate of return of between 4.0 percent and 5.0 percent in 2008.
If the further development of the risk- free rate of return derived from the bond yield structure data of the Deutsche Bundesbank is considered over the course of time, it drops from its highest level of 4.5 percent in October 2008 to 4.0 percent in April 2009. One of the reasons for this decline is the cuts in the European bank rates by the European Central Bank as a result of the financial market crisis and the tendency of many investors to give greater weight to low risk debt securities in times of crisis.
Fig. 24: Average risk-free rate of return – Total vs. Switzerland
6%
4%
2%
0% 2007 2008
4.4
3.8
4.3
4.0
Average risk-free rate of return: Total Average risk-free rate of return: Switzerland
4.3%is the risk-free rate of return used on average by all surveyed companies.
Fig. 23: Determination of the risk-free rate of return1
Foreign government bonds
National government bonds
Bond yield curve
0 20 40 60 80 100
Total Germany Switzerland Remaining countries
18%
38%21%
64%53%
88%67%
33%51%
21%4%
9%
As percentage

35
© 2010 KPMG International Cooperative (“KPMG International”), a Swiss entity. Member firms of the KPMG network of independent firms are affiliated with KPMG Inter-national. KPMG International provides no client services. No member firm has any authority to obligate or bind KPMG International or any other member firm vis-à-vis third parties, nor does KPMG International have any such authority to obligate or bind any member firm. All rights reserved. KPMG and the KPMG logo are registered trademarks of KPMG International.
Fig. 25: Comparison of the German and Swiss rate of return over the course of time
Nov. 06 March 07 July 07 Nov. 07 March 08 July 08 Nov. 08 March 09 July 09
German interest rate (bond yield curve) Swiss interest rate (30 years)
5.0%
4.5%
4.0%
3.5%
3.0%
2.5%
2.0%
1.5%
Note 1: Multiple answers were possible in response to this question so that it is possible that the total deviates from 100 percent.
Fig. 26: Derivation of the market risk premium1
Based on studies
Based on own deduction
Recommendation of nationalchambers of chartered accountants
Others
0 10 20 30 40 50 60 70
Total Germany Switzerland Remaining countries
27%
32%48%
20%12%
40%17%
41%64%
22%4%
17%
22%19%
22%32%
As percentage
Compared to the remaining surveyed companies the Swiss companies applied significantly lower risk-free rates of return. This is particularly attributable to the different interest levels in the two currency areas. This difference in level becomes clear when the yield of a Swiss government bond is compared with that of the German bond yield curve.
6.2 Market risk premium
The market risk premium describes the yield required by an investor that is above the risk-free rate of return for holding a market portfolio.
In the majority of cases this is deter-mined under consideration of the past on the basis of a comparison of observ- able long-term share yields with the yield of risk-free bonds over the same period. The share yields slumped dramatically throughout the world due to the financial market crisis at the end of 2008. One interesting question in this context is the impact the crisis has had precisely on the market risk premium. In view of the long historical periods on which empirical investigations of market risk premiums are based, and which also took into consideration earlier years of crisis, it was to be expected that the market risk premium would not alter significantly.
Compared to the previous year no material differences in the method of deriving the market risk premium are observable in the entirety of the sample. Almost two-thirds of the surveyed

36 Cost of Capital and Impairment Test Study 2009
© 2010 KPMG International Cooperative (“KPMG International”), a Swiss entity. Member firms of the KPMG network of independent firms are affiliated with KPMG Inter-national. KPMG International provides no client services. No member firm has any authority to obligate or bind KPMG International or any other member firm vis-à-vis third parties, nor does KPMG International have any such authority to obligate or bind any member firm. All rights reserved. KPMG and the KPMG logo are registered trademarks of KPMG International.
Fig. 27: Average market risk premium – Total
6%
4%
2%
0% 2007 2008
4.7 5.1
80%of the surveyed companies used a market risk premium of between 4.5 and 5.0 percent in the 2008 fiscal year.
Fig. 28: Average market risk premium – range of market risk premium
2.0% 2.5% 3.0% 3.5% 4.0% 4.5% 5.0% 5.5% 6.0% > 6.0%
70
60
50
40
30
20
10
0
Number of responses
Amount of MRP
companies stated that they rely on external information or studies. Some 41 percent stated the respective national chamber of chartered accountants and some 25 percent studies from other institutions.
The average market risk premium used by the entirety of all surveyed compa-nies is 5.1 percent. This corresponds to a rise of 0.4 percentage points com-pared to the previous year.
A rise in the market risk premium used on average is also observable for the participating companies in Germany. It rose from 4.7 percent in 2006 to 4.8 percent in 2007 and finally to 4.9 percent in 2008. This rise may also be attributable to the impacts of the corporate tax reform in 2008. Simula-tion computations would suggest that
the corporate tax reform may have led to a slight increase in market risk premium before personal income taxes from between 4.0 and 5.0 percent to between 4.5 and 5.5 percent.
80 percent of all surveyed companies used a market risk premium ranging between 4.5 and 5.5 percent in the 2008 fiscal year. 85 percent of the German surveyed companies were within this range alongside 75 percent of the DAX-30 companies.

37
© 2010 KPMG International Cooperative (“KPMG International”), a Swiss entity. Member firms of the KPMG network of independent firms are affiliated with KPMG Inter-national. KPMG International provides no client services. No member firm has any authority to obligate or bind KPMG International or any other member firm vis-à-vis third parties, nor does KPMG International have any such authority to obligate or bind any member firm. All rights reserved. KPMG and the KPMG logo are registered trademarks of KPMG International.
Four yearsis the average observation period if the beta is observed over several years.
Fig. 29: Derivation of betas – Total
Forecastedbetas
Historical betas8% 92%
Current one-year beta
Average of one-year betas
Multiple-year beta
31%
17%
44%
6.3 Beta
The beta is a decisive factor in deter-mining the cost of equity. It expresses the systematic risk (market risk), i.e. the risk that shareholders are unable to eliminate by diversification and that is therefore theoretically compensated for by outperformance.
The expected future systematic risk is basically sought; in view of unconvincing forecast models the overwhelming majority (92 percent) derive their betas from historical data.
If historical data are used to derive the beta, further questions arise with respect to the technical implementation of the derivation. Two-thirds of companies who determine the betas on the basis of historical data use an observation period of several years, on average some four years. By contrast, around one-third of these companies uses the current one-year betas. Looking at the overall picture the results at the level of the individual countries as based on the data collected are basically similar.
In view of the currently ongoing financial market crisis the starting data, particu-larly if a one-year beta is used, must be assessed critically. In particular the extent to which the data of the more recent past permit an adequate estimate of the systematic risk expected in the long term must be clarified.
It is also noticeable that the DAX-30 companies use an average of several one-year betas instead of a multi-year beta considerably more frequently (35 percent) than the whole of the participating companies. This approach has the advantage that as a result of the differentiated view of several individual years, changes in the capital structure of the comparative companies can be considered and development trends incorporated in the analysis.
Historical betas can be used in the form of so-called “raw betas” or “adjusted betas”. “Raw betas” are generally determined using regression from the underlying price data without adjustment. “Adjusted betas” are derived from “raw betas” on the assumption that the risk profile of companies approximates with that of the overall market through growth and diversification over the course of time. This is why the “adjusted beta” is derived as a weighted average from the “raw beta” of the company and the beta of the market (1.0).
Almost two-thirds of the companies we surveyed use “adjusted betas” and therefore follow the corresponding assumption.

38 Cost of Capital and Impairment Test Study 2009
© 2010 KPMG International Cooperative (“KPMG International”), a Swiss entity. Member firms of the KPMG network of independent firms are affiliated with KPMG Inter-national. KPMG International provides no client services. No member firm has any authority to obligate or bind KPMG International or any other member firm vis-à-vis third parties, nor does KPMG International have any such authority to obligate or bind any member firm. All rights reserved. KPMG and the KPMG logo are registered trademarks of KPMG International.
Betas usedOne difficulty in determining the beta results from the fact that CGUs as an entity are in principle not listed on the stock exchange. Accordingly, no betas are recorded directly for CGUs and listed comparative companies are required to reflect the operative risk of the CGUs. Since this question is frequently answered depending on the valuation concept selected, we have analysed the responses in a differentiated manner.
Almost four-fifths of all surveyed companies use the betas of a peer group to determine the beta for purposes of measuring the fair value less costs to sell and in Germany some 96 percent of the surveyed companies rely on a peer group beta.
Just over half (51 percent) of the respond- ing companies use a beta derived from a peer group to determine the value in use. This represents a change compared to the previous year where 53 percent of the surveyed companies referred to the beta of the respective reporting company to determine the cost of equity. This figure has declined to some 38 percent this year.
Thus, the operational practice is increas- ingly oriented to the conceptual require-ments of IAS 36 according to which the operative risk of the measurement unit (CGU) is to be measured from the perspective of a market player and therefore independent of the measure-ment concept (fair value less costs to sell or value in use).
Compared to the previous year this tendency towards the peer group beta is to be observed in almost all participat- ing countries. An exception is provided by Switzerland. Just under 48 percent of the Swiss surveyed companies stated that they rely on the beta of the reporting company to determine the value in use. Nevertheless, almost 43 percent of the Swiss surveyed companies stated that they base their calculations on a peer group beta.
From an overall point of view it is advisable to regularly derive the beta from a peer group irrespective of the valuation concept selected. This provides the possibility to explicitly consider the risk profile of the CGU to be assessed when selecting the peer group compa-nies. The data basis permits the operative risk to be separated from the capital structure risk (so-called unlevering). In addition the influence of incidental fluctuations of individual share yields is minimised.
By contrast, the use of betas of the reporting group is only appropriate if the operative risk of the CGU coincides with that of the group and the share price is not subject to any significant fluctuations that are not connected with the risk profile of the company.
Fig. 31: Derivation of betas for value in use – Total1
100%
80%
60%
40%
20%
0% Beta of the Peer group Industry line Others reporting beta betas company
38
13
51
79
12
10 1
Value in use Fair value less costs to sell
80%of the surveyed companies derive their beta to determine a fair value from a peer group.
Note 1: Multiple answers were possible in response to this question so that it is possible that the total deviates from 100 percent.
Fig. 30: Historical beta factors used – Total
Raw betas Adjusted betas
35%
65%

39
© 2010 KPMG International Cooperative (“KPMG International”), a Swiss entity. Member firms of the KPMG network of independent firms are affiliated with KPMG Inter-national. KPMG International provides no client services. No member firm has any authority to obligate or bind KPMG International or any other member firm vis-à-vis third parties, nor does KPMG International have any such authority to obligate or bind any member firm. All rights reserved. KPMG and the KPMG logo are registered trademarks of KPMG International.
With respect to determining the fair value less costs to sell it is to be added that the use of a peer group beta additionally underlines the transaction concept of the fair value less costs to sell. A notional arm’s-length buyer would gear the cash flows from the CGU to his alternative realisable returns in a transaction and consider possible competitors in his analysis.
Applied betasAll participating companies used an average levered beta of 1.04 in the 2008 fiscal year for their cost of capital calculation. This represents a decline of 0.06 percentage points compared to the previous year.
The average levered beta of 1.04 would initially seem to be plausible with respect to all surveyed companies. In view of the definition of the beta as a relative measurement of risk the average over all levered betas of the market ought
Fig. 32: Average levered beta – Total
1.2%
1.0%
0.8%
0.6%
0.4%
0.2%
0.0% 2007 2008
1.10 1.04
1.01is the average levered beta used by German surveyed companies in the 2008 fiscal year.
to correspond to 1.0. Against this back- ground the value determined would basically appear to reflect the appropri-ateness of the calculations made in the companies. All in all no systematic underestimation of the beta factor and therefore of the systematic risk would appear to exist particularly for the impairment test.
The German surveyed companies used an average levered beta of 1.01. However the average beta of the Swiss surveyed companies of 1.22 would appear to be unusual since it is distinctly above the value of the whole sample.
Betas by industryThe assessment of the levered betas by industry produces a range between 0.86 and 1.25. The lower end of the range is occupied by the “energy supply” industry whilst “industrial” occupies the top end.
Fig. 33: Average levered beta by industry (2008)
Total 1.04
Automotive n/a
Banking/insurance 1.23
Chemicals, pharma & health 0.90
Retail/consumer goods 0.88
Energy supply 0.86
Industrial 1.25
Transport & logistic n/a
Others 1.09
0.0 0.1 0.2 0.3 0.4 0.5 0.6 0.7 0.8 0.9 1.0 1.1 1.2 1.3 1.4Absolute number

40 Cost of Capital and Impairment Test Study 2009
© 2010 KPMG International Cooperative (“KPMG International”), a Swiss entity. Member firms of the KPMG network of independent firms are affiliated with KPMG Inter-national. KPMG International provides no client services. No member firm has any authority to obligate or bind KPMG International or any other member firm vis-à-vis third parties, nor does KPMG International have any such authority to obligate or bind any member firm. All rights reserved. KPMG and the KPMG logo are registered trademarks of KPMG International.
6.4 Cost of equity
The levered cost of equity according to the CAPM results from the risk-free rate of return, the market risk premium and the levered beta.
Compared to the previous year the average cost of equity of all surveyed companies in the 2008 fiscal year rose by 0.4 percentage points to a current 9.9 percent. This rise is primarily attribut- able to the higher market risk premium (see Chapter 6.2) applied by the sur- veyed companies in the 2008 fiscal year compared to the previous year.
A breakdown by industry shows that the “chemicals, pharma and health” industry applied the comparatively lowest (8.8 percent) and “banking and insurance” industry applied the com- paratively highest (10.6 percent) cost of equity. The rise in the average cost of equity of the energy suppliers from
Fig. 34: Average cost of equity (after corporate tax) – Total
10%
8%
6%
4%
2%
0% 2007 2008
9.5 9.9
7.7 percent in the 2007 fiscal year to 9.0 percent in the 2008 fiscal year is noticeable in the breakdown by industry.
6.5 Cost of debt
In addition to the cost of equity, the cost of debt constitutes the second determinant in deriving the weighted average cost of capital (WACC).
As for the cost of equity, the cost of debt must be derived from the usual market cost of debt observable on the reporting date irrespective of the valuation concept selected and the specific refinancing terms and conditions.
The results of our investigations show that the surveyed companies observed this practice as the whole. In determin-ing the fair value less costs to sell none of the German surveyed companies took its actual individual cost of debt as a basis. This is 77 percent for the entirety of surveyed companies. How- ever, compared to the determination of the fair value less costs to sell a
Fig. 35: Average cost of equity (after corporate tax) by industry (2008)
Total 9.9%
Automotive n/a
Banking/insurance 10.6%
Chemicals, pharma & health 8.8%
Retail/consumer goods 9.6%
Energy supply 9.0%
Industrial 10.4%
Transport & logistic n/a
Others 11.0%
0 1 2 3 4 5 6 7 8 9 10 11 12 13As percentage
rEKV=rf+MRPß
Formula to derive the cost of equity in accordance with CAPM
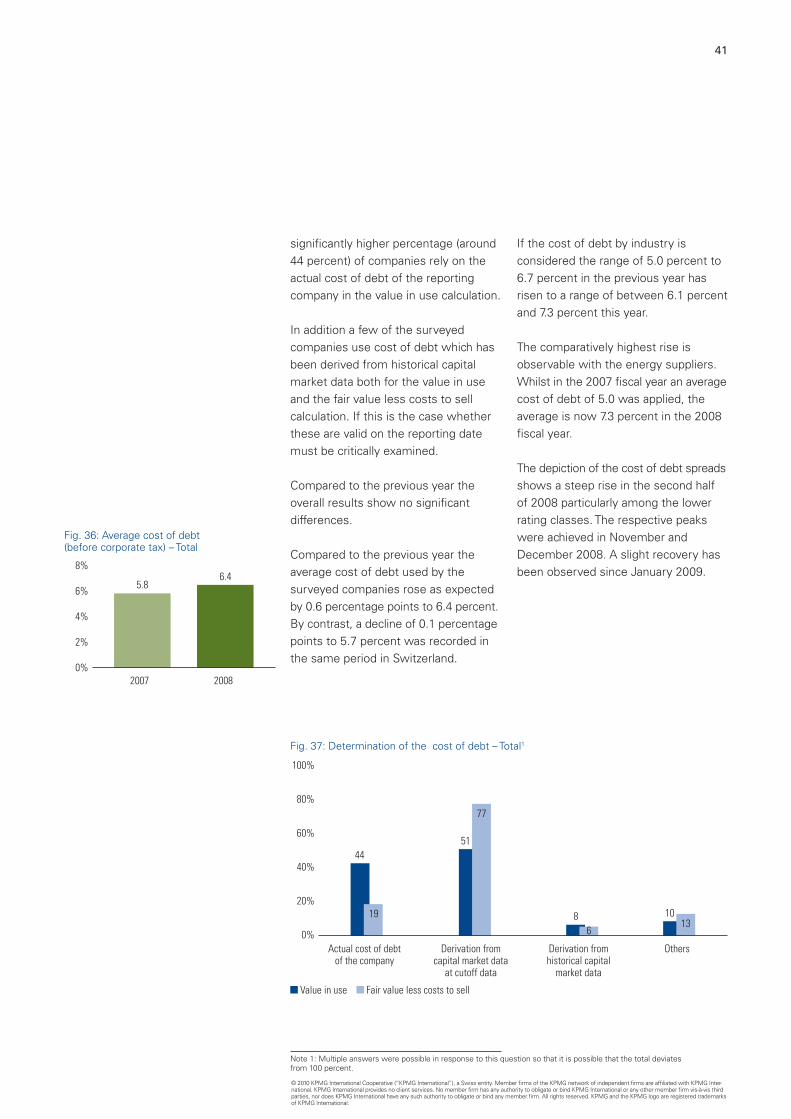
41
© 2010 KPMG International Cooperative (“KPMG International”), a Swiss entity. Member firms of the KPMG network of independent firms are affiliated with KPMG Inter-national. KPMG International provides no client services. No member firm has any authority to obligate or bind KPMG International or any other member firm vis-à-vis third parties, nor does KPMG International have any such authority to obligate or bind any member firm. All rights reserved. KPMG and the KPMG logo are registered trademarks of KPMG International.
Fig. 37: Determination of the cost of debt – Total1
100%
80%
60%
40%
20%
0% Actual cost of debt Derivation from Derivation from Others of the company capital market data historical capital at cutoff data market data
44
19
51
77
86
10
Value in use Fair value less costs to sell
13
Fig. 36: Average cost of debt (before corporate tax) – Total
8%
6%
4%
2%
0% 2007 2008
5.86.4
Note 1: Multiple answers were possible in response to this question so that it is possible that the total deviates from 100 percent.
significantly higher percentage (around 44 percent) of companies rely on the actual cost of debt of the reporting company in the value in use calculation.
In addition a few of the surveyed companies use cost of debt which has been derived from historical capital market data both for the value in use and the fair value less costs to sell calculation. If this is the case whether these are valid on the reporting date must be critically examined.
Compared to the previous year the overall results show no significant differences.
Compared to the previous year the average cost of debt used by the surveyed companies rose as expected by 0.6 percentage points to 6.4 percent. By contrast, a decline of 0.1 percentage points to 5.7 percent was recorded in the same period in Switzerland.
If the cost of debt by industry is considered the range of 5.0 percent to 6.7 percent in the previous year has risen to a range of between 6.1 percent and 7.3 percent this year.
The comparatively highest rise is observable with the energy suppliers. Whilst in the 2007 fiscal year an average cost of debt of 5.0 was applied, the average is now 7.3 percent in the 2008 fiscal year.
The depiction of the cost of debt spreads shows a steep rise in the second half of 2008 particularly among the lower rating classes. The respective peaks were achieved in November and December 2008. A slight recovery has been observed since January 2009.

42 Cost of Capital and Impairment Test Study 2009
© 2010 KPMG International Cooperative (“KPMG International”), a Swiss entity. Member firms of the KPMG network of independent firms are affiliated with KPMG Inter-national. KPMG International provides no client services. No member firm has any authority to obligate or bind KPMG International or any other member firm vis-à-vis third parties, nor does KPMG International have any such authority to obligate or bind any member firm. All rights reserved. KPMG and the KPMG logo are registered trademarks of KPMG International.
Fig. 39: Cost of debt – spreads over the course of time (result: spreads are currently dropping)
28. Sep. 2007 30. Nov. 2007 31. Jan. 2008 31. Mar. 2008 30. May 2008 31. Jul. 2008 30. Sep. 2008 28. Nov. 2008 30. Jan. 2009 31 Mar. 2009 29. May 2009 31. Jul. 2009 30. Sep. 2009
BB– BB BBB A AA AAA
1,000
900
800
700
600
500
400
300
200
100
0
Units
Fig. 38: Average cost of debt (before corporate tax) by industry (2008)
Total 6.4%
Automotive n/a
Banking/insurance n/a
Chemicals, pharma & health 6.6%
Retail/consumer goods 6.5%
Energy supply 7.3%
Industrial 6.1%
Transport & logistic n/a
Others 6.3%
0 1 2 3 4 5 6 7 8As percentage
On the whole it can be established, however, that the distortions on the capital market as a result of the crisis continue to exist. So far there has been no normalisation in terms of a return to the financial conditions of the years before the “credit crunch”.
The cost of debt spread observable on the capital market currently determines the cost of financing on the reporting date and must be taken into consider-ation as part of the impairment test. However, it must be considered that cash flows with infinite duration are regularly discounted with the cost of debt as a component of the WACC. Therefore, in order to guarantee the consistency of periods, sustainable refinancing costs must be considered in the impairment test.
In view of the currently ongoing financial market crisis and the prevailing volatility on the capital market it is difficult to estimate future sustainable refinancing conditions. The currently observable cost of debt spreads provide at least a first indication.
Source: Bloomberg

43
© 2010 KPMG International Cooperative (“KPMG International”), a Swiss entity. Member firms of the KPMG network of independent firms are affiliated with KPMG Inter-national. KPMG International provides no client services. No member firm has any authority to obligate or bind KPMG International or any other member firm vis-à-vis third parties, nor does KPMG International have any such authority to obligate or bind any member firm. All rights reserved. KPMG and the KPMG logo are registered trademarks of KPMG International.
85%of the German surveyed companies derive the capital structure for the purpose of determining a fair value less costs to sell from a peer group.
Note 1: Multiple answers were possible in response to this question so that it is possible that the total deviates from 100 percent.
22
Fig. 40: Determination of the capital structure – Total1
60%
50%
40%
30%
20%
10%
0% Company’s Company’s Derivation current capital target capital from a peer structure structure group
51
22
34
33
Value in use Fair value less costs to sell
56
6.6 Capital structure
The determined capital structure (market value of debt/market value of equity) provides the basis for the weighting of the cost of equity and cost of debt to determine the WACC. The responses of the surveyed companies in connection with determining either the value in use or the fair value less costs to sell vary. Accordingly, we provide a separate analysis in the following.
In determining the capital structure for the purpose of calculating the fair value less costs to sell the majority (some 56 percent; previous year: 44 percent) of all surveyed companies correctly derived the capital structure from a peer group.
When determining the capital structure to calculate the value in use the over- whelming majority of surveyed companies rely on the current or the target capital structure of the company/CGU at market
values. However, compared to the previous year a rise in the share of companies deriving their capital structure from the peer group can be observed by more than seven percentage points to 22 percent.
As to the question of whether the applied capital structure (target or current) should be determined using market values or book values, the majority of companies responded that they increasingly use market values. Nevertheless, 30 percent (value in use) and 17 percent (fair value less costs to sell) of companies stated that they use book values. This approach should only be permissible as simplifi-cation in those exceptional cases where there is no material deviation between book value and market value.
It must be emphasised that the number of German companies (some 85 percent) that used a peer group to determine the capital structure for fair value less costs to sell was significantly higher
Fig. 41: Factors to determine capital structure – Total
Carrying amount Market values
34%
66%

44 Cost of Capital and Impairment Test Study 2009
© 2010 KPMG International Cooperative (“KPMG International”), a Swiss entity. Member firms of the KPMG network of independent firms are affiliated with KPMG Inter-national. KPMG International provides no client services. No member firm has any authority to obligate or bind KPMG International or any other member firm vis-à-vis third parties, nor does KPMG International have any such authority to obligate or bind any member firm. All rights reserved. KPMG and the KPMG logo are registered trademarks of KPMG International.
Fig. 43: Average WACC(after corporate tax) – Total
10%
8%
6%
4%
2%
0% 2007 2008
8.1 8.0
8.0%is the average WACC applied by the surveyed companies in the fiscal year.
Fig. 44: Average WACC (after corporate tax) by industry in 2008
Total 8.0%
Automotive n/a
Banking/insurance n/a
Chemicals, pharma & health 8.0%
Retail/consumer goods 8.2%
Energy supply 6.9%
Industrial 8.0%
Transport & logistic n/a
Others 8.8%
0 1 2 3 4 5 6 7 8 9 10As percentage
Fig. 42: Average debt-equity ratio used – Total
100%
80%
60%
40%
20%
0% 2007 2008
71 66
than the average of all companies participating in the study. At 24 percent this share is higher than average also for the value in use.
All of the surveyed companies have an average ratio of debt to equity of some 66 percent in the impairment test performed in the 2008 fiscal year. This corresponds to a drop of five percentage points compared to the previous year.
Whilst the German surveyed companies rely on a below-average degree of indebtedness of some 53 percent (2007: 69 percent), the participating Swiss companies consider a compara-tively high degree of indebtedness of 96 percent (2007: 92 percent).
6.7 Weighted cost of capital
Despite the financial market and eco- nomic crisis in the 2008 fiscal year, the weighted average cost of capital (WACC)
after corporate tax but before growth discount is on par with the previous year’s level.
Only amongst the Swiss companies a slight rise in the WACC is recognisable by 0.4 percentage points to a current 8.4 percent.
Higher cost of equity and debt is often accompanied by a rise in the degree of indebtedness with reduced market capitalisation. A higher degree of indebtedness corresponds ceteris paribus to a lower WACC due to the higher rating of the (lower) cost of debt after tax shield. All in all it would not appear to be implausible for the surveyed companies to have applied a virtually constant WACC compared to the previous year.

45
© 2010 KPMG International Cooperative (“KPMG International”), a Swiss entity. Member firms of the KPMG network of independent firms are affiliated with KPMG Inter-national. KPMG International provides no client services. No member firm has any authority to obligate or bind KPMG International or any other member firm vis-à-vis third parties, nor does KPMG International have any such authority to obligate or bind any member firm. All rights reserved. KPMG and the KPMG logo are registered trademarks of KPMG International.
Fig. 45: Use of the growth rate – Total
100%
80%
60%
40%
20%
0% Growth rate No growth rate
6876
32
24
Value in use Fair value less costs to sell
Fig. 46: Determination of the growth rate – Total
Growth rate of product/product group revenues Growth rate of revenues realized in the relevant business line Growth rate of the gross domestic product Rate of inflation
35%
23%
32%
10%
90%of the German surveyed companies use a growth rate when determining the fair value less costs to sell.
6.8 Growth rate
The application of a sustainable growth rate comes into consideration when using the income approach and under the going concern premise.
The majority of all surveyed companies applied a growth rate irrespective of the underlying valuation concept. This was a little under three-quarters of the surveyed companies for the determi-nation of value in use and a little over three-quarters of the surveyed compa-nies on calculating the fair value less costs to sell.
Of the German surveyed companies, 90 percent apply a growth rate in determining the fair value less costs to sell. By contrast, only 29 percent of the surveyed companies in Switzer-land do so.
Different, both internal and external, factors may be used to determine the growth rate. Approximately one-third of the participating companies measure the amount of the applied growth rate using the growth rate for products or product groups and forecast growth rates for the overall turnover of the industry.

46 Cost of Capital and Impairment Test Study 2009
© 2010 KPMG International Cooperative (“KPMG International”), a Swiss entity. Member firms of the KPMG network of independent firms are affiliated with KPMG Inter-national. KPMG International provides no client services. No member firm has any authority to obligate or bind KPMG International or any other member firm vis-à-vis third parties, nor does KPMG International have any such authority to obligate or bind any member firm. All rights reserved. KPMG and the KPMG logo are registered trademarks of KPMG International.
1.8%is the average growth rate used to determine the value in use. It is 1.6 percent for the fair value less costs to sell.
Fig. 47: Applied growth rate1
0 10 20 30 40 50 60 70 80 90 100
0.0%–1.0% 1.01%–2.0% 2.01%–3.0% 3.01%–4.0%
Fair value less costs to sellGermany
28% 56% 17%
Value in use Germany 33% 57% 3% 7%
Fair value less costs to selltotal
19% 67% 15%
Value in use total 25% 52% 15% 8%
As percentage
The average growth rate used to determine the value in use in the 2008 fiscal year is 1.8 percent. It is therefore 0.2 percentage points higher than for the fair value less costs to sell. This relationship would appear to be under- standable only in exceptional cases against the background that extension investments and restructuring measures are to be eliminated from the forecast when determining the value in use.
Virtually no difference is to be recognised for the average growth rate (value in use 1.8 percent; fair value less costs to sell 1.7 percent) compared to the previous year. By contrast the dispersion
of the growth rates applied for both valuation concepts has declined distinctly compared with the previous year.
50 percent for the value in use and even 63 percent for the 7fair value less costs to sell determine a growth rate of between 1.1 percent and 2.0 percent. In the previous year this was only 39 percent and 37 percent respectively. The number of companies using a growth rate of over 2 percent has also declined steeply (from 34 percent to 23 percent for value in use and from 26 percent to 15 percent for fair value less costs to sell).
Note 1: Multiple answers were possible in response to this question so that it is possible that the total deviates from 100 percent.

47
© 2010 KPMG International Cooperative (“KPMG International”), a Swiss entity. Member firms of the KPMG network of independent firms are affiliated with KPMG Inter-national. KPMG International provides no client services. No member firm has any authority to obligate or bind KPMG International or any other member firm vis-à-vis third parties, nor does KPMG International have any such authority to obligate or bind any member firm. All rights reserved. KPMG and the KPMG logo are registered trademarks of KPMG International.
List of abbreviations
APT Arbitrage Pricing Theory
ATX Austrian Traded Index
CAPM Capital Asset Pricing Model
CGU Cash-Generating Unit
DAX German stock index (Deutscher Aktienindex)
DCF Discounted Cash Flow
EBIT Earnings before Interest and Taxes
EK Equity
EU European Union
FK Loan capital
GoF Goodwill
HFA Hauptfachausschuss (Technical Committee) IDW
IAS International Accounting Standards
IASB International Accounting Standards Board
IDW German Institute of Public Auditors
IFRS International Financial Reporting Standards
MCPM Market-derived Capital Pricing Model
MDAX Mid-Cap stock index
MRP Market risk premium
SDAX Small-Cap stock index
SMI Swiss Market Index
SPI Swiss Performance Index
US-GAAP United States Generally Accepted Accounting Principles
WACC Weighted Average Cost of Capital

48 Cost of Capital and Impairment Test Study 2009
© 2010 KPMG International Cooperative (“KPMG International”), a Swiss entity. Member firms of the KPMG network of independent firms are affiliated with KPMG Inter-national. KPMG International provides no client services. No member firm has any authority to obligate or bind KPMG International or any other member firm vis-à-vis third parties, nor does KPMG International have any such authority to obligate or bind any member firm. All rights reserved. KPMG and the KPMG logo are registered trademarks of KPMG International.
Contacts
Germany:KPMG AG WirtschaftsprüfungsgesellschaftChristian KlingbeilPartner, Corporate FinanceGanghoferstrasse 2980339 MunichGermanyT +49 89 [email protected]
The Netherlands:KPMG Corporate Finance N.V.Dr. Jeroen WeimerPartner, Corporate FinanceBurgemeester Rijnderslaan 10–201185 MC AmstelveenThe NetherlandsT +31 20 [email protected]
Spain:KPMG Asesores, S.L.Ana Martinez RamonPartner, Corporate FinancePaseo de la Castellana, 9528046 MadridSpainT +34 91 [email protected]
Austria:KPMG Alpen-Treuhand GmbHDr. Klaus MittermairPartner, Corporate FinanceKudlichstrasse 41–434021 LinzAustriaT +43 732 [email protected]
Switzerland:KPMG AGJohannes PostDirector, Corporate FinanceBadenerstrasse 1728026 ZurichSwitzerlandT +41 44 [email protected]
For further information please contact
About KPMG
KPMG is a global network of professional firms providing Audit, Tax and Advisory services. We operate in 146 countries and have 140,000 people working in member firms around the world. The independent member firms of the KPMG network are affiliated with KPMG International Cooperative (“KPMG International”), a Swiss entity. Each KPMG firm is a legally distinct and separate entity and describes itself as such.
KPMG Europe LLP, a UK limited liability partnership, is the legal entity which effectively controls the member firms of the KPMG network that have elected to merge with it (“KPMG Europe LLP firms”). KPMG Europe LLP and KPMG International provide no client services. KPMG Europe LLP firms operate in 14 countries across Europe with over 31,000 partners and staff. The “KPMG Europe LLP group” means KPMG Europe LLP, and KPMG Europe LLP firms. The KPMG Europe LLP group recorded consolidated revenues of 3.5 billion euros and pro-forma revenues for the 14 countries for 2009 totalled 4.5 billion euros.
Overall responsibility for the study:Dr. Jochen BeumerKPMG AG WirtschaftsprüfungsgesellschaftPartner, Corporate FinanceTersteegenstrasse 19–3140474 DuesseldorfGermanyT +49 211 [email protected]
Technical coordination:Dr. Marc CastedelloKPMG AG WirtschaftsprüfungsgesellschaftPartner, Corporate FinanceGanghoferstrasse 2980339 MunichGermanyT +49 89 [email protected]


kpmg.com
© 2010 KPMG International Cooperative (“KPMG Interna- tional”), a Swiss entity. Member firms of the KPMG network of independent firms are affiliated with KPMG International. KPMG International provides no client services. No member firm has any authority to obligate or bind KPMG International or any other member firm vis-à-vis third parties, nor does KPMG International have any such authority to obligate or bind any member firm. All rights reserved. Printed in Germany. KPMG and the KPMG logo are registered trademarks of KPMG International.
The information contained herein is of a general nature and is not intended to address the circumstances of any particular individual or entity. Although we endeavor to provide accurate and timely information, there can be no guarantee that such information is accurate as of the date it is received or that it will continue to be accurate in the future. No one should act on such information without appropriate professional advice after a thorough examination of the particular situation.