corporate finance 11th edition ross solutions manualcorporate finance 11th edition ross solutions...
TRANSCRIPT
Solutions Manual
Corporate Finance
Ross, Westerfield, Jaffe, and Jordan
11th edition
10/20/2015
Prepared by:
Brad Jordan
University of Kentucky
Joe Smolira
Belmont University
Corporate Finance 11th Edition Ross Solutions ManualFull Download: http://testbanklive.com/download/corporate-finance-11th-edition-ross-solutions-manual/
Full download all chapters instantly please go to Solutions Manual, Test Bank site: testbanklive.com

CHAPTER 1
INTRODUCTION TO CORPORATE
FINANCE
Answers to Concept Questions
1. In the corporate form of ownership, the shareholders are the owners of the firm. The shareholders
elect the directors of the corporation, who in turn appoint the firm’s management. This separation of
ownership from control in the corporate form of organization is what causes agency problems to
exist. Management may act in its own or someone else’s best interests, rather than those of the
shareholders. If such events occur, they may contradict the goal of maximizing the share price of the
equity of the firm.
2. Such organizations frequently pursue social or political missions, so many different goals are
conceivable. One goal that is often cited is revenue minimization; i.e., provide whatever goods and
services are offered at the lowest possible cost to society. A better approach might be to observe that
even a not-for-profit business has equity. Thus, one answer is that the appropriate goal is to
maximize the value of the equity.
3. Presumably, the current stock value reflects the risk, timing, and magnitude of all future cash flows,
both short-term and long-term. If this is correct, then the statement is false.
4. An argument can be made either way. At the one extreme, we could argue that in a market economy,
all of these things are priced. There is thus an optimal level of, for example, ethical and/or illegal
behavior, and the framework of stock valuation explicitly includes these. At the other extreme, we
could argue that these are non-economic phenomena and are best handled through the political
process. A classic (and highly relevant) thought question that illustrates this debate goes something
like this: “A firm has estimated that the cost of improving the safety of one of its products is $30
million. However, the firm believes that improving the safety of the product will only save $20
million in product liability claims. What should the firm do?”
5. The goal will be the same, but the best course of action toward that goal may be different because of
differing social, political, and economic institutions.
6. The goal of management should be to maximize the share price for the current shareholders. If
management believes that it can improve the profitability of the firm so that the share price will
exceed $35, then they should fight the offer from the outside company. If management believes that
this bidder or other unidentified bidders will actually pay more than $35 per share to acquire the
company, then they should still fight the offer. However, if the current management cannot increase
the value of the firm beyond the bid price, and no other higher bids come in, then management is not
acting in the interests of the shareholders by fighting the offer. Since current managers often lose
their jobs when the corporation is acquired, poorly monitored managers have an incentive to fight
corporate takeovers in situations such as this.
CHAPTER 2 - 4
7. We would expect agency problems to be less severe in other countries, primarily due to the relatively
small percentage of individual ownership. Fewer individual owners should reduce the number of
diverse opinions concerning corporate goals. The high percentage of institutional ownership might
lead to a higher degree of agreement between owners and managers on decisions concerning risky
projects. In addition, institutions may be better able to implement effective monitoring mechanisms
on managers than can individual owners, based on the institutions’ deeper resources and experiences
with their own management.
8. The increase in institutional ownership of stock in the United States and the growing activism of
these large shareholder groups may lead to a reduction in agency problems for U.S. corporations and
a more efficient market for corporate control. However, this may not always be the case. If the
managers of the mutual fund or pension plan are not concerned with the interests of the investors, the
agency problem could potentially remain the same, or even increase since there is the possibility of
agency problems between the fund and its investors.
9. How much is too much? Who is worth more, Larry Ellison or Tiger Woods? The simplest answer is
that there is a market for executives just as there is for all types of labor. Executive compensation is
the price that clears the market. The same is true for athletes and performers. Having said that, one
aspect of executive compensation deserves comment. A primary reason executive compensation has
grown so dramatically is that companies have increasingly moved to stock-based compensation.
Such movement is obviously consistent with the attempt to better align stockholder and management
interests. In recent years, stock prices have soared, so management has cleaned up. It is sometimes
argued that much of this reward is due to rising stock prices in general, not managerial performance.
Perhaps in the future, executive compensation will be designed to reward only differential
performance, i.e., stock price increases in excess of general market increases.
10. Maximizing the current share price is the same as maximizing the future share price at any future
period. The value of a share of stock depends on all of the future cash flows of company. Another
way to look at this is that, barring large cash payments to shareholders, the expected price of the
stock must be higher in the future than it is today. Who would buy a stock for $100 today when the
share price in one year is expected to be $80?

CHAPTER 2
ACCOUNTING STATEMENTS, TAXES,
AND CASH FLOW
Answers to Concepts Review and Critical Thinking Questions
1. True. Every asset can be converted to cash at some price. However, when we are referring to a liquid
asset, the added assumption that the asset can be quickly converted to cash at or near market value is
important.
2. The recognition and matching principles in financial accounting call for revenues, and the costs
associated with producing those revenues, to be “booked” when the revenue process is essentially
complete, not necessarily when the cash is collected or bills are paid. Note that this way is not
necessarily correct; it’s the way accountants have chosen to do it.
3. The bottom line number shows the change in the cash balance on the balance sheet. As such, it is not
a useful number for analyzing a company.
4. The major difference is the treatment of interest expense. The accounting statement of cash flows
treats interest as an operating cash flow, while the financial cash flows treat interest as a financing
cash flow. The logic of the accounting statement of cash flows is that since interest appears on the
income statement, which shows the operations for the period, it is an operating cash flow. In reality,
interest is a financing expense, which results from the company’s choice of debt and equity. We will
have more to say about this in a later chapter. When comparing the two cash flow statements, the
financial statement of cash flows is a more appropriate measure of the company’s performance
because of its treatment of interest.
5. Market values can never be negative. Imagine a share of stock selling for –$20. This would mean
that if you placed an order for 100 shares, you would get the stock along with a check for $2,000.
How many shares do you want to buy? More generally, because of corporate and individual
bankruptcy laws, net worth for a person or a corporation cannot be negative, implying that liabilities
cannot exceed assets in market value.
6. For a successful company that is rapidly expanding, for example, capital outlays will be large,
possibly leading to negative cash flow from assets. In general, what matters is whether the money is
spent wisely, not whether cash flow from assets is positive or negative.
7. It’s probably not a good sign for an established company to have negative cash flow from
operations, but it would be fairly ordinary for a start-up, so it depends.
CHAPTER 2 - 6
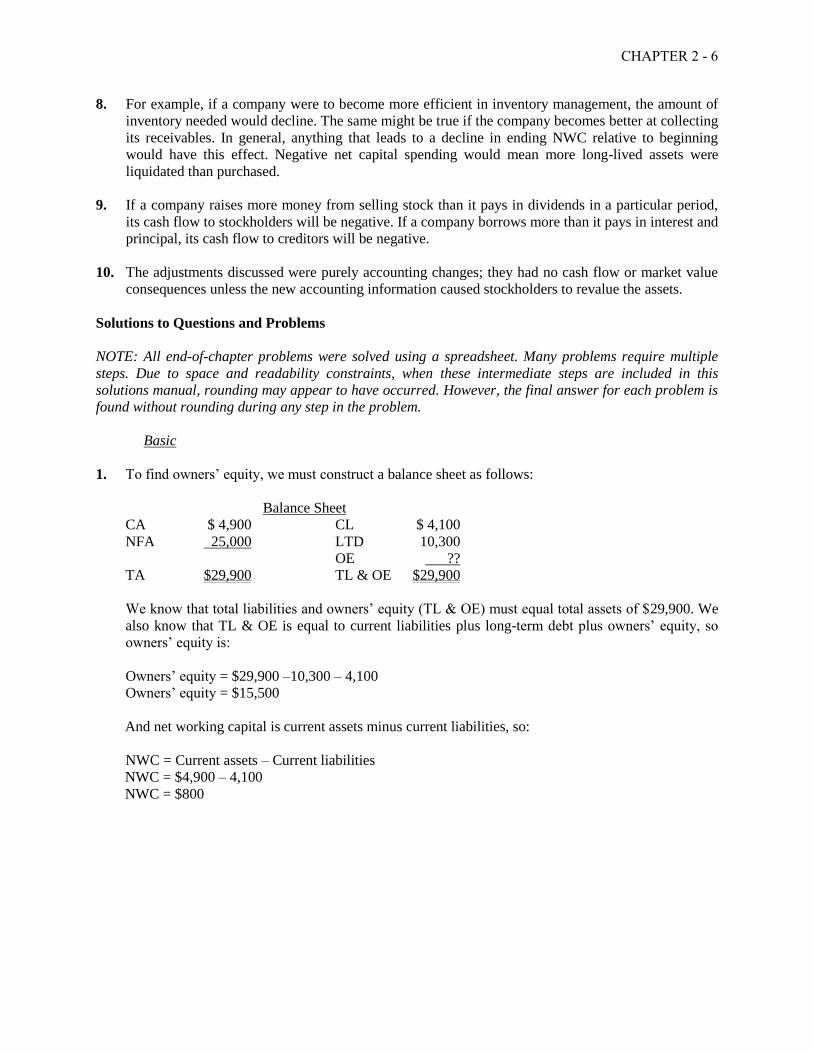
8. For example, if a company were to become more efficient in inventory management, the amount of
inventory needed would decline. The same might be true if the company becomes better at collecting
its receivables. In general, anything that leads to a decline in ending NWC relative to beginning
would have this effect. Negative net capital spending would mean more long-lived assets were
liquidated than purchased.
9. If a company raises more money from selling stock than it pays in dividends in a particular period,
its cash flow to stockholders will be negative. If a company borrows more than it pays in interest and
principal, its cash flow to creditors will be negative.
10. The adjustments discussed were purely accounting changes; they had no cash flow or market value
consequences unless the new accounting information caused stockholders to revalue the assets.
Solutions to Questions and Problems
NOTE: All end-of-chapter problems were solved using a spreadsheet. Many problems require multiple
steps. Due to space and readability constraints, when these intermediate steps are included in this
solutions manual, rounding may appear to have occurred. However, the final answer for each problem is
found without rounding during any step in the problem.
Basic
1. To find owners’ equity, we must construct a balance sheet as follows:
Balance Sheet
CA $ 4,900 CL $ 4,100
NFA 25,000 LTD 10,300
OE ??
TA $29,900 TL & OE $29,900
We know that total liabilities and owners’ equity (TL & OE) must equal total assets of $29,900. We
also know that TL & OE is equal to current liabilities plus long-term debt plus owners’ equity, so
owners’ equity is:
Owners’ equity = $29,900 –10,300 – 4,100
Owners’ equity = $15,500
And net working capital is current assets minus current liabilities, so:
NWC = Current assets – Current liabilities
NWC = $4,900 – 4,100
NWC = $800
CHAPTER 2 - 7
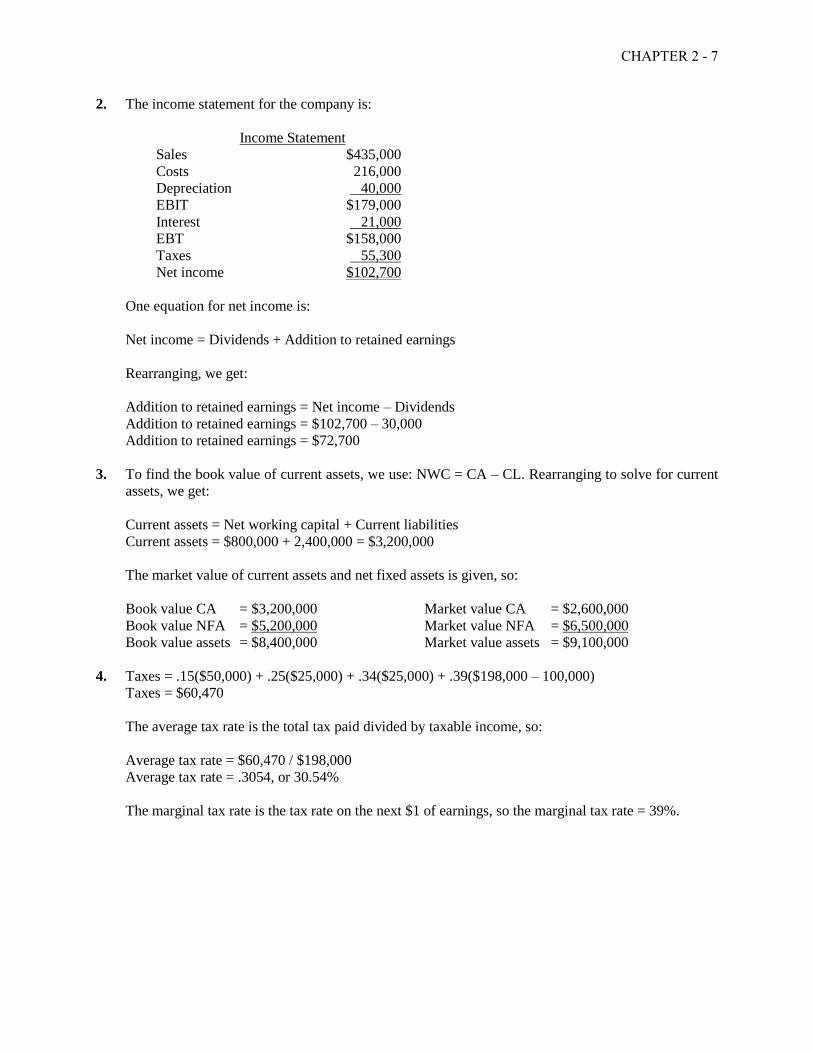
2. The income statement for the company is:
Income Statement
Sales $435,000
Costs 216,000
Depreciation 40,000
EBIT $179,000
Interest 21,000
EBT $158,000
Taxes 55,300
Net income $102,700
One equation for net income is:
Net income = Dividends + Addition to retained earnings
Rearranging, we get:
Addition to retained earnings = Net income – Dividends
Addition to retained earnings = $102,700 – 30,000
Addition to retained earnings = $72,700
3. To find the book value of current assets, we use: NWC = CA – CL. Rearranging to solve for current
assets, we get:
Current assets = Net working capital + Current liabilities
Current assets = $800,000 + 2,400,000 = $3,200,000
The market value of current assets and net fixed assets is given, so:
Book value CA = $3,200,000 Market value CA = $2,600,000
Book value NFA = $5,200,000 Market value NFA = $6,500,000
Book value assets = $8,400,000 Market value assets = $9,100,000
4. Taxes = .15($50,000) + .25($25,000) + .34($25,000) + .39($198,000 – 100,000)
Taxes = $60,470
The average tax rate is the total tax paid divided by taxable income, so:
Average tax rate = $60,470 / $198,000
Average tax rate = .3054, or 30.54%
The marginal tax rate is the tax rate on the next $1 of earnings, so the marginal tax rate = 39%.
CHAPTER 2 - 8
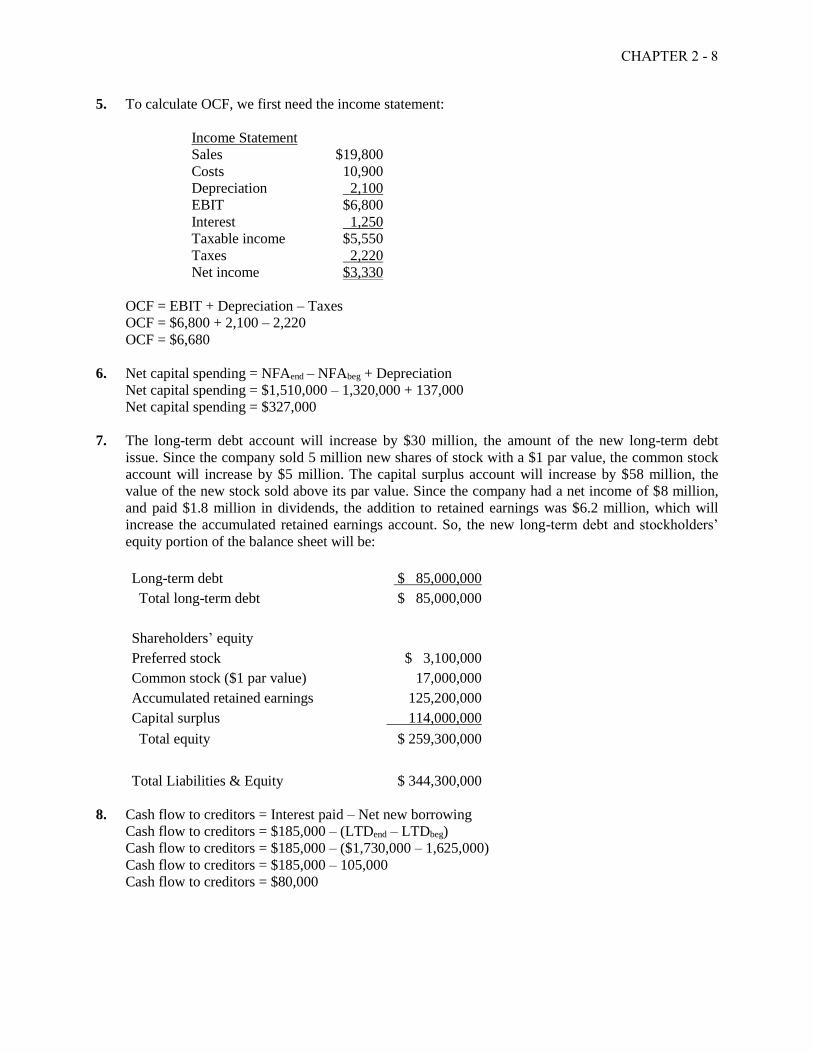
5. To calculate OCF, we first need the income statement:
Income Statement
Sales $19,800
Costs 10,900
Depreciation 2,100
EBIT $6,800
Interest 1,250
Taxable income $5,550
Taxes 2,220
Net income $3,330
OCF = EBIT + Depreciation – Taxes
OCF = $6,800 + 2,100 – 2,220
OCF = $6,680
6. Net capital spending = NFAend – NFAbeg + Depreciation
Net capital spending = $1,510,000 – 1,320,000 + 137,000
Net capital spending = $327,000
7. The long-term debt account will increase by $30 million, the amount of the new long-term debt
issue. Since the company sold 5 million new shares of stock with a $1 par value, the common stock
account will increase by $5 million. The capital surplus account will increase by $58 million, the
value of the new stock sold above its par value. Since the company had a net income of $8 million,
and paid $1.8 million in dividends, the addition to retained earnings was $6.2 million, which will
increase the accumulated retained earnings account. So, the new long-term debt and stockholders’
equity portion of the balance sheet will be:
Long-term debt $ 85,000,000
Total long-term debt $ 85,000,000
Shareholders’ equity
Preferred stock $ 3,100,000
Common stock ($1 par value) 17,000,000
Accumulated retained earnings 125,200,000
Capital surplus 114,000,000
Total equity $ 259,300,000
Total Liabilities & Equity $ 344,300,000
8. Cash flow to creditors = Interest paid – Net new borrowing
Cash flow to creditors = $185,000 – (LTDend – LTDbeg)
Cash flow to creditors = $185,000 – ($1,730,000 – 1,625,000)
Cash flow to creditors = $185,000 – 105,000
Cash flow to creditors = $80,000
CHAPTER 2 - 9
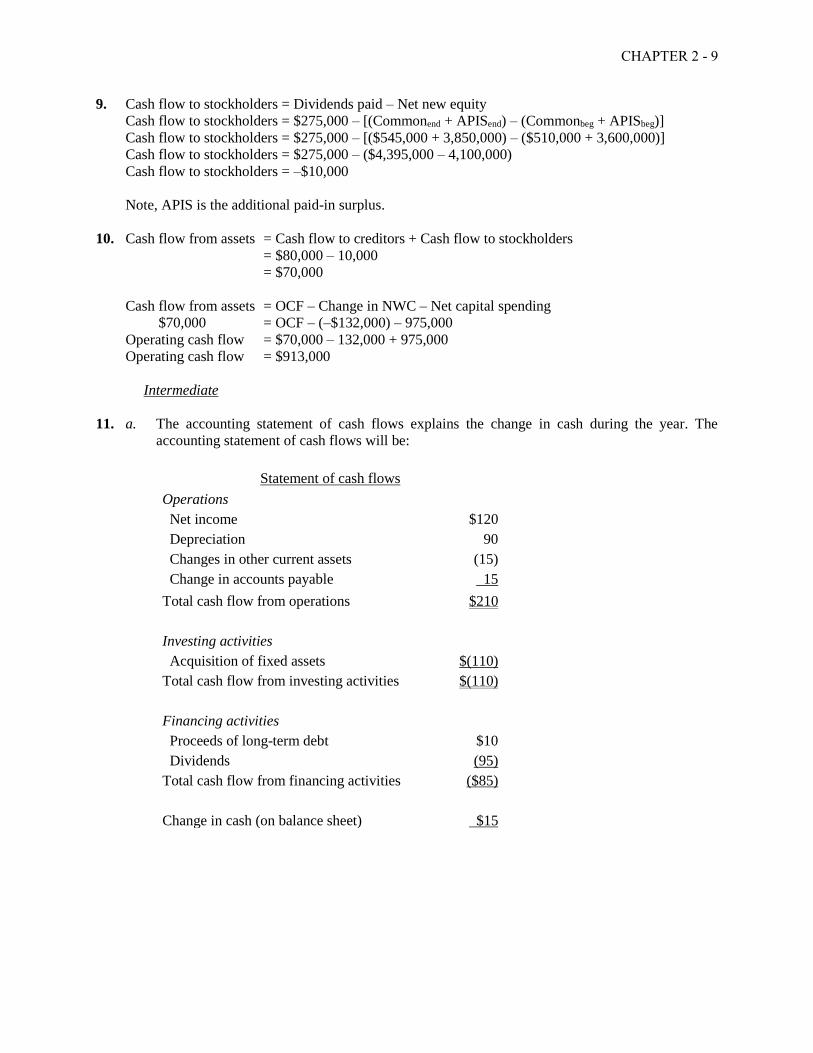
9. Cash flow to stockholders = Dividends paid – Net new equity
Cash flow to stockholders = $275,000 – [(Commonend + APISend) – (Commonbeg + APISbeg)]
Cash flow to stockholders = $275,000 – [($545,000 + 3,850,000) – ($510,000 + 3,600,000)]
Cash flow to stockholders = $275,000 – ($4,395,000 – 4,100,000)
Cash flow to stockholders = –$10,000
Note, APIS is the additional paid-in surplus.
10. Cash flow from assets = Cash flow to creditors + Cash flow to stockholders
= $80,000 – 10,000
= $70,000
Cash flow from assets = OCF – Change in NWC – Net capital spending
$70,000 = OCF – (–$132,000) – 975,000
Operating cash flow = $70,000 – 132,000 + 975,000
Operating cash flow = $913,000
Intermediate
11. a. The accounting statement of cash flows explains the change in cash during the year. The
accounting statement of cash flows will be:
Statement of cash flows
Operations
Net income $120
Depreciation 90
Changes in other current assets (15)
Change in accounts payable 15
Total cash flow from operations $210
Investing activities
Acquisition of fixed assets $(110)
Total cash flow from investing activities $(110)
Financing activities
Proceeds of long-term debt $10
Dividends (95)
Total cash flow from financing activities ($85)
Change in cash (on balance sheet) $15

CHAPTER 2 - 10
b. Change in NWC = NWCend – NWCbeg
= (CAend – CLend) – (CAbeg – CLbeg)
= [($80 + 185) – 140] – [($60 + 170) – 125)
= $125 – 105
= $20
c. To find the cash flow generated by the firm’s assets, we need the operating cash flow, and the
capital spending. So, calculating each of these, we find:
Operating cash flow
Net income $120
Depreciation 90
Operating cash flow $210
Note that we can calculate OCF in this manner since there are no taxes.
Capital spending
Ending fixed assets $405
Beginning fixed assets –385
Depreciation 90
Capital spending $110
Now we can calculate the cash flow generated by the firm’s assets, which is:
Cash flow from assets
Operating cash flow $210
Capital spending –110
Change in NWC –20
Cash flow from assets $ 80
12. With the information provided, the cash flows from the firm are the capital spending and the change
in net working capital, so:
Cash flows from the firm
Capital spending $(27,000)
Additions to NWC (2,300)
Cash flows from the firm $(29,300)
And the cash flows to the investors of the firm are:
Cash flows to investors of the firm
Sale of long-term debt $(17,800)
Sale of common stock (5,000)
Dividends paid 15,200
Cash flows to investors of the firm $(7,600)
CHAPTER 2 - 11
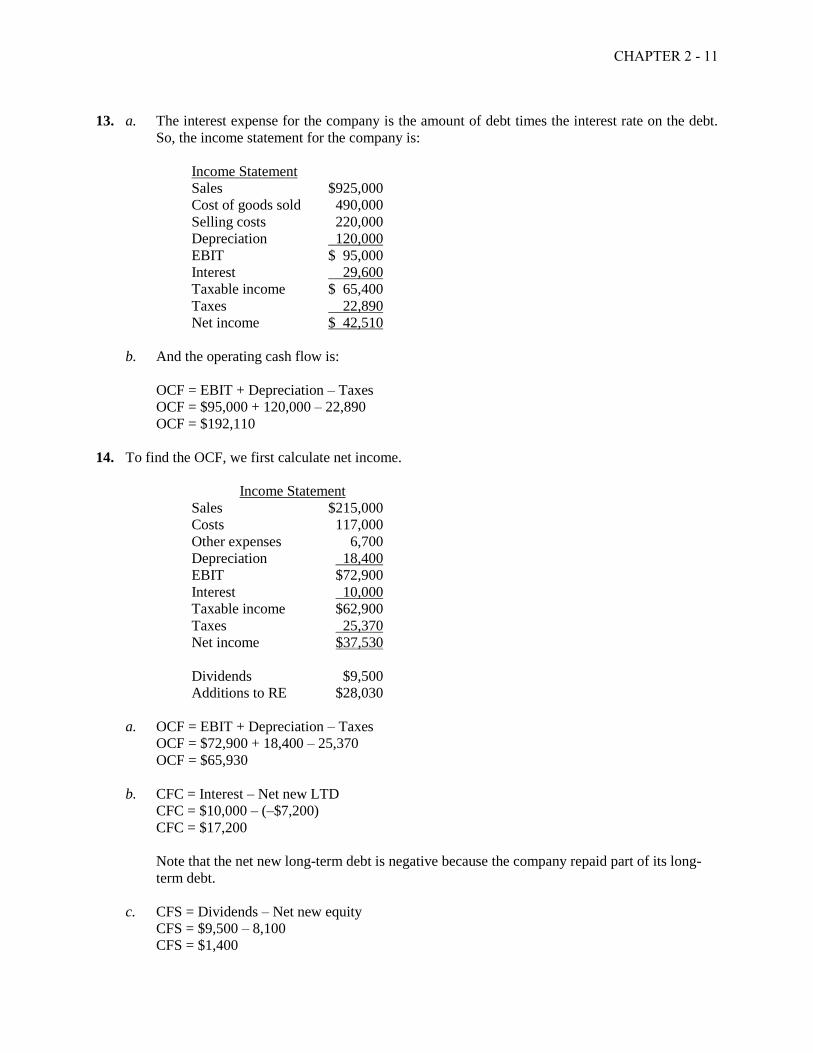
13. a. The interest expense for the company is the amount of debt times the interest rate on the debt.
So, the income statement for the company is:
Income Statement
Sales $925,000
Cost of goods sold 490,000
Selling costs 220,000
Depreciation 120,000
EBIT $ 95,000
Interest 29,600
Taxable income $ 65,400
Taxes 22,890
Net income $ 42,510
b. And the operating cash flow is:
OCF = EBIT + Depreciation – Taxes
OCF = $95,000 + 120,000 – 22,890
OCF = $192,110
14. To find the OCF, we first calculate net income.
Income Statement
Sales $215,000
Costs 117,000
Other expenses 6,700
Depreciation 18,400
EBIT $72,900
Interest 10,000
Taxable income $62,900
Taxes 25,370
Net income $37,530
Dividends $9,500
Additions to RE $28,030
a. OCF = EBIT + Depreciation – Taxes
OCF = $72,900 + 18,400 – 25,370
OCF = $65,930
b. CFC = Interest – Net new LTD
CFC = $10,000 – (–$7,200)
CFC = $17,200
Note that the net new long-term debt is negative because the company repaid part of its long-
term debt.
c. CFS = Dividends – Net new equity
CFS = $9,500 – 8,100
CFS = $1,400
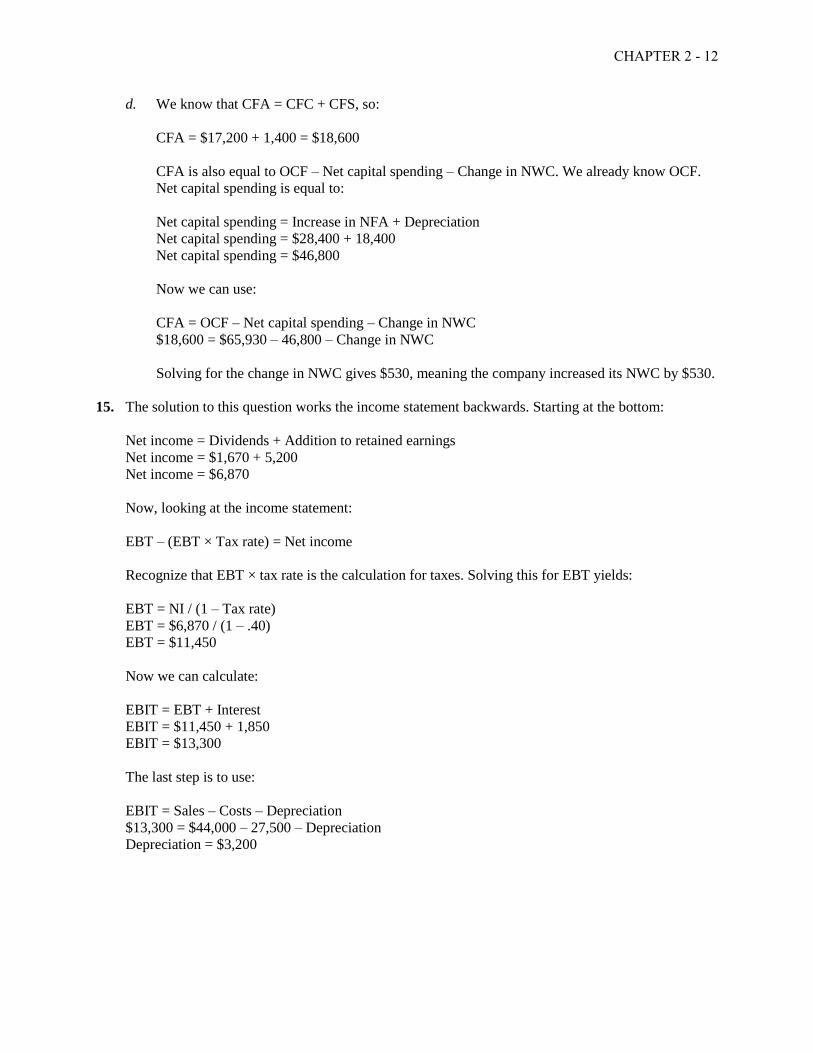
CHAPTER 2 - 12
d. We know that CFA = CFC + CFS, so:
CFA = $17,200 + 1,400 = $18,600
CFA is also equal to OCF – Net capital spending – Change in NWC. We already know OCF.
Net capital spending is equal to:
Net capital spending = Increase in NFA + Depreciation
Net capital spending = $28,400 + 18,400
Net capital spending = $46,800
Now we can use:
CFA = OCF – Net capital spending – Change in NWC
$18,600 = $65,930 – 46,800 – Change in NWC
Solving for the change in NWC gives $530, meaning the company increased its NWC by $530.
15. The solution to this question works the income statement backwards. Starting at the bottom:
Net income = Dividends + Addition to retained earnings
Net income = $1,670 + 5,200
Net income = $6,870
Now, looking at the income statement:
EBT – (EBT × Tax rate) = Net income
Recognize that EBT × tax rate is the calculation for taxes. Solving this for EBT yields:
EBT = NI / (1 – Tax rate)
EBT = $6,870 / (1 – .40)
EBT = $11,450
Now we can calculate:
EBIT = EBT + Interest
EBIT = $11,450 + 1,850
EBIT = $13,300
The last step is to use:
EBIT = Sales – Costs – Depreciation
$13,300 = $44,000 – 27,500 – Depreciation
Depreciation = $3,200
CHAPTER 2 - 13
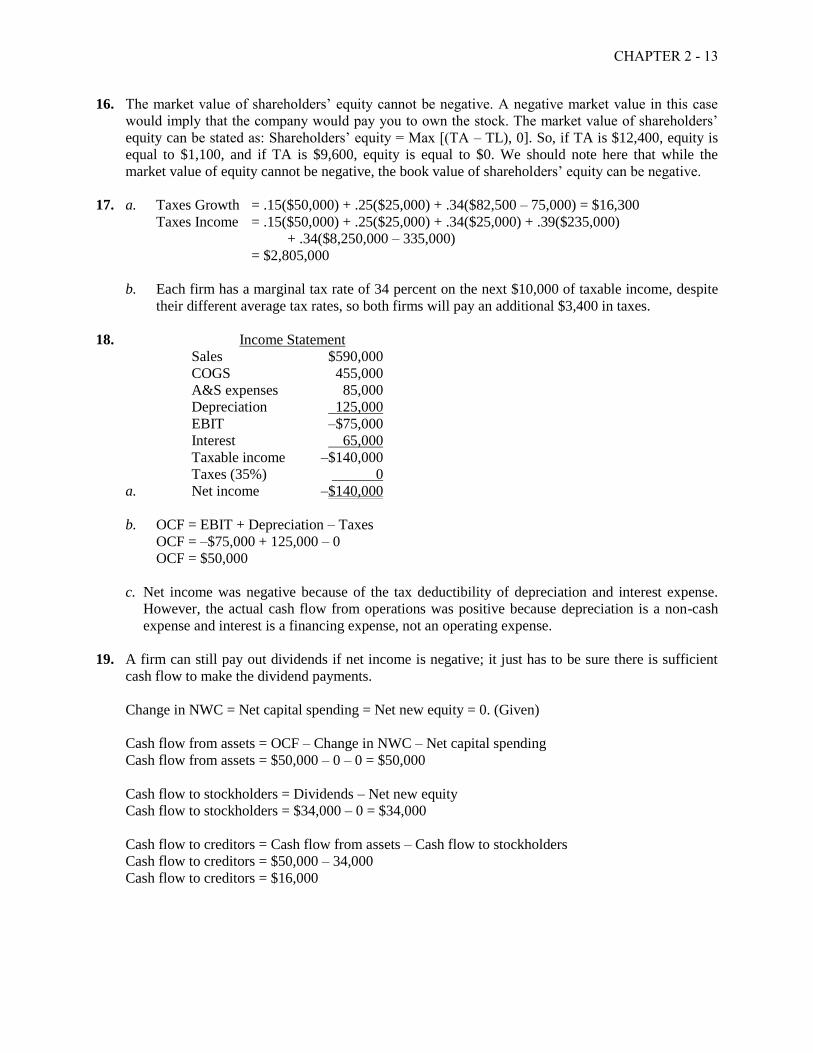
16. The market value of shareholders’ equity cannot be negative. A negative market value in this case
would imply that the company would pay you to own the stock. The market value of shareholders’
equity can be stated as: Shareholders’ equity = Max [(TA – TL), 0]. So, if TA is $12,400, equity is
equal to $1,100, and if TA is $9,600, equity is equal to $0. We should note here that while the
market value of equity cannot be negative, the book value of shareholders’ equity can be negative.
17. a. Taxes Growth = .15($50,000) + .25($25,000) + .34($82,500 – 75,000) = $16,300
Taxes Income = .15($50,000) + .25($25,000) + .34($25,000) + .39($235,000)
+ .34($8,250,000 – 335,000)
= $2,805,000
b. Each firm has a marginal tax rate of 34 percent on the next $10,000 of taxable income, despite
their different average tax rates, so both firms will pay an additional $3,400 in taxes.
18. Income Statement
Sales $590,000
COGS 455,000
A&S expenses 85,000
Depreciation 125,000
EBIT –$75,000
Interest 65,000
Taxable income –$140,000
Taxes (35%) 0
a. Net income –$140,000
b. OCF = EBIT + Depreciation – Taxes
OCF = –$75,000 + 125,000 – 0
OCF = $50,000
c. Net income was negative because of the tax deductibility of depreciation and interest expense.
However, the actual cash flow from operations was positive because depreciation is a non-cash
expense and interest is a financing expense, not an operating expense.
19. A firm can still pay out dividends if net income is negative; it just has to be sure there is sufficient
cash flow to make the dividend payments.
Change in NWC = Net capital spending = Net new equity = 0. (Given)
Cash flow from assets = OCF – Change in NWC – Net capital spending
Cash flow from assets = $50,000 – 0 – 0 = $50,000
Cash flow to stockholders = Dividends – Net new equity
Cash flow to stockholders = $34,000 – 0 = $34,000
Cash flow to creditors = Cash flow from assets – Cash flow to stockholders
Cash flow to creditors = $50,000 – 34,000
Cash flow to creditors = $16,000
CHAPTER 2 - 14
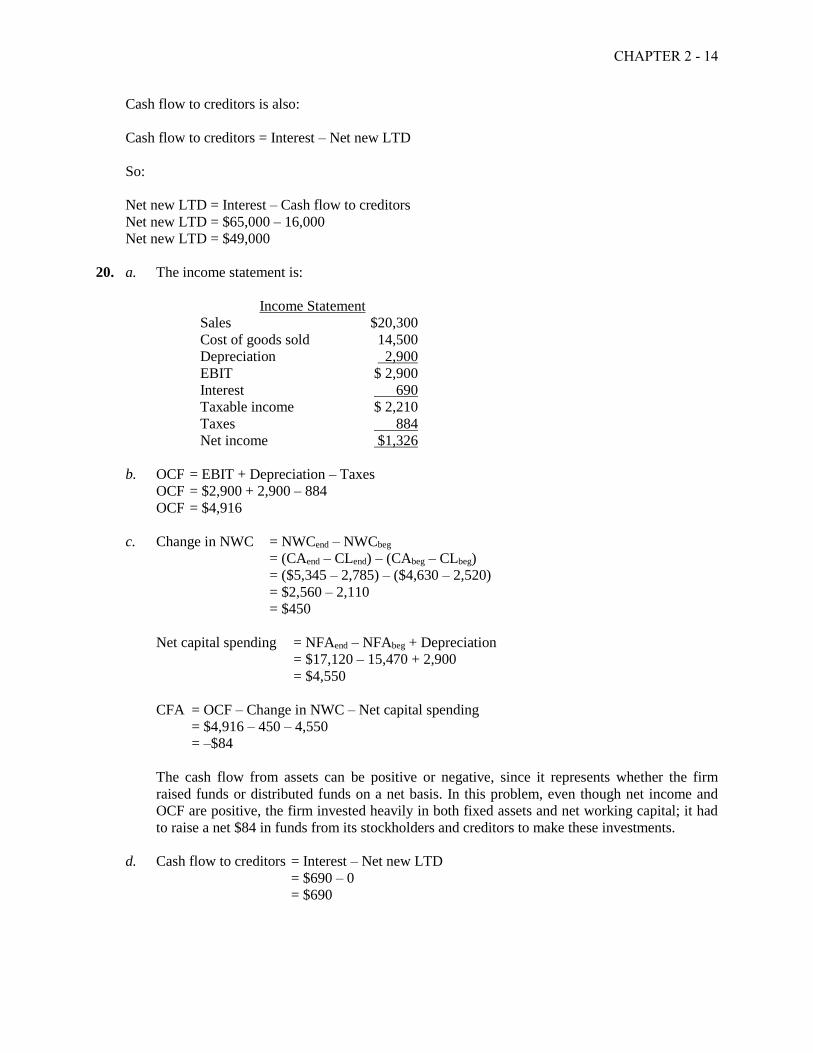
Cash flow to creditors is also:
Cash flow to creditors = Interest – Net new LTD
So:
Net new LTD = Interest – Cash flow to creditors
Net new LTD = $65,000 – 16,000
Net new LTD = $49,000
20. a. The income statement is:
Income Statement
Sales $20,300
Cost of goods sold 14,500
Depreciation 2,900
EBIT $ 2,900
Interest 690
Taxable income $ 2,210
Taxes 884
Net income $1,326
b. OCF = EBIT + Depreciation – Taxes
OCF = $2,900 + 2,900 – 884
OCF = $4,916
c. Change in NWC = NWCend – NWCbeg
= (CAend – CLend) – (CAbeg – CLbeg)
= ($5,345 – 2,785) – ($4,630 – 2,520)
= $2,560 – 2,110
= $450
Net capital spending = NFAend – NFAbeg + Depreciation
= $17,120 – 15,470 + 2,900
= $4,550
CFA = OCF – Change in NWC – Net capital spending
= $4,916 – 450 – 4,550
= –$84
The cash flow from assets can be positive or negative, since it represents whether the firm
raised funds or distributed funds on a net basis. In this problem, even though net income and
OCF are positive, the firm invested heavily in both fixed assets and net working capital; it had
to raise a net $84 in funds from its stockholders and creditors to make these investments.
d. Cash flow to creditors = Interest – Net new LTD
= $690 – 0
= $690

CHAPTER 2 - 15
Cash flow to stockholders = Cash flow from assets – Cash flow to creditors
= –$84 – 690
= –$774
We can also calculate the cash flow to stockholders as:
Cash flow to stockholders = Dividends – Net new equity
Solving for net new equity, we get:
Net new equity = $774 – (–660)
= $1,434
The firm had positive earnings in an accounting sense (NI > 0) and had positive cash flow from
operations. The firm invested $450 in new net working capital and $4,550 in new fixed assets.
The firm had to raise $84 from its stakeholders to support this new investment. It accomplished
this by raising $1,434 in the form of new equity. After paying out $660 of this in the form of
dividends to shareholders and $690 in the form of interest to creditors, $84 was left to meet the
firm’s cash flow needs for investment.
21. a. Total assets 2014 = $964 + 4,384 = $5,348
Total liabilities 2014 = $401 + 2,380 = $2,781
Owners’ equity 2014 = $5,348 – 2,781 = $2,567
Total assets 2015 = $1,176 + 5,104 = $6,280
Total liabilities 2015 = $445 + 2,713 = $3,158
Owners’ equity 2015 = $6,280 – 3,158 = $3,122
b. NWC 2014 = CA14 – CL14 = $964 – 401 = $563
NWC 2015 = CA15 – CL15 = $1,176 – 445 = $731
Change in NWC = NWC15 – NWC14 = $731 – 563 = $168
c. We can calculate net capital spending as:
Net capital spending = Net fixed assets 2015 – Net fixed assets 2014 + Depreciation
Net capital spending = $5,104 – 4,384 + 1,190
Net capital spending = $1,910
So, the company had a net capital spending cash flow of $1,910. We also know that net capital
spending is:
Net capital spending = Fixed assets bought – Fixed assets sold
$1,910 = $2,350 – Fixed assets sold
Fixed assets sold = $2,350 – 1,910
Fixed assets sold = $440

CHAPTER 2 - 16
To calculate the cash flow from assets, we must first calculate the operating cash flow. The
operating cash flow is calculated as follows (you can also prepare a traditional income
statement):
EBIT = Sales – Costs – Depreciation
EBIT = $14,740 – 5,932 – 1,190
EBIT = $7,618
EBT = EBIT – Interest
EBT = $7,618 – 328
EBT = $7,290
Taxes = EBT .40
Taxes = $7,290 .40
Taxes = $2,916
OCF = EBIT + Depreciation – Taxes
OCF = $7,618 + 1,190 – 2,916
OCF = $5,892
Cash flow from assets = OCF – Change in NWC – Net capital spending
Cash flow from assets = $5,892 – 168 – 1,910
Cash flow from assets = $3,814
d. Net new borrowing = LTD15 – LTD14
Net new borrowing = $2,713 – 2,380
Net new borrowing = $333
Net new borrowing = $333 = Debt issued – Debt retired
Debt retired = $455 – 333
Debt retired = $122
Cash flow to creditors = Interest – Net new LTD
Cash flow to creditors = $328 – 333
Cash flow to creditors = –$5
CHAPTER 2 - 17
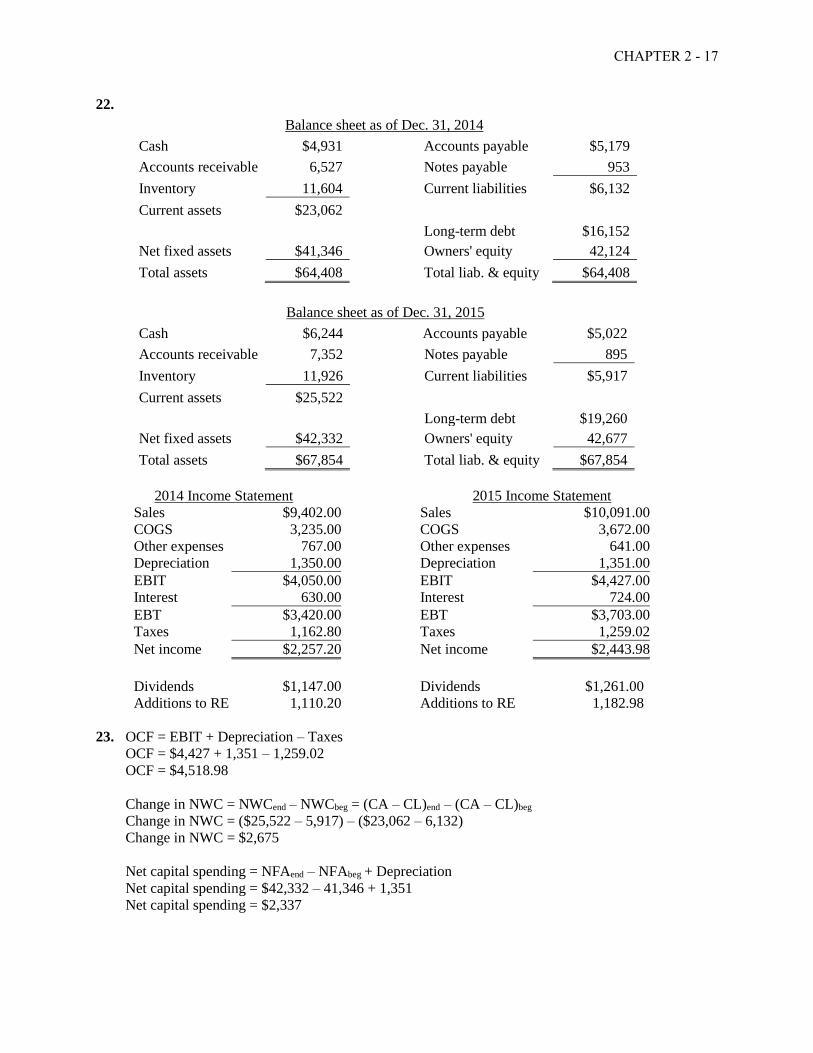
22.
Balance sheet as of Dec. 31, 2014
Cash $4,931 Accounts payable $5,179
Accounts receivable 6,527 Notes payable 953
Inventory 11,604 Current liabilities $6,132
Current assets $23,062
Long-term debt $16,152
Net fixed assets $41,346 Owners' equity 42,124
Total assets $64,408 Total liab. & equity $64,408
Balance sheet as of Dec. 31, 2015
Cash $6,244 Accounts payable $5,022
Accounts receivable 7,352 Notes payable 895
Inventory 11,926 Current liabilities $5,917
Current assets $25,522
Long-term debt $19,260
Net fixed assets $42,332 Owners' equity 42,677
Total assets $67,854 Total liab. & equity $67,854
2014 Income Statement 2015 Income Statement
Sales $9,402.00 Sales $10,091.00 COGS 3,235.00 COGS 3,672.00 Other expenses 767.00 Other expenses 641.00 Depreciation 1,350.00 Depreciation 1,351.00 EBIT $4,050.00 EBIT $4,427.00 Interest 630.00 Interest 724.00 EBT $3,420.00 EBT $3,703.00 Taxes 1,162.80 Taxes 1,259.02 Net income $2,257.20 Net income $2,443.98
Dividends $1,147.00 Dividends $1,261.00 Additions to RE 1,110.20 Additions to RE 1,182.98
23. OCF = EBIT + Depreciation – Taxes
OCF = $4,427 + 1,351 – 1,259.02
OCF = $4,518.98
Change in NWC = NWCend – NWCbeg = (CA – CL)end – (CA – CL)beg
Change in NWC = ($25,522 – 5,917) – ($23,062 – 6,132)
Change in NWC = $2,675
Net capital spending = NFAend – NFAbeg + Depreciation
Net capital spending = $42,332 – 41,346 + 1,351
Net capital spending = $2,337
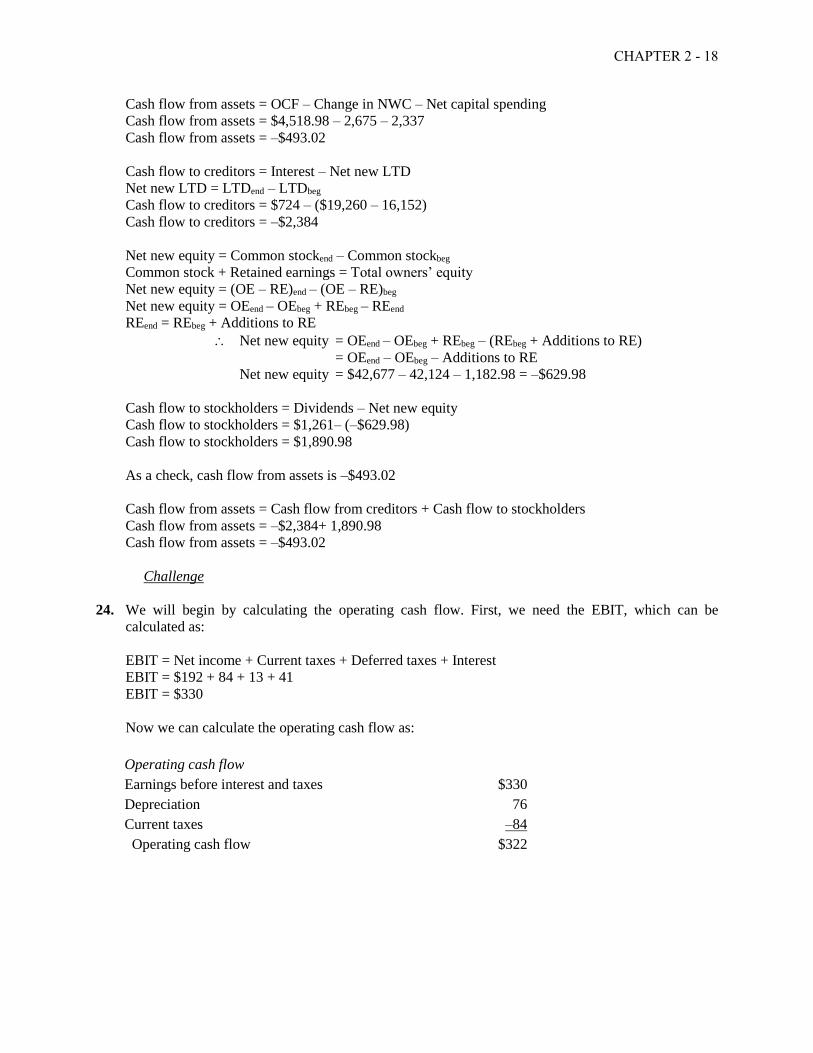
CHAPTER 2 - 18
Cash flow from assets = OCF – Change in NWC – Net capital spending
Cash flow from assets = $4,518.98 – 2,675 – 2,337
Cash flow from assets = –$493.02
Cash flow to creditors = Interest – Net new LTD
Net new LTD = LTDend – LTDbeg
Cash flow to creditors = $724 – ($19,260 – 16,152)
Cash flow to creditors = –$2,384
Net new equity = Common stockend – Common stockbeg
Common stock + Retained earnings = Total owners’ equity
Net new equity = (OE – RE)end – (OE – RE)beg
Net new equity = OEend – OEbeg + REbeg – REend
REend = REbeg + Additions to RE Net new equity = OEend – OEbeg + REbeg – (REbeg + Additions to RE)
= OEend – OEbeg – Additions to RE
Net new equity = $42,677 – 42,124 – 1,182.98 = –$629.98
Cash flow to stockholders = Dividends – Net new equity
Cash flow to stockholders = $1,261– (–$629.98)
Cash flow to stockholders = $1,890.98
As a check, cash flow from assets is –$493.02
Cash flow from assets = Cash flow from creditors + Cash flow to stockholders
Cash flow from assets = –$2,384+ 1,890.98
Cash flow from assets = –$493.02
Challenge
24. We will begin by calculating the operating cash flow. First, we need the EBIT, which can be
calculated as:
EBIT = Net income + Current taxes + Deferred taxes + Interest
EBIT = $192 + 84 + 13 + 41
EBIT = $330
Now we can calculate the operating cash flow as:
Operating cash flow
Earnings before interest and taxes $330
Depreciation 76
Current taxes –84
Operating cash flow $322
CHAPTER 2 - 19
The cash flow from assets is found in the investing activities portion of the accounting statement of
cash flows, so:
Cash flow from assets
Acquisition of fixed assets $198
Sale of fixed assets –21
Capital spending $177
The net working capital cash flows are all found in the operations cash flow section of the
accounting statement of cash flows. However, instead of calculating the net working capital cash
flows as the change in net working capital, we must calculate each item individually. Doing so, we
find:
Net working capital cash flow
Cash $29
Accounts receivable 16
Inventories –17
Accounts payable –13
Accrued expenses 7
Other –2
NWC cash flow $20
Except for the interest expense, the cash flow to creditors is found in the financing activities of the
accounting statement of cash flows. The interest expense from the income statement is given, so:
Cash flow to creditors
Interest $41
Retirement of debt 150
Debt service $191
Proceeds from sale of long-term debt –115
Total $76
And we can find the cash flow to stockholders in the financing section of the accounting statement of
cash flows. The cash flow to stockholders was:
Cash flow to stockholders
Dividends $ 81
Repurchase of stock 11
Cash to stockholders $ 92
Proceeds from new stock issue –43
Total $ 49
CHAPTER 2 - 20
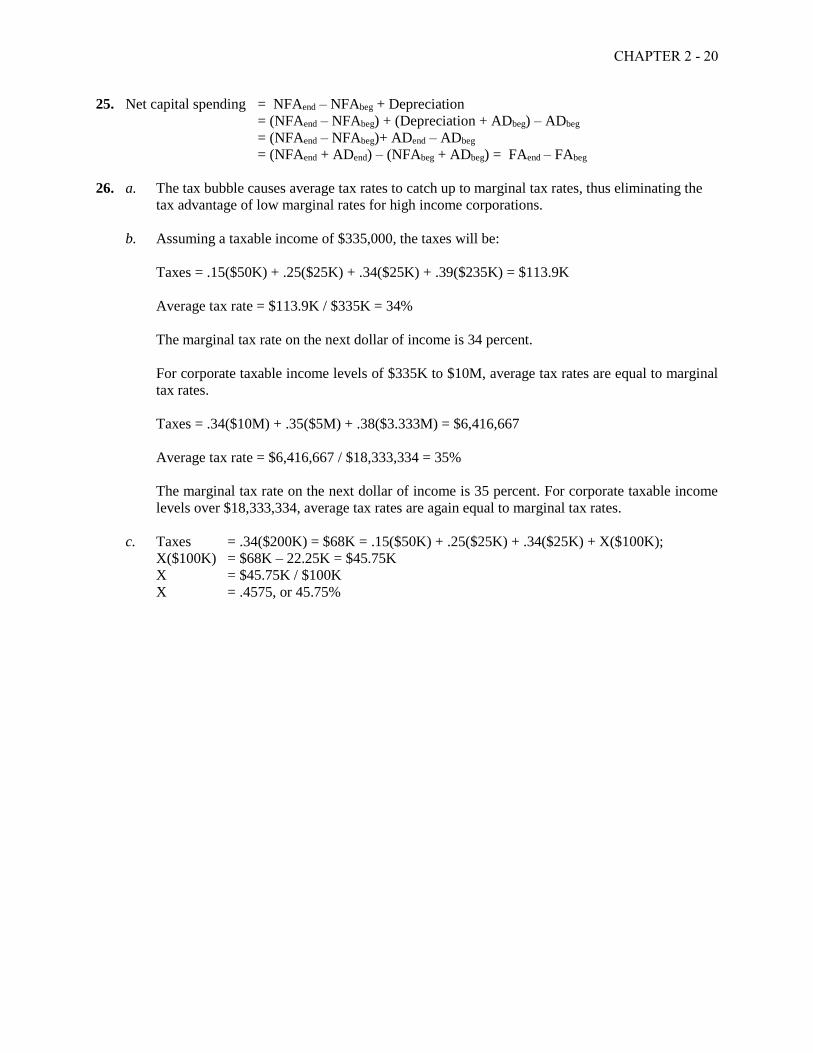
25. Net capital spending = NFAend – NFAbeg + Depreciation
= (NFAend – NFAbeg) + (Depreciation + ADbeg) – ADbeg
= (NFAend – NFAbeg)+ ADend – ADbeg
= (NFAend + ADend) – (NFAbeg + ADbeg) = FAend – FAbeg
26. a. The tax bubble causes average tax rates to catch up to marginal tax rates, thus eliminating the
tax advantage of low marginal rates for high income corporations.
b. Assuming a taxable income of $335,000, the taxes will be:
Taxes = .15($50K) + .25($25K) + .34($25K) + .39($235K) = $113.9K
Average tax rate = $113.9K / $335K = 34%
The marginal tax rate on the next dollar of income is 34 percent.
For corporate taxable income levels of $335K to $10M, average tax rates are equal to marginal
tax rates.
Taxes = .34($10M) + .35($5M) + .38($3.333M) = $6,416,667
Average tax rate = $6,416,667 / $18,333,334 = 35%
The marginal tax rate on the next dollar of income is 35 percent. For corporate taxable income
levels over $18,333,334, average tax rates are again equal to marginal tax rates.
c. Taxes = .34($200K) = $68K = .15($50K) + .25($25K) + .34($25K) + X($100K);
X($100K) = $68K – 22.25K = $45.75K
X = $45.75K / $100K
X = .4575, or 45.75%
CHAPTER 2 - 21
Corporate Finance 11th Edition Ross Solutions ManualFull Download: http://testbanklive.com/download/corporate-finance-11th-edition-ross-solutions-manual/
Full download all chapters instantly please go to Solutions Manual, Test Bank site: testbanklive.com