corporate brand valuation: residual contribution method
TRANSCRIPT

Business Enterprise Valuation
Monetary and Tangible Asset Isolation
Accounting Intangibles (Excluding Brand)
Non‐Accounting Intangibles
(Excluding Brand)
Pure Goodwill Residual and
Implied Royalty on Brand
Revaluation of Primary
Intangibles with CAC to Brand
B = GP + RB
Residual Contribution Method
Copyright © 2015 Beacon Valuation Group LLC 1

Presented by:
René Hlousek, ASA‐BV/IA, MRICSBeacon Valuation Group LLC
San Francisco, CA • Guam, U.S.A.

What is Corporate Brand……...from a Valuation Standpoint? Universe of Attempts to Value Brand – Traps & Shortcomings
Moving Beyond Current Threshold: Residual Contribution Method Tapping into the Wealth of Financial Reporting Valuation Concepts Setting Boundaries for Asset Group Values Value Drivers: Examination of Accounting vs. Non‐Accounting Intangibles Purification of Goodwill – Application of Filters Key Step toward Valuing Brand: Exclude it First! Path to Brand Royalty Rate – Without the Reliance on Generic Market Data Isolating, Extracting, and Unifying Residuals – The Essence of Brand Value
Practical Overview of Analytical Flow and Synthesis
Appendix: About the Presenter
Copyright © 2015 Beacon Valuation Group LLC 3

Corporate brand, as opposed to product brands, is a single umbrella image that groups together the experiences, values, and images of a corporation’s panoply of activities.
Can be depicted as a network of knowledge about a company stored in the mind of the target communities such as: Customers, employees, shareholders, investors, journalists, analysts, business partners, and competitors
Although a corporate brand is defined partly by identifiable intangible assets, such as a company trade name, trademark, or logo, all of which can be legally protected, the greatest value of a corporate brand is even more intangible than these assets.
Unlike product brands, or other intangible assets held by a company, corporate brands cannot be separated from the rest of the assets, without substantially diminishing the value of the majority of the company’s intangible assets or the overall business enterprise housing them.
Brand equity is a phrase used in the marketing industry which describes the value of having a well‐known brand name, based on the idea that the owner of a well‐known brand name can generate more money from products with that brand name than from products with a less well known name.
Copyright © 2015 Beacon Valuation Group LLC 4

The term Goodwill is defined by different bodies in ways that differsignificantly.
IRS Glossary to Publication 551 ‐ defines goodwill as “the value of a trade orbusiness based on expected continued customer patronage due to its name,reputation, or any other factor.” [NOTE THE SIMILARITY TO DEFINITION OF“BRAND”]
The International Glossary of Business Valuation Terms defines goodwill as“that intangible asset arising as a result of name, reputation, customer loyalty,location, products, and similar factors not separately identified.” [NOTE THESIMILARITY TO DEFINITION OF “BRAND”]
Goodwill derived from financial reporting (accounting) guidance as “thepremium that a buyer would be willing to pay for an entity over the net of theamounts assigned to assets and liabilities of the business. This “premium”amount recognized as goodwill includes acquired intangible assets that do notmeet the economic criterion for recognition as assets apart from goodwill.”
Copyright © 2015 Beacon Valuation Group LLC 5
Copyright © 2015 Beacon Valuation Group LLC 6

Does not consider brand earnings potential Fails to distinguish strategic/financial component of brand value from legal aspects
of ownership Overreliance on incomparable market data Quantitative relation between a specific brand element and a financial metric has
not been established Qualitative relation (awareness impacts loyalty) is more common sense than
science, and provides only little practical use for the valuation community Point systems, although providing valuable marketing data to brand managers, are
highly dependent on the relevance of their surveys and target audiences to the key valuation drivers of a corporate brand
More applicable to single product brands – not corporate Inappropriate inclusion/exclusion of brand value drivers Does not examine influence on/from intangibles other than brand Does not remove/reduce subjectivity – only moves it Does not incorporate the full spectrum of risk inherent in the different asset groups
employed by the business enterprise
Copyright © 2015 Beacon Valuation Group LLC 7

Business Enterprise Valuation
Monetary and Tangible Asset Isolation
Accounting Intangibles (Excluding Brand)
Non‐Accounting Intangibles
(Excluding Brand)
Pure Goodwill Residual and
Implied Royalty on Brand
Revaluation of Primary Intangibles with CAC to
Brand
B = GP + RB
Residual Contribution Method
Copyright © 2015 Beacon Valuation Group LLC 8

FMV of Long Term Interest Bearing Debt
+
FMV of EquityFMV of
Intangible Assets
FMV of Tangible Assets
+
Net Working Capital
+
FMV Value of Invested Capital
= =
Investing Approach Operating Approach
Copyright © 2015 Beacon Valuation Group LLC 9

BEV = MA + TA + IA, where: BEV = Business Enterprise Value MA = Monetary (financial) Asset Value (Net Working Capital) TA = Tangible (fixed) Asset Value IA = Intangible Asset Value (including Accounting Goodwill)
By default, the BEV represents the upper limit of value for any one or all ofthe asset (categories) housed by the entity
Of the three approaches to value the enterprise (cost, market, andincome), the multi‐period discounted cash flow (“DCF”) method withinthe income approach is most reliable when setting the basis (upper limit)for the valuation of a corporate brand, since it directly captures theexpected risk‐adjusted economic benefit stream (and its relevantcomponents) generated by the entire portfolio of assets associated withthis key intangible.
Copyright © 2015 Beacon Valuation Group LLC 10

Company XYZBusiness Enterprise Value Model
Multiple Period Discounting Method - Discounted Cash Flow AnalysisTerminal
($000's) 12/31/2015 12/31/2016 12/31/2017 12/31/2018 12/31/2019 12/31/2020 12/31/2021 Value
Revenues $1,360,000 $1,468,800 $1,571,616 $1,665,913 $1,749,209 $1,819,177 $1,873,752% Growth 8.0% 7.0% 6.0% 5.0% 4.0% 3.0%
EBIT $108,800 $132,192 $157,162 $166,591 $174,921 $181,918 $187,375% of Revenue 8.0% 9.0% 10.0% 10.0% 10.0% 10.0% 10.0%
Provision for Income Taxes 40.0% $43,520 $52,877 $62,865 $66,637 $69,968 $72,767 $74,950
Net Income $65,280 $79,315 $94,297 $99,955 $104,953 $109,151 $112,425
Plus: Depreciation & Amortization $13,600 $29,376 $31,432 $33,318 $34,984 $36,384 $37,475Less: Increase in Working Capital @ 10.0% $4,080 $10,880 $10,282 $9,430 $8,330 $6,997 $5,458Less: Capital Expenditures $13,600 $29,376 $31,432 $33,318 $34,984 $36,384 $38,599
Net Free Cash Flow $61,200 $68,435 $84,015 $90,525 $96,623 $102,154 $105,843 $109,019
Partial Period Adjustment 0.583 1.000 1.000 1.000 1.000 1.000 1.000 1.000
Net Free Cash Flow (adjusted) $35,700 $68,435 $84,015 $90,525 $96,623 $102,154 $105,843 $109,019
Discount Rate 12.0%Long-term Growth Rate 3.0%Valuation Date 5/31/2015
Years to Discount 0.583 1.583 2.583 3.583 4.583 5.583 6.583 6.583 Mid-Year Adjustment 0.5 0.5 0.5 0.5 0.5 0.5 0.5 0.5Adjusted Years to Discount 0.292 1.083 2.083 3.083 4.083 5.083 6.083 6.083
Terminal Value $1,211,318
Sum of the PV Interim Cash Flows $396,612 $34,539 $60,529 $66,347 $63,829 $60,829 $57,420 $53,120
PV of the Terminal Value $607,925
Present Value of Total Invested Capital $1,004,538Less: Interest-Bearing Debt $0Unadjusted Estimated Value of Equity $1,004,538
Fair Value of Equity (rounded) $1,000,000
Copyright © 2015 Beacon Valuation Group LLC 11

IA (Including Goodwill) = BEV – (MA + TA)
Subtracting monetary and tangible asset values from the BEV establishes the maximum value allocable to Corporate Brand
The next step in applying the Residual Contribution method is to “filter out” all elements included within the Intangible Asset Group value that are not a component of, or driven by, the entity’s Corporate Brand
Copyright © 2015 Beacon Valuation Group LLC 12

Intangible Assets (IA)
IAA
IAA(Xb) TM(b)
GA
IAXA(Xb)
Rx =[ RMA + RTA +
RIA(XB) +
RB(i) ]
GP
IA = Intangible Asset Value GP = Pure Goodwill ValueIAA = Discretely Identifiable Accounting Intangible Assets RX = Returns on Assets Not Allocated to Any Specific Asset GroupIAA(Xb) = IAA, excluding Brand Value Elements RMA = Return on Monetary Contributory AssetsTM(b) = Trademark Value as Measured for Financial Reporting (Accounting) Purposes RTA = Return on Tangible Contributory AssetsGA = Accounting Goodwill Value RIA = Return on Intangible Contributory AssetsIAXA = Intangible Assets Not Measured for Financial Reporting (Accounting) Purposes RIA(Xb) = Return on Intangible Contributory Assets Other than Corporate BrandIAXA(Xb) = IAXA, excluding Brand Value Elements RB(i) = Return on Corporate Brand's Intrinsic Component
Location of Corporate Brand Value ElementsCopyright © 2015 Beacon Valuation Group LLC
13

For a discrete intangible asset to exist from a valuation or economicperspective, typically it should possess certain attributes. The morecommon attributes include that the asset may:
Be subject to specific identification and recognizable description. Be subject to legal existence and protection. Be subject to the right of private ownership, and this private ownership may
be legally transferable. Include some tangible evidence or manifestation of the existence of the
intangible asset (for example, a contract, a license, or a set of financialstatements).
Have been created or have come into existence as an identifiable item or asthe result of an identifiable event.
Copyright © 2015 Beacon Valuation Group LLC 14

For a discrete intangible asset to have a quantifiable value in terms ofan economic analysis or appraisal, it should possess certain additionalattributes. Some of the additional attributes include the following:
It should generate some measurable amount of economic benefit to itsowner; this economic benefit could be in the form of an income incrementor of a cost decrement; this economic benefit is sometimes measured bycomparison to the amount of income otherwise available to the intangibleasset owner (for example, the business) if the subject intangible asset didnot exist.
It should be able to enhance the value of the other assets with which it isassociated; the other assets may encompass all other business assetsincluding tangible personal property, tangible real estate, or otherintangible assets.
Copyright © 2015 Beacon Valuation Group LLC 15

Marketing‐related Typically assets used in the marketing or promotion of products or services Trademarks, domain names, newspaper mastheads, …..
Customer‐related Relating to existing customer relationships Customer lists, order backlogs, …..
Artistic‐related Arising from legal rights such as those provided by copyright Plays, operas, literary works, musical works, …..
Contract‐based Arising from contractual agreements Value‐added reseller channels, OEM agreements, favorable supply agreements, …..
Technology‐based Relate to innovations or technological advances Patented or non‐patented technology, IPR&D, databases, trade secrets, …..
Copyright © 2015 Beacon Valuation Group LLC 16

$0
$500,000
$1,000,000
$1,500,000
$2,000,000
$2,500,000
$3,000,000
95.0%80.0%
67.9%58.3%
50.4%44.1%
38.9% 35.0% 31.5% 28.4% 25.5% 23.0% 20.7% 18.6% 16.7% 15.1% 13.6% 12.2% 11.0% 9.9%5.0%
20.0%32.1%
41.7%49.6%
55.9% 61.1% 65.0% 68.5% 71.6% 74.5% 77.0% 79.3% 81.4% 83.3% 84.9% 86.4% 87.8% 89.0% 90.1%
Existing Customers Future Customers
Discretely Identifiable Intangible
Component of Accounting Goodwill
Copyright © 2015 Beacon Valuation Group LLC 17

Corporate Brand Value is directly manifested through the entity’s Primary Income Generating Asset(s) (“PIGA”), such as Customer Relationships, and the revenue and associated cash flows generated by this intangible.
When customer relationships represent the entity’s primary income generating asset, the future economic benefit stream associated with a Corporate Brand can be quantified through (extracted from) a systematic examination of the value components embedded within the entity’s existing customer relationships (discretely identifiable accounting intangible) and future customer relationships (generally a component of accounting goodwill).
Copyright © 2015 Beacon Valuation Group LLC 18

The key is to focus on the corporate brand value components embedded within (manifested through) the entity’s primary income generating asset – this could also be the Company’s technology‐based intangibles (existing and future technology) as opposed to customer‐related intangibles.
The example we will use assumes that customer relationships (existing and future) are the entity’s primary income generating asset, representing 100% of the Company’s future revenue/income stream.
To capture the entire future economic benefit stream associated with a Corporate Brand, we must value both existing customer relationships (limited economic life ‐ IAA) and future customer relationships (indefinite economic life assuming a going concern business ‐ IAXA)
Copyright © 2015 Beacon Valuation Group LLC 19

Represents a variation of the discounted cash flow model. The excess earnings method was first used in the 1920's to estimate the value of
intangibles lost when liquor manufacturers were shut down by Prohibition.
Earnings‐based valuation model attributes: Projection of earnings typically spans over a finite life (economic life of
technology). A return on contributory assets is subtracted from net income (unlike in
traditional DCF‐based models). The amount in excess of net income is the basis of the asset value. The earnings stream can therefore be broken down into two components: 1)
Normal return on tangible and intangible assets; and 2) an “excess” amount.
By separating the valuation problem into two parts, EEM focuses attention onthe factors that create value for a firm.
Most appropriate for primary income generating or enabling intangible assets(such as customer relationships).
Copyright © 2015 Beacon Valuation Group LLC 20

Company XYZValuation of Existing Customer Relationships - IA A
Multi-Period Excess Earnings Method
($000's) 12/31/2015 12/31/2016 12/31/2017 12/31/2018 12/31/2034year 1 2 3 4 20
Total Customer Revenue (Existing & Future) $1,360,000 $1,468,800 $1,571,616 $1,665,913 $2,751,668Revenue Growth 8.0% 7.0% 6.0% 3.0%
Existing Customer Relationship Revenue $1,292,000 $1,174,428 $1,067,555 $970,408 $272,071
EBIT Margin 8.0% 9.0% 10.0% 10.0% 10.0%Add: Sales & Marketing Expense on New Accounts 1.0% 1.0% 1.0% 1.0% 1.0% 1.0%Adjusted EBIT Margin 9.0% 10.0% 11.0% 11.0% 11.0%
EBIT $116,280 $117,443 $117,431 $106,745 $29,928
Less: Return on Trade Names @ 0.00% $0 $0 $0 $0 $0
Pretax Income $116,280 $117,443 $117,431 $106,745 $29,928
Provision for Income Taxes 40.0% $46,512 $46,977 $46,972 $42,698 $11,971
Net Income $69,768 $70,466 $70,459 $64,047 $17,957
Less: Return on Working Capital $6,460 $5,872 $5,338 $4,852 $1,360Less: Return on Fixed Assets $5,362 $4,874 $4,430 $4,027 $1,129Less: Return on Assembled Workforce $6,202 $5,637 $5,124 $4,658 $1,306
Total Return on Contributory Assets $18,023 $16,383 $14,892 $13,537 $3,795CAC as a % of Existing Customer Revenue 1.40% 1.40% 1.40% 1.40% 1.40%
Cash Flow Attributable to the Customer Relationships $51,745 $54,082 $55,566 $50,510 $14,161
Partial Period Adjustment 0.583 1.000 1.000 1.000 1.000
Cash Flow Attributable to Customer Relationships $30,184 $54,082 $55,566 $50,510 $14,161
Discount Rate 15.0%Valuation Date 5/31/2015
Years to Discount 0.583 1.583 2.583 3.583 19.583 Mid-Year Adjustment 0.5 0.5 0.5 0.5 0.5Adjusted Years to Discount 0.292 1.083 2.083 3.083 19.083
Present Value of Cash Flows $28,979 $46,484 $41,530 $32,827 $984
Sum of PV Cash Flows $275,789
FMV of Existing Customer Relationships (rounded) $280,000
Copyright © 2015 Beacon Valuation Group LLC 21

Intangibles and Intangible Elements Included in Accounting Goodwill: Assembled Workforce Future Customers Future Technology‐based Intangibles
Future Patents Next Generation Technology Know‐how Internal Technology
Future Strategic Contractual Intangibles or Non‐Contractual Relationships Other Future Intangibles
Marketing‐based that are Unrelated to the Company’s Corporate Brand Future Non‐compete Agreements Artistic and Other Less Likely Intangible Assets
Copyright © 2015 Beacon Valuation Group LLC 22

Other Intangible Elements Included in Accounting Goodwill:
Returns on Assets Not Allocated to Any Specific Asset Group (RX) Returns on Monetary Contributory Assets (RMA) Returns on Tangible Contributory Assets (RTA) Returns on Intangible Contributory Assets (RIA)
Returns on Intangible Contributory Assets Other than Corporate Brand (RIA(Xb)) Returns on Corporate Brand's Intrinsic Component (RB(i))
Portion of Company’s Going Concern Value Outside of the Economic Life ofIntangibles Separately Valued If a combination of the mutually exclusive cash flows of the primary income generating
assets of the business enterprise already fully captures the entire economic benefit stream tobe generated by the entity into perpetuity, then it can be assumed that all of the goingconcern value of the business is already captured within the value of those primary assets.
Valuing both existing customer relationships (assuming a finite life) and future customers(assuming indefinite/infinite life), representing the residual from the overall business afterdeduction for existing customers, fully allocates the going concern value of the businessenterprise to these two assets. (This of course assumes that 100% of the business is driven by theCompany’s customers.)
Copyright © 2015 Beacon Valuation Group LLC 23

Company XYZValuation of Future Customer Relationships - IA XA
Multi-Period Excess Earnings Method
($000's) 12/31/2015 12/31/2016 12/31/2017 12/31/2018 12/31/2034year 1 2 3 4 20
Total Customer Revenue (Existing & Future) $1,360,000 $1,468,800 $1,571,616 $1,665,913 $2,751,668Revenue Growth 8.0% 7.0% 6.0% 3.0%
Existing Customer Relationships Revenue $1,292,000 $1,174,428 $1,067,555 $970,408 $272,071Percent of Total 95.0% 80.0% 67.9% 58.3% 9.9%
Future Customer Relationships Revenue $68,000 $294,372 $504,061 $695,505 $2,479,597Percent of Total 5.0% 20.0% 32.1% 41.7% 90.1%
EBIT Margin [3] 8.0% 9.0% 10.0% 10.0% 10.0%Add: Sales & Marketing Expense on Existing Accounts 0.50% 0.5% 0.5% 0.5% 0.5% 0.5%Adjusted EBIT Margin 8.5% 9.5% 10.5% 10.5% 10.5%
EBIT $5,780 $27,965 $52,926 $73,028 $260,358
Less: Return on Trade Names @ 0.00% $0 $0 $0 $0 $0
Pretax Income $5,780 $27,965 $52,926 $73,028 $260,358
Provision for Income Taxes 40.0% $2,312 $11,186 $21,171 $29,211 $104,143
Net Income $3,468 $16,779 $31,756 $43,817 $156,215
Less: Return on Working Capital $340 $1,472 $2,520 $3,478 $12,398Less: Return on Fixed Assets $282 $1,222 $2,092 $2,886 $10,290Less: Return on Assembled Workforce $326 $1,413 $2,419 $3,338 $11,902
Total Return on Contributory Assets $949 $4,106 $7,032 $9,702 $34,590CAC as a % of Future Customer Revenue 1.40% 1.40% 1.40% 1.40% 1.40%
Cash Flow Attributable to the Customer Relationships $2,519 $12,673 $24,724 $34,115 $121,624
Partial Period Adjustment 0.583 1.000 1.000 1.000 1.000
Cash Flow Attributable to Customer Relationships $1,470 $12,673 $24,724 $34,115 $121,624
Discount Rate [6] 17.0%Valuation Date 5/31/2015
Years to Discount 0.583 1.583 2.583 3.583 19.583 Mid-Year Adjustment 0.5 0.5 0.5 0.5 0.5Adjusted Years to Discount 0.292 1.083 2.083 3.083 19.083
Present Value of Cash Flows $1,404 $10,691 $17,827 $21,023 $6,079
Sum of PV Cash Flows $278,033
FMV of Future Customer Relationships (rounded) $280,000
Copyright © 2015 Beacon Valuation Group LLC 24

Goodwill is the favor or prestige that a business has acquired beyond the mere value of what it sells.
Goodwill amount represents the premium that a hypothetical buyer would be willing to pay for a company, in excess of the total value of its underlying monetary, intangible, and identifiable intangible assets.
The fact that a hypothetical buyer would be willing to pay this premium suggests that the company has developed an identifiable corporate brand, and hence, goodwill with its stakeholders.
In essence, Pure Goodwill ‐ pure in a sense of not including any other accounting or non‐accounting intangible asset value ‐ is a fundamental component of Corporate Brand.
Copyright © 2015 Beacon Valuation Group LLC 25
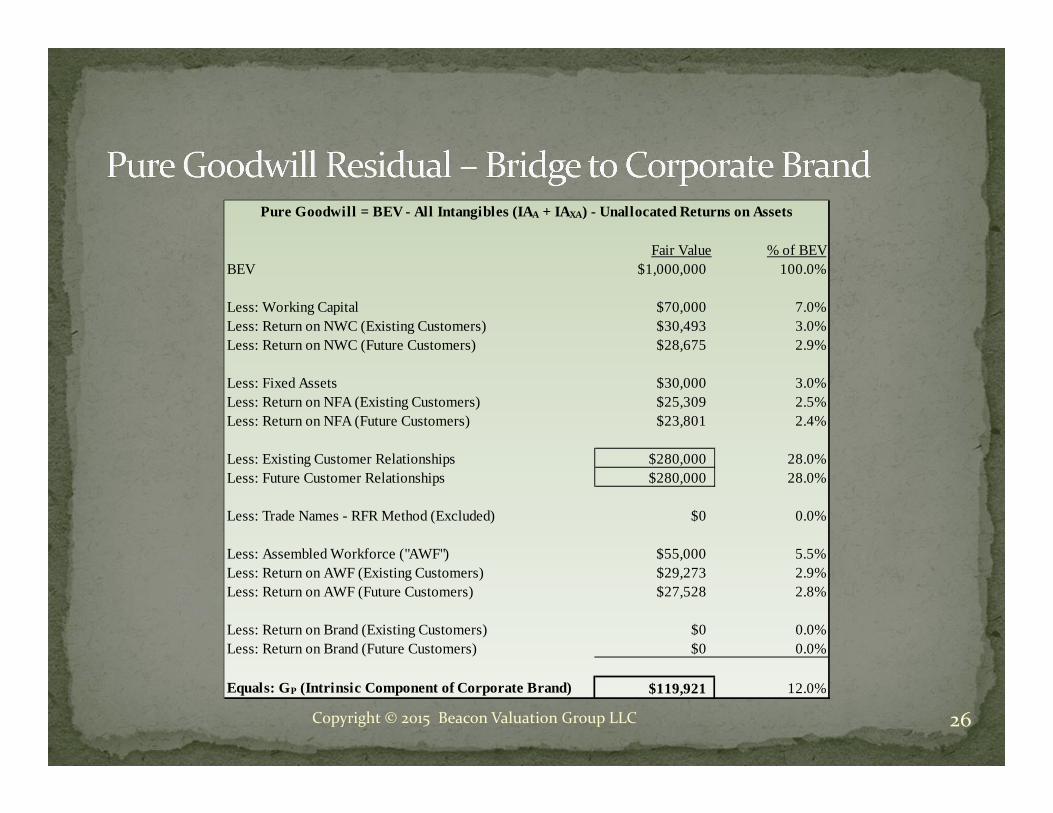
Fair Value % of BEVBEV $1,000,000 100.0%
Less: Working Capital $70,000 7.0%Less: Return on NWC (Existing Customers) $30,493 3.0%Less: Return on NWC (Future Customers) $28,675 2.9%
Less: Fixed Assets $30,000 3.0%Less: Return on NFA (Existing Customers) $25,309 2.5%Less: Return on NFA (Future Customers) $23,801 2.4%
Less: Existing Customer Relationships $280,000 28.0%Less: Future Customer Relationships $280,000 28.0%
Less: Trade Names - RFR Method (Excluded) $0 0.0%
Less: Assembled Workforce ("AWF") $55,000 5.5%Less: Return on AWF (Existing Customers) $29,273 2.9%Less: Return on AWF (Future Customers) $27,528 2.8%
Less: Return on Brand (Existing Customers) $0 0.0%Less: Return on Brand (Future Customers) $0 0.0%
Equals: GP (Intrinsic Component of Corporate Brand) $119,921 12.0%
Pure Goodwill = BEV - All Intangibles (IAA + IAXA) - Unallocated Returns on Assets
Copyright © 2015 Beacon Valuation Group LLC 26

Copyright © 2015 Beacon Valuation Group LLC 27
Company XYZTrademark / Trade Name Portfolio Valuation
Calculation of Implied Royalty Rate for Intrinsic Component of Corporate BrandRelief from Royalty Method
($000's) Forecasted period Terminal2015 2016 2017 2018 2019 2020 2021 Year
Calculation of Royalty Savings:
Total Revenues $1,360,000 $1,468,800 $1,571,616 $1,665,913 $1,749,209 $1,819,177 $1,873,752
IterateRoyalty Rate 1.10% 1.10% 1.10% 1.10% 1.10% 1.10% 1.10%Royalty Savings $14,960 $16,157 $17,288 $18,325 $19,241 $20,011 $20,611
Provision for Income Taxes $5,984 $6,463 $6,915 $7,330 $7,696 $8,004 $8,244
Net Royalty Savings $8,976 $9,694 $10,373 $10,995 $11,545 $12,007 $12,367 $12,614
Partial Period Adjustment 0.583 1.000 1.000 1.000 1.000 1.000 1.000 1.000
Net Royalty Savings (adjusted) $5,236 $9,694 $10,373 $10,995 $11,545 $12,007 $12,367 $12,614
Capitalized Value for Residual Year (CVRY) $140,155
Discount Rate 12.0%Valuation Date 05/31/15
Years to Discount 0.583 1.583 2.583 3.583 4.583 5.583 6.583 6.583Mid-Year Adjustment 0.5 0.5 0.5 0.5 0.5 0.5 0.5 0.5Adjusted Years to Discount 0.292 1.083 2.083 3.083 4.083 5.083 6.083 6.083
Present Value of Net Royalty Savings $5,066 $8,574 $8,191 $7,752 $7,268 $6,749 $6,206 $70,340
Present Value of Net Royalty Savings $49,807Present Value of CVRY $70,340
After Tax Value $120,147Solve for:
Value of Brand Component (rounded) $120,000 119,921

Copyright © 2015 Beacon Valuation Group LLC 28
Company XYZValuation of Existing Customer Relationships - IA A
Multi-Period Excess Earnings Method
($000's) 12/31/2015 12/31/2016 12/31/2017 12/31/2018 12/31/2034year 1 2 3 4 20
Total Customer Revenue (Existing & Future) $1,360,000 $1,468,800 $1,571,616 $1,665,913 $2,751,668Revenue Growth 8.0% 7.0% 6.0% 3.0%
Existing Customer Relationship Revenue $1,292,000 $1,174,428 $1,067,555 $970,408 $272,071
EBIT Margin 8.0% 9.0% 10.0% 10.0% 10.0%Add: Sales & Marketing Expense on New Accounts 1.0% 1.0% 1.0% 1.0% 1.0% 1.0%Adjusted EBIT Margin 9.0% 10.0% 11.0% 11.0% 11.0%
EBIT $116,280 $117,443 $117,431 $106,745 $29,928
Less: Return on Brand Component @ 1.10% $14,212 $12,919 $11,743 $10,674 $2,993
Pretax Income $102,068 $104,524 $105,688 $96,070 $26,935
Provision for Income Taxes 40.0% $40,827 $41,810 $42,275 $38,428 $10,774
Net Income $61,241 $62,714 $63,413 $57,642 $16,161
Less: Return on Working Capital $6,460 $5,872 $5,338 $4,852 $1,360Less: Return on Fixed Assets $5,362 $4,874 $4,430 $4,027 $1,129Less: Return on Assembled Workforce $6,202 $5,637 $5,124 $4,658 $1,306
Total Return on Contributory Assets $18,023 $16,383 $14,892 $13,537 $3,795CAC as a % of Existing Customer Revenue 1.40% 1.40% 1.40% 1.40% 1.40%
Cash Flow Attributable to the Customer Relationships $43,217 $46,331 $48,520 $44,105 $12,366
Partial Period Adjustment 0.583 1.000 1.000 1.000 1.000
Cash Flow Attributable to Customer Relationships $25,210 $46,331 $48,520 $44,105 $12,366
Discount Rate 15.0%Valuation Date 5/31/2015
Years to Discount 0.583 1.583 2.583 3.583 19.583 Mid-Year Adjustment 0.5 0.5 0.5 0.5 0.5Adjusted Years to Discount 0.292 1.083 2.083 3.083 19.083
Present Value of Cash Flows $24,203 $39,822 $36,264 $28,664 $859
Sum of PV Cash Flows $238,950
FMV of Existing Customer Relationships (rounded) $240,000

Copyright © 2015 Beacon Valuation Group LLC 29
Company XYZValuation of Future Customer Relationships - IA XA
Multi-Period Excess Earnings Method
($000's) 12/31/2015 12/31/2016 12/31/2017 12/31/2018 12/31/2034year 1 2 3 4 20
Total Customer Revenue (Existing & Future) $1,360,000 $1,468,800 $1,571,616 $1,665,913 $2,751,668Revenue Growth 8.0% 7.0% 6.0% 3.0%
Existing Customer Relationships Revenue $1,292,000 $1,174,428 $1,067,555 $970,408 $272,071Percent of Total 95.0% 80.0% 67.9% 58.3% 9.9%
Future Customer Relationships Revenue $68,000 $294,372 $504,061 $695,505 $2,479,597Percent of Total 5.0% 20.0% 32.1% 41.7% 90.1%
EBIT Margin [3] 8.0% 9.0% 10.0% 10.0% 10.0%Add: Sales & Marketing Expense on Existing Accounts 0.50% 0.5% 0.5% 0.5% 0.5% 0.5%Adjusted EBIT Margin 8.5% 9.5% 10.5% 10.5% 10.5%
EBIT $5,780 $27,965 $52,926 $73,028 $260,358
Less: Return on Brand Component @ 1.10% $748 $3,238 $5,545 $7,651 $27,276
Pretax Income $5,032 $24,727 $47,382 $65,378 $233,082
Provision for Income Taxes 40.0% $2,013 $9,891 $18,953 $26,151 $93,233
Net Income $3,019 $14,836 $28,429 $39,227 $139,849
Less: Return on Working Capital $340 $1,472 $2,520 $3,478 $12,398Less: Return on Fixed Assets $282 $1,222 $2,092 $2,886 $10,290Less: Return on Assembled Workforce $326 $1,413 $2,419 $3,338 $11,902
Total Return on Contributory Assets $949 $4,106 $7,032 $9,702 $34,590CAC as a % of Future Customer Revenue 1.40% 1.40% 1.40% 1.40% 1.40%
Cash Flow Attributable to the Customer Relationships $2,071 $10,730 $21,397 $29,524 $105,259
Partial Period Adjustment 0.583 1.000 1.000 1.000 1.000
Cash Flow Attributable to Customer Relationships $1,208 $10,730 $21,397 $29,524 $105,259
Discount Rate [6] 17.0%Valuation Date 5/31/2015
Years to Discount 0.583 1.583 2.583 3.583 19.583 Mid-Year Adjustment 0.5 0.5 0.5 0.5 0.5Adjusted Years to Discount 0.292 1.083 2.083 3.083 19.083
Present Value of Cash Flows $1,154 $9,052 $15,428 $18,195 $5,261
Sum of PV Cash Flows $240,360
FMV of Future Customer Relationships (rounded) $240,000

Fair Value % of BEVBEV $1,000,000 100.0%
Less: Working Capital $70,000 7.0%Less: Return on NWC (Existing Customers) $30,493 3.0%Less: Return on NWC (Future Customers) $28,675 2.9%
Less: Fixed Assets $30,000 3.0%Less: Return on NFA (Existing Customers) $25,309 2.5%Less: Return on NFA (Future Customers) $23,801 2.4%
Less: Existing Customer Relationships $240,000 24.0%Less: Future Customer Relationships $240,000 24.0%
Less: Trade Names - RFR Method (Excluded) $0 0.0%
Less: Assembled Workforce ("AWF") $55,000 5.5%Less: Return on AWF (Existing Customers) $29,273 2.9%Less: Return on AWF (Future Customers) $27,528 2.8%
Less: Return on Brand (Existing Customers) $67,084 6.7%Less: Return on Brand (Future Customers) $63,086 6.3%
Equals: GP (Intrinsic Component of Corporate Brand) $69,751 7.0%
Pure Goodwill = BEV - All Intangibles (IAA + IAXA) - Unallocated Returns on Assets
Copyright © 2015 Beacon Valuation Group LLC 30

Intangible Assets (IA)
IAA
IAA(Xb) TM(b)
GA
IAXA(Xb)
Rx =[ RMA + RTA +
RIA(XB) +
RB(i) ]
GP
IA = Intangible Asset Value GP = Pure Goodwill ValueIAA = Discretely Identifiable Accounting Intangible Assets RX = Returns on Assets Not Allocated to Any Specific Asset GroupIAA(Xb) = IAA, excluding Brand Value Elements RMA = Return on Monetary Contributory AssetsTM(b) = Trademark Value as Measured for Financial Reporting (Accounting) Purposes RTA = Return on Tangible Contributory AssetsGA = Accounting Goodwill Value RIA = Return on Intangible Contributory AssetsIAXA = Intangible Assets Not Measured for Financial Reporting (Accounting) Purposes RIA(Xb) = Return on Intangible Contributory Assets Other than Corporate BrandIAXA(Xb) = IAXA, excluding Brand Value Elements RB(i) = Return on Corporate Brand's Intrinsic Component
Location of Corporate Brand Value Elements
TM(b)
Copyright © 2015 Beacon Valuation Group LLC 31

B = GP + RB
($000's)
Intrinsic Component of Corporate Brand (GP) $69,751
Add: Returns on Corporate Brand from Primary Intangibles (RB)Existing Customers $67,084Future Customers $63,086Other Intangibles $0
$199,921
Equals: Corporate Brand Value $200,000
Copyright © 2015 Beacon Valuation Group LLC 32

Business Enterprise Valuation
Monetary and Tangible Asset Isolation
Accounting Intangibles (Excluding Brand)
Non‐Accounting Intangibles
(Excluding Brand)
Pure Goodwill Residual and
Implied Royalty on Brand
Revaluation of Primary Intangibles with CAC to
Brand
B = GP + RB
Residual Contribution Method
Copyright © 2015 Beacon Valuation Group LLC 33

René Hlousek, ASA-BV/IA, MRICSPresident and Managing Director
Beacon Valuation Group LLCE-mail: [email protected]
Asia-Pacific (Guam) OfficePhone: +1 671-653-5757
Fax: 671-653-5758P.O. Box 7930
Tamuning, GU 96931-7930
San Francisco (U.S.) OfficePhone: +1 415-357-1227
Fax: 415-357-1701350 Bay Street, Suite 100-366
San Francisco, CA 94133
Copyright © 2015 Beacon Valuation Group LLC 34