corp financial theory. topics covered: * capital budgeting (investing) * financing (borrowing)
TRANSCRIPT

Corp Financial Theory

Corp Financial Theory
Topics Covered:
* Capital Budgeting (investing)
* Financing (borrowing)

Corp Financial Theory
Topics Covered:
* Capital Budgeting (investing)
* Financing (borrowing)
Today:
Revisit Financing
Debt Financing, Risk & Interest Rates
Debt & Interest Rates
Classical Theory of Interest Rates (Economics)
• developed by Irving Fisher

Debt & Interest Rates
Classical Theory of Interest Rates (Economics)
• developed by Irving Fisher
Nominal Interest Rate = The rate you actually pay when you borrow money

Debt & Interest Rates
Classical Theory of Interest Rates (Economics)
• developed by Irving Fisher
Nominal Interest Rate = The rate you actually pay when you borrow money
Real Interest Rate = The theoretical rate you pay when you borrow money, as determined by supply and demand
Supply
Demand
$ Qty
r
Real r

Debt & Interest Rates
Nominal r = Real r + expected inflation
Real r is theoretically somewhat stable
Inflation is a large variable
Q: Why do we care?
A: This theory allows us to understand the Term Structure of Interest Rates.
Q: So What?
A: The Term Structure tells us the cost of debt.

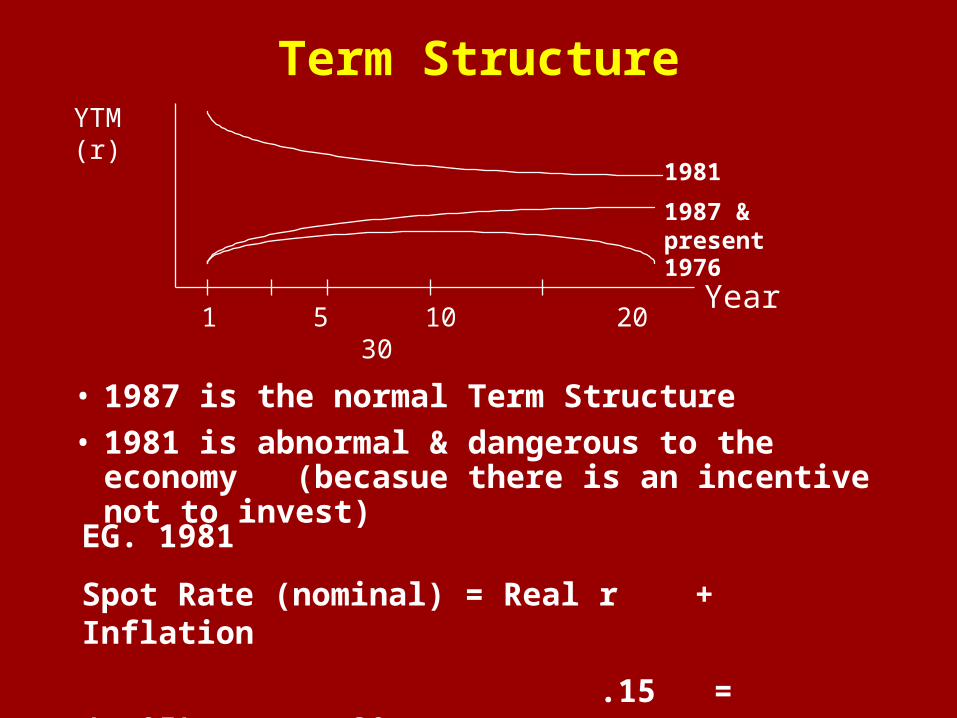
Term Structure
Spot Rate - The actual interest rate today (t=0)
Forward Rate - The interest rate, fixed today, on a loan made in the future at a fixed time.
Future Rate - The spot rate that is expected in the future
Yield To Maturity (YTM) - The IRR on an interest bearing instrument
YTM (r)
Year
1981
1987 & present
1976
1 5 10 20 30

Term Structure
• 1987 is the normal Term Structure
• 1981 is abnormal & dangerous to the economy (becasue there is an incentive not to invest)
YTM (r)
Year
1981
1987 & present
1976
1 5 10 20 30

Term Structure
• 1987 is the normal Term Structure
• 1981 is abnormal & dangerous to the economy (becasue there is an incentive not to invest)
YTM (r)
Year
1981
1987 & present
1976
1 5 10 20 30
EG. 1981
Spot Rate (nominal) = Real r + Inflation
.15 = (-.05) + .20
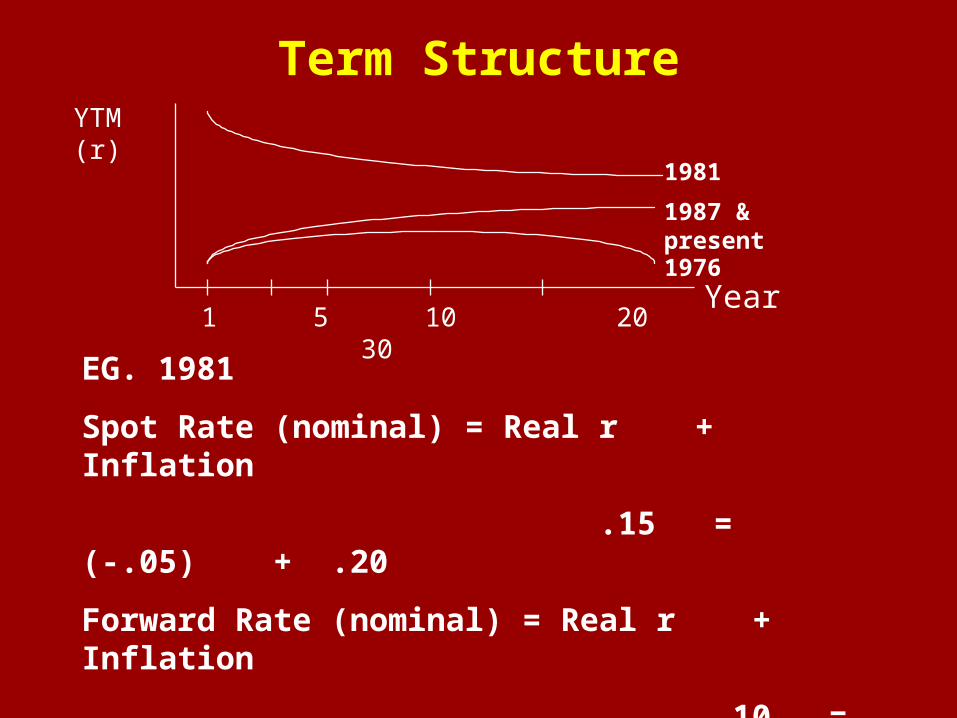
Term Structure
• 1987 is the normal Term Structure
• 1981 is abnormal & dangerous to the economy (becasue there is an incentive not to invest)
YTM (r)
Year
1981
1987 & present
1976
1 5 10 20 30
EG. 1981
Spot Rate (nominal) = Real r + Inflation
.15 = (-.05) + .20

Term StructureYTM (r)
Year
1981
1987 & present
1976
1 5 10 20 30
EG. 1981
Spot Rate (nominal) = Real r + Inflation
.15 = (-.05) + .20

Term StructureYTM (r)
Year
1981
1987 & present
1976
1 5 10 20 30
EG. 1981
Spot Rate (nominal) = Real r + Inflation
.15 = (-.05) + .20
Forward Rate (nominal) = Real r + Inflation
.10 = .01 + .09
Term StructureYTM (r)
Year
1981
1987 & present
1976
1 5 10 20 30
EG. 1981
Spot Rate (nominal) = Real r + Inflation
.15 = (-.05) + .20
Forward Rate (nominal) = Real r + Inflation
.10 = .01 + .09
The economy feels that the future looks much better than the present.

Term Structure
What Determines the Shape of the TS?
1 - Unbiased Expectations Theory
2 - Liquidity Premium Theory
3 - Market Segmentation Hypothesis
Term Structure & Capital Budgeting
• CF should be discounted using Term Structure info
• Since the spot rate incorporates all forward rates, then you should use the spot rate that equals the term of your project.
• If you believe inother theories take advantage of the arbitrage.

Yield To Maturity
• All interest bearing instruments are priced to fit the term structure
• This is accomplished by modifying the asset price
• The modified price creates a New Yield, which fits the Term Structure
• The new yield is called the Yield To Maturity (YTM)
Yield to Maturity
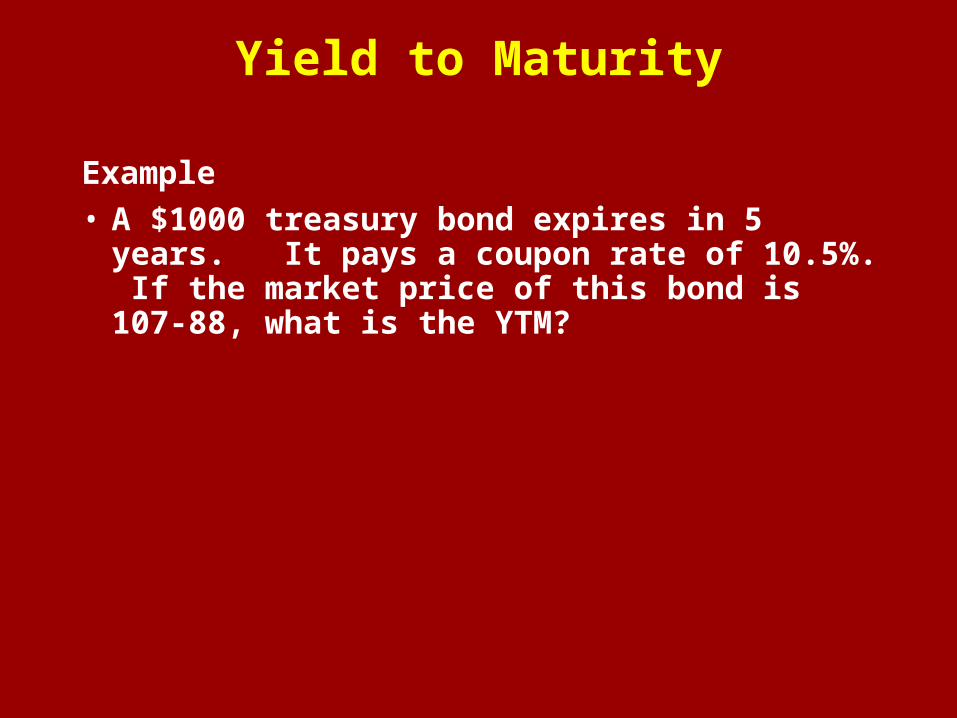
Example
• A $1000 treasury bond expires in 5 years. It pays a coupon rate of 10.5%. If the market price of this bond is 107-88, what is the YTM?

Yield to Maturity
Example
• A $1000 treasury bond expires in 5 years. It pays a coupon rate of 10.5%. If the market price of this bond is 107-88, what is the YTM?
C0 C1 C2 C3 C4 C5
-1078.80 105 105 105 105 1105
Calculate IRR = 8.5%

Debt & Risk
If you have two bonds, both providing a YTM of 8.5%, do you care which one you would prefer to buy?
What additional information do you need to make your decision?
Why do you need this information?
• Duration is the tool that tells us the difference in risk between two different bonds.

Debt & Risk
Example (Bond 1)
Calculate the duration of our 10.5% bond @ 8.5% YTM
Year CF PV@YTM % of Total PV % x Year

Debt & Risk
Example (Bond 1)
Calculate the duration of our 10.5% bond @ 8.5% YTM
Year CF PV@YTM % of Total PV % x Year
1 105
2 105
3 105
4 105
5 1105

Debt & Risk
Example (Bond 1)
Calculate the duration of our 10.5% bond @ 8.5% YTM
Year CF PV@YTM % of Total PV % x Year
1 105 96.77
2 105 89.19
3 105 82.21
4 105 75.77
5 1105 734.88
1078.82

Debt & Risk
Example (Bond 1)
Calculate the duration of our 10.5% bond @ 8.5% YTM
Year CF PV@YTM % of Total PV % x Year
1 105 96.77 .090
2 105 89.19 .083
3 105 82.21 .076
4 105 75.77 .070
5 1105 734.88 .681
1078.82 1.00

Debt & Risk
Example (Bond 1)
Calculate the duration of our 10.5% bond @ 8.5% YTM
Year CF PV@YTM % of Total PV % x Year
1 105 96.77 .090 0.090
2 105 89.19 .083 0.164
3 105 82.21 .076 0.227
4 105 75.77 .070 0.279
5 1105 734.88 .681 3.406
1078.82 1.00 4.166 Duration
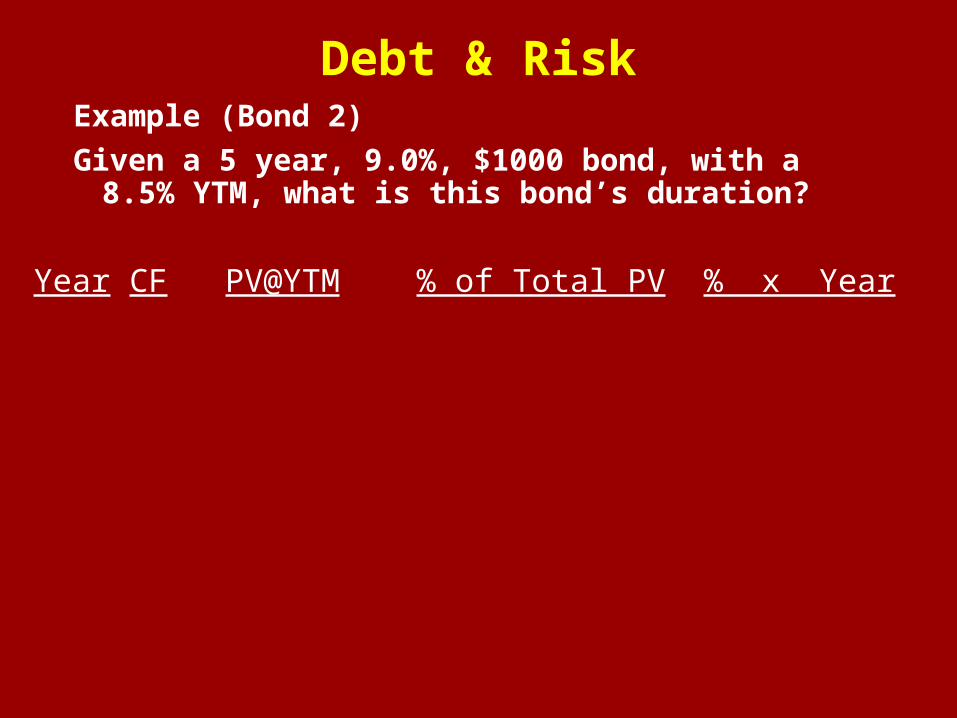
Debt & RiskExample (Bond 2)
Given a 5 year, 9.0%, $1000 bond, with a 8.5% YTM, what is this bond’s duration?
Year CF PV@YTM % of Total PV % x Year

Debt & RiskExample (Bond 2)
Given a 5 year, 9.0%, $1000 bond, with a 8.5% YTM, what is this bond’s duration?
Year CF PV@YTM % of Total PV % x Year
1 90
2 90
3 90
4 90
5 1090

Debt & RiskExample (Bond 2)
Given a 5 year, 9.0%, $1000 bond, with a 8.5% YTM, what is this bond’s duration?
Year CF PV@YTM % of Total PV % x Year
1 90 82.95
2 90 76.45
3 90 70.46
4 90 64.94
5 1090 724.90
1019.70

Debt & RiskExample (Bond 2)
Given a 5 year, 9.0%, $1000 bond, with a 8.5% YTM, what is this bond’s duration?
Year CF PV@YTM % of Total PV % x Year
1 90 82.95 .081
2 90 76.45 .075
3 90 70.46 .069
4 90 64.94 .064
5 1090 724.90 .711
1019.70 1.00

Debt & RiskExample (Bond 2)
Given a 5 year, 9.0%, $1000 bond, with a 8.5% YTM, what is this bond’s duration?
Year CF PV@YTM % of Total PV % x Year
1 90 82.95 .081 0.081
2 90 76.45 .075 0.150
3 90 70.46 .069 0.207
4 90 64.94 .064 0.256
5 1090 724.90 .711 3.555
1019.70 1.00 4.249 Duration

Debt & Risk
Using the two previous examples, which bond whould you buy and why?

Debt & RiskExample (Bond 3)
Given a 5 year, 9.0%, $1000 bond, with a 8.75% YTM, what is this bond’s duration?
Year CF PV@YTM % of Total PV % x Year

Debt & RiskExample (Bond 3)
Given a 5 year, 9.0%, $1000 bond, with a 8.75% YTM, what is this bond’s duration?
Year CF PV@YTM % of Total PV % x Year
1 90 82.76 .082 0.082
2 90 76.10 .075 0.150
3 90 69.98 .069 0.207
4 90 64.35 .064 0.256
5 1090 716.61 .710 3.550
1009.80 1.00 4.245 Duration
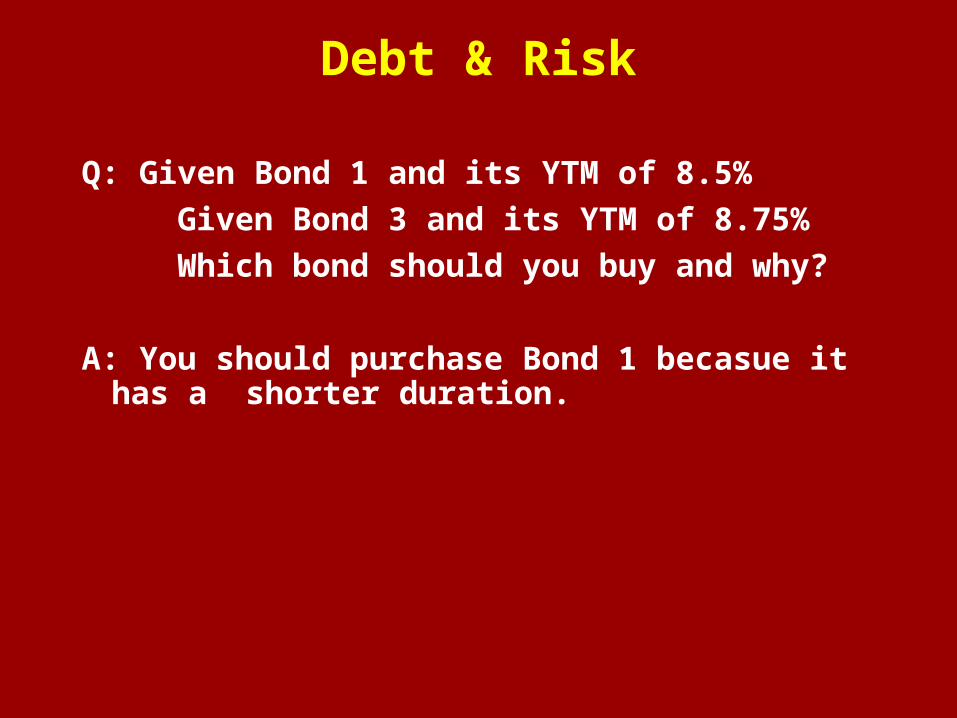
Debt & Risk
Q: Given Bond 1 and its YTM of 8.5%
Given Bond 3 and its YTM of 8.75%
Which bond should you buy and why?
A: You should purchase Bond 1 becasue it has a shorter duration.

Valuing Risky Bonds
The risk of default changes the price of a bond and the YTM.
Example
We have a 5% 1 year bond. The bond is priced at par of $1000. But, there is a 20% chance the company will go into bankruptcy and only pay $500. What is the bond’s value?
A:

Valuing Risky Bonds
Example
We have a 5% 1 year bond. The bond is priced at par of $1000. But, there is a 20% chance the company will go into bankruptcy and only pay $500. What is the bond’s value?
A: Bond Value Prob
1,500 .80 = 840.00
500 .20 = 100.00 .
940.00 = expected CF
%3.171895
1050
895$05.1
940
YTM
Value

Valuing Risky Bonds
Example – Continued
Conversely - If on top of default risk, investors require an additional 3 percent market risk premium, the price and YTM is as follows:
%7.20100.870
1050
00.870$08.1
940
YTM
Value

Key to Bond Ratings
Moody's S&P's & Fitch
Investment GradeAaa AAAAa AA A A
Baa BBBJunk Bonds
Ba BB B B
Caa CCCCa CC C C
The highest quality bonds are rated triple-A.
Investment grade bonds have to be equivalent of
Baa or higher. Bonds that don’t make this cut are called “high-yield” or
“junk” bonds.