coronary heart disease knowledge, health promoting
TRANSCRIPT

CORONARY HEART DISEASE KNOWLEDGE, HEALTH PROMOTING
BEHAVIORS AND PERCEIVED BENEFITS AND BARRIERS
TO EXERCISE AND HEALTHY EATING
IN MONTANA FEMALES
by
Sadie Ann Schwenk Baldwin
A thesis submitted in partial fulfillment of the requirements for the degree
Master
of
Nursing
MONTANA STATE UNIVERSITY Bozeman, Montana
February 2014
©COPYRIGHT
by
Sadie Ann Schwenk Baldwin
2014
All Rights Reserved
ii
ACKNOWLEDGEMENTS
I would like to thank my husband for his continuous support and editorial skills
throughout this thesis process. I never would have accomplished this without his
encouragement and feedback.
I would also like to thank my thesis chair, Dr. Dale Mayer, for her support,
guidance, and expertise throughout this process. A sincere thanks also goes out to my
committee members, Dr. Charlene Winters and Gordon Opel, who so willingly and
generously have offered their expert guidance and feedback.
Community organizations also played an important role in this project. Kalispell
Regional Medical Center medical librarian, Heidi Sue Adams, was also instrumental in
assisting with my literature review and survey development, I would have been lost
without her.
Lastly, I would like to thank all my friends and family who have tolerated my
work and school schedules over the last three years and generously offered time and
criticism pertaining to my thesis. This thesis work is truly a collaboration of family,
friends, and community. Thanks!
iii
TABLE OF CONTENTS 1. INTRODUCTION ......................................................................................................... 1
Purpose and Questions .................................................................................................. 3 Significance ................................................................................................................... 4 Theoretical Framework ................................................................................................. 6 Definitions ..................................................................................................................... 7
2. REVIEW OF THE LITERATURE ............................................................................. 10
Epidemiology of Cardiovascular Disease ................................................................... 10 Pathophysiology of Cardiovascular Disease ............................................................... 10 Cardiovascular Disease Risk Factors .......................................................................... 12 Rurality and Coronary Heart Disease Risk ................................................................. 13 Cardiovascular Health Promotion ............................................................................... 15 Women and Coronary Heart Disease .......................................................................... 16 The Health Promotion Model ..................................................................................... 19 Coronary Heart Disease Knowledge ........................................................................... 21 Perceived Benefits and Barriers to Exercise and Healthy Eating ............................... 23 Summary ..................................................................................................................... 26
3. METHODOLOGY ...................................................................................................... 28
Study Design ............................................................................................................... 28 Population and Sample ............................................................................................... 28 Instruments .................................................................................................................. 29 Procedure for Data Collection .................................................................................... 31 Human Subjects Consideration ................................................................................... 33 Statistical Analysis ...................................................................................................... 33
4. RESULTS .................................................................................................................... 34
Sample Demographics ................................................................................................ 34 Responses to Health-Related Questions ..................................................................... 37 Coronary Heart Disease Knowledge ........................................................................... 38 Health Promoting Behaviors ....................................................................................... 41 Perceived Benefits and Barriers of Exercise .............................................................. 43 Perceived Benefits and Barriers of Healthy Eating .................................................... 46

iv
TABLE OF CONTENTS – CONTINUED
5. DISCUSSION .............................................................................................................. 48
Sample Demographics ................................................................................................ 49 Health-Related Questions ........................................................................................... 50 Coronary Heart Disease Knowledge ........................................................................... 51 Health Promoting Behaviors ....................................................................................... 52 Perceived Benefits and Barriers of Exercise .............................................................. 54 Perceived Benefits and Barriers of Healthy Eating .................................................... 55 Study Limitations ........................................................................................................ 56 Implications for further Research ............................................................................... 58 Implications for Practice ............................................................................................. 59 Conclusion .................................................................................................................. 60
REFERENCES CITED ..................................................................................................... 62 APPENDICES .................................................................................................................. 71
APPENDIX A: Coronary Heart Disease Knowledge Test for Women ................ 72 APPENDIX B: Health Promoting Lifestyle Profile II .......................................... 78 APPENDIX C: Exercise Benefits/Barriers Scale ................................................. 81 APPENDIX D: Healthy Eating Benefits and Barriers Scale ................................ 84 APPENDIX E: Demographic Data and Health-Related Questions ...................... 88 APPENDIX F: Information for Clinic Staff ......................................................... 92 APPENDIX G: Participant Explanation Letter ..................................................... 94 APPENDIX H: Research Participant Eligibility Checklist .................................. 96
v
LIST OF TABLES
Table Page
1. Clinics and Number of Participants .................................................................. 34
2. Participant Characteristics ................................................................................ 35 3. Reported Population of Town ........................................................................... 36
4. Health-Related Questions ................................................................................. 37 5. CHD Knowledge Test for Women with Answers ............................................ 39
6. HPLP II Items by Subscale with MIS ............................................................... 41 7. Exercise Benefits/Barriers Scale Items with MIS ............................................. 44
8. Healthy Eating Benefits and Barriers Scale Items with MIS ............................ 47
vi
LIST OF FIGURES
Figure Page
1. The Health Promotion Model with Highlighted
Constructs of the Study .................................................................................... 21 2. Reported Healthcare Insurance Coverage by Clinic ......................................... 38
vii
LIST OF ABBREVIATIONS
AHA: American Heart Association
BMI: Body Mass Index
BRFSS: Behavioral Risk Factor Surveillance System
CHD: Coronary Heart Disease
CDC: Centers for Disease Control
CVD: Atherosclerotic Cardiovascular Disease
EBBS: Exercise Benefits/Barriers Scale
EPA: Environmental Protection Agency
ERS: Economic Research Service
HEBBS: Healthy Eating Benefits and Barriers Scale
HPB: Health Promoting Behavior
HPM: Health Promotion Model
IRB: Institutional Review Board
HTN: Hypertension
MDPHHS: Montana Department of Public Health and Human Services
MIS: Mean Item Score
NHLBI: National Heart Lung and Blood Institute
NIA: National Institute on Aging
OMB: Office of Management and Budget
US: United States
USDA: United States Department of Agriculture

viii
LIST OF ABBREVIATIONS - CONTINUED
USDHHS: United States Department of Health and Human Services
WHO: World Health Organization

ix
ABSTRACT
The purpose of this study was to gain an understanding of rural women’s knowledge of coronary heart disease risk factors, current health promoting behaviors, and perceived barriers and benefits to health promoting behaviors. The research questions posed were: What is the coronary heart disease knowldge of women living in rural areas; are women in a rural western state engaged in health promoting behaviors; and what benefits and barriers to health promoting behaviors do rural women perceive related to diet and exercise? The Health Promotion Model served as the guiding framework for this study. This descriptive study utilized a non-random convenience sample of women living in non-metropolitan or non-core counties in Northwest Montana seeking healthcare at one of four designated clinics. Inclusion criteria included female gender, age 21-55 years olds, premenopausal status, ability to read and write English, and residence within a designated non-metropolitan county. The following instruments were used to collect data: Coronary Heart Disease Knowledge Tool for Women, Health Promoting Lifestyle Profile II, Exercise Benefits/Barriers Scale, and Healthy Eating Benefits and Barriers Scale. The sample (n = 25) population was predominantly white and non-Hispanic. The average Coronary Heart Disease Knowledge Test for Women score was 71% with a range of scores from 40%-80%. Health promoting behaviors were ranked in the following order from most to least practiced: interpersonal relations, spiritual growth, nutrition, stress management, physical activity, and health responsibility. The sample perceived moderately high benefits to exercise and healthy eating and moderately low barriers to exercise and healthy eating. Findings from this study support a need for healthcare providers to discuss heart disease risk factors with their premenopausal clients and to encourage participation in health promoting behaviors, especially those ranked lowest, physical activity and health responsibility. Research is needed with a larger population to better understand the relationship between heart disease knowledge, health promoting behaviors, and perceived barriers and benefits to healthy eating and exercise in rural dwelling women.

1
CHAPTER 1
INTRODUCTION
Atherosclerotic cardiovascular disease (CVD) has a significant impact on
women’s lives and the healthcare system. Coronary heart disease (CHD) and stroke, two
forms of CVD, are the first and third causes, respectively, of mortality in the United
States (US) (Centers for Disease Control and Prevention [CDC], 2010). Among women,
CVD claims more lives than cancer, chronic lower respiratory disease, Alzheimer’s
disease, and accidents combined (Roger, Go, Lloyd-Jones, Benjamin, Berry, Borden, …,
& Turner, 2011b).
The financial burden for treatment of CVD is immense and totaled $444 billion in
2010, accounting for $1 of every $6 spent on healthcare (CDC, 2010). Eighty-three
million adult Americans are living with at least one type of CVD (CDC, 2010.) Montana
is no exception to the impact of CVD where it is the leading cause of death and a major
cause of chronic disease and disability (American Heart Association [AHA], 2009).
Certain risk factors for CVD are non-modifiable, including age, gender, and
family history. However, many factors are modifiable. Risk of heart attack and stroke
are reduced by as much as 80% with proper control of hypertension (HTN), weight,
cholesterol, and smoking status (US Department of Health and Human Services
[USDHHS], Health Resources and Services Administration, Maternal and Child Health
Bureau, 2010). Modifiable risk factors of CVD also include sedentary lifestyle,
unhealthy diet, harmful use of alcohol, obesity, diabetes, and stress (Mendis, Puska, &

2
Norrving, 2011; Mosca, Banka, Benjamin, Berra, Bushnell, Rowena, ..., &Wenger, 2007;
Wong, Black, & Gadin, 2005). The longest running research of essential HTN and
coronary artery disease in biracial children, the Bogalusa Heart Study, has found
cardiovascular changes as early as 8 years of age (Tulane University School of Medicine,
2011) supporting the importance of proper health promotion and preventive health
education at early ages.
People living in rural areas are a vulnerable sub-group to stroke and heart disease
(Gamm, Hutchinson, Dabney, & Dorsey, 2003). This comes as no surprise as major
health issues in rural areas include tobacco use, diabetes, obesity and access to healthcare
providers and healthcare services (Gamm et al., 2003) – topics directly related to the
development and management of CVD. Public health programs and primary care
providers would benefit from increased understanding of local residents’ CVD risk
factors and how to maximize their health promoting behaviors (HPBs) to combat the
burden of CVD.
Healthy eating, adequate exercise, and avoidance of smoking are the focus of
HPBs to prevent and treat CVD (Mosca et. al., 2007). Significant positive effects on
aging may be seen with earlier adoption of healthy behaviors. In a recent AHA update on
CVD statistics, the authors state,
(…), a number of studies have defined potential beneficial effects of healthy lifestyle factors and lower CVD risk factor burden on CVD outcomes and longevity. These studies suggest that prevention of risk factor development at younger ages may be the key to “successful aging” (Roger, Go, Lloyd-Jones, Adams, Berry, Brown, …Wylie-Rosett, 2011a, p. 40).
3
The decision to participate in HPBs is a complex process influenced by various internal
and external cues. Research has shown that knowledge of CVD, prior HPBs, and
perceived benefits and barriers of HPBs are some variables that influence the decision to
participate in health promoting activities (Mosca, Mochari, Christian, Berra, Taubert,
Mills, … & Simpson, 2006; Walker, Noble, Hertzog, Boeckner, & Hageman, 2006;
Pender, 1996).
There is growing literature and research pertaining to rural people and their HPBs
and CVD risk factor knowledge (Mosca, Ferris, Fabunmi, & Robertson, 2004; Crouch &
Wilson, 2010). However, little literature pertains to rural women and their knowledge of
CHD, current health behaviors, and perceived benefits and barriers to HPBs. Women are
frequently the primary care givers for children and influence a family’s health practices
through food choices, meal preparation, and participation in exercise. Many women are
also unaware of their personal risk of CVD (Mosca et al., 2004). These factors make
rural women an important population to focus on in the fight against CVD.
Purpose & Questions
The aims of this study are to gain an understanding of rural women’s knowledge
of CHD risk factors, current HPBs, and perceived barriers and benefits to HPBs. The
research questions are:
a) What is the CHD knowledge of women living in rural areas?
b) Are women in a rural Western state engaged in HPBs?

4
c) What benefits and barriers to HPBs do rural women perceive related to diet and
exercise?
Significance
Although many women may not perceive themselves at risk for heart disease,
CVD is the leading cause of death in women in the US, accounting for 1 out of every 4
female deaths (Kochanek, Xu, Murphy, Miniño, & Kung, 2011). A woman’s risk of
CVD significantly increases after menopause (McCance, Huether, Brashers, & Rote,
2010; National Heart Blood & Lung Institute [NHLBI], 2011b). In Montana, heart
disease is the second leading cause of death in women (AHA, 2009). Cardiovascular
disease risk factors of diabetes, high blood pressure, and obesity are also on the rise
Montana (Montana Department of Public Health and Human Services [MDPHHS] &
Montana Cardiovascular Health Program, 2007).
Despite CVD being the leading cause of female mortality, women specific issues,
like menopause and breast cancer, have historically dominated the focus of women’s
health (Oliver-McNeil & Artinian, 2002). Women continue to be under represented in
heart-related studies (Hsia, 2007) and report inadequate knowledge of CHD, awareness
of personal risk factors and implementation of healthy lifestyles (Collins, Dantico,
Shearer, & Mossman, 2004; Crouch & Wilson, 2011; Mosca et al., 2004). Knowledge of
CHD risk factors and perceived benefits and barriers to healthy lifestyle behaviors
reportedly influence women’s implementation of heart-healthy actions (Mosca et al.,
2006; Pender, Murdaugh, & Parsons, 2006).

5
In the US, health promotion services are directed towards individuals, families,
and communities to maximize their health potential (Pender, Murdaugh, & Parsons,
2011). Health promotion and primary prevention are beneficial in improving quality of
life and longevity (Pender et al., 2011). Unlike secondary prevention, which focuses on
disease detection and treatment, or tertiary prevention, that focuses on the long-term
management of chronic disease or illness, health promotion and primary prevention
emphasize wellness and disease prevention through healthy lifestyles before the onset of
disease (CDC, 2007; Pender et al. 2011).
Rural-living women that fully comprehend the risk factors of CVD and
implement the HPBs that minimize CVD risk factors through health promotion could
significantly reduce their risk of CVD. Living in rural areas poses certain challenges to
receiving and accessing adequate healthcare and goods that facilitate health promotion
(Committee on The Future of Rural Health Care, 2005). Acute care and emergency
treatments to manage and treat the acute events of CVD, such as heart attack and stroke,
are not always available in sparsely populated areas (Committee on The Future of Rural
Health Care, 2005). The evidence that menopause increases a woman’s risk of CVD
(McCance et al., 2010) and that CVD can develop early in life due to unhealthy lifestyles
(Tulane University School of Medicine, 2011) support continued research in
premenopausal rural women. Identifying CHD knowledge, HPBs and perceived barriers
and benefits to HPBs may aide in directing future health promotion interventions for rural
women.
6
Theoretical Framework
The guiding framework to support the aims of this study is the Health Promotion
Model (HPM) (Pender et al., 2006). As epidemiological evidence continues to grow, it is
evident that managing modifiable CVD risk factors through HPBs from a young age is
beneficial in reducing CVD (USDHHS, NHLBI, 2012). Health promotion is central to
prevention and management of CHD.
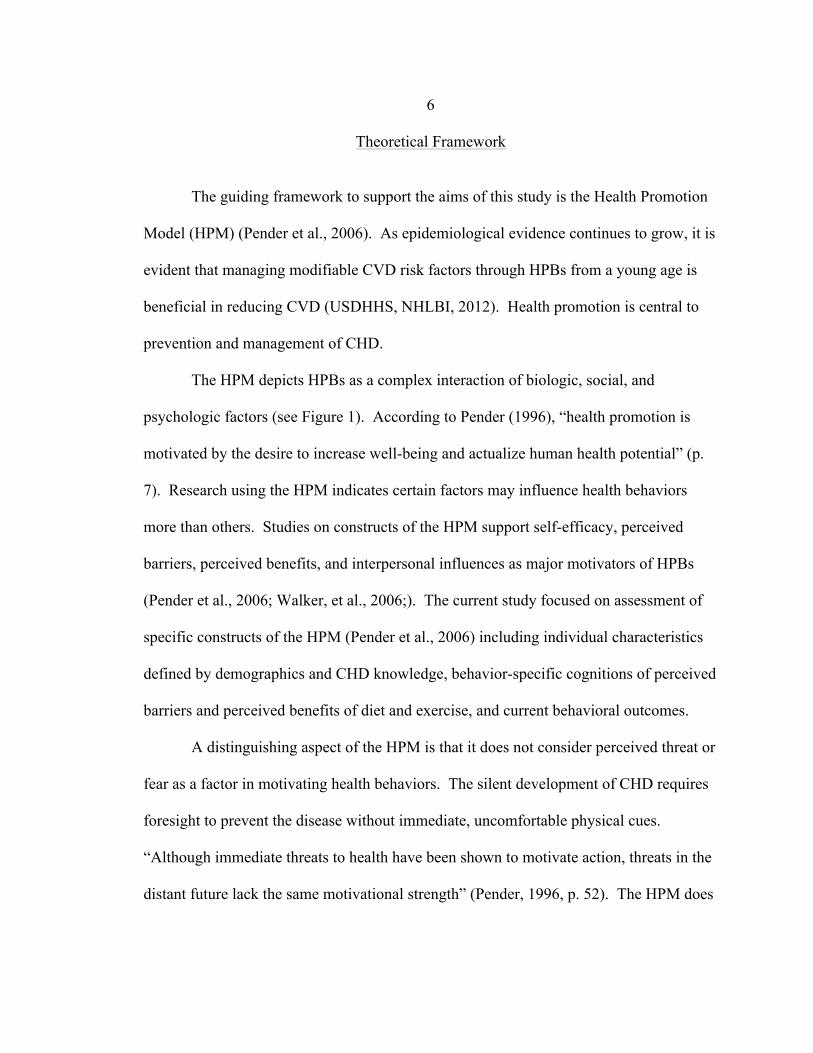
The HPM depicts HPBs as a complex interaction of biologic, social, and
psychologic factors (see Figure 1). According to Pender (1996), “health promotion is
motivated by the desire to increase well-being and actualize human health potential” (p.
7). Research using the HPM indicates certain factors may influence health behaviors
more than others. Studies on constructs of the HPM support self-efficacy, perceived
barriers, perceived benefits, and interpersonal influences as major motivators of HPBs
(Pender et al., 2006; Walker, et al., 2006;). The current study focused on assessment of
specific constructs of the HPM (Pender et al., 2006) including individual characteristics
defined by demographics and CHD knowledge, behavior-specific cognitions of perceived
barriers and perceived benefits of diet and exercise, and current behavioral outcomes.
A distinguishing aspect of the HPM is that it does not consider perceived threat or
fear as a factor in motivating health behaviors. The silent development of CHD requires
foresight to prevent the disease without immediate, uncomfortable physical cues.
“Although immediate threats to health have been shown to motivate action, threats in the
distant future lack the same motivational strength” (Pender, 1996, p. 52). The HPM does

7
not utilize threats as a variable, making it a suitable framework for this purpose of this
study.
Nurses are on the front lines of health promotion and health education for persons
of all ages. Advanced practice nurses in primary care play an important role in health
promotion, disease prevention, and health management, especially in rural areas where
they may be the sole healthcare provider for a large geographic area (Hegney, McCarthy,
Rogers-Clark, & Gorman, 2002). Understanding rural women’s knowledge of CHD,
HPBs, and perceived benefits and barriers to HPBs can aide rural practitioners in their
pursuit to best serve this population in adopting and maintaining healthy lifestyles.
Definitions
1. Frontier: Frontier is a U.S. Census Bureau classification for an area based on
population density and is defined as 6 or fewer people per square mile (USDHHS,
2008).
2. Health. Health is a state of complete physical, mental, and social well-being and
not merely the absence of disease or infirmity (World Health Organization
[WHO], 1998).
3. Health Promotion: the behaviors or actions which contribute to health (Pender et
al., 2011).
4. Health-Promoting Behavior. “A health-promoting behavior is an end point or
action outcome directed toward attaining positive health outcomes such as
8
optimal well being, personal fulfillment, and productive living” (Sakraida, 2006,
p. 457).
5. Metropolitan County. Metropolitan is a designation made by the Office of
Management and Budget (OMB) that indicates 1) a county contains one or more
urbanized areas of 50,000 plus people and 2) established commuting ties with
outlying counties that are economically tied to the urbanized county measured by
percent of workers that commute (OMB Bulletin No. 09-01, 2008; US
Department of Agriculture [USDA]: Economic Research Service [ERS], 2007).
6. Micropolitan/Non-metropolitan County: Micropolitan or Non-metropolitan is a
designation made by the OMB that indicates a geographic area has one or more
urban clusters of 10,000 people, but less than 50,000 people (OMB, 2008; USDA:
ERS, 2007).
7. Non-core County: Non-core counties are designated by the OMB as counties that
do not meet the metropolitan or non-metropolitan classifications based on urban
population clusters (OMB, 2008; USDA: ERS, 2007).
8. Perceived Barriers: Perceived barriers are defined as factors which decrease the
likelihood of participating in a certain action (Pender, 1996).
9. Perceived Benefits: Perceived benefits are defined as the anticipated favorable
outcomes of an action (Pender, 1996).
10. Primary Prevention: the behaviors or actions to avoid or stall the progression or
development of disease or illness (Pender et al., 2011).

9
11. Rural: in this research, rural is defined as living in a non-metropolitan or non-
core county (OMB, 2008; USDA: ERS, 2007).
12. Urban Areas: The US Census Bureau identifies urban areas as clusters of people
of at least 50,000 in population. Generally, the core population density is at least
1,000 persons per square mile and surrounding territory has at least 500 persons
per square mile (USDA: ERS, 2007).

10
CHAPTER 2
REVIEW OF THE LITERATURE
A review of the literature is presented with a focus on the pathophysiology,
epidemiology, risk factors, and recommendations for preventing atherosclerotic CVD,
which may manifest as CHD. Research pertaining to CHD knowledge, HPBs and
perceived barriers and benefits of HPBs will be discussed in the context of the HPM
(Pender et al., 2006). An emphasis on women and rural people and their unique
characteristics related to CVD are discussed.
Epidemiology of Cardiovascular Diseases
Cardiovascular disease is a global health issue. Worldwide, CVDs are the leading
cause of death in males and females with CHD and stroke accounting for the majority of
CVD deaths (Mendis et al., 2011). The overall mortality rate for CVD in the US in 2008
was 244.8 per 100,000. The average life expectancy in the US is 77.9 years old and 33%
of the CVD related deaths occur in people under the age of 75 years. Coronary heart
disease accounts for 1 out of every 6 deaths in the U.S. adult population (Roger et al.,
2011b).
Pathophysiology of Cardiovascular Disease
The term cardiovascular disease refers to many types of diseases that affect the
vascular system. Cardiovascular diseases can be broken down into two major categories,

11
atherosclerotic CVD and other CVDs. Atherosclerotic cardiovascular diseases include
CHD, cerebrovascular disease (stroke), peripheral vascular disease, and HTN (Mendis et
al., 2011).
Atherosclerosis is a silent, pathologic process that can result in ischemic
syndromes in various parts of the vascular system. The term atherosclerosis is derived
from the Greek terms atheros, which translates to “paste” or “gruel,” and sclerosis, which
means “hardness” (Porth, 2004). Atherosclerosis causes stiffening and narrowing of
arteries (Porth, 2004) that is thought to be initiated by an inflammatory process that
creates endothelial dysfunction in the lining of the arteries (McCance et al., 2010).
Endothelial dysfunction leads to deposits of fat, cholesterol, calcium, and other
substances in the lining of arteries (Hankinson, Colditz, Manson, & Speizer, 2001;
McCance et al., 2010; NHLBI, 2011a). These deposits of fats, cholesterol, and calcium
form fatty streaks that can progress to fibrotic plaques (McCance et al., 2010). Plaques
can rupture and cause blood clot formation or vessel occlusion, altering oxygen-rich
blood flow and causing ischemia (Porth, 2004). Manifestations of ischemia are highly
variable (McCance et al., 2010). Depending on the site and extent of ischemia, medical
emergencies such as strokes and heart attacks may ensue (Mendis et al., 2011; Porth,
2004). Fortunately, atherosclerosis is reversible to a certain degree and can be stopped
from progressing through control of modifiable risk factors (Hankinson et al., 2001).

12
Cardiovascular Disease Risk Factors
Epidemiologic studies have found strong correlations between certain physiologic
characteristics, lifestyle behaviors, and the development of CVD (Framingham Heart
Study, 2011; The Nurses’ Health Study (n.d.); Roger et al., 2011b). These characteristics
and behaviors have been coined “risk factors.” A risk factor is defined as,
an aspect of personal behavior or lifestyle, an environmental exposure, or an inborn or inherited characteristic that, on the basis of scientific evidence, is known to be associated with meaningful health-related condition(s) (Porta, 2008, p. 218).
Some CVD factors are non-modifiable and some or modifiable.
Non-modifiable risk factors include advanced age, male gender, menopause, and
family history. Aging is associated with a decrease in endothelium repair and increase in
vulnerability to endothelial injury that can lead to atherosclerosis. Genetics and shared
environmental exposures and lifestyles contribute to the familial impact on
atherosclerosis (Hankinson et al., 2001; McCance et al., 2010).
Modifiable risk factors are factors that we can alter by intervention and
consequently reduce the probability of occurrence of disease (Porta, 2008). Modifiable
CVD risk factors include cigarette smoking, physical inactivity, unhealthy diet, harmful
use of alcohol, obesity, HTN, dyslipidemia, diabetes, and stress (AHA, 2011a; Mendis et
al., 2011; Mosca et al., 2007; Wong et al., 2005). Cigarette smoking, physical inactivity,
unhealthy diet, and harmful use of alcohol are estimated to be responsible for about 80%
of CHD and stroke cases worldwide (WHO, 2012b). Hypertension, dyslipidemia,
diabetes or elevated blood sugars, and obesity are often manifestations of sedentary

13
lifestyle and unhealthy diet and are also referred to as metabolic CVD risk factors
(Mendis et al., 2011).
Rurality and Coronary Heart Disease Risk
Mortality data indicates that rural persons may be at increased risk of dying from
CVD as compared to their urban counterparts (Cossman, James, Cosby, & Cossman,
2010; Jones & Goza, 2008). Rural people are less likely than urban dwellers to alter their
CVD risk behaviors (Zuniga, Anderson, & Alexander, 2003). According to the WHO
(Mendis et al., 2011) social determinants, such as wealth and level of education,
indirectly impact CVD health which may be an issue in rural populations. Of concern in
the sparsely populated state of Montana is the rise in CHD risk factors that include
diabetes, HTN, and obesity (MDPHHS & Montana Cardiovascular Health Program,
2007).
Montana is predominantly classified as a rural or non-metropolitan state with less
than one million people statewide (USDA, 2004). The overall population density of
Montana is 6.6 people per square mile (Dillon & Sorenson, 2009). Metropolitan,
micropolitan/non-metropolitan, and non-core county designation is a population
classification system defined by the OMB. Based on this system, there are 4
metropolitan counties, 6 micropolitan counties and 46 non-core counties in Montana
(OMB, 2008; USDA ERS, 2007). This study will utilize micropolitan and non-core
county status to identify “rural” participants.
Rural people have defined health as “…the ability to work, to be productive, to do

14
usual tasks” (Long & Weinert, 1989, p. 120). In more recent research from rural
populations, more holistic definitions of health have been reported which encompass
mental, physical, and emotional well-being (Bales, Winters, & Lee, 2006; Winters & Lee,
2004). Characteristics, such as self-reliance and hardiness (Bales et al., 2006) have also
been reported which may distinguish rural persons from their urban counterparts.
Challenges of rural living include isolation, increased distance to services, access to
public transportation, health insurance coverage, and access to primary care providers
and healthcare specialists (Long & Weinert, 2010; Utz, 2008). People living in non-
metropolitan areas are more likely to be uninsured than those living in metropolitan areas
and health insurance coverage has been reported as an important indicator of physician
utilization and preventive services use (Broyles, McAuley, & Baird-Holmes, 1999).
Statistics specific to the rural area of Northwest Montana from the Behavioral Risk
Factor Surveillance System (BRFSS) are: 27.2% of Northwest Montanans reportedly lack
health insurance, 21% smoke, 37.3% are overweight, 21.6% are obese, 18.4% have not
participated in leisure time physical activity in the last 30 days, and 29.9% have
household incomes under $25,000 (MDPHHS, 2010).
The racial and ethnic composition of Montana’s population include approximately
90% white, 6.4% is Native American, 3.1% is Hispanic, 0.7% is Asian, and 0.5% is
African American (US Department of Commerce US Census Bureau, 2012). Although
race is not classified as a risk factor of CHD, it is important to note that the age adjusted
CVD mortality rate of Native Americans remains greater than the CVD mortality of non-
Native Americans in Montana (MDPHHS & Montana Cardiovascular Health Program,

15
2007). In general, Native Americans are more likely to smoke, be diagnosed with heart
disease, and have high blood pressure than white adults (USDHHS Office of Minority
Health, 2012). There are seven Native American reservations in Montana with one
reservation located in Northwest Montana.
Cardiovascular Health Promotion
According to current AHA guidelines (Roger et al., 2011b) “ideal cardiovascular
health is defined by the absence of clinically manifest CVD and the simultaneous
presence of optimal levels of all 7 health behaviors […] (p. e20).” The seven health
behaviors and factors are lean body mass, smoking cessation, physical activity
participation, healthy dietary practices, total cholesterol less than 200 mg/dL, untreated
blood pressure less than 120/80 mm Hg, and fasting blood sugar less than 100 mg/dL
(Roger et al., 2011b). Individuals who reduce their modifiable risk factors have been
shown to reduce the likelihood of developing signs of CVD (Wong et al., 2005).
Health promoting behaviors (Pender, 1996) are integral in the prevention and
management of CVD. Health promoting behaviors are actions that move individuals and
groups towards positive health outcomes such as personal fulfillment and optimal well-
being (Sakraida, 2006). Current recommendations for achieving the 7 optimal factors of
ideal cardiovascular health focus on health behaviors of healthy diet, increasing or
maintaining daily physical activity, and tobacco use cessation. A heart-healthy diet is
low in saturated fats and trans fats; high in fruits, vegetables, whole grains, and fiber; and
limits sodium, cholesterol, and alcohol intake. Physical activity is recommended most

16
days of the week at moderate intensity for 30 minutes a day and increased time
increments for weight loss. Desirable weights are considered by calculating body mass
index (BMI) with recommended BMI of 18.5-24.9 kg/m2 (Mosca et. al., 2007).
Women and Coronary Heart Disease
Globally, 8.6 million women die of heart disease each year (Hsia, 2007). Every
minute in the U.S., CVD claims approximately one woman’s life (Roger et al., 2011b)
with CHD being the number one cause of death in women (CDC, 2010). Coronary heart
disease accounts for 25.5% of all deaths in US women over 18 years old (USDHHS,
2010). It is estimated that 8 million women currently live with CHD and 35,000 of those
women are under the age of 65 (Hsia, 2007). The CHD mortality rate for white women
in 2008 was 91.9 deaths per 100,000 people (Roger et al., 2011b).
The most recent AHA data indicate women continue to partake in behaviors that
are detrimental to their cardiovascular health. Approximately 18% of adult women (over
the age of 18) smoke cigarettes and physical inactivity rates are higher among women
than men (35.2% versus 29.7%). Data also indicate participation in physical activity
decreases with age in women. Nutritionally, whole grain, vegetable, and fruit
consumption are below the recommended levels in adults (Roger et al., 2011b).
In Montana, CVDs were the leading cause of death in adult women in 2007 and
approximately 3 women die each day of CVD (Montana Cardiovascular Health Program,
n.d.). Approximately 50% of all heart disease deaths in Montana occurred in women in
2007 (Montana Cardiovascular Health Program, n.d.)

17
There have been significant gains in combatting the high mortality rate of CVD.
From 1998-2008, there was a 30.6% decline in CVD mortality (Roger et al., 2011b).
Research indicates this decrease in overall CVD mortality is linked to use of evidence
based medical treatments and a decrease in risk factors related to lifestyle changes (Roger
et al., 2011b). Despite decreasing mortality, the unchanged prevalence of CHD over the
last 10 years and increasing prevalence of certain CHD risk factors like diabetes and
obesity (Roger et al., 2011b; USDHHS, 2010; US Environmental Protection Agency
[EPA], 2011;), there is a need for continued research on how and why women partake in
unhealthy behaviors and how to encourage women to adopt behaviors that prevent and
treat CHD.
Many CHD risk factors are the same for men and women, but menopause appears
to be a unique risk factor in women (Hankinson et al., 2001; NHLBI, 2011b). The risk of
developing CHD significantly increases in women 45 to 54 years old (Hankinson et al.,
2001), or once they go through menopause (McCance et al., 2010). The average age of
menopause is 51 years old (National Institute on Aging [NIA], 2012). Menopause may
occur naturally or may be the result of an operation, such as a hysterectomy or
oophorectomy (NIA, 2012). It is thought that endogenous estrogen acts as a protective
function against CHD until the onset of menopause (McCance, 2010). At the age of
menopause, women also tend to develop other risk factors, like HTN (NHLBI, 2011b).
Women lag behind men by about 10 years in the risk of their first CVD event.
With increasing age, the risk of experiencing a CVD event equalizes between sexes
(Roger et al., 2011b). The use of birth control pills, in combination with smoking, greatly

18
increases the risk of blood clots that can lead to heart attack or stroke (Hankinson et al.,
2001). Women who use birth control pills and smoke have a substantially higher risk of
developing CHD. This risk increases at the age of 35 if a woman continues to smoke and
use birth control pills (NHLBI, 2011b).
High total cholesterol, high low-density lipoprotein (LDL) cholesterol, or low
high-density lipoprotein (HDL) cholesterol are all strong risk factors for CHD. However,
low HDL cholesterol is a stronger predictor of CHD risk in women than men (Hankinson
et al., 2001; NHLBI, 2011b). Diabetes and prediabetes increases a woman’s risk of
developing CHD and negates the premenopausal protection she has against developing
CVD (NHLBI, 2011b). According to Hankinson and colleagues (2001), diabetic women
are 3-7 times more likely to develop CHD than their non-diabetic female counterparts.
Perhaps the most concerning issues for women are the gender disparities that have
been documented regarding adequate management of CHD and outcomes of CHD
interventions compared to those of men. According to a large national study on blood
pressure control and CVD care in ambulatory clinics in males and females, use of aspirin
in women with known CVD and use of beta-blockers in women with known ischemic
heart disease was lower compared to the use of these drugs in male cohorts (Keyhani,
Scobie, Hebert, & McLaughlin, 2008). Women also have higher mortality rates and
complication rates following coronary balloon angioplasty and are more likely to die
following coronary artery bypass surgery compared to men (Hsia, 2007). While
continued research on women and the use of cardiac pharmaceuticals and outcomes

19
following cardiac interventions will hopefully minimize these disparities, it is important
for women to understand their CHD risks, especially the factors they have control over.
Within the context of Pender’s HPM (Pender, 1996; Pender et al., 2006), the
remaining literature review will summarize the general findings of CHD knowledge and
barriers and benefits of HPBs in women.
The Health Promotion Model
Health promotion is integral to achieve and maintain health. According to the
WHO (1998) “Health promotion is the process of enabling people to increase control
over the determinants of health and thereby improve their health” (p.1). The HPM
(Pender, 1996; Pender et al., 2006) has been used as a conceptual framework for
understanding the process behind health promoting lifestyles and behaviors, like exercise
and dietary choices, since the 1980’s. The HPM (Pender et al., 2006) is a nursing theory
that seeks to explain the complex biopsychosocial processes that influence individuals to
engage in activities and behaviors that enhance their health. It is based on the
expectancy-value theory (Feather, 1982) and social cognitive theory (Bandura, 1986).
The expectancy-value theory (EVT) assumes that behaviors are “economical and
rational” (Pender et al., 2006, p. 51) and that a person will engage in an action and
continue with the action as long as the individual values the behavior and perceives the
behavior will yield a desired outcome. People will not participate in actions they do not
value nor those they feel are unattainable (Pender, 1996). Social cognitive theory (SCT)
poses that environment, personal attributes, and individual behaviors interact to influence
20
one another. Social cognitive theory assumes that all humans have the ability to
transform experiences into internal models that guide subsequent actions (symbolization),
can anticipate the outcomes of their actions (forethought), can learn from observation
(vicarious learning), can self-regulate to change behaviors by using internal cues and self-
evaluation, and be able to self-reflect about their actions and thoughts (Pender, 1996).
Domains of the HPM (Pender et al., 2006) include individual characteristics,
behavior-specific cognitions, and behavioral outcomes. Individual characteristics are
generally viewed as indirect influencers of HPBs while behavior-specific cognitions and
affect are viewed as direct influencers of behavior (Figure 1) (Pender et al., 2006).
Personal factors can be altered by intervention; however, they are generally viewed as
fixed factors of HPBs. Behavior-specific cognition variables of the HPM, such as
perceived benefits and barriers, are considered to have “major motivational significance”
(Pender et al., 2006, p. 52) because they can be altered by nurse intervention. This study
focused on the individual characteristic of CHD knowledge; the behavior-specific
cognitions of perceived benefits and barriers to healthy eating and exercise; and the
behavioral outcomes of health responsibility, physical activity, nutrition, spiritual growth,
interpersonal relations, and stress management (see Figure 1).

21
Figure 1. The Health Promotion Model with Highlighted Constructs of the Study.
Note: The Health Promotion Model is presented with highlighted areas to show the areas assessed in this study. Coronary heart disease knowledge was classified as a personal factor, perceived barriers and benefits of healthy eating and exercise were classified as perceived barriers and benefits to action, and health promoting behaviors were defined has physical activity, nutrition, health responsibility, interpersonal relations, spiritual growth, and stress management. Adapted from Pender, Murdaugh, and Parsons, Health Promotion in Nursing Practice (5th ed.), 2006, p.50, Upper Saddle River, NJ: Pearson Prentice Hall.
Coronary Heart Disease Knowledge
Knowledge alone clearly does not translate to a change in health behaviors, but is
arguably a necessary piece of the process when carrying out a behavior that impacts well-
being. It is reasonable to deduce that knowledge of disease formation helps inform the
perceived benefits and barriers to actions that affect the disease process and impacts

22
motivation to change behaviors. Numerous national campaigns, such as the National
Coalition for Women with Heart Disease Women Heart (Womenheart, 2011) program
and the AHA Go Red for Women (AHA, 2012) seek to educate women about their risk of
CHD and how to prevent CHD through lifestyle modifications. Despite improvements in
women’s knowledge of CHD over the last 10 years (Mosca, Mochari-Greenberger,
Dolor, Newby, & Robb, 2010) awareness of heart disease as a leading cause of death in
females and CHD knowledge measured by standardized questionnaires (Oliver-McNeil
& Artinian, 2002; Hamner & Wildner, 2008) are variable and often less than optimal.
In a national survey (n = 2,300) of women 25 years and older in which
participants responded to questions regarding CHD awareness, knowledge, and their
health behaviors related to CHD, 54% of the participants surveyed by telephone (n =
1142) and 65% of the participants surveyed online (n = 1158) identified CHD as the
leading cause of death (LCOD) in women (Mosca et al., 2010). Comparatively, in a
sample of rural women 30 years and older (n = 112) from a primary care clinic in
Alabama, 30% of the participants identified heart disease as the LCOD in women
(Hamner & Wilder, 2010), a much lower percentage than the national survey (Mosca et
al., 2010).
In a convenience sample of rural Australian women, age 16-65 years old (n = 65),
the Heart Disease Fact Questionnaire-2 (HDFQ-2) measured CHD knowledge and
yielded a mean score of 84% indicating an average of 21 questions correct out of 25
(Crouch & Wilson, 2011). The study-specific survey tool measured knowledge of
established CHD risk factors and assessed personal health status of participants. Heart
23
disease knowledge areas included smoking, high blood pressure, cholesterol, family
history, age, gender, physical activity, glycemic control, and weight. Overall, 58% of the
participants reported 2 or more CHD risk factors; younger women reported smoking
more frequently than older women, and age and menopause were not recognized as CHD
risk factors (Crouch & Wilson, 2011).
Hamner and Wildner (2008) conducted a descriptive study of 112 rural women in
Alabama age 35-85 years old to assess their CHD knowledge using the modified CHD
Knowledge Test (Oliver-McNeil & Artinian, 2002) and actual CVD risk. The mean
CHD test score for the Hamner and Wilder (2008) research participants was 43%,
indicating the average number of correctly answered questions was between 8 and 9 out
of 20. The average number of CVD risk factors in the sample population was three while
the average number of reported risk factors was one (Hamner & Wildner, 2008).
Smoking and obesity were the most commonly reported personal risk factors of CHD
(Hamner & Wildner, 2008).
Perceived Benefits and Barriers to Exercise and Healthy Eating
According the HPM (Pender et al., 2006), perceived barriers and benefits are
influenced by individual characteristics and affect the HPB of interest. Any forms of
hurdles (imagined or real) to implementing a certain behavior are considered perceived
barriers (Pender, 1996). Examples of barriers include expenses, inconvenience,
difficulty, and time commitment necessary to partake in an action (Pender et al., 2006).

24
The loss of satisfaction associated with stopping a behavior, such as smoking, can also be
classified as a barrier (Pender, 1996).
Perceived benefits of an action are the anticipated favorable outcomes that will
result from a behavior (Pender, 1996). According EVT (Feather, 1982), the motivation to
participate in an action is influenced by perceived benefits of the behavior, which is
created from prior personal experiences and observations. Studies have documented that
perceived benefits alone are not sufficient in explaining engagement in HPBs, but are a
necessary factor (Pender et al., 2006). Results from Mosca and colleagues (2006)
indicate benefits of partaking in behaviors to prevent CVD included improving health,
feeling better, living longer and to avoid taking medications.
Barriers to physical activity cited by rural-living women in a focus group study on
environmental and policy determinants of exercise (n = 33, age 20-50 years old) were
related to physical environment (i.e., no sidewalks, gravel roads), rural environment (i.e.
access to health facilities and distance to exercise facilities), safety (i.e. no street
lighting), and employment (i.e. no time or energy to exercise after working) (Eyler &
Vest, 2002). Secondary to lack of time for exercise, care taking and family
responsibilities to children and grandchildren were the most frequently reported barriers
to personal physical activity (Eyler & Vest, 2002).
A longitudinal study on rural mothers (n = 1691) and their perceived intrinsic
barriers to exercise participation identified lack of self-discipline, lack of interest, and
lack of time as the leading intrinsic barriers to exercise (Adachi-Mejia, Drake,
MacKenzie, Titus-Ernstoff, Longacre, Hendricks, …Dalton, 2010). Each of the 8

25
assessed barriers was inversely associated with physical activity contributing to existing
evidence (Pender et al., 2006) that barriers have a strong influence in the decision to
participate in HPBs. Physical activity was not associated with age, education attainment,
income, number of offspring, hours worked outside the home, population of town, or
season of interview (Adachi-Mejia et al., 2010).
A study to understand rural mothers’ perceptions of nutrition and exercise
education needs was conducted using focus groups and surveys in a rural, low-income
population in Maryland (n = 146) (Atkinson, Billing, Desmond, Gold, & Tournas-Hardt,
2007). Identified physical activity barriers included long distances to recreation areas
and gyms, cost of membership and entry fees, reliable transportation to recreation areas,
lack of sidewalks, and busy roads (Atkinson et al., 2007). Children were reported as both
motivating factors and barriers to exercise participation. Barriers to healthy eating in this
sample group included high food prices, especially for fresh produce and lean meats; lack
of time for shopping and preparing healthful meals; and inadequate time management
skills. Study participants reported not being able to shop as needed due to their rural
residence and lack of reliable personal or public transportation (Atkinson et al., 2007).
Research on the determinants of rural women’s activity and eating (Walker et al.,
2006), reported that increased perceived benefits and fewer barriers to healthy eating and
physical activity are associated with desirable lifestyle behaviors. This sample of rural
women (n = 179), age 50-69 years old, identified benefits of exercise as improving the
cardiovascular system, increasing fitness level, and improving disposition (Walker et al.,
2006). Reported benefits of healthy eating included reducing the risk of CHD, reducing
26
the risk of colorectal cancer, and staying healthy. The most frequently cited barriers to
exercise were that it is too tiring, it is hard work, and it takes too much time. Barriers to
healthy eating were limited menu choices when eating out, having to give up foods they
liked, and being confused about the recommendations for healthy eating (Walker et al.,
2006).
In a qualitative study with 8 focus groups of women 18 years and older (n = 44),
researchers explored the health-promoting activities and barriers and facilitators to
staying healthy in a rural Canadian community (Paluck, Allerdings, Kealy, & Dorgan,
2006). Women were split into three age groups: 18 - 44 years old (n=16), 45-64 years
old (n = 16) and ≥ 65 years old (n = 12). Women in all three age groups agreed that
maintaining physical activity was hindered due to lack of facilities, financial resources,
cold weather, and travel distance. The youngest age group of women reported children
and family commitments as a barrier to staying healthy more often than the older age
groups. Barriers to ideal nutrition were most commonly cited by the middle age group
and pertained to lack of variety at grocery stores and limited choices at restaurants. The
oldest age group of women identified loneliness and social isolation as barriers to staying
healthy (Paluck et al., 2006).
Summary
Coronary heart disease knowledge tools indicate room for improvement in
women’s knowledge of CHD in rural women. Research with rural women, although
limited, yields the lowest and highest CHD knowledge scores (Hamner & Wildner, 2008;

27
Crouch & Wilson, 2011) when compared to studies conducted in urban areas (Thanavaro,
Moore, Anthony, Narsavage, & Delicath, 2006b; Oliver-McNeil & Artinian, 2002;
Konicki, 2012). The limited research from rural women and their reported levels of CHD
knowledge, lack of recognition of female-specific risk factors (Oliver-McNeil &
Artinian, 2002; Crouch & Wilson, 2011), and inability to accurately identify personal risk
factors (Hamner & Wildner, 2008; Oliver-McNeil & Artinian, 2002) support continued
research on rural women to understand their knowledge of CHD risk factors.
Health promotion is essential to prevent and treat CHD. Understanding the
factors that affect the decision to participate in HPBs, such as perceived benefits and
barriers of healthy diet and exercise, may assist healthcare providers in designing and
implementing interventions to combat heart disease in rural areas. Perceived benefits and
barriers of health promotion activities are strong influencers of health promotion
participation (Pender et al., 2006; Walker et al., 2006). It is important to recognize the
unique barriers rural women may face regarding health promotion, such as long distances
to exercise facilities (Eyler & Vest, 2002), access to affordable fresh foods (Atkinson et
al., 2007), feelings of isolation (Paluck et al., 2006) or lack of self-discipline (Adachi-
Mejia et al., 2010). Health promotion is fundamental in forming lifelong habits that
sustain wellness and prevent disease. It is important to continue to gain an understanding
of rural women’s CHD knowledge and HPBs so that healthcare providers can ultimately
provide their rural clients with appropriate education and services that promote wellness
and health promotion to prevent CVD.

28
CHAPTER 3
METHODOLOGY
Study Design
A descriptive, cross-sectional design was used to meet the aims of the study; to
assess CHD knowledge, perceived benefits and barriers of healthy eating and exercise,
and HPBs in rural women 21-55 years old. Four survey tools were used. Data collection
took place over a 10-week period from mid-January through March of 2013.
Population and Sample
A non-random convenience sample of women seeking healthcare at primary care
clinics in Northwest Montana constituted the sample population. Inclusion criteria for
participants were: women, premenopausal status, at least 21 years old, ability to read and
write English, and primary residence in one of the following Northwest Montana
counties: Lincoln, Lake or Flathead County. Exclusion criteria were: existing pregnancy,
living outside the defined Northwest Montana counties, and inability to read or write
English. For the purpose of this study, rural is defined by living in a non-metropolitan
(micropolitan) or non-core county as defined by the OMB (USDA: ERS, 2007.).
Northwest Montana is defined by the counties of Lincoln, Lake, and Flathead. Flathead
County is classified as micropolitan and Lincoln and Lake Counties are classified as non-
core counties (USDA: ERS, 2007). Micropolitan indicates a geographic area has one or
more urban clusters of 10,000 people, but less than 50,000 people while non-core

29
counties do not have urban populations large enough to meet micropolitan classification
(OMB, 2008; USDA: ERS, 2007).
Instruments
Four questionnaires were used for the study: 1) CHD Knowledge Tool for
Women (see Appendix A), 2) Health-Promoting Lifestyle Profile II (see Appendix B), 3)
Exercise Benefits/Barriers Scale (see Appendix C), 4) and Healthy Eating
Benefits/Barriers Scale (see Appendix D). Standard demographic data was also collected
(see Appendix E).
The CHD Knowledge Tool for Women is a 25-item test that assesses awareness
of women’s health issues and practices related to CHD prevention; a higher score
indicating a higher knowledge of CHD risk factors. The developers pilot tested the tool
in women without CHD (control group, n = 49), female cardiovascular nurses (known
group, n = 23) and, laywomen (treatment/educational group, n = 22) (Thanavaro,
Thanavaro, & Delicath, 2010b). Validity was evaluated by assessing the ability of the
test to differentiate the control group from the known group and the control group from
the treatment group. Cronbach’s alpha coefficient of the CHD Knowledge Tool for
Women in the control group was .74 and the reliability coefficient for the 1-2 week test-
retest was .70 (Thanavaro et al., 2010b).
The Health Promoting Lifestyle Profile (HPLP) II is a 52 item scale that measures
HPBs conceptualized as actions and perceptions to maintain or enhance wellness, self-
actualization and personal fulfillment (Walker, Sechrist, & Pender, 1995; Walker & Hill-

30
Polerecky, 1996) in the six domains: health responsibility, physical activity, nutrition,
spiritual growth, interpersonal relations, and stress management (Walker & Hill-
Polerecky, 1996). Responses utilize a 4-point Likert scale and range from 1 (never) to 4
(routinely) with a potential scores ranging from 52-208. It is recommended that mean
scores are calculated for each of the six subscales of the HPLP II to retain the 1-4
response metric for accurate comparison between subscales. Higher scores, in theory,
indicate higher participation in HPBs. The HPLP II has been widely tested with
Cronbach’s alpha scores of .922 (Walker, Sechrist & Pender, 1987) and .92 (Thanavaro,
Thanvaro, & Delicath, 2010a).
The Exercise Benefits/Barriers Scale (EBBS) (Sechrist, Walker, & Pender, 1987)
measures perceived barriers and benefits to exercise participation. Twenty-nine items
assess benefits and 14 items assess barriers to exercise participation. Likert format
responses range from 4 (strongly agree) to 1 (strongly disagree) for all items. Total
scores range from 43-172; the higher the scores, the more positively the person perceives
exercise. This tool is reported to have a Chronbach’s alpha score of .954 (Sechrist et al.,
1987). Test-retest reliability was reported to be .89 (Sechrist et al., 1987).
The Healthy Eating Benefits and Barriers Scales (HEBBS) (Walker et al., 2006) is
an 18-item questionnaire to assess perceived benefits and barriers to healthy eating. The
HEBBS contains 9 benefit items and 9 barrier items and also utilizes a four-choice, Likert
format for responses from 1 (strongly agree) to 4 (strongly disagree). Total scores can
range from 18-72. Higher scores for the barriers items indicate lower perceived barriers

31
while lower scores for the benefits items indicate higher perceived benefits of healthy
eating. Cronbach’s alpha for the HEBBS is reported to be .80 (Walker et al., 2006).
Demographic information collected consisted of age, race, ethnicity, educational
background, employment status, annual household income, marital status, and living
arrangements. Specific questions added for this research included smoking status, family
history of CHD or stroke, weight, height, estimated distance to a healthcare provider, and
estimated population of town of residence.
Procedure for Data Collection
The primary investigator collected data in four primary care clinics: two clinics in
Flathead County, one clinic in Lake County, and one clinic in Lincoln County. Each
primary care clinic was identified with a numerical number to assist in grouping data
during statistical analysis. All primary care clinic office managers and/or appropriate
administrators of the clinics were informed of the research purposes and provided
approval for data collection. The staff receptionists working on the day of data collection
were informed of the research purposes and participant inclusion and exclusion criteria
and provided written instructions (see Appendix F). The staff receptionists provided
potential participants with a brief explanation of the primary investigator’s purpose to
collect data for a thesis project and referred the potential research participant to the
primary investigator for a full explanation of the study.
The primary investigator provided interested participants with a participant
explanation letter (Appendix G) and research participant eligibility checklist (Appendix
32
H). If the participant remained interested and met eligibility criteria, they were asked to
complete the research questionnaires. Completion of questionnaires was offered on a
laptop computer or on paper. Survey Monkey, an internet based survey tool, was used to
administer the computer-based questionnaire. Paper surveys were available in the event
of malfunctioning computer and/or survey program, interruption in power, unavailable
Internet access, or preference of the participant. The computer and paper questionnaires
included the four surveys and demographic questions in the same order and format.
Questionnaires completed on paper were manually entered into the computer-entry
questionnaire by the primary investigator.
If a participant was called into an exam room while completing the
questionnaires, their computer was placed in standby mode until they returned to finish it.
Participants completing the paper questionnaires were allowed to take their survey to the
exam room to finish. If the participant was unable or unwilling to finish the survey, the
computer or paper questionnaire was submitted. Missing data was handled on a case-by-
case basis. If needed, the primary investigator was available to help all participants with
technical issues associated with the laptop computer.
A $5 bill or $5 gift card to a local coffee shop was provided as an incentive for
completing the research questionnaires. Answers to the CHD Knowledge Test
(Thanavaro et al., 2010b) and a folder of educational material from the AHA on
preventing heart disease in women was also offered to all participants.

33
To protect anonymity, no identifying information was collected (i.e. name,
address, social security number). Willingness to participate in the research and
completion of the survey was considered consent. No consent forms were used.
Human Subjects Consideration
Approval for the study was granted by the Montana State University Institutional
Review Board (IRB) and Kalispell Regional Healthcare IRB. Approval was also
obtained from the administrators and managers of the participating clinics where data was
collected.
Statistical Analysis
Survey responses were entered into Survey Monkey or an Excel database by the
primary investigator and analyzed. Descriptive statistics were used to summarize data
findings from each questionnaire. The mean CHD Knowledge Test (Thanavaro et al.,
2010b) scores were calculated in addition to individual test item analysis. Mean item
Likert scores for the HEBBS (Walker et al., 2006) and EBBS (Sechrist et al., 1987)
questions were calculated to assess perceived barriers and benefits of exercise and
healthy eating. Health Promoting Lifestyle Profile II results were calculated by mean
item scores and by individual subset category (health responsibility, physical activity,
nutrition, spiritual growth, interpersonal relations, and stress management) mean item
Likert scores.

34
CHAPTER 4
RESULTS
Sample Demographics
Twenty-five participants (N = 25) completed 25 surveys between February 4,
2013 and April 1, 2013 in four different clinics in Northwest Montana. The researcher
screened participants who verbally indicated they were between the ages of 21-55 years
old; not pregnant; lived in Flathead, Lincoln, or Lake County; could read and write
English; and were premenopausal. One participant completed her survey by computer
while the other 24 participants completed paper and pencil versions of the survey. Data
collection occurred in Flathead County (Clinics 1 & 2), Lincoln County (Clinic 3), and
Lake County (Clinic 4) (see Table 1).
Table 1. Clinics and Number of Participants Clinic County # of Participants 1a Flathead 11 2 Flathead 6 3 Lincoln 4 4 Lake 4 a Clinic 1 was visited on two separate occasions due to short clinic times.
The sample population predominantly described their race as white (92%, n = 23)
and ethnicity as not Hispanic or Latino (92%, n = 23). Most participants reported they
were employed for wages (52%, n = 13), married (64%, n = 16), and had completed some

35
college education (56%, n = 14). Fifteen (60%) women reported incomes of less than
$24,999 (see Table 2).
Table 2. Participant Characteristics Participant Response N = 25
Number of Responses
Percent of Responses
Age 21-29 years old 6 24 30-39 years old 6 24 40-49 years old 10 40 50-55 years old 3 12
Race White 23 92 Black or African American 0 0 American Indian or Alaska Native 1 4 Asian 0 0 Native Hawaiian or Other Pacific Islander 0 0 Other 0 0 No Response 1 4
Ethnicity Hispanic or Latino 1 4 Not Hispanic or Latino 23 92 No Response 1 4
Marital Status Married 16 64 Divorced 2 8 Separated 0 0 Cohabitating/Unmarried Couple 1 4 Widowed 1 4 Never Married 5 20
Education Attainment Never attended school or only attended kindergarten 0 0 Grades 1-8 0 0 Grades 9-12 (some high school) 1 4 Grade 12 or attained a GED 7 28 College 1-3 years (some college) 14 56 College graduate/ 4 or more years undergraduate work 1 4 Graduate Degree 2 8 Doctoral Degree 0 0

36
Table 2. Participant Characteristics - Continued
Participant Response N = 25
Number of Responses
Percent of Responses
Employment Employed for wages 13 52 Self-Employed 4 16 Homemaker/does not work outside home 3 12 Retired 1 4 Unable to work 1 4 Out of work less than 1 year 2 8 Out of work more than 1 year 1 4
Table 2. Participant Characteristics Continued Household Income
Less than $15,000 10 40 $15,001-$24,999 5 20 $25,000-$34,999 3 12 $35,000-$49,999 2 8 $50,000-$74,999 3 12 $75,000-$99,000 0 0 $100,000 and over 1 4 No Response 1 4
Ten participants (38%) reported living in towns with 5,000 or fewer residents,
five participants (20%) reported living in towns with 5,001-10,000 residents, and one
participant (4%) reported living in a town with 10,001 and 15,000 residents. Four
participants (16%) did not answer the question about population, and five (20%) reported
they were unsure or did not know the population of their town (see Table 3.)
Table 3. Reported Population of Town Participant Response N = 25
Number of Response
Percent of Responses
1-5,000 10 38 5,001-10,000 5 20 10,001-15,000 1 4 Unsure/Do not know 5 20 No response 4 16

37
Responses to Health-Related Questions
Eighteen (72%) respondents indicated they had never smoked or used to smoke.
Based on self-reported height and weight of each participant, body mass indexes (BMI)
were calculated. Based on reported heights and weights, a majority of participants (72%,
n = 18) had a calculated BMI ≥ 25 kg/m2. The average calculated BMI rounded to the
nearest inch and/or pound was 32.3 kg/m2 (SD = 9.34) (see Table 4). Nine participants
(36%) reported having some form of health coverage and 14 (56%) reported no insurance
(see Figure 2). A majority of respondents (60%, n = 15) reported their travel to a
healthcare provider was within 10 miles of their residence.
Table 4. Health-Related Questions Participant Response N = 25
Number of Responses
Percent of Responses
Family History of Heart Disease
No 11 44 Yes 10 40 Don’t know/unsure 2 8 No Response 2 8
Smoking Status Never smoke 11 44 Used to smoke 6 24 Currently smoke 7 28 Trying to quit 1 4
BMI <18.5 0 0 18.5-24.9 6 24 25-29.9 8 32 Greater than or equal to 30
10 40
No response to weight or height
1 4

38
Figure 2. Reported Healthcare Insurance Coverage by Clinic
Coronary Heart Disease Knowledge
The CHD Knowledge Test for Women scores ranged from 40% - 88% on a scale
of 0-100%, 100% indicating all 25 questions were answered correctly. Theoretically,
higher test scores indicate higher levels of CHD knowledge. The average CHD
Knowledge Test for Women score was 71% (SD = 12%, Mdn = 72%), a relatively low
score indicating an average of 17.92 correct answers out of 25 (SD = 2.97, Mdn = 18).
Most women correctly identified that high cholesterol may cause artery blockages (100%,
n = 25), obesity may cause HD (100%, n = 25), the relationship between high blood
pressure and HD (96%, n = 24), diabetes may increase the chance of having HD (96%, n
= 24), symptoms of a heart attack (92%, n = 23), and that routine exercise may reduce
HD (92%, n = 23). A lower number of participants correctly identified that heart disease
develops slowly over many years (65%, n = 16), women are more likely to get HD after
menopause (60%, n = 15), once women are diagnosed with HD they are more likely than
0
2
4
6
8
10
12
Clinic 1 Clinic 2 Clinic 3 Clinic 4
Num
ber of Participants
Clinic
yes
no
unsure
39
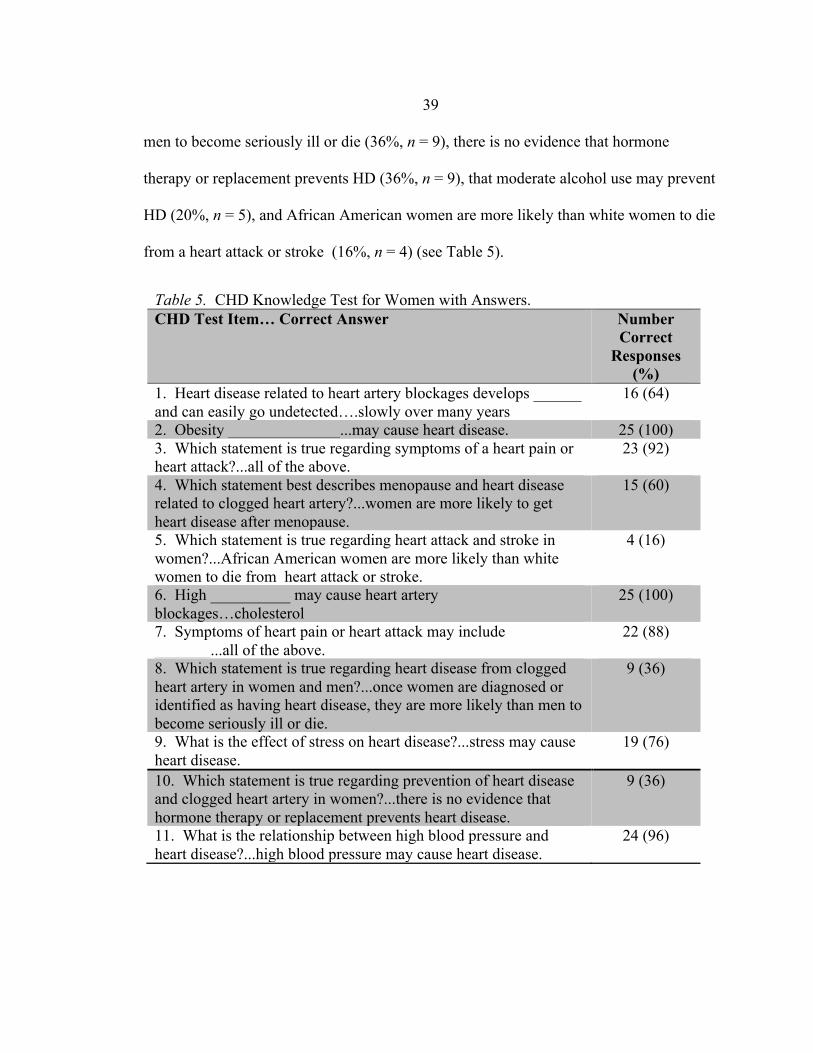
men to become seriously ill or die (36%, n = 9), there is no evidence that hormone
therapy or replacement prevents HD (36%, n = 9), that moderate alcohol use may prevent
HD (20%, n = 5), and African American women are more likely than white women to die
from a heart attack or stroke (16%, n = 4) (see Table 5).
Table 5. CHD Knowledge Test for Women with Answers. CHD Test Item… Correct Answer Number
Correct Responses
(%) 1. Heart disease related to heart artery blockages develops ______ and can easily go undetected….slowly over many years
16 (64)
2. Obesity ______________...may cause heart disease. 25 (100) 3. Which statement is true regarding symptoms of a heart pain or heart attack?...all of the above.
23 (92)
4. Which statement best describes menopause and heart disease related to clogged heart artery?...women are more likely to get heart disease after menopause.
15 (60)
5. Which statement is true regarding heart attack and stroke in women?...African American women are more likely than white women to die from heart attack or stroke.
4 (16)
6. High __________ may cause heart artery blockages…cholesterol
25 (100)
7. Symptoms of heart pain or heart attack may include _______...all of the above.
22 (88)
8. Which statement is true regarding heart disease from clogged heart artery in women and men?...once women are diagnosed or identified as having heart disease, they are more likely than men to become seriously ill or die.
9 (36)
9. What is the effect of stress on heart disease?...stress may cause heart disease.
19 (76)
10. Which statement is true regarding prevention of heart disease and clogged heart artery in women?...there is no evidence that hormone therapy or replacement prevents heart disease.
9 (36)
11. What is the relationship between high blood pressure and heart disease?...high blood pressure may cause heart disease.
24 (96)

40
Table 5. CHD Knowledge Test for Women with Answers - Continued CHD Test Item… Correct Answer Number
Correct Responses
(%) 12. Which statement best describes the relationship between heart disease and stroke?...it is true that some forms of heart disease may result in stroke.
18 (72)
13. What is the effect of dietary fat on heart disease?...a high fat diet may cause clogged heart artery.
23 (92)
14. Which statement is true about the effect of alcohol on heart disease?...moderate alcohol use (1-2 drinks per day) may prevent heart disease.
5 (20)
15. Smoking may cause ________...heart artery blockages. 4 (16) 16. What is the relationship between female hormone and heart disease in women?...Low level of some female hormone may prevent heart disease in women.
4 (16)
17. Which statement is true regarding the effect of race on heart disease in women?...African American women are more likely to have heart disease than white women.
14 (56)
18. How does dietary cholesterol affect heart disease?...reducing dietary cholesterol may prevent clogged heart artery.
22 (88)
19. Which statement is true regarding exercise and heart disease?...routine exercise may prevent heart disease.
23 (92)
20. Symptoms of heart pain or heart attack may include _______...all of the above.
25 (100)
21. Which statement is true about the effect of red meat on heart disease?...reducing dietary red meat may prevent heart artery blockages.
21 (84)
22. Which statement best describes the effect of family history on heart disease?...a family history of heart disease from clogged heart artery may increase your risk of getting heart disease.
22 (88)
23. What is the relationship between diabetes and heart disease?...diabetes may increase the change of having a heart attack.
24 (96)
24. A risk factor of heart disease related to clog heart artery that cannot be changed is __________...heredity.
20 (80)
25. What is the leading cause of health care problems and death in women?...heart disease and stroke.
17 (68)

41
Health Promoting Behaviors
The average mean item score (MIS) for the HPLP II was 2.49 (SD = .4) on a
Likert scale of 1 – 4 (1 = never, 2 = sometimes, 3 = often, 4 = routinely) theoretically
indicating healthy behaviors were practiced “sometimes” to “often.” Mean item scores
ranged from 1.75 – 3.24. When the items on the HPLP II were analyzed by the six
subscales, interpersonal relations (MIS = 2.94, SD = .22), spiritual growth (MIS = 2.81,
SD = .29) and nutrition (MIS = 2.51, SD = .22) scored the highest. Stress management
(MIS = 2.28, SD = .32), physical activity (MIS = 2.20, SD = .31), and health
responsibility (MIS = 2.14, SD = .23) scored the lowest (see Table 6).
Table 6. HPLP II Items by Subscale with MIS Subscales of HPLP MIS Interpersonal Relations
Find it easy to show concern, love and warmth to others. 3.24 Maintain meaningful and fulfilling relationships with others. 3.20 Touch and be touched by people I care about. 3.08 Praise other people easily for their achievements. 3.04 Spend time with close friends. 2.92 Get support from a network of caring people. 2.84 Settle conflicts with others through discussion and compromise. 2.84 Discuss my problems and concerns with people close to me. 2.64 Find way to meet my need for intimacy. 2.63
Average MIS of Interpersonal Relations 2.94 Spiritual Growth
Look forward to the future. 3.24 Am aware of what is important to me in life. 3.20 Believe that my life has purpose. 2.96 Feel connected with some force greater than myself. 2.96 Work toward long-term goals in my life. 2.72 Find each day interesting and challenging. 2.63 Feel I am growing and changing in positive ways. 2.60 Expose myself to new experiences and challenges. 2.52 Feel content and at peace with myself. 2.48
Average MIS of Spiritual Growth 2.81

42
Table 6. HPLP II Items by Subscale with MIS - Continued Subscales of HPLP MIS Nutrition
Eat breakfast. 2.68 Eat only 2-3 servings from the meat, poultry, fish, dried beans, eggs, and nuts groups each day.
2.67
Eat 2-4 servings of fruit each day. 2.64 Read labels to identify nutrients, fats, and sodium content in packaged food.
2.60
Eat 2-3 servings of milk, yogurt, or cheese each day. 2.58 Eat 3-5 servings of vegetables each day. 2.56 Choose a diet low in fat, saturated fat, and cholesterol. 2.48 Limits use of sugars and food containing sugar (sweets). 2.40 Eat 6-11 servings of breads, cereal, rice and pasta each day. 1.96
Average MIS of Nutrition 2.51 Stress Management
Accept those things in my life which I cannot change. 2.88 Balance time between work and play. 2.46 Concentrate on pleasant thoughts at bedtime. 2.40 Get enough sleep. 2.24 Take some time for relaxation each day. 2.20 Use specific methods to control my stress. 2.16 Pace myself to prevent tiredness. 2.12 Practice relaxation or meditation for 15-20 minutes daily. 1.76
Average MIS of Stress Management 2.28 Physical Activity
Get exercise during usual daily activities (such as walking during lunch, using stairs instead of elevators, parking car away form destination and walking.)
2.63
Do stretching exercises at least 3 times/week. 2.44 Take part in light to moderate physical activity (such as sustained walking 30-40 minutes 5 or more times/week.)
2.36
Take part in leisure-time (recreational) physical activities (such as swimming, dancing, bicycling.)
2.32
Exercise vigorously for 20 or more minutes at least three times/week (such as brisk walking, bicycling, aerobic dancing, using a stair climber.)
2.20
Follow a planned exercise program. 2.12 Reach my target heart rate when exercising. 1.79 Check my pulse rate when exercising. 1.75
Average MIS of Physical Activity 2.20

43
Table 6. HPLP II Items by Subscale with MIS - Continued Subscales of HPLP MIS Health Responsibility
Discuss my health concerns with health professionals. 2.44 Seek guidance or counseling when necessary. 2.32 Report any unusual signs or symptoms to a physician or other health professional.
2.28
Question health professionals in order to understand their instructions. 2.24 Inspect my body at least monthly for physical changes/danger signs. 2.17 Get a second opinion when I question my health care provider’s advice. 2.08 Ask for information from health professionals about how to take good care of myself.
2.04
Read or watch TV programs about improving health. 1.92 Attend educational programs on personal health care. 1.76
Average MIS of Health Responsibility 2.14 Note: A 1 - 4 Likert scale is used to score the HPLP II. The following numbers correlate with the following answers to participation in a health behaviors: 1 = never, 2 = sometimes, 3 = often, 4 = routinely.
Perceived Benefits and Barriers of Exercise
The EBBS yielded the highest no-response rate of the individual surveys. Three of the
EBBS surveys were excluded from the analysis due to more than 5% (more than two) of
the questions omitted or having multiple answers. This decision was based on the
recommendations of the original authors of the EBBS on how to handle missing data in
the EBBS (Sechrist, Walker, & Pender, 1987). The three surveys that were removed
from analysis were completely missing answers and/or had multiple answers.
Average MIS were used to analyze the EBBS and used Likert scale scoring of 1-
4. Exercise benefit scale items were scored using the following Likert scale rating: 1 =
strongly disagree, 2 = disagree, 3 = agree, 4 = strongly agree. Exercise barrier scale
items were reverse scored using the following Likert scale rating: 1 = strongly agree, 2 =
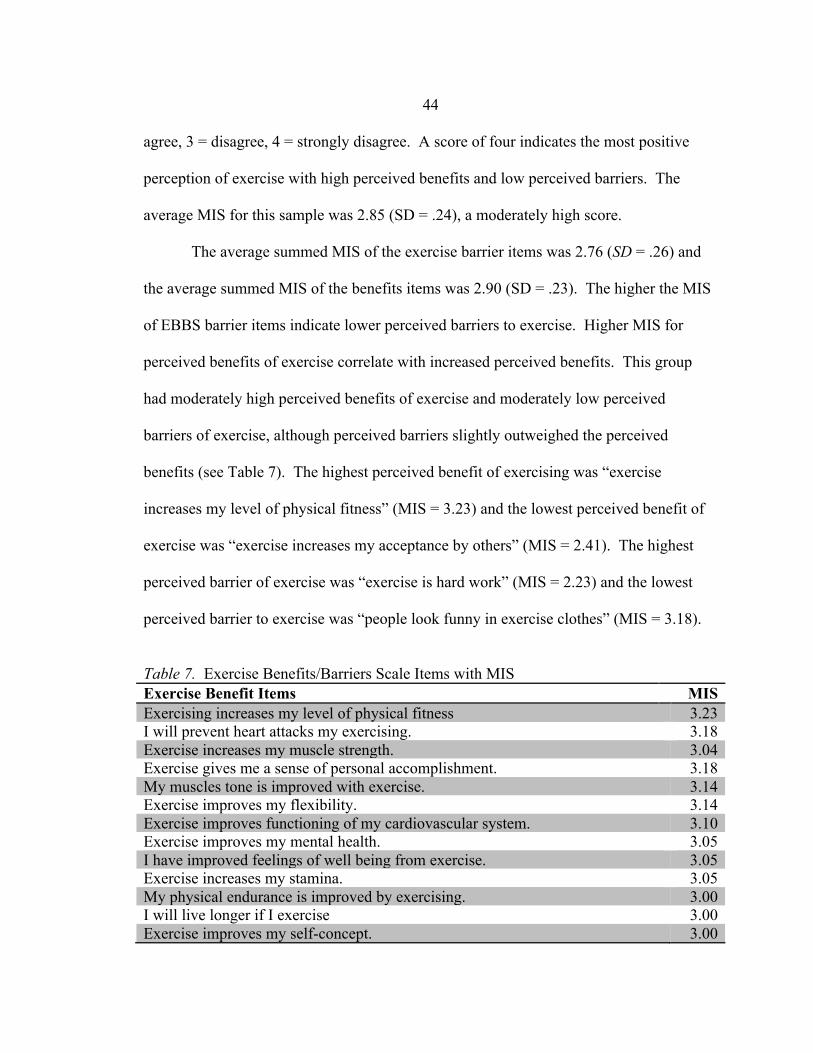
44
agree, 3 = disagree, 4 = strongly disagree. A score of four indicates the most positive
perception of exercise with high perceived benefits and low perceived barriers. The
average MIS for this sample was 2.85 (SD = .24), a moderately high score.
The average summed MIS of the exercise barrier items was 2.76 (SD = .26) and
the average summed MIS of the benefits items was 2.90 (SD = .23). The higher the MIS
of EBBS barrier items indicate lower perceived barriers to exercise. Higher MIS for
perceived benefits of exercise correlate with increased perceived benefits. This group
had moderately high perceived benefits of exercise and moderately low perceived
barriers of exercise, although perceived barriers slightly outweighed the perceived
benefits (see Table 7). The highest perceived benefit of exercising was “exercise
increases my level of physical fitness” (MIS = 3.23) and the lowest perceived benefit of
exercise was “exercise increases my acceptance by others” (MIS = 2.41). The highest
perceived barrier of exercise was “exercise is hard work” (MIS = 2.23) and the lowest
perceived barrier to exercise was “people look funny in exercise clothes” (MIS = 3.18).
Table 7. Exercise Benefits/Barriers Scale Items with MIS Exercise Benefit Items MIS Exercising increases my level of physical fitness 3.23 I will prevent heart attacks my exercising. 3.18 Exercise increases my muscle strength. 3.04 Exercise gives me a sense of personal accomplishment. 3.18 My muscles tone is improved with exercise. 3.14 Exercise improves my flexibility. 3.14 Exercise improves functioning of my cardiovascular system. 3.10 Exercise improves my mental health. 3.05 I have improved feelings of well being from exercise. 3.05 Exercise increases my stamina. 3.05 My physical endurance is improved by exercising. 3.00 I will live longer if I exercise 3.00 Exercise improves my self-concept. 3.00

45
Table 7. Exercise Benefits/Barriers Scale Items with MIS - Continued Exercise Benefit Items MIS Exercise improves the way my body looks. 2.95 Exercise decreases feelings of stress and tension for me. 2.82 My disposition is improved with exercise. 2.95 Exercising will keep me from having high blood pressure. 2.91 Exercise helps me sleep better at night. 2.91 Exercising increases my mental alertness. 2.86 Exercise improves the quality of my work. 2.86 Exercise improves overall body functioning for me. 2.86 I enjoy exercise 2.77 Exercise allows me to carry out normal activities without becoming tired. 2.77 Exercising makes me feel relaxed. 2.67 Exercise helps me decrease fatigue. 2.64 Exercising is good way for me to meet new people. 2.55 Exercise is good entertainment for me. 2.50 Exercise lets me have contact with friends and persons I enjoy. 2.45 Exercise increases my acceptance by others. 2.41 Exercise Barrier Items MIS I think people in exercise clothes look funny. 3.18 It costs too much to exercise. 3.00 Exercise facilities do not have convenient schedules for me. 2.95 Exercise improves the way my body looks. 2.95 I am too embarrassed to exercise. 2.91 Places for me to exercise are too far away. 2.90 There are too few places for me to exercise. 2.86 Exercise takes too much time from family relationships. 2.86 Exercise takes too much time from my family responsibilities. 2.82 My family members do not encourage me to exercise. 2.81 My spouse (or significant other) does not encourage exercising. 2.80 Exercising takes too much of my time. 2.52 I am fatigued by exercise. 2.45 Exercise tires me. 2.41 Exercise is hard work for me. 2.23 Note: A 1 - 4 Likert scale is used to score the EBBS. Exercise benefit items utilize the following Likert scale: 1 = strongly disagree, 2 = disagree, 3 = agree, 4 = strongly agree; Higher MIS scores of benefit items indicate higher perceived benefits. Exercise barrier scale items were reverse scored using the following Likert scale rating: 1 = strongly agree, 2 = agree, 3 = disagree, 4 = strongly disagree. Higher MIS scores of barriers items indicated lower perceived barriers.
46
Perceived Benefits and Barriers of Healthy Eating
The HEBBS was scored using a 1-4 Likert scale. Healthy eating benefit items
were scored using the following Likert scale: 1 = strongly disagree, 2 = disagree, 3 =
agree, 4 = strongly agree. Healthy eating barrier scale items were reverse scored using
the following Likert scale rating: 1 = strongly agree, 2 = agree, 3 = disagree, 4 = strongly
disagree. A score of four indicates the most positive perception of healthy eating with
high perceived benefits and low perceived barriers. The overall MIS was 2.76 ( SD =
.30).
The MIS of healthy eating benefit items was 2.95 (SD = .21), a moderately high
perception healthy eating benefits. The highest perceived benefit of healthy eating was
“healthy eating helps me be more fit” (MIS = 3.22) and the lowest perceived benefit was
“eating according to the food guide pyramid makes me look more attractive” (MIS =
2.70).
The MIS of healthy eating barriers was 2.57 (SD = .27), a moderately low
perception of healthy eating barriers. The highest perceived barrier to healthy eating was
that “healthy eating limits choices when eating out” (MIS = 2.25) and the lowest
perceived healthy eating barrier was “healthy eating is unappetizing” (MIS = 3.08) (see
Table 8).

47
Table 8. Healthy Eating Benefit and Barriers Scale Items with MIS Healthy Eating Benefit Items MIS Healthy eating helps me to be more fit. 3.22 Healthy eating makes me feel better. 3.17 Healthy eating helps me to lose weight. 3.12 Reducing the fat in my diet reduces my chances of getting coronary artery heart disease.
3.12
Increasing the fiber in my diet reduces my chances of getting colon (bowel) cancer.
2.96
Eating according to the food guide pyramid helps me to stay healthier.
2.79
Eating according to the food guide pyramid helps me to have more energy.
2.75
Reducing the fat in my diet reduces my chances of getting breast cancer.
2.74
Eating according to the food guide pyramid makes me look more attractive.
2.70
Healthy Eating Barrier Items MIS Healthy eating is unappetizing. 3.08 Health eating is inconvenient. 2.80 It takes too much time to shop for healthy foods. 2.72 Healthy eating is difficult due to the influences of family/friends.
2.56
It takes too much time to prepare healthy meals. 2.58 Healthy eating is difficult because experts keep changing their advice.
2.50
Healthy eating is too expensive. 2.32 Health eating means giving up foods that I like. 2.32 Healthy eating limits my choices when I eat out. 2.25 Note: The HEBBS was scored using a 1-4 Likert scale. Healthy eating benefit items were scored using the following Likert scale: 1 = strongly disagree, 2 = disagree, 3 = agree, 4 = strongly agree. Higher MIS of benefit items indicate higher perceived benefits. Healthy eating barrier scale items were reverse scored using the following Likert scale rating: 1 = strongly agree, 2 = agree, 3 = disagree, 4 = strongly disagree. Higher MIS of barrier items indicate lower perceived barriers.

48
CHAPTER 5
DISCUSSION
The purpose of this descriptive study was to gain an understanding of rural
women’s knowledge of CHD risk factors, current HPBs, and perceived barriers and
benefits to HPBs guided by the conceptual framework of the HPM (Pender et al., 2006).
The HPM theorizes that HPBs are the outcome of a complex interaction of personal
characteristics, experiences, and behavior-specific cognitions that result in the execution
of HPBs. The research questions posed were:
a) What is the CHD knowledge of women living in rural areas?
b) Are women in a rural western state engaged in HPBs?
c) What benefits and barriers to HPBs do rural women perceive related to diet and
exercise?
The findings of this study provided evidence that young women living in rural areas of
Northwest Montana are knowledgeable about some aspects of CHD risk factors, are
practicing HPBs often to sometimes, perceived benefits to exercise and healthy eating are
moderately high, and perceived barriers to exercise and healthy eating are moderately
low. These findings yield information for healthcare providers caring for premenopausal
women in less populated areas and highlight opportunities for future research needs in
this population.
49
Sample Demographics
The racial composition of the sample group (White; n = 23, Native American or
Alaskan Native; n = 1) is consistent with Montana’s predominantly white (90%)
population followed by Native American population (6.4%). The researcher did not
focus data collection in clinics that specifically serve Native Americans, such as Indian
Health Service clinics, but did collect data within one of Montana’s seven designated
Indian reservations. Most subjects reported ethnicity as non-Hispanic (n = 23) which is
consistent with Montana data with non-Hispanic ethnicity at 87.5% (US Department of
Commerce US Census Bureau, 2012).
The percent of medically uninsured participants in this study was 56% (n = 14).
Clinic 1 had disproportionately high levels of uninsured individuals; 10 of the total 14
participants who reported not having insurance were from Clinic 1. Clinic 1 serves
uninsured or underinsured people seeking healthcare and may explain the
disproportionate number of uninsured individuals compared to the other clinics. Reports
from 2010 indicate that 18.8% and 24.6% of people under the age of 65 years old in
Montana micropolitan and rural counties, respectively, are uninsured (Bailey, 2013).
Clinic 1 is located in a micropolitan county.
Eighteen participants reported incomes under $35,000 and six participants
reported incomes of at least $35,000 per year. The median Montana household income is
$45,324 (US Census Bureau, 2013). The income numbers may be skewed towards the
lower end of the scale due to 44% (n = 11) of the sample seeking healthcare at a free
clinic (Clinic 1) for uninsured and underinsured individuals. Clinic 1 had the following

50
incomes reported: seven participants reported income less than $15,000; two reported
$15,001-$24,999; and two reported $35,000-$49,999 income. Clinic 2, 3, and 4
combined yielded the following reported incomes: two reports of less than $15,000;
three reports of $15,001-$24,999; one report of $25,000-$34,999; two reports of $35,000-
$49,999; three reports of $50,000-$74,999; one report of $100,000 and over income; and
one no response.
Health-Related Questions
Tobacco use by adolescents and adults, males and female, is higher in most rural
counties than urban counties in the U.S. (Gamm et al., 2003). Seven participants (28%)
reported current tobacco use, which compares to a state rate of 18.5% (CDC, 2011).
Most participants reported successful completion of General Education Development
testing (GED) or completing some college (n = 21, 84%) which is near the state rate of
91.4% for adults with at least a GED or higher (US Census Bureau, 2013).
Rural communities are known to have higher rates of obesity compared to urban
areas (Rural Assistance Center, 2013), a finding supported in this study. A majority of
participants (72%, n = 18) self-reported heights and weights that were calculated to a
body mass index (BMI) as either overweight or obese according to NHLBI (n.d.)
guidelines. The NHLBI BMI standards indicate a BMI < 18.5 as underweight, 18.5 -
24.9 is considered normal weight, 25 – 29.9 is overweight, and ≥ 30 is considered obese.
This finding is also consistent with reports of 56% of Northwest Montana’s population
considered overweight or obese (MDPHHS, 2010). Obesity is correlated with lower

51
education levels, lower income, and increasing age which are common characteristics of
rural areas (Rural Assistance Center, 2013).
Coronary Heart Disease Knowledge
The mean score of the CHD Knowledge Test was 71% with a range of scores
from 40-88%. This is similar to other research using CHD Knowledge Test tools
designed for women where mean scores have been reported at 70.5% (Thanavaro et al.,
2010a) and 64% (Oliver-McNeil & Artinian, 2002). Participants in this study correctly
identified CHD risk factors of obesity, exercise, cholesterol, HTN, and diabetes and the
signs of a heart attack. However, only 15 (60%) of participants correctly identified that
women are more likely to get CHD after menopause, nine (36%) women correctly
identified that once women are diagnosed with CHD they are more likely than men to
become seriously ill or die, and 9 (36%) women identified that there is no evidence that
hormone replacement therapy prevents CHD in females. To qualify for study
participation, participants must have reported premenopausal status; therefore they may
not have knowledge of the increased risk of CHD after menopause. Primary care
screening and education is based on age and personal risk factors. If female clients have
not started menopause, it is unlikely a healthcare practitioner is discussing the effects of
menopause on CHD risk factors. National campaigns, along with routine wellness visits
to healthcare providers, focus largely on the major CHD risk categories of diet, exercise,
and obesity. This may explain why the women in this study were more knowledgeable
about non female-specific CHD risk factors.

52
Health Promoting Behaviors
The overall mean item score (MIS) for the Health Promoting Lifestyle Profile II
(HPLP II) was 2.49 (SD = .4) on a Likert scale of 1 – 4 for this study, indicating
participants “sometimes” or “often” partake in HPBs. The overall MIS is slightly higher
than research studies from urban sample populations that yielded overall MIS of 2.4
(Thanavaro et al., 2010) and 2.44 (Oliver-McNeil & Artinian, 2002) and slightly lower
than a rural sample population that yielded overall MIS of 2.89 (Pullen, Walker, &
Fiandt, 2001).
Participants rated the following health promoting activities from highest to
lowest: interpersonal relations, spiritual growth, nutrition, stress management, physical
activity, and health responsibility. Identically ranked leading HPBs were also found in
McElligot, Capitulo, Morris, and Clicks’ (2010) research from registered nurses age 23-
64 years old. Other researchers have also reported nutrition and interpersonal relations in
the highest ranked HPBs in their sample populations (Oliver-McNeil & Artinian, 2002;
Thanavaro et al.; 2010, Pullen et al., 2001).
The lowest ranked HPBs in this study sample were stress management, physical
activity, and health responsibility. Physical activity has been reported in the lowest
categories of HPLP II subscales in other studies (McElligot et al., 2010; Oliver-McNeil &
Artinian, 2002; Pullen et al., 2001; Thanavaro et al., 2010a). Research based in urban
and rural populations (McElligot et al., 2010; Oliver-McNeil & Artinian, 2002; Pullen et
al., 2001; Thanavaro et al., 2010) have reported similar low rankings of physical activity

53
on the HPLP II, which suggests that living in a rural location, may have little influence on
this specific HPB.
Health responsibility ranked the lowest on the HPLP II in this sample population.
Discussing health concerns with a health professional was the highest ranked health
responsibility item while attending educational programs on personal healthcare and
reading or watching TV programs to improve health were ranked lowest. This sample of
participants reported relatively close proximity to a healthcare provider with 60% of
participants in this sample living within 10 miles of a healthcare provider. The
participants in the sample ranked the following sources for health information from most
to least used: healthcare providers, family and friends, office nurses, and media sources.
The health-seeking behaviors of rural-living people may vary from urban-living people
where utilization of self-care and advice from laypersons may be implemented prior to
seeking professional healthcare based on severity of symptoms (Buehler, Malone, &
Majerus-Wegerhoff, 2010). Ranking health responsibility as the lowest HPB on the
HPLP II may reflect individual beliefs about seeking healthcare, lack of knowledge for
when to seek healthcare, lack of concern for personal health, or inability to physically or
financially access healthcare. Another possibility for the low HPLP II health
responsibility score in this sample population may be the young age of the participants
who are less likely to experience chronic and acute diseases that require routine and
frequent healthcare.

54
Perceived Benefits and Barriers of Exercise
Participants in this study reported a moderately high perception of positive effects
of exercise using the EBBS. However, barriers to exercise were perceived slightly more
than benefits to exercise. According to Pender (2006), research supports that perceived
barriers have a greater predictive value than perceived benefits of HPBs. This may help
explain why physical activity was ranked second to last in the HPLP II for HPBs.
The highest perceived barriers to exercise in this sample included “exercise tires
me,” “I am fatigued by exercise,” and “exercise is hard work for me.” Lowest perceived
barriers to exercise included “people in exercise clothes look funny,” “it costs too much
to exercise,” “I am too embarrassed to exercise,” “exercise takes too much time from my
family relationships,” and “there are too few places to exercise.” Walker et al. (2006)
found similar top ranked barriers to exercise in her rural sample population that included
“exercise is tiring,” “exercise is hard work,” and “exercise takes too much time.” Other
barriers to physical activity in rural areas have been reported as weather, distance to
health facilities, lack of time, and accessibility to transportation to reach recreation areas
(Eyler & Vest, 2002; Adachi-Mejia et al., 2010; Atkinson et al., 2007). Interestingly,
topics of distance and access to gyms were not perceived as top barriers to physical
activity in this rural group of study participants (Eyler & Vest, 2002).
The highest perceived benefits to exercise according to the EBBS questionnaire
were “exercise increases my physical fitness,” “I will prevent heart attacks by
exercising,” “exercises increases muscle strength,” and “exercises gives me a sense a
personal accomplishment.” The highest scored perceived benefits of physical activity

55
indicate an understanding of the benefits of exercise, including its positive effects on
heart disease. This knowledge was also reflected in the CHD Knowledge Test for
Women that reflected an understanding of the positive effects of exercise on heart health.
Perceived Benefits and Barriers of Healthy Eating
The highest scored perceived benefits of healthy eating in the study sample
according to the HEBBS questionnaire were “healthy eating helps me to be more fit,”
“healthy eating makes me feel better,” “reducing the fat in my diet reduces my chances of
getting CHD” and “healthy eating helps me to lose weight.” Walker and colleagues
(2006) reported similar findings with use of the HEBBS in rural women with top scored
benefits of “healthy eating helps me to be more fit” and “it reduces the chances of CHD.”
The highest perceived barriers to healthy eating were “healthy eating limits my
choices when I eat out,” “healthy eating means giving up foods that I like,” and “healthy
eating is too expensive.” Walker and colleague (2006) study participants also reported
highest perceived barriers to healthy eating as limited menu choices when eating out,
having to give up foods they like, and being confused by experts continually changing the
recommendations. Yates and colleagues (2012) reported that perceived barriers to
healthy eating had the strongest impact on healthy eating behaviors at all-time points in a
sample of rural, midlife females participating in a one year interventional study that
sought to understand the effects of cognitive-perceptual variables on healthy eating
habits. In this study sample, perceived benefits to healthy eating were scored slightly

56
higher than perceived barriers to healthy eating. Though the benefits were scored higher,
nutrition was scored as one of the top three practiced HPBs on the HPLP II.
Study Limitations
This study was conducted in four different health clinics over a short duration of
time with a total sample population of 25 females. Participants were offered a small
incentive to participate in the study, specifically $5 cash or $5 gift certificate. The
sample population was predominantly white, non-Hispanic, and indicated incomes below
$40,000. Recruitment of participants took place at healthcare clinics only.
Generalizability of the study findings are limited by the demographics of the sample and
data collection methods. Further data collection from larger sample populations is
needed to explore the findings in this study.
Self-report of height and weight, which was used to calculate BMI, may be
unreliable. Research indicates that women are more likely to under report their weight
and overestimate their height which leads to falsely low BMI calculations (Wen &
Kowaleski-Jones, 2012). Predictors of under-reporting BMI include female sex, obesity,
being White, and age ≥ 60 years old (Wen & Kowaleski-Jones, 2012). However, the
results from Wen and Kowaleski-Jones’ (2012) study yielded small differences between
self-reported and measured BMIs with none of the self-reported and actual BMIs
differing by more than 1 BMI unit. Based on this information, participants may have
provided height and weight data that provided falsely low BMIs. According to the Rural
Assistance Center (2013), there is also a correlation between obesity and lower income.

57
Collecting data from a clinic that serves underinsured and uninsured people may have
increased the overall sample population mean calculated BMI results.
Rural was defined by non-metropolitan counties as defined by the OMB (USDA:
ERS, 2007.) Micropolitan and non-core counties were utilized in this study with the
majority of participants coming from a micropolitan county. Micropolitan counties
contain larger populations than non-core counties and may have influenced the
accessibility the participants had to healthcare and other health-related services and
information.
Two of the instruments used in this study have limited use in rural populations.
The CHD Knowledge Test for Women was developed in a Midwest city at a major chest
pain center (Thanavaro et al., 2010b). Based on current literature searches, the
instrument has only been used in urban populations (Thanavaro et al., 2010a). Lack of
testing the CHD Knowledge Tool for Women in rural populations limits its reliability and
validity within this sample population. The HEBBS was developed by Walker and
colleagues (2006) and designed after the Exercise Benefits and Barriers Scale for their
research titled “Determinants of Older Rural Women's Activity and Eating.” Only one
other research article was found to use the HEBBS (Grizzle, 2009). The limited use of
the HEBBS instrument in other research limits its reliability and validity within this
study.
58
Implications for Further Research
The CHD Knowledge Tool for Women yielded scores that were less than
expected. However, the limited sample size and limited use of the CHD Knowledge Test
for Women, especially in rural populations, indicate that further use of the tool is
warranted before drawing conclusions about the use of this instrument in rural
populations.
This study identified benefits and barriers to both healthy eating and exercise
based on standardized questionnaires. The questionnaires did not allow for personalized
reports of perceived barriers and benefits to healthy eating and exercise. Based on
qualitative and descriptive research in rural women (Adachi-Mejia et al., 2010; Atkinson
et al., 2007), perceived barriers and benefits of HPBs in rural populations may be more
individualized than the standard questionnaire items. Future research is needed in rural
women on their perceived benefits and barriers to healthy eating and exercise to
understand their unique perceptions related to these topics.
When comparing the average score of the EBBS barrier items and the HEBBS
barrier items, barriers to healthy eating were perceived more than barriers to exercise.
Based on Pender and colleagues’ (2006) review of studies on the HPM and its constructs
that indicated barriers have greater influence over health actions than benefits, it would
suggest that physical activity should have scored higher than nutrition on the HPLP II for
HPBs. However, the HPM describes the execution of HPBs as a complex process of
influencers that involve personal factors and numerous behavior-specific cognitions and
affect that lead to health actions. The limited data that was collected in this survey is not

59
sufficient to draw relationships between variables due to other missing behavior-specific
cognitions, such as perceived self-efficacy and activity-related affect, that have also
shown to influence HPBs. Future research using more of the HPM constructs to
understand HPBs is necessary to understand the relationships between perceived barriers
and benefits and the execution HPBs.
Implications for Practice
The CHD Knowledge Tool for Women indicated that women in Northwest
Montana may not be aware of women-specific risk factors of CHD. As reported by other
researchers, women-specific topics of breast cancer and menopause have historically
dominated the focus of women’s health (Oliver-McNeil & Artinian, 2002). The
healthcare provider must ensure a personal knowledge of CHD in women and be ready to
discuss the risk of CHD with their female clients. Talking about menopause with women
may be an ideal time to discuss the increasing risks of CHD that coincide with
menopause.
Residents of rural communities struggle with rising rates of obesity (Gamm et al.,
2010). Though participants in this study ranked nutrition in the top three HPBs, reported
weights suggest there may be room for improvement of healthy eating. Unhealthy
weights may also be an outcome of low physical activity. Characteristics of rural people
that are associated with obesity include lower incomes, less education, and older age
(Gamm et al., 2010). Access to nutrition education, physical education in schools, and
distance to exercise facilities also are potential obstacles to maintain healthy weight in the

60
rural environment (Gamm et al., 2010). Healthcare providers must be cognizant of
perceived benefits and barriers to healthy eating and exercise so they can optimize
management of their client’s health. Healthcare professionals that seek to gain an
understanding of their patient’s strengths and weakness (perceived or real) can design
plans that are tailored to each patient’s needs. Likewise, the healthcare provider that
takes the time to understand their client’s knowledge base of CHD will have a better
understanding of the educational needs of their client.
Topics of CVD in women and characteristics of rural people should be considered
in advanced practice and undergraduate nursing curriculums, especially programs that
emphasize rural nursing. Rural people have been shown to have unique characteristics
and this study indicates that rural living females may not be participating in optimal
levels of HPBs nor have optimal knowledge regarding their CHD risk factors. Advanced
practice nurses and registered nurses who plan to practice in rural areas should be
mindful of the unique CVD risk factors in women, the unique barriers women may face
to participating in HPBs in rural areas, and the complex process that takes place to
execute a HPB.
Conclusion
The findings of this study support that there is a need for women-specific heart
disease risk factors education and that participation in HPBs can be increased in women
in living in rural Northwest Montana. Understanding how to maximize HPBs is essential
in preventing heart disease and promoting general wellness. Continued research in this

61
population is needed to better understand the relationship between heart disease
knowledge and perceived barriers and benefits to healthy eating and exercise.
Healthcare providers working in rural areas should be mindful of their client’s
individualized needs that may be unique to living in a less populated area. Healthcare
professional must also be aware of certain demographics that may be more prevalent in
less populated areas. The information from this study provides a limited look at some of
the characteristics, CHD knowledge, and perceived barriers and benefits to healthy eating
and exercise in rural-living Montana women that may help healthcare providers develop
more client-centered education and interventions to promote wellness in their
premenopausal clients.

62
REFERENCES CITED

63
Adachi-Mejia, A.M., Drake, K.M., MacKenzie, T.A., Titus-Ernstoff, L., Longacre, M.R., Hendricks, K.M., Beach, M.L., M.D., & Dalton, M.A. (2010). Perceived intrinsic barriers to physical activity among rural mothers. Women’s Journal of Health, 19(12), 2197-2002. American Heart Association. (2009). Women and cardiovascular disease: Montana. http://www.heart.org/idc/groups/heart-public/@wcm/@adv/documents/downloadable/ucm_315532.pdf. American Heart Association. (2011a). Understand your risk of heart attack. Retrieved from http://www.heart.org. American Heart Association. (2012). Go red for women: about the movement. Retrieved from http://www.goredforwomen.org/about_the_movement.aspx Atkinson, N., Billing, A., Desmond, S., Gold, R., & Tournas-Hardt, A. (2007). Assessment of the nutrition and physical activity education needs of low-income, rural mothers: can technology play a role? Journal Of Community Health, 32(4), 245-267. Bailey, J. (2013). Health insurance coverage in Montana: The rural implications. Center for Rural Affairs, No. 19. Bales, R.L., Winters, C.A., & Lee, H.J. (2006). Health needs and perceptions of rural persons. In H.J. & C.A. Winters (Eds.), Rural nursing: Concepts, theory and practice (2nd ed., pp. 53-65). New York: Springer. Bandura, A. (1986). Social foundations of thought and action: A social cognitive theory. Englewood Cliffs, NJ; Prentice-Hall Inc. Broyles, R.W., McAuley, W.J., & Baird-Holmes, D. (1999). The medically vulnerable: Their health risks, healthy status, and use of physician care. Journal of Health Care for the Poor and Underserved, 10(2): 186-200. Buehler, J.A., Malone, M., Majerus-Wegerhoff, M. (2010). Patterns of response to symptoms in rural residents: the Symptom-Action-Time-Line Process. In C.A. Winters & H.J. Lee (Eds.), Rural nursing concepts, theory, and practice, 3rd ed. (153-178). New York: Springer Publishing.
64
Cossman, J. S., James, W. L., Cosby, A. G., & Cossman, R. E. (2010). Underlying causes of the emerging nonmetropolitan mortality penalty. American Journal of Public Health, 100(8), 1417-1419. Centers for Disease Control and Prevention. (2007). Skin cancer module: Practice exercises. Retrieved from http://www.cdc.gov/excite/skincancer/mod13.htm. Centers for Disease Control and Prevention. (2010). Heart disease and stroke prevention: Addressing the nation’s leading killers: At a glance 2011. Retrieved from: http://www.cdc.gov/chronicdisease/resources/publications/AAG/dhdsp.htm. Centers for Disease Control and Prevention. (2011). State highlights: Montana. Retrieved from http://www.cdc.gov/tobacco/data_statistics/state_data/state_highlights/2010/states/montana/index.htm. Collins, K.M., Dantico, M., Shearer, N.B.C., & Mossman, K.L. (2004). Heart disease awareness among college students. Journal of Community Health, 29(5), 405-420. Committee on The Future of Rural Health Care. (2005). Quality through collaboration: The future of rural health care. The National Academies Press. Retrieved from http://www.nap.edu/openbook.php?record_id=11140. ISBN: 978-0-309-09439-9. Crouch, R. & Wilson, A. (2011). An exploration of rural women's knowledge of heart disease and the association with lifestyle behaviours. International Journal of Nursing Practice, 17(3), p. 238-245. DOI: 10.1111/j.1440-172X.2011.01931.x. Dillon, T. & Sorenson, C. (2009). 2009 Montana county health profiles: Demographics, health status indicators, health resource assessment. Montana Department of Public Health and Human Services. Retrieved from http://www.dphhs.mt.gov/statisticalinformation/index.shtml. Eyler, A., & Vest, J. (2002). Environmental and policy factors related to physical activity in rural white women. Women & Health, 36(2), 111-121. Feather, N.T. (Ed.) (1982). Expectations and actions: expectancy-value models in psychology. Hillsdale, NJ: Lawrence Erlbaum Associates Inc. Framingham Heart Study. (2011). Framingham Heart Study: A Project of the National Heart, Lung and Blood Institute and Boston University. Retrieved from http://www.framinghamheartstudy.org/

65
Gamm, L.D., Hutchinson, L.L., Dabney, B.J., & Dorsey, A.M. (Eds.) (2003). Rural healthy people 2010: A companion document to healthy people 2010. Volume 1. College Station, Texas: The Texas A&M University System Health Science Center, School of Rural Public Health, Southwest Rural Health Research Center. Grizzle, R. (2009). Occupational stress, dietary self-efficacy, eating habits and body composition in police officers. (Doctoral dissertation.) Retrieved from CINAHL database. Accession number: 2010537055. Hamner, J. & Wilder, B. (2008). Knowledge and risk of cardiovascular disease in rural Alabama women. Journal of the American Academy of Nurse Practitioners, 20(6), 333-338. DOI: 10.1111/j.1745-7599.2008.00326.x. Hamner, J.B. & Wilder, B. (2010). Perceptions and predictions of cardiovascular disease of Alabama women in a rural county. Applied Nursing Research, 23(2), 80-85. DOI: 10.1016/j.apnr.2008.06.004. Hankinson, S.E., Colditz, G.A., Manson, J.E., & Speizer, F.E. (Eds.) Writers: Dart, H. & Ryan, C.T. (2001). Healthy women, healthy lives. New York, NY: Simon and Schuster. Hegney, D., McCarthy, A., Rogers-Clark, C., & Gorman, D. (2002). Why nurses are resigning from rural and remote Queensland health facilities. Collegian, 9(2), 33-39. Hsia, J. (contributor). (2007). Women’s Heart Foundation. Retrieved from http://www.womensheart.org. Jones, A. & Goza, F. (2008). Rural, suburban, and urban differences in the self-diagnosis of coronary heart disease in the United States. Journal Biosocial Sciences, 40, 895-909. DOI: 10.1017/S0021932008002769. Keyhani, S., Scobie, J.V., Hebert, P.L., & McLaughlin, M.A. (2008). Gender disparities in blood pressure control and cardiovascular care in a national sample of ambulatory care visits. American Heart Association Hypertension; Hypertension, 51, 1149-1155. Kochanek K.D., Xu J.Q., Murphy S.L., Miniño A.M., Kung H.C. (2011). National vital statistics reports, 60(3). Konicki, A. (2012). Knowledge of Cardiovascular Risk Factors, Self-nurturance, and Heart-Healthy Behaviors in Women. Journal Of Cardiovascular Nursing, 27(1), 51-60. Lee, H.J. & Winters, C.A. (2004). Testing rural nursing theory: Perceptions and needs of service providers. Online Journal of Rural Nursing and Health Care, 4(1), Spring 2004.
66
Long, K.A. & Weinert, C. (1989). Rural nursing: developing the theory base. Scholarly Inquiry for Nursing Practice: An International Journal, 3, 113-127. Long, K.A. & Weinert, C. (2010). Rural nursing: developing the theory base. In Winters, C.A. and Lee, H.J. (Eds.), Rural nursing: Concepts, theory, and practice (3rd ed., 3-18). New York: Springer. McCance, K.L., Huether, S.E., Brashers, V.L., & Rote, N.S. (2010). Pathophysiology: the biologic basis for disease in adults and children. 6th ed. Mosby Elsevier. McElligot, D., Cpitulo, K.L., Morris, D.L., Click, E.R. (2010). The effect of holistic program on health-promoting behaviors in hospital registered nurses. Journal of Holistic Nursing, July. DOI: 10.1177/0898010110368860. Mendis, S., Puska, P., & Norrving, B. (Eds.). (2011). Global Atlas on Cardiovascular Diseases Prevention and Control. Published by the World Health Organization, World Heart Federation, and World Stroke Organization. Retrieved from http://whqlibdoc.who.int. Montana Cardiovascular Health Program. (n.d.). State Facts Handout for Go Red. Retrieved from www.dphhs.mt.gov/publichealth/cardiovascular/documents/StateFactsHandoutforGoRed.pdf. Montana Department of Public Health and Human Services. (2010). Montana regional health profile, 2010 Behavioral Risk Factor Surveillance System. Retrieved from: http://brfss.mt.gov/. Montana Department of Public Health and Human Services and Montana Cardiovascular Health Program. (2007). The burden of heart disease and stroke in the Big Sky State. Retreived from http://www.dphhs.mt.gov. Mosca, L., Banka, C.L., Benjamin, E.J., Berra, K., Bushnell, C., Rowena, D., ...Wenger, N.K. (2007). Evidence-based guidelines for cardiovascular disease prevention in women: 2007 update. Journal of the American College of Cardiology, 49(11), 1230-1250. DOI: 10.1016/j.jacc.2007.02.020. Mosca, L., Ferris, A., Fabunmi, R., & Robertson, R.M. (2004). Tracking women’s awareness of heart disease: An American Heart Association national study. Circulation, 109, 573-579. doi: 10.1161/01.CIR.0000115222.69428.C9. Mosca, L., Mochari, H., Christian, A., Berra, K., Taubert, K., Mills, T., Burdick, K.A., & Simpson, S.L. (2006). National study on women’s awareness, preventive action, and barriesr to cardiovascular health. Circulation, 113, 525-534.

67
Mosca, L., Mochari-Greenberger, H., Dolor, R.J., Newby, L.K., & Robb, K.J. (2010). Twelve-year follow-up of American women’s awareness of cardiovascular disease risk and barriers to heart health. Circulation: Cardiovascular Quality and Outcomes, 3(2), 120-127. DOI: 10.1161/circoutcomes.109.915538 National Heart, Lung and Blood Institute. (n.d.) Calculate your body mass index. Retrieved from http://www.nhlbi.nih.gov/guidelines/obesity/BMI/bmicalc.htm. National Heart Lung and Blood Institute. (2011a). What is atherosclerosis. Retrieved February 29, 2012 from http://www.nhlbi.nih.gov. National Heart Lung and Blood Institute. (2011b). Who is at risk for heart disease? Retrieved from http://www.nhlbi.nih.gov/health/health-topics/topics/hdw/atrisk.html. National Institute of Aging. (2012). Menopause. Retrieved from United States Department of Healthy and Human Services: http://www.nia.nih.gov/health/publication/menopause Oliver-McNeil, S., & Artimian, N.T. (2002). Women's perception of personal cardiovascular risk and their risk-reducing behaviors. American Journal of Critical Care, 11(3), 221-227. Office of Management and Budget. (November 20, 2008). OMB Bulletin No. 09-01. Paluck, E.C., Allerdings, M., Kealy, K., Dorgan, H. (2006). Health promotion needs of women living in rural areas: an exploratory study. Canadian Journal of Rural Medicine, 11(2), 111-116. Pender, N.J. (1996). Health Promotion in Nursing Practice (3rd ed.). Stamford, CT: Appleton & Lange. Pender, N.J., Murdaugh, C.L., & Parsons, M.A. (2006). Health promotion in nursing practice (5th ed.). Upper Saddle River, NJ: Pearson Prentice Hall. Pender, N.J., Murdaugh, C.L., & Parsons, M.A. (2011). Health promotion in nursing practice (6th ed.). Upper Saddle River, NJ: Pearson Prentice Hall. Porta, M. (Ed.) (2008). A dictionary of epidemiology (5th ed.). Oxford University Press. Retrieved from http://jpkc.fudan.edu.cn. Porth, C.M. (2004). Essentials of Pathophysiology: Concepts of Altered Health States. Philadelphia, PA: Lippincott Williams & Wilkins.

68
Pullen, C., Walker, S.N., Fiandt, K. (2001). Determinants of health-promoting lifestyle behaviors in rural older women. Family and Community Health, 24(2), 49-72. Roger, V.L., Go, A.S., Lloyd-Jones, D.M., Adams, R.J., Berry, J.D., Brown, T.M., …Wylie-Rosett, J. (2011a). American Heart Association update: Heart disease and stroke statistics – 2011 update: A report from the American Heart Association. Circulation, 123, e18-e209. doi: 10.1161/CIR.0b013e3182009701. Roger, V.L., Go, A.S., Lloyd-Jones, D.M., Benjamin, E.J., Berry, J.D., Borden, W.B., …Turner, M.B. (2011b). Heart disease and stroke statistics—2012 update. Circulation, 125, e12-e230. doi: 10.1161/CIR.0b013e31823ac046. Rural Assistance Center. (2013). Obesity and weight control. Retrieved from http://www.raconline.org/topics/obesity-and-weight-control/. Sakraida, T.J. (2006). Nola J. Pender 1941-present: health promotion model. In Tomey, A.M. & Alligood, M.R. (Eds.), Nursing theorists and their work (6th ed.) (452-471). St. Louis, MO: Mosby Elsevier. Sechrist, K. Walker, S., Pender, N. (1985). Exercise benefits/barriers scale scoring information. Retrieved from deepblue.lib.umich.edu. Sechrist, K.R., Walker, S.N., & Pender, N.J. (1987). Development and psychometric evaluation of the Exercise Benefits/Barriers Scale. Research in Nursing and Health, 10(6), 357-365. Thanavaro, J.L., Moore, S.M., Anthony, M.K., Narsavage, G., Delicath, T. (2006b). Predictors of poor coronary heart disease knowledge level in women without prior coronary heart disease. Journal of the American Academy of Nurse Practitioners, 18(12), 574-581. Thanavaro, J.L., Thanavaro, S. & Delicath, T. (2010a). Health promotion behaviors in women with chest pain. Heart & Lung, 39(5), 394-403. Thanavaro, J.L., Thanavaro, S. & Delicath, T. (2010b). Coronary heart disease knowledge tool for women. Journal of the American Academy of Nurse Practitioners, 22, 62-69. The Nurses' Health Study. (n.d.). Findings: Some highlights. Retrieved from http://www.channing.harvard.edu/nhs/. Tulane University School of Medicine. (2011). The Bogalusa Heart Study: History of the Bogalusa Heart Study. Retrieved from: http://tulane.edu/som/cardiohealth/.
69
US Census Bureau (2013). State and county quickfacts: Montana. Retrieved from http://quickfacts.census.gov/qfd/states/30000.html. United States Department of Agriculture. (2004). Measuring rurality: Urban-rural continuum codes. Retrieved from: http://www.ers.usda.gov. United States Department of Agriculture: Economic Research Service. (2007). Measuring rurality: what is rural? Retrieved from http://www.ers.usda.gov. United States Department of Commerce United States Census Bureau. (2012). State and county quickfacts: Montana. Retrieved from http://quickfacts.census.gov/qfd/states/30000.html. United States Department of Health and Human Services (February 2008). Designation of Medically Underserved Populations and Health Professional Shortage Areas; Proposed Rule. Federal Register, Volume 73, No. 41. United States Department of Health and Human Services. (2010). Women's health USA 2010. Retrieved from http://mchb.hrsa.gov. United States Department of Health and Human Services, Health Resources and Services Administration, Maternal and Child Health Bureau. (2010). Women's Health USA 2010. Rockville, Maryland: U.S. Department of Health and Human Services. Retrieved from http://mchb.hrsa.gov/whusa10/hstat/hi/pages/208lcd.html. United States Department of Health and Human Services, National Heart Blood & Lung Institute. (2012). Expert panel on integrated guidelines for cardiovascular health and risk reduction in children and adolescents: Summary report. Retrieved from http://www.nhlbi.nih.gov/guidelines/cvd_ped/summary.htm#chap1. United States Department of Health and Human Services Office of Minority Health (2012). Heart disease and American Indians/Alaska Natives. Retrieved from http://minorityhealth.hhs.gov/templates/content.aspx?ID=3025 United States Environmental Protection Agency. (2011). Cardiovascular disease prevalence and mortality. Retrieved from http://cfpub.epa.gov. Utz, S.W. (2008). Diabetes care among rural Americans. In Fitzpatrick, J.J. & Merwin, E, Annual Review of Nursing Research: Focus on Rural Health, (3-39). New York: Springer Publishing Company. Walker, S.N., & Hill-Polerecky, D.M. (1996). Psychometric evaluation of the Health-Promoting Lifestyle Profile II. Unpublished manuscript, University of Nebraska Medical Center.

70
Walker, S.N., Pullen, C.H., Hertzog, M, Boeckner, L., Hageman, P. (2006). Determinants of older rural women’s activity and eating. Western Journal of Nursing Research, 28(4), 449-468. Walker, S.N, Sechrist, K., Pender, N. (1995). Health-Promoting Lifestyle Profile II scoring instructions. Retrieved from http://www.unmc.edu/nursing/Health_Promoting_Lifestyle_Profile_II.htm. Walker, S.N, Sechrist, K.R., Pender, N.J. (1987). The Health-Promoting Lifestyle Profile: development and psychometric characteristics. Nursing Research, 36(2), 76-81. Wen M., Kowaleski-Jones L. (2012). Sex and Ethnic Differences in Validity of Self-reported Adult Height, Weight and Body Mass Index. Ethnicity & Disease 22, 72. Womenheart. (2011). Women heart: the national coalition for women with heart disease: about us. Retrieved from http://www.womenheart.org. World Health Organization. (1998). Health promotion glossary. Retrieved from http://www.who.int. World Health Organization. (2012b). Cardiovascular diseases (CVDs). Retrieved on from http://www.who.int/mediacentre/factsheets/fs317/en/index.html.
Wong, N.D., Black, H.B., & Gardin, J.M. (2005). Preventive cardiology: A practical approach (2nd ed.). United States: McGraw-Hill. Yates, B.C., Pullen, C.H., Santo, J.B., Boeckner, L., Hageman, P.A., Dizona, P.J., & Walker, S.N. (2012). The influence of cognitive-perceptual variables on patters of change over time in rural midlife and older women's healthy eating. Social Science & Medicine, 75(4), 659-667. doi: 10.1016/j.socscimed.2012.01.001. Zuniga, M., Anderson, D., and Alexander, K. (2003). Heart disease and stroke in rural American. In Gamm, L., Hutchinson, L, Dabney, B., and Dorsey, A. Rural people 2010: A companion document to healthy people 2010, 133-136. The Texas A&M University System Health Science Center, School of Rural Public Health, Southwest Rural Health Research Center.

71
APPENDICES

72
APPENDIX A
CORONARY HEART DISEASE KNOWLEDGE TEST FOR WOMEN

73
Coronary Heart Disease Knowledge Test for Women Directions: Circle one best answer. 1. Heart disease related to heart artery blockages develops __________and can easily go undetected. a. fast overnight. b. fast over weeks. c. slowly over months. d. slowly over many years. 2. Obesity ____________________ a. may cause heart disease. b. may prevent heart disease. c. has no effect on heart disease. d. may make the heart become stronger. 3. Which statement is true regarding symptoms of a heart pain or heart attack? a. Chest pain may be a symptom of heart pain or heart attack. b. Chest tightness may be a symptom of heart pain or heart attack. c. Unusual fatigue may be a symptom of a heart pain or heart attack. d. All of the above. 4. Which statement best describes menopause and heart disease related to clogged heart artery? a. Women are less likely to get heart disease after menopause than before. b. Women are more likely to get heart disease after menopause than before. c. Menopause does not increase or decrease the risk of heart disease in women. d. There is evidence that women are less likely to get heart disease after menopause than before. 5. Which statement is true regarding heart attack and stroke in women? a. African American women are more likely than white women to die from a heart attack or stroke. b. African American women are less likely than white women to die from a heart attack or stroke. c. African American and white women have the same chance of dying from a heart attack or stroke. d. African women are more likely to have heart attack than stroke and white women are more likely to suffer from stroke than heart attack.
74
6. High ______________ may cause heart artery blockages. a. cholesterol b. zinc c. iron d. calcium 7. Symptoms of heart pain or heart attack may include_____________ a. neck, shoulder or arm pain. b. back pain. c. dizziness d. all of the above. 8. Which statement is true regarding heart disease from clogged heart artery in women and men? a. Women and men become seriously ill or die equally once they are diagnosed or identified as having heart disease. b. Once women are diagnosed or identified as having heart disease, they are less likely than men to become seriously ill or die. c. Once women are diagnosed or identified as having heart disease, they are more likely than men to become seriously ill or die. d. Clogged heart artery is more common in women and more serious in men. 9. What is the effect of stress on heart disease? a. Stress has no effect on heart disease. b. Stress may prevent heart disease. c. Stress may cause heart disease. d. It has no proof that stress has no effect on heart disease. 10. Which statement is true regarding prevention of heart disease and clogged heart artery in women? a. Vitamin supplement prevents heart disease. b. Reducing dietary salt may cause high blood pressure and heart disease. c. There is no evidence that hormone therapy or replacement prevents heart disease. d. All of the above. 11. What is the relationship between high blood pressure and heart disease? a. High blood pressure will make the heart stronger and able to endure more stress. b. High blood pressure may prevent heart disease. c. High blood pressure has no effect on heart disease. d. High blood pressure may cause heart disease.
75
12. Which statement best describes the relationship between heart disease and stroke? a. It is true that some forms of heart disease may result in stroke. b. It is false that some forms of heart disease may result in stroke. c. It is not certain whether heart disease may result in stroke. d. Heart disease never causes stroke. 13. What is the effect of dietary fat on heart disease? a. A high fat diet may prevent heart disease. b. A high fat diet may cause clogged heart artery. c. A high fat diet does not affect heart disease. d. A low fat diet may cause clogged heart artery. 14. Which statement is true about the effect of alcohol on heart disease? a. Moderate alcohol use (1-2 drinks per day) may cause heart disease. b. Moderate alcohol use (1-2 drinks per day) may prevent heart disease. c. The effect of alcohol in preventing heart disease increases as the amount of alcohol use increases. d. There is no evidence that moderate alcohol use (1-2 drinks per day) may prevent heart disease. 15. Smoking may cause__________ a. high blood pressure. b. heart valve leakages. c. heart artery blockages. d. inflammation of heart muscle. 16. What is the relationship between female hormone and heart disease in women? a. High level of some female hormone may cause heart disease in women. b. Low level of some female hormone may increase heart artery blockages in women. c. Low level of some female hormone may prevent heart disease in women. d. Level of some female hormone has no effect on heart disease in women. 17. Which statement is true regarding the effect of race on heart disease in women? a. The chance of getting heart disease is equal in African American and white women. b. African American women are less likely to have heart disease than white women. c. African American women are more likely to have heart disease than white women. d. Both white and African American women rarely have heart disease.

76
18. How does dietary cholesterol affect heart disease? a. Reducing dietary cholesterol does not affect heart disease. b. Reducing dietary cholesterol may make the heart become smaller. c. Reducing dietary cholesterol may prevent clogged heart artery. d. Reducing dietary cholesterol may cause heart disease. 19. Which statement is true regarding exercise and heart disease? a. Excessive exercise may weaken heart muscle. b. Routine exercise may prevent heart disease. c. A sedentary lifestyle may prevent heart disease. d. The benefit of exercise on the prevention of heart disease is not conclusive so it is not important for me to start a routine exercise program. 20. Symptoms of heart pain or heart attack may include__________ a. shortness of breath. b. sweating. b. nausea. d. all of the above. 21. Which statement is true about the effect of red meat on heart disease? a. Reducing dietary red meat may prevent heart artery blockages. b. Reducing dietary red meat may cause heart artery blockages. c. Reducing dietary red meat does not affect heart disease. d. Reducing dietary red meat may weaken your heart. 22. Which statement best describes the effect of family history on heart disease? a. A family history of heart disease from clogged heart artery does not affect your risk of getting heart disease. b. A family history of heart disease from clogged heart artery may increase your risk of getting heart disease. c. A family history of heart disease from clogged heart artery may decrease your risk of getting heart disease. d. There is no evidence that a family history of heart disease from clogged heart
artery may increase your risk of getting heart disease. 23. What is the relationship between diabetes and heart disease? a. Heart disease is not related to diabetes. b. Diabetes may increase the chance of having a heart attack. c. Diabetes may prevent heart disease. d. Diabetes makes the heart heal faster after a heart attack.
77
24. A risk factor of heart disease related to clog heart artery that cannot be changed is __________ a. smoking. b. heredity. c. obesity. d. high blood pressure. 25. What is the leading cause of health care problems and death in women? a. Heart disease and stroke. b. Breast cancer. c. Diabetes. d. Obesity. ©Copyright J. Thanavaro, S.Thanavaro, & T. Delicath, 2010.

78
APPENDIX B
HEALTH PROMOTING LIFESTYLE PROFILE II

79

80

81
APPENDIX C
EXERCISE BENEFITS/BARRIERS SCALE

82
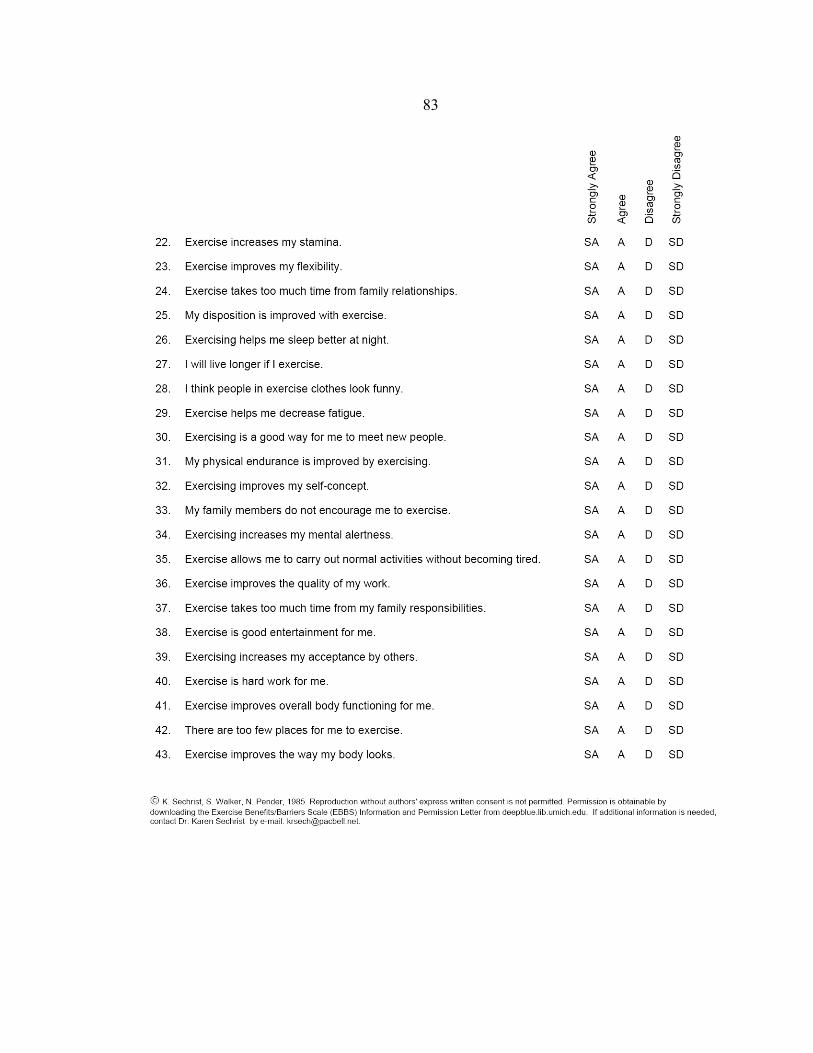
83

84
APPENDIX D
HEALTHY EATING BENEFITS AND BARRIERS SCALE

85
Healthy Eating Benefits and Barriers
DIRECTIONS: Below are statements that relate to ideas about healthy eating (following the recommendations in the daily food guide pyramid). Please indicate the degree to which you agree or disagree with the statements by answering strongly agree, agree, disagree, or strongly disagree. 1. Eating according to the food guide pyramid helps me to stay healthier.
a. Strongly agree b. Agree c. Disagree d. Strongly disagree
2. Healthy eating is unappetizing.
a. Strongly agree b. Agree c. Disagree d. Strongly disagree
3. Increasing the fiber in my diet reduces my chances of getting colon (bowel) cancer.
a. Strongly agree b. Agree c. Disagree d. Strongly disagree
4. Healthy eating is inconvenient.
a. Strongly agree b. Agree c. Disagree d. Strongly disagree
5. Reducing the fat in my diet reduces my chances of getting breast cancer.
a. Strongly agree b. Agree c. Disagree d. Strongly disagree
6. Healthy eating is too expensive.
a. Strongly agree b. Agree c. Disagree d. Strongly disagree

86
7. Reducing the fat in my diet reduces my chances of getting coronary heart disease. a. Strongly agree b. Agree c. Disagree d. Strongly disagree
8. Healthy eating is difficult due to the influence of family/friends.
a. Strongly agree b. Agree c. Disagree d. Strongly disagree
9. It takes too much time to prepare healthy meals.
a. Strongly agree b. Agree c. Disagree d. Strongly disagree
10. Healthy eating makes me feel better.
a. Strongly agree b. Agree c. Disagree d. Strongly disagree
11. It takes too much time to shop for healthy foods.
a. Strongly agree b. Agree c. Disagree d. Strongly disagree
12. Healthy eating helps me to lose weight.
a. Strongly agree b. Agree c. Disagree d. Strongly disagree
13. Healthy eating means giving up foods that I like.
a. Strongly agree b. Agree c. Disagree d. Strongly disagree

87
14. Eating according to the food guide pyramid makes me look more attractive.
a. Strongly agree b. Agree c. Disagree d. Strongly disagree
15. Healthy eating limits my choices when I eat out.
a. Strongly agree b. Agree c. Disagree d. Strongly disagree
16. Healthy eating helps me to be more fit.
a. Strongly agree b. Agree c. Disagree d. Strongly disagree
17. Healthy eating is difficult because experts keep changing their advice.
a. Strongly agree b. Agree c. Disagree d. Strongly disagree
18. Eating according to the food guide pyramid helps me to have more energy.
a. Strongly agree b. Agree c. Disagree d. Strongly disagree
©Copyright S.N. Walker, C.H. Pullen, M. Hertzog, & P. Hageman, 2006.
88
APPENDIX E
STANDARD DEMOGRAPHIC DATA

89
Demographic Data and Health-Related Questions Directions: Choose the best answer that describes your personal characteristics or enter a short answer. Participation is voluntary, and you can choose to not answer any question that you do not want to answer, and you can stop at anytime.
1. Please select the age range that includes your age. o 21-29 years old o 30-39 years old o 40-49 years old o 50-55 years old
2. What is your height in feet and inches?
3. What is your weight in pounds?
4. Which group best represents your race?
o White o Black or African American o American Indian or Alaskan Native o Asian o Native Hawaiian or Other Pacific Islander o Other
5. Which of the following best describes your ethnicity?
o Hispanic or Latino o Not Hispanic or Latino
6. Which of the following best describe your educational background?
o Never attended school or only attended kindergarten o Grades 1-8 (some elementary or middle school) o Grades 9-12 (some high school) o Grade 12 or attained a GED (high school) o College 1-3 years (some college or technical school) o College graduate/ 4 or more years (under graduate degree) o Graduate degree o Doctoral degree

90
7. Which of following best describes your employment situation?
o Employed for wages o Self-employed o Homemaker/does not work outside the home o Retired/no longer working for wages o Unable to Work o Out of work for less than 1 year o Out of work for more than 1 year
8. Which of the following best describes your annual household income from all
sources? o Less than $15,000 o $15,001 to $24,999 o $25,000 to $34, 999 o $35,000-$49,999 o $50,000-$74,999 o $75,000-$99,000 o $100,000 and over
9. What is your marital status?
o Married o Divorced o Separated o Cohabitating/Unmarried couple o Widowed o Never Married
10. What is your current smoking status?
o Never smoked o Used to smoke o Currently smoke o Trying to quit smoking
11. Do you have a family history of heart disease or stroke in a primary relative
(parents or siblings)? o Yes o No o Don’t Know/Unsure

91
12. Approximately how many miles must you travel to reach a health care provider?
13. Do you have any kind of health care coverage, including health insurance, prepaid plans such as HMOs, or government plans such as Medicare or Indian Health Services?
o Yes o No o Unsure
92
APPENDIX F
INFORMATION FOR CLINIC STAFF
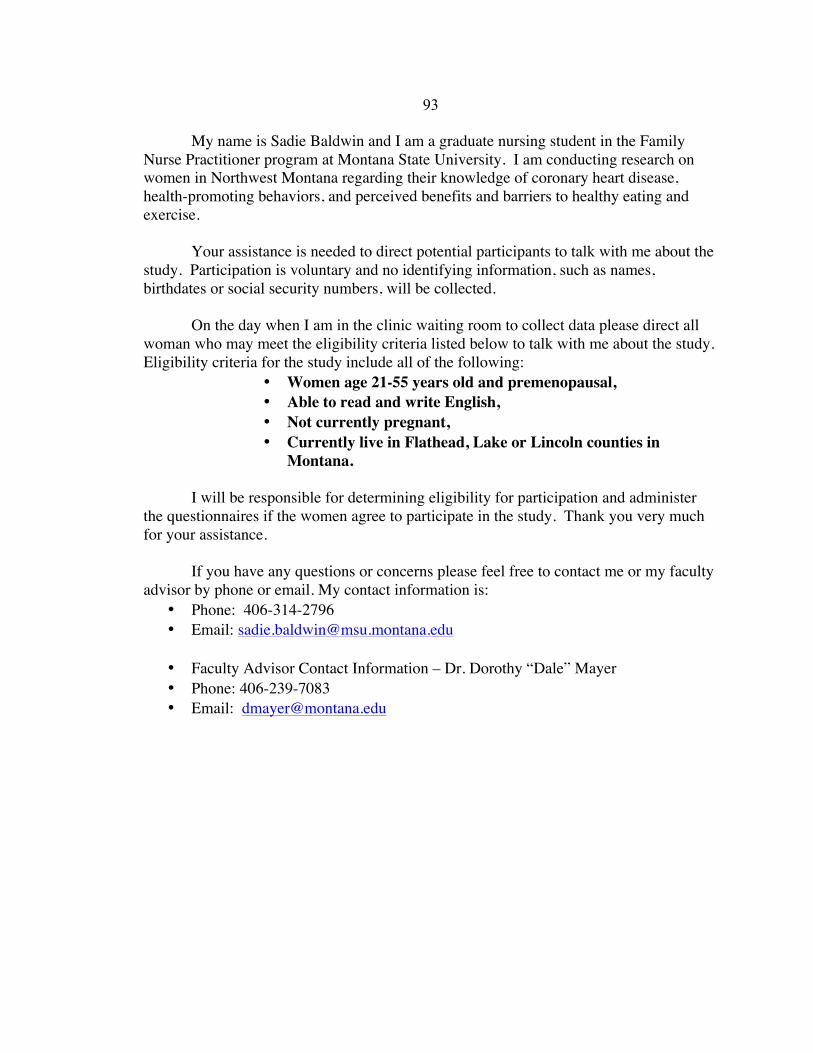
93
My name is Sadie Baldwin and I am a graduate nursing student in the Family Nurse Practitioner program at Montana State University. I am conducting research on women in Northwest Montana regarding their knowledge of coronary heart disease, health-promoting behaviors, and perceived benefits and barriers to healthy eating and exercise.
Your assistance is needed to direct potential participants to talk with me about the study. Participation is voluntary and no identifying information, such as names, birthdates or social security numbers, will be collected.
On the day when I am in the clinic waiting room to collect data please direct all
woman who may meet the eligibility criteria listed below to talk with me about the study. Eligibility criteria for the study include all of the following:
• Women age 21-55 years old and premenopausal, • Able to read and write English, • Not currently pregnant, • Currently live in Flathead, Lake or Lincoln counties in
Montana.
I will be responsible for determining eligibility for participation and administer the questionnaires if the women agree to participate in the study. Thank you very much for your assistance.
If you have any questions or concerns please feel free to contact me or my faculty advisor by phone or email. My contact information is:
• Phone: 406-314-2796 • Email: [email protected]
• Faculty Advisor Contact Information – Dr. Dorothy “Dale” Mayer • Phone: 406-239-7083 • Email: [email protected]

94
APPENDIX G
PARTICIPANT EXPLANATION LETTER

95
I am a graduate nursing student in the Family Nurse Practitioner program at
Montana State University. I am interested in learning more about women’s knowledge of
coronary heart disease, their health-promoting behaviors, and their perceived benefits and
barriers to healthy eating and exercise. I estimate it will take approximately 15-20
minutes to complete the questionairres.
If you choose to complete the questionnaires, you are helping nurses better
understand women’s knowledge of heart disease and their health behaviors.
Participation is completely anonymous and voluntary. You can choose not to
answer any question that you do not want to answer and you can stop at anytime. If
at any time you feel uncomfortable taking the surveys, you may stop. Your answers to
the surveys will be grouped with other participant answers and reported as part of a
research study I am conducting. Your name, nor any other self-identifying information,
will not be collected. Upon completion of the questionnaires, you will receive a five
dollar bill or five dollar gift card to a local coffee shop.
If you wish to contact me with any questions or concerns regarding the surveys,
feel free to do so. My contact information is 406-314-2796 or
[email protected]. You may also wish to contact my faculty advisor, Dr.
Dorothy “Dale” Mayer at 406-239-7083 or [email protected]. If you have concerns
about your rights as a research participant, please contact Dr. Mark Quinn, the Chairman
of the Institutional Review Board at Montana State University at 406-994-5721.
Thank you for your time.
Sincerely,
Sadie Baldwin, RN, BSN
MSU-College of Nursing
Missoula Campus
96
APPENDIX H
RESEARCH PARTICIPANT ELIGIBILITY CHECKLIST

97
If you place a check mark next to each of these criteria, you may proceed to the surveys.
_______Female
_______Age 21 to 55 years old
_______Premenopausal
_______Able to read and write English
_______Not pregnant
_______Current resident of one of the following Northwest Montana counties: Flathead,
Lake, or Lincoln County.