coronal properties of the eq peg binary system
TRANSCRIPT

arX
iv:0
810.
0150
v1 [
astr
o-ph
] 1
Oct
200
8Astronomy & Astrophysicsmanuscript no. EQ˙Peg10 c© ESO 2021November 2, 2021
Coronal properties of the EQ Peg binary systemC. Liefke1, J.-U. Ness2, J. H. M. M. Schmitt1, and A. Maggio3
1 Hamburger Sternwarte, Universat Hamburg, Gojenbergsweg112, 21029 Hamburg, Germany2 Arizona State University, School of Earth and Space Exploration, ASU, P. O. Box 871404,Tempe, AZ 85287, USA3 INAF – Osservatorio Astronomico di Palermo, Piazza del Parlamento 1, 90134 Palermo, Italy
Received 28 April 2008/ Accepted 20 October 2008
ABSTRACT
Context. The activity indicators of M dwarfs are distinctly different for early and late types. The coronae of early M dwarfs displayhigh X-ray luminosities and temperatures, a pronounced inverse FIP effect, and frequent flaring to the extent that no quiescent levelcan be defined in many cases. For late M dwarfs, fewer but more violent flares have been observed, and the quiescent X-ray luminosityis much lower.Aims. To probe the relationship between coronal properties with spectral type of active M dwarfs, we analyze the M3.5 and M4.5components of the EQ Peg binary system in comparison with other active M dwarfs of spectral types M0.5 to M5.5.Methods. We investigate the timing behavior of both components of theEQ Peg system, reconstruct their differential emissionmeasure, and investigate the coronal abundance ratios based on emission-measure independent line ratios from theirChandra HETGSspectra. Finally we test for density variations in different states of activity.Results. The X-ray luminosity of EQ Peg A (M3.5) is by a factor of 6–10 brighter than that of EQ Peg B (M4.5). Like most otheractive M dwarfs, the EQ Peg system shows an inverse FIP effect. The abundances of both components are consistent within theerrors; however, there seems to be a tendency toward the inverse FIP effect being less pronounced in the less active EQ Peg B whencomparing the quiescent state of the two stars. This trend issupported by our comparison with other M dwarfs.Conclusions. As the X-ray luminosity decreases with later spectral type,so do coronal temperatures and flare rate. The amplitude ofthe observed abundance anomalies, i. e. the inverse FIP effect, declines; however, clear deviations from solar abundances remain.
Key words. stars: – abundances – stars: activity – stars: coronae – stars: late-type – stars: individual: EQ Peg – X-rays: stars
1. Introduction
M dwarfs populate the low-mass and low-temperature end of themain sequence, with masses of approximately 0.6 M⊙ and aneffective temperature of about 3800 K at a spectral type of M0,down to 0.1 M⊙ and 2200 K at spectral type M9. Conspicuouschanges in the optical spectra become apparent in the later sub-classes as more and more molecules form with decreasing pho-tospheric temperature, and molecular bands start to dominate.Dust formation marks the transition from late M dwarfs to thebrown dwarf regime of L and T dwarfs.
Somewhat surprisingly, all M dwarfs seem to show at leastsome activity phenomena, and in particular active M dwarfs ofspectral types M0–M4 are strong coronal X-ray sources with X-ray luminosities often close to a saturation limit of logLX /Lbol ∼
−3.3 (Fleming et al. 1993; Pizzolato et al. 2003). Frequent andstrong flaring with increases in X-ray luminosity by more thantwo orders of magnitude (e. g. Favata et al. 2000; Gudel et al.2002a; Schmitt et al. 2008) is widespread among these stars,with additional variability on all timescales and amplitude lev-els. Their emission measure distributions peak around 6–8 MK(Robrade & Schmitt 2005), thus their average coronal temper-atures are much higher than solar (peak temperature 1–2 MK,see e. g. Brosius et al. 1996). Temperatures in excess of sev-eral 10 MK are typically measured during larger flare events(Robrade & Schmitt 2005).
Send offprint requests to: C. Liefke,e-mail:[email protected]
On the other hand, late M dwarfs with spectral types M6–M9 are difficult to detect in X-rays at least during quiescence,yet their ability to produce transient X-ray luminosity enhance-ments by orders of magnitude during flares (Rutledge et al.2000; Schmitt & Liefke 2002; Stelzer et al. 2006) remains.Intermediate objects with a spectral type of≈ M5 have lowercoronal temperatures than the more active early M dwarfs, thepermanent state of variability is replaced by periods of quies-cence interrupted by individual flares, and the overall X-ray lu-minosity starts to decrease by more than an order of magnitude ataround spectral type M5 (Gudel et al. 2002a; Fuhrmeister etal.2007).
The abundance patterns observed in stellar coronae also ap-pear to be related to changes in the coronal activity level. On theone hand, there is the so-called FIP effect observed in (compara-bly) inactive stars like the Sun (Feldman & Laming 2000) or e.g.α Cen (Raassen et al. 2003), with the coronal abundances of ele-ments with low first ionization potential (FIP) enhanced with re-spect to solar photospheric values. On the other hand, very activestars tend to show the inverse effect, i. e. elements with low FIPdepleted and elements with a high FIP enhanced. Gudel et al.(2002b) and Telleschi et al. (2005) found that the solar-like FIPeffect to first disappear and then reverse with increasing activ-ity for solar analogs at different ages. This correlation can beexpected to also apply to the sequence of M dwarfs: Whilethe active early M dwarfs are well-known to show the inverseFIP effect (see e. g. Robrade & Schmitt 2005), Fuhrmeister et al.(2007) found the M5.5 star CN Leo to show much less pro-nounced abundance anomalies. Unfortunately, high-resolution

2 C. Liefke et al.: Coronal properties of the EQ Peg binary system
X-ray spectra for intermediate objects are rare; and due to theirlow X-ray luminosity, it is in most cases impossible to obtainspectra suitable for a reasonable abundance analysis for late Mdwarfs to confirm this trend.
Stellar coronal X-ray emission is associated with the produc-tion of magnetic fields driven by a dynamo mechanism (Parker1955; Moffatt 1978), which is thought to be located in thetransition layers between the rigidly rotating radiative core andthe outer convection zone that rotates differentially for solar-like stars. However, models of the stellar interior predictthatM dwarfs of spectral types later than≈M3 become fully convec-tive (Chabrier & Baraffe 1997), leaving no shear layers betweena radiative core and the convection zone behind. The solar-likeαω-dynamo thus does not work for these stars, and no dynamo-induced X-ray emission would be expected. Yet, the observeddecline in X-ray luminosity around spectral type M5–M6 fitsthe finding of Mullan & MacDonald (2001) that the influenceof magnetic fields can shift the fully convective cut-off towardslater spectral types. Fully convective stars produce less quies-cent X-ray emission, but other activity indicators like Hα emis-sion even increase in strength towards the low-mass L dwarfs.Alternative dynamo mechanisms, driving the required magneticfields, have been proposed for these objects (e. g. Durney et al.1993). In these scenarios withα2 or turbulent dynamos, the mag-netic fields are sustained by small-scale velocity fields, whilelarge-scale rotation plays only a minor role. As a consequence,no activity cycles and magnetic structures of small size andwitha more uniform surface distribution are expected. However,mostrecent non-linear 3D simulations of dynamo action in fully con-vective stars (e. g. Chabrier & Kuker 2006; Dobler et al. 2006;Browning 2008) have shown that also large-scale fields couldbeproduced in fast-rotating late M dwarfs, but these models dis-agree about whether or not the magnetic fields have axisymmet-ric components and/or a cyclic behavior.
With the required change of the dominating dynamo mecha-nism operating in early and late M dwarfs in mind, changes in theabundance patterns between these objects are of particularinter-est to characterize the coronae induced by the different dynamos.The above considerations concerning luminosity demand inves-tigations of coronal properties of M dwarfs located close totheexpected transition. The binary system EQ Peg consists of anM3.5 and M4.5 star and thus provides the rare opportunity tocompare two such stars, which should otherwise be very similarsince they are co-eval.
In the following, we present ourChandra HETGS observa-tions of EQ Peg, that allows us to perform a separate spectralanalysis of the two components. We also compare our observa-tions of EQ Peg A and B to HETGS spectra of other M dwarfscovering a range of spectral types. We propose a classification ofthe coronal properties of active M dwarfs based on their spectraltype.
2. The EQ Peg binary system
The visual binary system EQ Peg consists of two M dwarfsat a distance of 6.25 pc with an angular separation of≈ 6′′,i. e. EQ Peg A with spectral type M3.5 and an apparent mag-nitudeVA = 10.35 and EQ Peg B with spectral type M4.5 andmagnitudeVB = 12.4. Both components are well-known (opti-cal) flare stars (Pettersen 1976; Lacy et al. 1976). Jackson et al.(1989) observed microwave emission during quiescence, whichthey attributed to the brighter A component. Norton et al. (2007)find a photometric period of 1.0664 days for the EQ Peg sys-tem from data of the SuperWASP transit survey, however, due
Table 1. Observation log for EQ Peg.
ObsID observation time exp. time [ ks ]8453 2006-11-28T01:51–2006-11-28T22:48 29.958484 2006-11-29T16:33–2006-11-29T08:59 10.958485 2006-11-30T16:59–2006-12-01T08:54 30.948486 2006-12-03T07:55–2006-12-03T09:02 27.95
to the large aperture size of SuperWASP, this period cannot beclearly assigned to one of the two components of EQ Peg, norto two other stars in the field of view. However, Zboril & Byrne(1998) find a rotational velocity of 14 km/s for EQ Peg A, whileDelfosse et al. (1998) analyze only the B component and find24.2±1.4 km/s; bothv sini values are rather high and thus con-sistent with a short rotation period.
The EQ Peg system is a strong X-ray and EUV source with anumber of flares recorded, but previous missions were not able toangularly resolve the two stars. Pallavicini et al. (1990) discusstwo flares observed withEXOSAT. The first one, with an atypi-cally shaped lightcurve, was observed by Haisch et al. (1987) inthe context of a simultaneousEXOSAT and IUE campaign. Asecond large amplitude flare was observed by Pallavicini et al.(1986). Katsova et al. (2002) observed another large flare withROSAT with simultaneous optical photometry. All of these flareswere attributed to the A component. Monsignori Fossi et al.(1995) observed another set of flares on EQ Peg withEUVE andderived a differential emission measure distribution, based online flux measurements, with a peak at about 10 MK, which is,however, not well constrained. A first approach to separate thetwo components in X-rays was undertaken withXMM-Newton(Robrade et al. 2004). Although the two stars show consider-able overlap owing to the instrumental point spread function,it was possible to attribute about three quarters of the overallX-ray flux to the A component. A subsequent detailed spec-tral analysis without resolving the binary has been performedby Robrade & Schmitt (2005). OurChandra HETGS observa-tions are the first X-ray observations that allow an unambiguousspectral separation of the two binary components.
3. Chandra HETGS observations of EQ Peg A and B
3.1. Observations and data analysis
EQ Peg was observed on four occasions between 2006November 28th and December 3rd with a total exposure timeof 100 ks with theChandra High Energy Transmission GratingSpectrometer (HETGS); a journal of the observations is pre-sented in Table 1. The HETGS consists of two grating arms, theMedium Energy Grating (MEG) and the High Energy Grating(HEG), which provide X-ray spectra in the wavelength rangebetween≈ 1.5 and 30 Å with medium (MEG: 0.023 Å FWHM)and high (HEG: 0.012 Å FWHM) resolution.1 For data reductionwe used the CIAO software version 3.4.
The separation of the 0th order images of EQ Peg A and B is5.8′′ in the ACIS-S image, and therefore the dispersed spectra ofthe two stars can be easily separated with only a small overlapof the HEG and MEG grating arms at the shortest wavelengths(< 1.5 Å). We extracted 1st order HEG and MEG spectra for
1 For a detailed description of theChandra HETGSsee the Chandra Proposers’ Observatory Guide athttp://asc.harvard.edu/proposer/POG/html/

C. Liefke et al.: Coronal properties of the EQ Peg binary system 3
each component from each of the four datasets using the stan-dard CIAO tools to obtain grating spectra for multiple sources.
For our final analysis we created separate HEG and MEGspectra for EQ Peg A and B, where we combined all four obser-vations and the plus- and minus dispersion orders. Only for EQPeg A have we also inspected the spectra from the individualobservations.
For our final analysis, we created separate HEG and MEGspectra for EQ Peg A and B, where we combined all four ob-servations and the plus and minus dispersion orders. Only forEQ Peg A we have also inspected the spectra from the individ-ual observations. All line fluxes were measured with our CORAprogram (Ness & Wichmann 2002), fitting the lines with Moffatline profiles given by
I(λ) = Imax
(
1+(
λ − λ0
∆λ
)2)−β
(1)
i. e., modified Lorentzians, with an exponentβ = 2.4 and a fixedline width of 0.02 Å for MEG and 0.01 Å for HEG spectra.
3.2. Lightcurves
We first extracted background-subtracted lightcurves for EQ PegA and B from the dispersed and non-dispersed (0th order) pho-tons. In order to obtain equivalent lightcurves of the two starswith maximized signal-to-noise, we use total (i. e. 0th order+dispersed) photons of EQ Peg B and the dispersed photons ofEQ Peg A, scaled by the ratio of total and dispersed photonsfrom EQ Peg B (assuming a similar spectral energy distributionfor the two stars), as the the 0th order of EQ Peg A is stronglyaffected by pileup. The resulting lightcurves are shown in Fig.1for the four observation intervals.
EQ Peg A shows several flares. The most conspicuous eventstarted at 0:00 UT on December 1st with a relatively slow riseand lasted about 2 hours. Unfortunately, the flare decay phasewas not observed completely, since the observation ended be-fore quiescence was reached again. At flare peak, the flux in-creases by a factor of six, and the flare is strong enough to al-low the extraction of separate MEG spectra. Additional smallerflares occurred on November 28th at 5:00 UT, with a flux in-crease of about a factor of four, lasting about half an hour, andon December 3rd at about 9:00 UT, with an increase by a factorof 2, and a longer decay of more than 2 hours. The underlyingquiescent level is difficult to determine owing to a large num-ber of small-scale variations and apparently different quiescentemission levels during the four individual observations, with thebase level for the A component at∼ 0.3–0.4 cts/s. Apart frompure statistical noise, such low-level amplitude variations canbe caused either by small-scale flares or the evolution of activeregions on the stellar surface. On November 29th the emissionlevel was much higher than this quiescent level despite a lack ofclear flare-like signatures, which might be explained by activeregions newly emerged or rotated into the field of view, whileon November 30th a slow decrease in count rate is observed thatmight be attributed to a long-duration flare. The B componentat∼ 0.05 cts/s is much fainter and does not show conspicuous shortduration flares, except on Dec 3rd. On November 30th the countrate of EQ Peg B slowly decreased during the whole 8 hours ofthe observation and again we may have witnessed the decay of aflare.
We computed median and mean count rates in order to com-pare the flux levels of the two components outside obvious flar-ing periods, and find the quiescence level of EQ Peg B lower than
that of A by factors of about 6 to 10. Both stars show a decay incount rate on November 30th, however, a direct connection offlare activity on the two components is difficult to envisage con-sidering the distance of∼ 36 AU between A and B, althougha similar correlated behavior of the system with simultaneousquiescent and flaring states has been observed by Robrade et al.(2004) with XMM-Newton. These authors also found a lowerflux ratio of 4–5 during quiescence and 2.5–3 during flaringstates. However, due to the limited spatial resolution ofXMM’sEPIC detectors, the exact brightness ratios are less certain.
We also extracted the lightcurves in different energy bands toobtain time-resolved hardness ratios. These give us the tempera-ture evolution of the plasma. While there is no unique tempera-ture that describes the spectrum (see Sect. 4.2), the temperaturedistribution cannot be mapped as a function of time, and the dif-ferential emission measure distribution can only by determinedas an average over the entire observation. Because of pileupinthe 0th order of the A component, we extracted the hardnessratios only from the dispersed photons for both stars. With thehard and soft bands chosen to range from 1.0–10.0 keV and 0.3–1.0 keV respectively, the two components show consistent hard-ness ratios during quiescence, with values ranging from 0.25 to0.5, indicating a similar spectral energy distribution. Averagedover the total observing time, the hardness ratio for both stars is0.43; a spectral hardening to values up to 0.8 is apparent duringthe major flares on the A component. For our spectral analysis,we considered only the total spectrum of EQ Peg B, while forEQ Peg A we considered the total spectrum and a “quiescent”spectrum, where we excluded the two larger flares on November28th and December 1st.
We computed overall X-ray luminosities logLX of 28.71 forEQ Peg A (28.67 for the quiescent state only) and 27.89 forEQ Peg B from the integrated dispersed photons in the MEGspectra over a wavelength range from 2 to 25 Å, i. e. in this spec-tral range, the A component is by a factor of 6–7 more luminousthan the B component. However, following Kenyon & Hartmann(1995), the bolometric luminosities of the two stars are logLbol ≈
31.90 and 31.28. This results in logLX/Lbol values of−3.19(−3.23 during quiescence) and−3.39 for EQ Peg A and B re-spectively, i. e. both stars are located in the saturation regime ofX-ray emission (Pizzolato et al. 2003).
3.3. Grating spectra
In Fig. 2 we show theChandra MEG spectra of EQ Peg A(top) and B (bottom). Both stars show well-pronounced con-tinua between 5 Å and 15 Å, indicating larger amounts of high-temperature plasma in their coronae. The strongest lines inthetotal MEG count spectra are Nex and Oviii Ly α, other promi-nent lines originate from Sixiv andxiii, Neix, and Fexvii. Theiron lines tend to be somewhat stronger in EQ Peg B. The Oviitriplet lines are clearly detected but suffer from the low effec-tive area of the MEG at long wavelengths. The weak Ovii 1s-3pline at 18.63 Å is also detected in both stars. After conversion ofcounts to photon fluxes, the Oviii Ly α line is the strongest linein the spectra, and also the Ovii flux is quite high, indicating thepresence of considerable amounts of low-temperature plasma.
In order to probe the shape of the continua and to directlycompare the two binary components, we computed the cumula-tive count spectra from 4 Å to 26 Å from the combined countspectra of EQ Peg A and B (top panel of Figure 3). A steeprise of the cumulative spectrum indicates a harder spectrumandthus higher temperatures, as observed for EQ Peg A compared

4 C. Liefke et al.: Coronal properties of the EQ Peg binary system
Fig. 1. Background-subtracted and pileup-corrected lightcurvesfor EQ Peg A (top) and B (bottom). Binsize for both sources is600 s.
Fig. 2. Chandra MEG spectra of EQ Peg A (top, red) and B (bot-tom, blue). Both spectra have been rebinned.
to EQ Peg B. Since this may reflect the strong flares observedon the A component, we considered also the quiescent spectrumfor EQ Peg A. As can be seen from Figure 3 (top), this spectrumis indeed closer to the B component, however, EQ Peg A stillappears somewhat harder. When comparing the total spectra ofA and B, these differences are relatively small, and a KS test re-turns probabilities of around 3% that the two stars are differentin their spectral shape. We note that the presence of strong emis-sion lines, e. g., Nex at 12.12 Å, leads to steps in the cumulativespectrum. However, the depths of these steps seem similar forEQ Peg A and B, and the major differences in the cumulativedistribution can be attributed to the continuum.
In Tables 2 and 3 we provide lists of the measured line countsand resulting photon fluxes for the combined spectra of EQPegAand B, and for the quiescent state of EQ Peg A, which we used inour subsequent analysis; note that a sophisticated procedure hasbeen applied to deconvolve the blending of the Neix triplet andits contamination with iron lines, mainly from Fexvii and Fexix(Ness et al. 2003b). In addition to the line fluxes of the three
Fig. 3. Cumulative distribution (top) of counts in the MEG spec-tra of EQ Peg A (dotted line: all data, solid line: with the largeflare on December 1st excluded) and B (dashed line); and ratioB /A (middle panel: all data, bottom: with the two larger flareson EQ Peg A excluded).
triplet constituents, we fitted global scaling factors to the linefluxes of the contamining ions observed by Ness et al. (2003b)in the well-exposed HETGS spectrum of Capella where the con-tamination is very strong. Additionally, the Nex line at 12.13 Åhas been corrected to account for a blend by Fexvii at 12.12 Å.According to CHIANTI 5.2 (Landi et al. 2006), using the ion-ization balance from Mazzotta et al. (1998), the line emissivity

C. Liefke et al.: Coronal properties of the EQ Peg binary system 5
Fig. 4. Spectral region around the Nex line at 12.13 Å and theFexvii and Fexxi lines at 12.26 and 12.28 Å in the total spectrumof EQ Peg A.
of the contaminating line is comparable to the line at 12.26 Å,and the ratio of these two lines shows no dependence on elec-tron density and only a mild dependence on electron tempera-ture. Additionally, both transitions go to the ground stateandshare the same electron configuration in their excited states. Wethus subtracted the line counts measured in the line at 12.26Åfrom the Nex line as a proxy for the unresolved blending lineat 12.12 Å. Fig. 4 illustrates the fit for the total HEG and MEGspectra of EQ Peg A.
4. Results
4.1. Coronal densities
Using the forbidden and intercombination lines of the helium-like triplets of silicon, magnesium, neon, and oxygen, we com-puted the density-sensitive f/i-ratios of these ions for EQ Peg Aand B. In Table 4 we list these ratios with the respective peakformation temperatures of the ion and the derived electron den-sitiesne for EQ Peg A and B. For the conversion of the measuredf /i ratios to densities, we used the relation
fi=
R0
1+ ne/Nc(2)
with the low-density limitR0 and the critical densityNc wherewe adopted the values from Table 5 in Ness et al. (2002).Theoretical modeling of thef /i ratios still suffers from the in-completeness of current atomic databases, as contributions fromsatellite lines and effects from dielectronic recombination haveto be taken into account.
The uncertainty in the density derived from Ovii is large, asa result of the low effective area at long wavelengths. While theNeix triplet around 13.5Å is well exposed, severe contaminationcomplicates the line flux measurements, especially of the Neix iline at 13.54 Å (Ness et al. 2003b), see also Sect. 3.3. The den-sity value derived for EQ Peg A is higher than the one derivedfrom Ovii. Since Neix traces higher coronal temperatures, thismay indicate a higher pressure in the hotter plasma regions,how-ever, the uncertainties do not include uncertainties from the de-blending procedure. Thef /i-ratio derived for the B componentis – nominally – in the low-density limit region, however, the er-ror is so large that the same density derived for the A component
Table 3. Measured line counts and photon fluxes in theChandraMEG spectra of the quiescent state of EQ Peg A.
λ [ Å ] ion counts fluxes4.73 Sxvi 8.6±4.1 0.25±0.125.04 Sxv 22.6±5.8 0.70±0.186.18 Sixiv 143.7±13.2 1.54±0.146.65 Sixiii 317.7±19.1 2.87±0.176.69 Sixiii 57.0±10.1 0.52±0.096.74 Sixiii 193.6±15.6 1.60±0.138.42 Mgxii 175.4±15.3 1.51±0.139.17 Mgxi 98.7±11.8 1.54±0.189.23 Mgxi 27.5±8.1 0.44±0.139.31 Mgxi 31.9±8.4 0.54±0.14
10.24 Nex 155.6±14.0 2.49±0.2211.17 Fexxiv 20.6±7.6 0.44±0.1611.55 Neix 90.3±11.5 2.02±0.2611.74 Fexxiii 45.9±9.0 1.12±0.2211.78 Fexxii 42.4±9.0 1.11±0.2412.13 Nex 813.8±28.5 23.75±0.8313.45 Neix 293.4±17.1 13.67±0.8013.55 Neix 61.1±7.8 2.76±0.3513.69 Neix 169.1±13.0 8.69±0.6714.21 Fexviii 82.7±10.6 5.53±0.7115.01 Fexvii 266.3±16.9 16.45±1.0515.26 Fexvii 92.8±10.7 7.39±0.7716.01 Oviii 184.8±14.0 13.69±1.0516.78 Fexvii 114.3±11.0 10.80±1.0417.05 Fexvii 139.9±12.6 14.73±1.3317.10 Fexvii 137.2±12.4 14.70±1.3318.63 Ovii 30.3±5.6 4.55±0.8718.97 Oviii 414.0±20.5 72.49±3.6021.60 Ovii 64.5±8.3 23.76±3.0621.81 Ovii 14.0±4.0 5.91±1.6922.10 Ovii 24.0±5.1 11.62±2.4724.79 Nvii 15.0±4.3 6.47±1.85
Table 4. f /i ratios (in photon units) and coronal densities forEQ Peg A and B from totalChandra MEG spectra.
EQ Peg A EQ Peg Bion log T f /i log ne f /i log ne
Ovii 6.3 1.69±0.60 10.62+0.29−0.27 2.81±0.87 < 10.98
Neix 6.6 2.38±0.32 11.40+0.18−0.22 3.53±1.33 < 11.51
Mg xi 6.8 1.01±0.35 12.99+0.27−0.23 1.68±1.04 < 13.28
Sixiii 6.95 3.28±0.62 < 11.17 5.08±3.64 < 13.52
is also consistent with the data. The Mg and Si triplets are muchstronger affected by satellite lines. Additionally, the Mgxi tripletis blended with higher-order lines from the Lyman series of Nexas discussed by Testa et al. (2004). The flux in the magnesiumtriplet lines is too low in both components of the EQ Peg bi-nary for a deblending procedure to yield any useful refinements.Since neon turns out to be far more abundant than magnesium(see Sect. 4.2), the blending contributions from neon amountsto a significant fraction of the line fluxes, and we consider thehigh densities derived from magnesium not reliable. Consistentwith that interpretation, the Sixiii triplet lines are consistent withbeing in the low-density limit, which is not surprising since thedensity-sensitive range for this ion is higher than the densitiesnormally encountered in stellar coronae. However, the Si tripletis also problematic because of a steep increase of the effectivearea in both the HEG and MEG that occurs exactly at the wave-length of the forbidden line.

6 C. Liefke et al.: Coronal properties of the EQ Peg binary system
Table 2. Measured line counts and photon fluxes (in 10−5 photons cm−2 s−1) in the combinedChandra MEG spectra. Flux predic-tions from the reconstructed DEMs (see Setc. 4.2) are also listed.
λ ion EQ Peg A EQ Peg B[ Å ] counts photon fluxes method 1 method 2 counts photon fluxesmethod 1 method 24.73 Sxvi 22.3±5.6 0.61±0.15 0.42 0.32 — — — —5.04 Sxv 28.7±6.3 0.84±0.18 0.92 0.94 — — — —6.18 Sixiv 176.6±14.6 1.78±0.15 1.92 1.86 30.4±5.9 0.31±0.06 0.21 0.136.65 Sixiii 321.6±19.7 2.74±0.17 2.71 2.75 40.4±6.8 0.34±0.06 0.36 0.376.69 Sixiii 61.7±10.6 0.53±0.09 0.72 0.73 5.0±3.4 0.04±0.03 0.10 0.106.74 Sixiii 202.5±16.2 1.58±0.13 1.31 1.33 25.7±6.0 0.20±0.05 0.19 0.198.42 Mgxii 178.9±15.9 1.45±0.13 1.58 1.60 30.2±6.0 0.24±0.05 0.25 0.239.17 Mgxi 107.7±12.4 1.58±0.18 1.54 1.50 26.0±5.6 0.38±0.08 0.32 0.349.23 Mgxi 33.9±8.2 0.51±0.12 0.36 0.35 6.7±3.4 0.10±0.05 0.08 0.089.31 Mgxi 34.6±8.4 0.55±0.13 0.81 0.78 11.2±3.9 0.18±0.07 0.17 0.18
10.24 Nex 160.8±14.4 2.42±0.22 3.05 3.07 29.4±5.91 0.44±0.09 0.34 0.3611.17 Fexxiv 47.2±9.7 0.95±0.19 0.48 0.44 — — 0.02 0.0111.55 Neix 101.3±12.3 2.13±0.26 1.80 1.84 19.5±5.12 0.41±0.11 0.28 0.2811.74 Fexxiii 65.1±10.5 1.50±0.24 0.91 1.00 — — 0.13 0.0911.78 Fexxii 44.9±9.6 1.11±0.24 1.12 1.29 — — 0.11 0.1712.13 Nex 891.8±29.9 24.47±0.82 24.00 24.06 104.8±10.6 2.88±0.29 2.75 2.9213.45 Neix 320.2±17.9 15.89±0.88 17.02 16.58 51.4±7.5 2.26±0.33 2.66 2.5613.55 Neix 77.2±8.8 3.28±0.37 3.67 3.57 9.1±3.0 0.39±0.13 0.56 0.5613.69 Neix 184.0±13.6 8.90±0.66 9.53 9.28 32.0±5.7 1.55±0.28 1.45 1.4614.21 Fexviii 92.2±11.1 5.80±0.70 4.77 4.86 18.7±4.6 1.18±0.29 0.70 0.7615.01 Fexvii 270.1±17.3 15.72±1.01 18.74 18.51 43.2±7.0 2.51±0.40 3.29 3.3115.26 Fexvii 102.2±9.3 6.60±0.60 5.36 5.29 26.5±5.7 1.71±0.36 0.95 0.9516.01 Oviii 193.1±14.5 13.71±1.03 8.40 8.33 27.2±5.7 1.93±0.40 0.89 1.0316.78 Fexvii 116.4±11.3 10.36±1.00 11.41 11.25 18.3±4.6 1.63±0.41 2.05 2.0417.05 Fexvii 144.7±12.7 14.36±1.26 14.51 14.30 24.8±5.2 2.46±0.52 2.60 2.5917.10 Fexvii 139.3±12.4 14.07±1.25 12.10 11.93 26.2±5.4 2.65±0.55 2.15 2.1618.63 Ovii 33.9±6.2 4.78±0.87 3.37 3.43 7.3±3.1 1.03±0.43 0.51 0.4818.97 Oviii 435.8±21.1 71.90±3.48 70.50 69.90 63.4±8.2 10.46±1.36 7.77 8.8221.60 Ovii 69.6±8.6 24.21±2.98 30.53 31.30 7.6±2.8 1.56±0.91 4.78 4.4021.81 Ovii 14.2±4.0 5.64±1.59 6.83 7.07 3.7±2.0 1.47±0.79 1.45 0.9922.10 Ovii 24.0±5.1 10.95±2.33 18.08 18.70 10.3±3.5 4.70±1.6 3.71 2.6224.79 Nvii 19.3±4.5 7.84±1.85 7.84 7.84 2.0±1.7 0.80±0.72 0.80 0.80
The flux in the Neix triplet of EQ Peg A is large enoughto investigate not only the density in the combined spectrum, butalso in the individual datasets. In Fig. 5 we show the correspond-ing spectral region for each of our four data sets. While differ-ences in the strength of the intercombination line at 13.55 Åareapparent in the individual datasets, no changes in density canbe established at a statistically significant level. In addition tothe complete dataset 8485, we show also the spectrum extractedfor the large flare (shaded in gray in the bottom left panel ofFig. 5). Dividing this observation in flare and non-flaring statesgives f /i-ratios of 1.13±0.59 and 2.24±0.61, or density valueslog ne of 12.07+0.43
−0.31 and 11.49+0.32−0.43, respectively. For the com-
bined quiescent spectrum, we findf /i = 2.77±0.42, correspond-ing to logne = 11.13+0.29
−0.09, which is lower but still consistent withthe total spectrum (see Table 4) and clearly lower than duringthe large flare. This indicates activity-related density variationsas observed by Maggio & Ness (2005) on the active M dwarfAD Leo. Unambiguous measurements of coronal density varia-tions have so far only been observed during very large flares onthe active M dwarfs Proxima Centauri and CN Leo (Gudel et al.2002a; Liefke et al. 2007). The two density values derived herefor flare and quiescence are consistent with each other at the2σlevel, however, the density values observed during flares onac-tive stars in general – although consistent with the quiescent state– tend to result in higher densities (see e. g. Mitra-Kraev & Ness2006).
Fig. 5. The Neix triplet in the MEG spectra of EQ Peg A duringthe four observations. On observation No. 8485 the flare spec-trum only is overlaid in gray.
We also note the different levels of contamination of the neontriplet by Fexvii (13.8 Å) and Fexix (13.51 Å) in the differentdatasets. During the large flare, this can be attributed on the onehand to the higher coronal temperatures increasing the amountof Fexix compared to other ionization stages of iron, and on the

C. Liefke et al.: Coronal properties of the EQ Peg binary system 7
other hand possibly also to an increased Fe/Ne abundance ratioduring the flare, as discussed below.
4.2. Differential emission measure
In order to derive absolute abundances we investigated the dif-ferential emission measure (DEM) of the two stars from the linefluxes of the strongest density-insensitive lines listed inTable 2.For EQ Peg A, the HEG spectrum can also be used in additionto the MEG spectrum, while for EQ Peg B only the MEG spec-trum provides data with a reasonable signal-to-noise ratio. In atwo-step procedure we first reconstructed the DEM utilizinganabundance-independent approach similar to the one proposed bySchmitt & Ness (2004). In a second step we then determined theabundances from the ratios of measured line fluxes to those pre-dicted by the DEM.
We used a volume differential emission measure defined as
DEM(T ) = n2e
dVdT
(3)
in units cm−3 K−1. The DEM is related to the theoretical photonflux f ji (in photons cm−2 s−1) of a spectral line originating froman atomic transition from the upper levelj to the lower leveli inthe ionXZ+ by
f ji =AX
4πd2
∫
G(T ) DEM(T ) dT (4)
whereAX is the abundance of elementX relative to solar photo-spheric values and the line contribution functionG(T ) with
G(T ) = A jin j(XZ+)
n(XZ+)n(XZ+)n(X)
n(X)n(H)⊙
n(H)ne
1ne
(5)
A ji being the Einstein coefficient for spontaneous emission ofthe transition,n j(XZ+)/n(XZ+) the level population of the upperlevel,n(XZ+)/n(X) the ionization balance,n(X)/n(H)⊙ the solarphotospheric abundance, andn(H)/ne the proton-to-electron ra-tio, which is≈ 0.83 for coronal plasmas where hydrogen andhelium are usually fully ionized. While the DEM describes theproperties of the emitting plasma, the line contribution functionsummarizes constants and the underlying atomic physics. Weused CHIANTI 5.2 (Landi et al. 2006) and the ionization bal-ance of Mazzotta et al. (1998) to calculateG(T ) for each line.
Our abundance-independent reconstruction of the DEM isbased on line ratios, and we used the ratios of the H-like Lyα
and the He-like resonance lines of oxygen, neon, magnesium,and silicon, plus several ratios of adjacent ionization stages ofiron from Fexvii to Fexxiv. Since these line ratios involve onlylines of the same element, the elemental abundances cancel out,and each ratio poses a constraint on the shape of the DEM.The choice of these lines yields a temperature coverage from≈ 2 to 20 MK, however, the low effective area at longer wave-lengths with low-temperature lines like Ovii and Oviii results inrelatively large uncertainties at temperatures below 5 MK.ForEQ Peg A, a total of 13 ratios have been used, while some ofthe ratios consisting of higher ionization stages of iron couldnot be used for the B component because of low signal, leav-ing only 9 usable ratios. In order to fix the absolute level ofthe DEM in addition to constraining the shape by the ratios, butstill independently of a reference element like iron, we force theDEM and the theoretical continuum emissivity as implementedin CHIANTI to reproduce the observed continuum flux. For bothcomponents of EQ Peg, we used the wavelength region around
7.5 Å, where the effective area of the MEG reaches its maxi-mum, and the spectrum is, according to the CHIANTI database,essentially line-free, exept for a few weak aluminum and mag-nesium lines. We assume that any remaining emission at thesewavelengths originates from the continuum and neglect the con-tribution of any further weak transitions. As a result of mergingthe four datasets, the determined DEMs constitute an averageover these observations with the different states of activity andquiescent and flaring periods of the two stars.
We used two slightly different approaches to model theDEM, that we parameterize by polynomials of different orders.In our first method (method 1) we fitted the polynomial param-eters as logDEM, and with our second method (method 2) wemodel the linear DEM, both as a function of logT . While formethod 1 no boundary conditions are needed, for method 2 weforced the value of DEM to be zero at two variable temperatures,and positive between these temperatures. For a more detailed de-scription we refer to Liefke & Schmitt (in preparation).
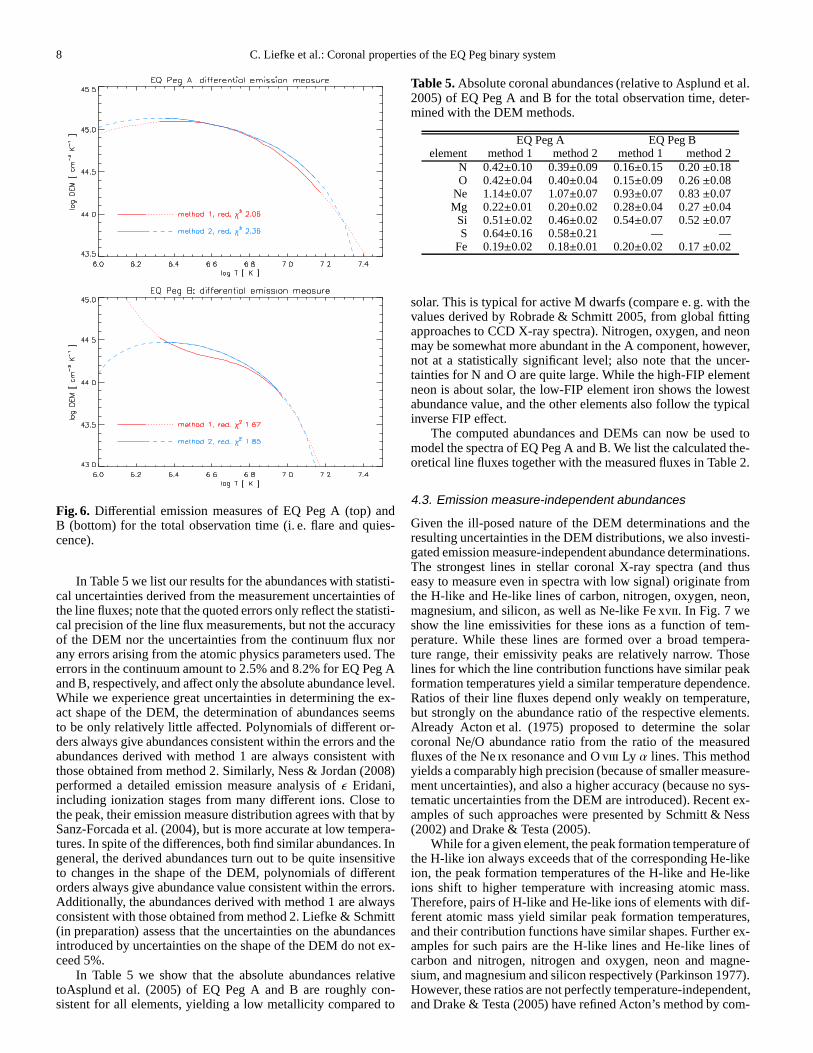
For EQ Peg A, both methods give acceptable best-fits tothe selected line ratios assuming 3rd and 5th order polynomials,yielding values of reducedχ2 of 2.06 and 2.36 for methods 1 and2, respectively. These DEMs are shown in the top panel of Fig.6.The polynomials are an analytical representation of the shapeof the DEM, which is only valid for certain temperature rangewhich is at first restricted by the temperature range coveredbythe emissivities of the lines implemented in the fit. In Fig. 6weadditionally plot the polynomials with solid lines in the temper-ature range we consider as well-constrained from the availablelines, and with dashed or dotted lines outside this range. Sincethe high-temperature regime is better represented by the avail-able ratios than the low-temperature range (see above), thetwomethods yield best agreement at high temperatures. However,the peaks in the DEM disagree from the two methods, and thepoor constraints from temperatures logT below 6.5 lines make itdifficult to quantify the exact amount of cool material; this mayeven falsely hint at a DEM peak at a lower temperature.
For EQ Peg B, this becomes even more apparent, see thebottom panel of Fig. 6. The best-fit results are obtained with4th
order polynomials with both methods, with reducedχ2 valuesof 1.67 and 1.85; however, the two approaches give consistentresults only in the range of 6.8 < logT < 7.2. The DEM recon-structed from method 2 shows an unphysical increase towardslower temperatures due to the fact that no ratios are available toadequately constrain the low-temperature slope.
When introducing higher-order polynomials (orders> 5),the DEMs of both stars start to develop two-peaked structureswith maxima at logT ≈ 6.2–6.4 and 6.8–7.2. This would cor-respond to a low- and a high temperature component, where thefirst one causes the strong oxygen line fluxes, and the hotter com-ponent is related to the typical active M dwarf corona and theob-served flares. However, the DEMs constructed with higher-orderpolynomials are often unstable, and the location and strength ofcertain structures often depends only on a single line flux mea-surement. Thus we cannot be certain about the reality of thesestructures, and we prefer the “simpler” DEMs with fewer freeparameters.
Next, we used the DEMs from these two approaches forthe two stars to predict line fluxes. Since the DEMs are deter-mined independently of the abundances and are normalized tothe continuum, any discrepancies between predictions and mea-surements of line fluxes must be due to different abundances thanthose assumed in predicting the line fluxes from a given DEM(here Asplund et al. 2005).
8 C. Liefke et al.: Coronal properties of the EQ Peg binary system
Fig. 6. Differential emission measures of EQ Peg A (top) andB (bottom) for the total observation time (i. e. flare and quies-cence).
In Table 5 we list our results for the abundances with statisti-cal uncertainties derived from the measurement uncertainties ofthe line fluxes; note that the quoted errors only reflect the statisti-cal precision of the line flux measurements, but not the accuracyof the DEM nor the uncertainties from the continuum flux norany errors arising from the atomic physics parameters used.Theerrors in the continuum amount to 2.5% and 8.2% for EQ Peg Aand B, respectively, and affect only the absolute abundance level.While we experience great uncertainties in determining theex-act shape of the DEM, the determination of abundances seemsto be only relatively little affected. Polynomials of different or-ders always give abundances consistent within the errors and theabundances derived with method 1 are always consistent withthose obtained from method 2. Similarly, Ness & Jordan (2008)performed a detailed emission measure analysis ofǫ Eridani,including ionization stages from many different ions. Close tothe peak, their emission measure distribution agrees with that bySanz-Forcada et al. (2004), but is more accurate at low tempera-tures. In spite of the differences, both find similar abundances. Ingeneral, the derived abundances turn out to be quite insensitiveto changes in the shape of the DEM, polynomials of differentorders always give abundance value consistent within the errors.Additionally, the abundances derived with method 1 are alwaysconsistent with those obtained from method 2. Liefke & Schmitt(in preparation) assess that the uncertainties on the abundancesintroduced by uncertainties on the shape of the DEM do not ex-ceed 5%.
In Table 5 we show that the absolute abundances relativetoAsplund et al. (2005) of EQ Peg A and B are roughly con-sistent for all elements, yielding a low metallicity compared to
Table 5. Absolute coronal abundances (relative to Asplund et al.2005) of EQ Peg A and B for the total observation time, deter-mined with the DEM methods.
EQ Peg A EQ Peg Belement method 1 method 2 method 1 method 2
N 0.42±0.10 0.39±0.09 0.16±0.15 0.20±0.18O 0.42±0.04 0.40±0.04 0.15±0.09 0.26±0.08
Ne 1.14±0.07 1.07±0.07 0.93±0.07 0.83±0.07Mg 0.22±0.01 0.20±0.02 0.28±0.04 0.27±0.04Si 0.51±0.02 0.46±0.02 0.54±0.07 0.52±0.07S 0.64±0.16 0.58±0.21 — —
Fe 0.19±0.02 0.18±0.01 0.20±0.02 0.17±0.02
solar. This is typical for active M dwarfs (compare e. g. withthevalues derived by Robrade & Schmitt 2005, from global fittingapproaches to CCD X-ray spectra). Nitrogen, oxygen, and neonmay be somewhat more abundant in the A component, however,not at a statistically significant level; also note that the uncer-tainties for N and O are quite large. While the high-FIP elementneon is about solar, the low-FIP element iron shows the lowestabundance value, and the other elements also follow the typicalinverse FIP effect.
The computed abundances and DEMs can now be used tomodel the spectra of EQ Peg A and B. We list the calculated the-oretical line fluxes together with the measured fluxes in Table 2.
4.3. Emission measure-independent abundances
Given the ill-posed nature of the DEM determinations and theresulting uncertainties in the DEM distributions, we also investi-gated emission measure-independent abundance determinations.The strongest lines in stellar coronal X-ray spectra (and thuseasy to measure even in spectra with low signal) originate fromthe H-like and He-like lines of carbon, nitrogen, oxygen, neon,magnesium, and silicon, as well as Ne-like Fexvii. In Fig. 7 weshow the line emissivities for these ions as a function of tem-perature. While these lines are formed over a broad tempera-ture range, their emissivity peaks are relatively narrow. Thoselines for which the line contribution functions have similar peakformation temperatures yield a similar temperature dependence.Ratios of their line fluxes depend only weakly on temperature,but strongly on the abundance ratio of the respective elements.Already Acton et al. (1975) proposed to determine the solarcoronal Ne/O abundance ratio from the ratio of the measuredfluxes of the Neix resonance and Oviii Ly α lines. This methodyields a comparably high precision (because of smaller measure-ment uncertainties), and also a higher accuracy (because nosys-tematic uncertainties from the DEM are introduced). Recentex-amples of such approaches were presented by Schmitt & Ness(2002) and Drake & Testa (2005).
While for a given element, the peak formation temperature ofthe H-like ion always exceeds that of the corresponding He-likeion, the peak formation temperatures of the H-like and He-likeions shift to higher temperature with increasing atomic mass.Therefore, pairs of H-like and He-like ions of elements withdif-ferent atomic mass yield similar peak formation temperatures,and their contribution functions have similar shapes. Further ex-amples for such pairs are the H-like lines and He-like lines ofcarbon and nitrogen, nitrogen and oxygen, neon and magne-sium, and magnesium and silicon respectively (Parkinson 1977).However, these ratios are not perfectly temperature-independent,and Drake & Testa (2005) have refined Acton’s method by com-

C. Liefke et al.: Coronal properties of the EQ Peg binary system 9
Fig. 7. Line emissivity curves for different H-like and He-likeions, and Fexvii at 15.01 Å from CHIANTI 5.2 (Landi et al.2006) with the ionization balance from Mazzotta et al. (1998).
puting a linear combination of Nex Ly α and the Neix r line inorder to construct a new contribution function of Ne lines that ismore similar in shape to the Oviii Ly α line.
This suggests to ask in general, which linear combinationsof strong lines without significant blends (i. e. hydrogen- andhelium-like lines and the strongest lines of Fexvii as mentionedabove) of two certain elements yield the smallest temperatureresiduals in their normalized contribution functions. We thuswrite for the abundance ratio of two elements with respectiveabundancesA1 andA2
A1
A2=
f (AZ−11 ) +C1 · f (AZ
1)
C2 · f (AZ−12 ) +C3 · f (AZ
2), (6)
with f (AZ−11 ) and f (AZ−1
2 ) denoting the measured line fluxesfof the He-like resonance lines andf (AZ
1), and f (AZ2) the corre-
sponding H-like Lyα lines of two elements A1 and A2, respec-tively, and
AAFe=
C4 · ( f (AZ−1) +C5 · f (AZ))∑
f (Fexvii)(7)
where∑
f (Fexvii) corresponds tof (Fexvii 15.01 Å) +f (Fexvii 16.78 Å)+ f (Fexvii 17.05 Å)+ f (Fexvii 17.09 Å),to determine relative abundance ratios.
To obtain the coefficientsC1, C2, C3, C4, andC5, we per-formed a minimization of the temperature residuals of the corre-sponding linear combination of the theoretical emissivitiesǫ forthe involved lines over a given temperature range:
χ2 =∑
i
(
ǫi(AZ−11 , Ti)+C1·ǫi(A
Z1 , Ti)−C2·ǫi(A
Z−12 , Ti)−C3·ǫi(A
Z2 , Ti)
)2
(8)for the coefficients in Eqn 6, and
χ2 =∑
i
(
ǫi(AZ−1, Ti) + C5 · ǫi(AZ, Ti) −1
C4·∑
ǫi(Fexvii, Ti))2
(9)for the coefficients in Eqn 7.
In Table 6 we list these coefficients for the temperature rangewhere the line emissivities of all involved lines exceed 1% of
Table 6. Coefficients for Eqns 6 and 7 to obtain temperature-independent abundance ratios.
ratio C1 C2 C3 C4 C5
N / C +0.13 −0.07 +0.73 — —O / N +0.30 +0.01 +0.93 — —Ne / O +0.02 −0.17 +0.69 — —Mg / Ne +0.18 −0.08 +0.87 — —Si /Mg +0.32 +0.05 +0.86 — —S / Si +0.42 +0.15 +0.85 — —Ne / Fe — — — +34.71 +0.46Mg / Fe — — — +67.73 −0.30
their peak emissivity. In the given form, the coefficients con-vert the measured line fluxes in photon flux units to absoluteabundance ratios, i. e. independent from any set of solar photo-spheric abundances; we used line emissivities from CHIANTI5.2 (Landi et al. 2006).
There are still residuals in temperature for these linear com-binations, and their amplitudes differ for each ratio. We foundthe lowest residuals for the Si/Mg ratio and the largest ones forthe Ne/O ratio. In Fig. 8 we illustrate the best-fit linear combi-nation of emissivities that yield the Si/Mg abundance ratio, andfor the Ne/O ratio we refer to Fig. 3 of Liefke & Schmitt (2006),who had used the same coefficients as listed here to calculate theNe/O abundance ratio ofα Centauri. The first six ratios involveonly H-like Ly α and He-like resonance lines. However, the S/Siratio should only be used when the sulfur lines can be measuredwith reasonable signal-to-noise inChandra HETGS spectra.Fexvii can be matched with linear combinations of hydrogen-and helium-like lines of neon or magnesium. The residuals aremuch smaller for Mg, however, the Mg lines are often weak, in-troducing large measurement uncertainties. Especially the weakMg xi line carries a large weight, and for the determination of Feabundances we prefer the Ne/Fe ratio despite its larger residuals.
The coefficients of the linear combinations as listed inTable 6 can be adjusted in some cases where certain line fluxesare not available (e. g. the Cv lines can only be measured withtheChandra LETGS), or are extremely weak (e. g. Mgxi or Nvi,depending on temperature). The line fluxesf (AZ−1
1 ) and f (AZ2)
with Z(A1) >Z(A2) provide the major constituents of the linearcombinations for the ratios not involving Fe.
For example, the Nvi resonance line is often weak in starswith hot coronae and is difficult to measure inChandra MEGspectra, however, this line contributes much less to the nitrogenlinear combination in the O/N ratio than the Nvii Ly α line (i. e.C2 is much smaller thanC3). We readjustedC1, andC3 assumingthe fixed valueC2 = 0 and found only marginal changes for thevalues of the other coefficients listed in Table 6. Although thevalue ofC1 is also quite low for the Nex Ly α line in the Ne/Oratio, the situation is somewhat different. If we readjust the othercoefficient after settingC1 = 0, the residuals are much larger,especially at high temperatures where the emission measuredis-tributions of active stars usually have their maximum.
Finally, the coefficients can be re-computed for the sum ofthe He-like resonance, intercombination, and forbidden lines forcases where these lines can not be resolved (e. g. Sixiii with theChandra LETGS).
We applied Eqns 6 and 7, with the coefficients fromTable 6 multiplied by the solar photospheric abundances ofAsplund et al. (2005), to the line fluxes measured from the spec-tra of EQ Peg A (including and excluding periods of flare activ-

10 C. Liefke et al.: Coronal properties of the EQ Peg binary system
Fig. 8. Best-fit linear combination of the contribution functionsof the H-like Ly α and He-like resonance lines of silicon andmagnesium.
Table 7. Abundance ratios (relative to Asplund et al. 2005) ap-plying temperature structure-independent linear combinations ofcoronal emission lines. Values given in brackets for EQ Peg Acorrespond to the quiescent state.
ratio EQ Peg A EQ Peg BO / N 0.83±0.20 (1.00±0.29) 0.81±0.72Ne / O 2.48±0.31 (2.02±0.16) 2.18±0.41
Mg / Ne 0.20±0.02 (0.19±0.02) 0.32±0.07Si / Mg 2.52±0.21 (2.56±0.25) 2.05±0.44S / Si 1.26±0.20 — —
Ne / Fe 7.30± 0.64 (5.99± 0.34) 5.45± 0.78Mg / Fe 1.27± 0.17 (1.09± 0.19) 1.63± 0.43
ity) and of EQ Peg B and list the resulting abundance ratios inTable 7.
Within the uncertainties, the derived abundance ratios areconsistent for all three datasets. Only the Ne/Fe ratio is con-spicuously lower in the quiescent spectrum of EQ Peg A com-pared to the total spectrum, and again lower for the more inactiveEQ Peg B. Flare- or activity-related changes in the abundance ra-tios cannot be determined from count statistics; however, if real,the differences may be caused by a decreased iron abundancelevel or a higher neon abundance on the more active A compo-nent, especially during flares.
In Table 8 we list the abundance ratios formed from the abso-lute values listed in Table 5 for comparison. They are consistentwithin the errors with the values in Table 7, but the ratios ob-tained from the emission measure-independent method are morerobust and have lower uncertainties.
5. EQ Peg in the context of active M dwarfs
In order to put EQ Peg into the context of other similar late-typestars, we extracted five additionalChandra HETGS spectra ofactive M dwarfs for comparison with our results; our sample thuscontains YY Gem, AU Mic, EV Lac, AD Leo, and Proxima Cenin addition to EQ Peg A and B. Most of these archival observa-tions have been included in many studies (e. g. Ness et al. 2003c,2004; Testa et al. 2007), the X-ray lightcurves and spectra ofAU Mic, EV Lac, and Proxima Cen are shown by Testa et al.(2004). While the two stars in the binary EQ Peg are co-eval, weare now dealing with a range of different ages, rotation periods,
Table 8. Abundance ratios relative to Asplund et al. (2005) ofEQ Peg A and B, determined from the absolute abundanceslisted in Table 5.
EQ Peg A EQ Peg Bratio method 1 method 2 method 1 method 2O / N 1.00±0.25 1.03±0.26 0.94±0.94 1.30±1.24Ne / O 2.71±0.31 2.68±0.32 6.20±3.75 3.19±0.94
Mg / Ne 0.19±0.01 0.19±0.02 0.30±0.05 0.33±0.06Si /Mg 2.32±0.14 2.30±0.25 1.93±0.37 1.93±0.39S / Si 1.25±0.32 1.26±0.46 — —
Ne / Fe 6.00±0.73 5.94±0.51 4.65±0.58 4.88±0.71Mg / Fe 1.15±0.13 1.11±0.13 1.40±0.24 1.59±0.30
and metallicity. In Table 9 we summarize for each star their spec-tral type, distance (from the SIMBAD database), age estimatesand rotation periods from the literature together with observa-tion ID, exposure time, and X-ray luminosity obtained from in-tegration of the dispersed photons over the range 2–25 Å. Thebolometric luminosity forLX/Lbol has been calculated accord-ing to Kenyon & Hartmann (1995). While the X-ray luminositydecreases along the sequence of spectral types,LX/Lbol is in thesaturation regime of≈ −3.3 for all stars except Proxima Cen.
YY Gem is an M0.5 companion of the Castor AB sys-tem. YY Gem itself is an eclipsing binary consisting of two al-most identical early M dwarfs with an orbital period of 0.814days at an inclination of 86.2, separated by 3.88 R⊙. Fromeclipse mapping techniques based on anXMM-Newton obser-vation, Gudel et al. (2001) found similar activity levels on bothcomponents, but concentrated in compact active regions at smallscale heights, i. e. inter-binary loops as discussed for RS CVnsystems are rather unlikely. This is confirmed by Stelzer et al.(2002), who modelled a flare in a simultaneousXMM-Newtonand Chandra LETGS observation. Several strong flares occuralso in the two HETGS observations discussed here. The young(≈ 10 Myrs) star AU Mic, spectral type M1, has the highestX-ray luminosity within 10 pc to the Sun and has thus been ex-tensively observed in X-rays and in the EUV. AU Mic showsa strong level of variability on all time scales and a high flarerate. From the HETGS dataset used here, Linsky et al. (2002)computed an emission measure distribution with a peak tem-perature of logT ≈ 6.8 and subsolar abundances with a pro-nounced inverse FIP effect. Magee et al. (2003) found similarvalues for the abundances based on anXMM-Newton observa-tion. TheChandra HETGS observation of the M3.5 star EV Lacis part of a multiwavelength campaign and has been discussedin detail by Osten et al. (2005, 2006). Several flares occurred to-wards the end of the observation, and Osten et al. (2005) com-pared line ratios with different FIP dependencies during flaresand quiescence and find a slight increase for low FIP/high FIPratios during flares. Osten et al. (2006) derive a subsolar abun-dance level and an inverse FIP effect from an emission measuredistribution of the quiescent state, with values consistent with anXMM observation analyzed by Robrade & Schmitt (2005). BothEV Lac and the M4.5 star AD Leo are young stars from thegalactic disk population. AD Leo is another a well-known flarestar (e. g. Hawley et al. 2003), however, no larger flares haveoccurred during theChandra HETGS observation discussedhere. This dataset was analyzed by Maggio & Ness (2005), withthe focus on density diagnostics. Maggio et al. (2004) foundamild inverse FIP bias based on twoChandra LETGS observa-tions, which is roughly consistent with the results obtained byRobrade & Schmitt (2005) and from anXMM-Newton obser-

C. Liefke et al.: Coronal properties of the EQ Peg binary system 11
Table 9. Properties of active M dwarfs observed withChandra HETGS. X-ray luminosities are computed from the total background-subtracted counts contained in the MEG spectra from 2–25 Å. Values given in brackets correspond to the quiescent state.
star spectral distance age Prot ObsID exposure time logLX log LX/Lbol
type [ pc ] [ Myrs ] [ d ] [ ks ]YY Gem M 0.5 15.27 3701 0.8145 8504/8509 136.0 (81.5) 29.63 (29.43)−3.17 (−3.37)AU Mic M 1 9.94 122 4.8656 17 58.8 (47.4) 29.19 (29.13) −3.48 (−3.54)EQ Peg A M 3.5 6.25 9503 (1.0667) 8453/8484/8485/8486 98.5 (92.8) 28.71 (28.67) −3.19 (−3.23)EV Lac M 3.5 5.05 453 4.3768 1885 100.0 (87.3) 28.63 (28.51)−3.10 (−3.22)AD Leo M 4.5 4.69 4703 2.7/149,10 2570 45.2 — 28.54 — −3.36 —EQ Peg B M 4.5 6.25 9503 (1.0667) 8453/8484/8485/8486 98.5 — 27.89 — −3.39 —Proxima Cen M 5.5 1.30 58004 83.510 2388 42.4 (35.7) 26.85 (26.60) −3.96 (−4.21)
1 Torres & Ribas (2002),2 Zuckerman et al. (2001),3 Parsamyan (1995),4 Yıldız (2007) ,5 Kron (1952),6 Torres et al. (1972),7 Norton et al.(2007),8 Pettersen et al. (1992),9 Spiesman & Hawley (1986),10 Mahmoud (1993),11 Benedict et al. (1998)
vation. van den Besselaar et al. (2003) analyzed the same data.While Robrade & Schmitt and van den Besselaar et al. deter-mined an overall subsolar abundance level, Maggio et al. foundvalues much higher than for the solar photosphere, howeverwith a large uncertainty in the overall normalization. EQ Peg A,EV Lac, and AD Leo have comparable X-ray luminosities.On the basis of a common origin with theα Centauri system,Proxima Cen can be considered older than the Sun. With a spec-tral type of M5.5, it is also the latest star in our sample. ItsX-ray luminosity is comparable to the Sun, more than two or-ders of magnitude lower than that of AU Mic. Nevertheless,Proxima Cen is also a well-known flare star. Gudel et al.(2002a) and Gudel et al. (2004) discussed a large-amplitudelong-duration flare observed withXMM-Newton. Gudel et al.(2004) and Nordon & Behar (2008) derived emission measuredistributions for the different phases of the flare and found abun-dance ratios relative to iron to stay roughly constant, but withan overall tendency to an inverse FIP effect in the absolute level.Two flares are also included in the HETGS observation analyzedhere.
In order to obtain self-consistent results, we applied the samedata reduction and analysis techniques as described above tothe spectra of the other four sample stars. However, even withtypical flare rates and amplitudes for active M dwarfs known,the occurrence of individual flares is randomly distributed, andeach X-ray observation is a snapshot that is not necessarilyrep-resentative of the typical flaring behavior of the observed star.We filtered the observation for quiescent-only emission andin-clude the quiescent luminosities in brackets in the last column ofTables 9.
We also computed the cumulative count spectra for the otherfive spectra as that shown in Fig. 3 for EQ Peg. In Fig. 9 we showthese spectra for the quiescent states of the five stars as labeled inthe legends, together with the well-exposed reference spectrumof Capella. For comparison, we included the cumulative spectraof EQ Peg A and B, bracketing the gray-shaded areas. In theseplots, YY Gem, AU Mic and EV Lac are similar to the EQ Pegsystem, with YY Gem very similar to EQ Peg A, while AU Michas stronger neon lines than EQ Peg, leading to larger steps inthe cumulative distribution. AD Leo is more similar to EQ PegB, and Proxima Cen is even softer. All seven M dwarfs differconsiderably from Capella.
We applied our DEM-independent abundance determinationusing Eq. 6 with the coefficients listed in Table 6 to the totaland quiescent-only spectra of AU Mic, EV Lac, AD Leo, andProxima Cen and list the results in Table 10. These numbers haveto be compared to the relative abundances for EQ Peg A and B
Fig. 9. Cumulative distribution of counts in the quiescent spectraof the reference star Capella and other M dwarfs observed withtheChandra HETGS. The area between the curves for EQ PegA and B is indicated in shades of gray for comparison.
listed in Table 7. For comparison of our results with other abun-dance determinations for our sample stars, we transformed thevalues determined by Robrade & Schmitt (2005), Gudel et al.(2001), Linsky et al. (2002), Magee et al. (2003), Osten et al.(2006), Maggio et al. (2004), and Gudel et al. (2004) to the ref-erence set of solar photospheric abundances from Asplund etal.(2005) and found good agreement within the errors. Only forneon we found a slight tendency of overestimating the abun-dance, as the blends to the neon lines may not always have beentaken properly into account.
For all seven stars, the Ne/O ratio is enhanced by about afactor of 2, which is well-consistent with what Drake & Testa(2005) found for their sample of active stars. Si/Mg is also en-hanced by a factor of about 2, while Mg/Ne is depleted by factorsfrom 3 (EQ Peg B and Proxima Cen) up to 10 (AU Mic). Thevalues for O/N range from 0.3–1.0 times the solar level, partlywith large uncertainties. The Ne/Fe ratio is clearly increased, byfactors ranging from 4.5 (Proxima Cen) to 9 (AU Mic), whilethe Mg/Fe ratio is about solar. In Fig. 10 we give a graphicalrepresentation of the numbers listed in Tables 7 and 10 from thequiescent data.
O/N and Ne/O can be considered as high FIP/high FIP ratios,and within the errors, these ratios do not change with spectraltype. No trends can also be identified for the low FIP/low FIPratios Mg/Fe and Si/Mg. The low FIP/high FIP ratio Mg/Ne onthe other hand clearly increases towards later spectral type, whilethe high FIP/low FIP ratio Ne/Fe decreases.
Mg/Ne and Ne/Fe are sensitive to a possible FIP bias, andboth are anomalously low and high, respectively, for all stars

12 C. Liefke et al.: Coronal properties of the EQ Peg binary system
Table 10. Abundance ratios of other M dwarfs observed with theChandra HETGS. Values obtained for the quiescent state are givenin brackets.
ratio YY Gem AU Mic EV Lac AD Leo Proxima CenO / N 0.62±0.12 (0.57±0.14) 0.48±0.09 (0.48±0.11) 0.53±0.10 (0.76±0.15) 0.60±0.13 0.30±0.09 (0.34±0.14)Ne / O 1.97±0.12 (2.10±0.18) 2.36±0.19 (2.31±0.20) 2.07±0.50 (1.71±0.12) 2.33±0.19 1.72±0.31 (2.06±0.54)
Mg / Ne 0.18±0.02 (0.16±0.02) 0.11±0.01 (0.12±0.02) 0.24±0.02 (0.22±0.02) 0.21±0.02 0.31±0.06 (0.35±0.10)Si /Mg 2.31±0.18 (2.59±0.31) 2.33±0.26 (1.84±0.26) 2.47±0.22 (2.25±0.25) 2.46±0.30 2.48±0.28 (2.50±1.28)S / Si 1.27±0.18 (1.46±0.33) — — 1.82±0.33 — — — —
Ne / Fe 7.08±0.33 (7.34±0.46) 8.85±0.57 (9.03±0.59) 5.73±0.29 (5.17±0.26) 6.78±0.41 4.44± 0.59 (4.45± 0.82)Mg / Fe 1.23±0.19 (1.24±0.24) 0.84±0.18 (1.03±0.26) 1.28±0.15 (1.28±0.15) 1.13±0.19 1.44± 0.35 (1.60± 0.49)
Fig. 10. Relative abundances as a function of spectral type de-rived from the seven M dwarfs as listed in Tables 7 and 10.
in our sample, pointing towards an inverse FIP effect. This re-sult holds for both total and quiescent-only spectra. Sinceweonly have relative abundances, it is unclear whether high-FIPelements are overabundant or low-FIP elements are underabun-dant. A low Mg/Ne ratio may be caused by an enhancement ofneon, as supported by the increased Ne/O ratios, but also by alow Mg abundance, which would match the enhanced Si/Mg ra-tios, and so on.
The trends observed for Ne/Fe and Mg/Ne are roughly inde-pendent of the occurrence of flares. This confirms previous find-ings that strength of the inverse FIP effect scales with the generalactivity level of a star (Gudel et al. 2002b; Telleschi et al. 2005),as activity (in terms of X-ray luminosity) decreases with increas-ing spectral type. While the behavior of the Ne/Fe and Mg/Neratios in our M dwarf sample implies an absolute decrease ofneon with later spectral type, the constant Ne/O ratio does notfit that picture. This indicates that not only a single element likeneon causes this effect, but that the inverse FIP effect in generaldiminishes for later M dwarfs.
6. Discussion
The behavior of M dwarf coronae shows striking changes withspectral type. The early M dwarfs up to a spectral type of≈ M3–M4 observed so far are strong X-ray emitters, show-ing permanent flaring, high coronal temperatures and a pro-nounced inverse FIP effect (Robrade & Schmitt 2005). X-ray lu-minosity, the level and peak temperature of the emission mea-sure, and the flaring rate decrease for later M dwarfs. Whilefor earlier M subclasses, it is difficult – if not impossible –
to distinguish between weak flaring and quiescence, M dwarfsof spectral type M5 or later show periods of quiescence inter-rupted by discrete flares, and their coronal temperatures decrease(Fuhrmeister et al. 2007). Very late M dwarfs (>M7) becomemore and more difficult to detect as quiescent X-ray sources,yet they can still produce enormous X-ray luminosities dur-ing flares. Abundance determinations are difficult for these ob-jects, but Gudel et al. (2004) and Fuhrmeister et al. (2007)foundthe inverse FIP effect to be less pronounced in the M5.5 starsProxima Cen and CN Leo. With our systematic line ratio sur-vey, we can consolidate the trend of the inverse FIP effect inM dwarf coronae weakening with later spectral subclass. This iscoupled to the decrease of the activity observed with later sub-class in general, whileLX/Lbol is similar and dominated by satu-ration effects for all our sample stars except for the latest objectProxima Cen. Apart from the precise strength of single emissionlines that are mostly determined by individual abundances,highresolution X-ray spectra of M dwarfs have a very similar over-all shape. Only the continuum level decreases with later spectraltype, as lower coronal temperatures reduce the amount of truecontinuum emission as well as the pseudo-continuum dominatedby lines of highly ionized iron located at approximately 9–17 Å.The reduction of the continuum level can easily be quantifiedfrom the cumulative spectra and serves as an indicator for theaverage coronal temperature.
Both methods we used for our analysis, the cumulative spec-tra as well as the emission measure independent line ratios,canbe applied to spectra with lower signal where only the strongestlines can be discerned. They are thus also suitable to determinecoronal properties from the spectra of the fainter mid and lateM dwarfs. Only very few grating spectra of such objects areavailable so far, and especially spectra of stars later thanM6would help to confirm the trend that the difference of the Ne/Feand Mg/Ne ratios to solar photospheric values decreases withlater spectral type. However, since the Ne/O and Si/Mg ratiosstay enhanced by about a factor of two, there is no indicationof all abundance anomalies to diminish. So at least in compar-ison to the saturated coronae of active M dwarfs, it is the solarphotosphere which appears anomalous; and the abundances ofM dwarfs seem to “converge” with later spectral subclass, but tovalues differing from the solar photospheric level.
The determination of reference sets of photospheric abun-dances of active M dwarfs is rather difficult, since reliablemodels of the stellar atmosphere including radiative transferare required. The parameters involved in the modeling proce-dure, i. e. the stellar mass, effective temperature, logg, and forM dwarfs, the influence of the stellar chromosphere and pos-sibly the formation of dust, introduce large uncertaintiesin thederived abundances (Zboril & Byrne 1998). Additionally, onlythe abundances of heavier elements, often only that of iron,canbe determined in the photosphere, while light elements likecar-

C. Liefke et al.: Coronal properties of the EQ Peg binary system 13
bon, nitrogen and oxygen or noble gases like neon that dominatethe coronal spectrum leave only weak or no signatures in thephotospheric spectrum.
It may be questionable to line up active M dwarfs exclusivelybased on spectral type, since other parameters, especiallytheage, certainly have a non-negligible influence, and age-activityrelations are well-established over all wavelengths and inpartic-ular for coronal X-ray emission (Vaiana et al. 1992; Favata et al.1994). Our ultraluminous sample star AU Mic forms a propermotion pair with the M4/M4.5 binary AT Mic, both stars aremembers of theβ Pictoris moving group and only about 10–12Myrs old (Zuckerman et al. 2001). Robrade & Schmitt (2005)found AT Mic half an order of magnitude brighter in X-raysthan our sample stars AD Leo, EV Lac and EQ Peg, which havesimilar spectral types. Stars with a common origin, like thetwoZAMS stars AU Mic and AT Mic, or the co-eval components ofthe binary EQ Peg thus provide a testbed independent of suchbiases. The M3.5 and M4.5 components of EQ Peg differ byone spectral subclass, but the X-ray luminosity of the M4.5 sec-ondary is considerably lower, which we can attribute to a fairlyreduced amount of coronal emission measure, but at tempera-tures similar to those found on the primary. Yet, in terms ofLX/Lbol, both stars are in the saturation regime, and thus againcomparable. Similar considerations apply to a larger sample ofdifferent ages, ranging from a few Myrs (AU Mic) to almost oneGyr (EQ Peg); the cumulative spectra of very young stars likeAU Mic or EV Lac are very similar to the much older EQ Pegsystem. Proxima Cen is also by far the oldest object, and theone with the longest rotation period. It is the only star fromoursample whereLX/Lbol deviates from the saturation level, yet itstill fits the picture of the other saturated stars in terms ofabun-dance trends. Here we probably see the well-established rela-tionships between X-ray luminosity and age or, related via spin-down with age, rotation period/rotational velocity and X-ray lu-minosity (Pizzolato et al. 2003; Reiners 2007) or other activityindicators like Hα or Caii emission at work. The age of theother sample stars is less than 1 Gyr and their rotation periodsare typically only a few days. The sample of M dwarfs observedwith high spectral resolution in X-rays is – by necessity – bi-ased towards the more luminous younger objects, and it wouldbe crucial to examine how further old and inactive objects likee. g. Barnard’s star fit into that picture.
During quiescence, coronal densities on active stars typi-cally range between 1010–1011 cm−3 for the low-temperatureplasma (≈ 2 MK) traced by the Ovii triplet (Ness et al. 2003a),and between 1011–1012 cm−3 for Neix (≈ 4 MK). Significantlyhigher values have so far only been observed during huge flares(Gudel et al. 2002a; Liefke et al. in preparation), but in general,coronal densities tend to increase during periods of increasedactivity and lower amplitude flaring (e. g. Maggio & Ness 2005;Fuhrmeister et al. 2007). Mitra-Kraev & Ness (2006) thus devel-oped a statistical approach that showed that the different f /i-ratios observed during flares and quiescence on EV Lac are ac-tually highly significant.
Flares can considerably change the X-ray properties of ac-tive M dwarf stars. The flare plasma often dominates the coronalemission, although the dimensions of the flaring loops seldomlyreach the size of the star itself, and the flaring region typicallycovers only a small fraction of the stellar surface. The plasmatemperature and emission measure can increase by more thanan order of magnitude during the strongest flares, which sub-sequently results in an enhanced level of continuum emission.The bulk of line emission is dominated by high-temperatureions. Based on current flare models, the flare plasma is largely
composed of evaporated chromospheric or photospheric mate-rial filling the loop. In this context, abundance gradients betweenthe different layers of the atmosphere, like the FIP effect ob-served on the Sun, become important. Nordon & Behar (2007)and Nordon & Behar (2008) investigated changes in the FIP biasduring several larger flares on a sample of different active stars.For the very active stars that show an inverse FIP effect dur-ing quiescence, they found abundance ratios of the scheme highFIP/low FIP like Ne/Fe to decrease during flares, i. e. the inverseFIP effect turns into a solar-like pattern or even a FIP effect. Thisis in good agreement with the trends we find in our M dwarfsample. Thus abundance gradients, resulting in a different com-position of the evaporated flare plasma, seem to be a commonfeature, and in contradiction to the corona, the underlyingabun-dances of the lower atmospheric layers in active M dwarfs ap-proach a more solar photospheric like pattern. This finding isalso supported by Liefke et al. (in preparation), who found thecoronal iron abundance of the M5.5 dwarf CN Leo to increaseby a factor of two to the solar photospheric level during a largeflare.
To what extent flares do have to be considered as the “usual”behavior of a stellar corona? Early M dwarfs are in a state of per-manent flaring, and even during phases of apparent quiescence,the underlying basal coronal flux is difficult to disentangle fromunresolved weaker flares. While larger flares can be separated,the characteristic flickering of early M dwarfs has to be takenas their typical “quasi-quiescent” behavior. The average coro-nal temperatures and densities of active stars will lower whenthe data is restricted to this quiescent state. However, we do notfind that the flares included in the total datasets of our sevensample stars introduce large changes in the observed abundanceratios. Since the data do not include huge flares, this indicatesa smooth transition between the quasi-quiescent state and in-termediate flares, which supports the assumption that the unre-solved flickering is indeed composed of smaller flares. Whenswitching to intermediate and late M dwarfs and their single,discrete flares, it may on the other hand be possible to pin downthe true basal coronal flux as observed on the Sun during qui-escence, which seems to approach solar coronal conditions forthese less active stars. The smooth transition in X-ray luminos-ity, flare rate, coronal temperatures and abundances we observein our sequence of very active early M dwarfs towards interme-diate and late M dwarfs, i. e., from stars with radiative interiorsto fully convective interiors, suggests that the different dynamomechanisms thought to operate in these stars to not lead to easilyobservable consequences in their coronal properties.
7. Summary and conclusions
We have investigated the coronal properties of the M3.5/M4.5EQ Peg binary system from theirChandra HETGS spectra. Nolarge flares occur during our observations, and we find coronaldensities ranging from 4·1010 cm−3 to 3·1011 cm−3 or consistentwith the low-density limit from the Ovii and Neix triplets, i. e.values typical for active stars. The ratio of X-ray luminositiesis 6:1 for EQ Peg A and B, but in terms ofLX/Lbol, both starsare saturated. The differential emission measures of both compo-nents peak around 3 MK, and their abundances are similar andfollow the inverse FIP effect.
We compared all seven M dwarfs observed so far with theChandra HETGS with two methods also suitable for spectrawith low signal. The slope of the cumulative spectrum, whichtraces the continuum level and therefore the average coronaltemperature, is very similar for spectral types M0.5 to M4 and

14 C. Liefke et al.: Coronal properties of the EQ Peg binary system
then decreases. Emission measure-independent abundance ratiosbased on the line fluxes of strong lines with a similar temperaturedependence confirm the existence of abundance anomalies com-pared to the solar photosphere for all M dwarfs in our sample.The ratios sensitive to a FIP bias, i. e. Mg/Ne and Ne/Fe, showa clear trend with increasing spectral type to approach the so-lar photospheric level, while ratios insensitive to a FIP bias likeSi/Mg and Ne/O stay at a constant level. These trends seem tobe independent of the age of the stars.
Acknowledgements. C.L. acknowledges financial support by the DLR under50OR0105. J.-U.N. gratefully acknowledges support provided by NASA throughChandra Postdoctoral Fellowship grant PF5-60039 awarded by the Chandra X-ray Center, which is operated by the Smithsonian Astrophysical Observatory forNASA under contract NAS8-03060. This research made use of the SIMBADdatabase, operated at CDS, Strasbourg, France. CHIANTI is acollaborativeproject involving the NRL (USA), RAL (UK), MSSL (UK), the Universitiesof Florence (Italy) and Cambridge (UK), and George Mason University (USA).
ReferencesActon, L. W., Catura, R. C., & Joki, E. G. 1975, ApJ, 195, L93Asplund, M., Grevesse, N., & Sauval, A. J. 2005, in ASP Conf. Ser. 336: Cosmic
Abundances as Records of Stellar Evolution and Nucleosynthesis, 25–38Benedict, G. F., McArthur, B., Nelan, E., et al. 1998, AJ, 116, 429Brosius, J. W., Davila, J. M., Thomas, R. J., & Monsignori-Fossi, B. C. 1996,
ApJS, 106, 143Browning, M. K. 2008, ApJ, 676, 1262Chabrier, G. & Baraffe, I. 1997, A&A, 327, 1039Chabrier, G. & Kuker, M. 2006, A&A, 446, 1027Delfosse, X., Forveille, T., Perrier, C., & Mayor, M. 1998, A&A, 331, 581Dobler, W., Stix, M., & Brandenburg, A. 2006, ApJ, 638, 336Drake, J. J. & Testa, P. 2005, Nature, 436, 525Durney, B. R., De Young, D. S., & Roxburgh, I. W. 1993, Sol. Phys., 145, 207Favata, F., Micela, G., Sciortino, S., & Barbera, M. 1994, inAstrophysics
and Space Science Library, Vol. 187, Frontiers of Space and Ground-BasedAstronomy, ed. W. Wamsteker, M. S. Longair, & Y. Kondo, 589–+
Favata, F., Reale, F., Micela, G., et al. 2000, A&A, 353, 987Feldman, U. & Laming, J. M. 2000, Phys. Scr, 61, 222Fleming, T. A., Giampapa, M. S., Schmitt, J. H. M. M., & Bookbinder, J. A.
1993, ApJ, 410, 387Fuhrmeister, B., Liefke, C., & Schmitt, J. H. M. M. 2007, A&A,468, 221Gudel, M., Audard, M., Magee, H., et al. 2001, A&A, 365, L344Gudel, M., Audard, M., Reale, F., Skinner, S. L., & Linsky, J. L. 2004, A&A,
416, 713Gudel, M., Audard, M., Skinner, S. L., & Horvath, M. I. 2002a, ApJ, 580, L73Gudel, M., Audard, M., Sres, A., et al. 2002b, in ASP Conf. Ser. 277: Stellar
Coronae in the Chandra and XMM-NEWTON Era, ed. F. Favata & J. J.Drake, 497–501
Haisch, B. M., Butler, C. J., Doyle, J. G., & Rodono, M. 1987, A&A, 181, 96Hawley, S. L., Allred, J. C., Johns-Krull, C. M., et al. 2003,ApJ, 597, 535Jackson, P. D., Kundu, M. R., & White, S. M. 1989, A&A, 210, 284Katsova, M. M., Livshits, M. A., & Schmitt, J. H. M. M. 2002, inAstronomical
Society of the Pacific Conference Series, Vol. 277, Stellar Coronae in theChandra and XMM-NEWTON Era, ed. F. Favata & J. J. Drake, 515–520
Kenyon, S. J. & Hartmann, L. 1995, ApJS, 101, 117Kron, G. E. 1952, ApJ, 115, 301Lacy, C. H., Moffett, T. J., & Evans, D. S. 1976, ApJS, 30, 85Landi, E., Del Zanna, G., Young, P. R., et al. 2006, ApJS, 162,261Liefke, C., Fuhrmeister, B., & Schmitt, J. H. M. M. in preparationLiefke, C., Reiners, A., & Schmitt, J. H. M. M. 2007, Memorie della Societa
Astronomica Italiana, 78, 258Liefke, C. & Schmitt, J. H. M. M. 2006, A&A, 458, L1Liefke, C. & Schmitt, J. H. M. M. in preparationLinsky, J. L., Ayres, T. R., Brown, A., & Osten, R. A. 2002, Astron. Nachr., 323,
321Magee, H. R. M., Gudel, M., Audard, M., & Mewe, R. 2003, Advances in Space
Research, 32, 1149Maggio, A., Drake, J. J., Kashyap, V., et al. 2004, ApJ, 613, 548Maggio, A. & Ness, J.-U. 2005, ApJ, 622, L57Mahmoud, F. M. 1993, Ap&SS, 209, 237Mazzotta, P., Mazzitelli, G., Colafrancesco, S., & Vittorio, N. 1998, A&AS, 133,
403Mitra-Kraev, U. & Ness, J.-U. 2006, in High Resolution X-raySpectroscopy:
towards XEUS and Con-X
Moffatt, H. K. 1978, Magnetic field generation in electrically conducting fluids(Cambridge, England, Cambridge University Press, 1978. 353 p.)
Monsignori Fossi, B. C., Landini, M., Fruscione, A., & Dupuis, J. 1995, ApJ,449, 376
Mullan, D. J. & MacDonald, J. 2001, ApJ, 559, 353Ness, J.-U., Audard, M., Schmitt, J. H. M. M., & Gudel, M. 2003a, Advances in
Space Research, 32, 937Ness, J.-U., Brickhouse, N. S., Drake, J. J., & Huenemoerder, D. P. 2003b, ApJ,
598, 1277Ness, J.-U., Gudel, M., Schmitt, J. H. M. M., Audard, M., & Telleschi, A. 2004,
A&A, 427, 667Ness, J.-U. & Jordan, C. 2008, MNRAS, 385, 1691Ness, J.-U., Schmitt, J. H. M. M., Audard, M., Gudel, M., & Mewe, R. 2003c,
A&A, 407, 347Ness, J.-U., Schmitt, J. H. M. M., Burwitz, V., Mewe, R., & Predehl, P. 2002,
A&A, 387, 1032Ness, J.-U. & Wichmann, R. 2002, Astron. Nachr., 323, 129Nordon, R. & Behar, E. 2007, A&A, 464, 309Nordon, R. & Behar, E. 2008, A&A, 482, 639Norton, A. J., Wheatley, P. J., West, R. G., et al. 2007, A&A, 467, 785Osten, R. A., Hawley, S. L., Allred, J., et al. 2006, ApJ, 647,1349Osten, R. A., Hawley, S. L., Allred, J. C., Johns-Krull, C. M., & Roark, C. 2005,
ApJ, 621, 398Pallavicini, R., Kundu, M. R., & Jackson, P. D. 1986, in Lecture Notes in Physics,
Berlin Springer Verlag, Vol. 254, Cool Stars, Stellar Systems and the Sun, ed.M. Zeilik & D. M. Gibson, 225–228
Pallavicini, R., Tagliaferri, G., & Stella, L. 1990, A&A, 228, 403Parker, E. N. 1955, ApJ, 122, 293Parkinson, J. H. 1977, A&A, 57, 185Parsamyan, E. S. 1995, Astrophysics, 38, 206Pettersen, B. R. 1976, Institute of Theoretical Astrophysics Blindern Oslo
Reports, 46, 1Pettersen, B. R., Olah, K., & Sandmann, W. H. 1992, A&AS, 96, 497Pizzolato, N., Maggio, A., Micela, G., Sciortino, S., & Ventura, P. 2003, A&A,
397, 147Raassen, A. J. J., Ness, J.-U., Mewe, R., et al. 2003, A&A, 400, 671Reiners, A. 2007, A&A, 467, 259Robrade, J., Ness, J.-U., & Schmitt, J. H. M. M. 2004, A&A, 413, 317Robrade, J. & Schmitt, J. H. M. M. 2005, A&A, 435, 1073Rutledge, R. E., Basri, G., Martın, E. L., & Bildsten, L. 2000, ApJ, 538, L141Sanz-Forcada, J., Favata, F., & Micela, G. 2004, A&A, 416, 281Schmitt, J. H. M. M. & Liefke, C. 2002, A&A, 382, L9Schmitt, J. H. M. M. & Ness, J.-U. 2002, A&A, 388, L13Schmitt, J. H. M. M. & Ness, J.-U. 2004, A&A, 415, 1099Schmitt, J. H. M. M., Reale, F., Liefke, C., et al. 2008, A&A, 481, 799Spiesman, W. J. & Hawley, S. L. 1986, AJ, 92, 664Stelzer, B., Burwitz, V., Audard, M., et al. 2002, A&A, 392, 585Stelzer, B., Schmitt, J. H. M. M., Micela, G., & Liefke, C. 2006, A&A, 460, L35Telleschi, A., Gudel, M., Briggs, K., et al. 2005, ApJ, 622,653Testa, P., Drake, J. J., & Peres, G. 2004, ApJ, 617, 508Testa, P., Drake, J. J., Peres, G., & Huenemoerder, D. P. 2007, ApJ, 665, 1349Torres, C. A. O., Ferraz Mello, S., & Quast, G. R. 1972, Astrophys. Lett., 11, 13Torres, G. & Ribas, I. 2002, The Astrophysical Journal, 567,1140Vaiana, G. S., Maggio, A., Micela, G., & Sciortino, S. 1992, Memorie della
Societa Astronomica Italiana, 63, 545van den Besselaar, E. J. M., Raassen, A. J. J., Mewe, R., et al.2003, A&A, 411,
587Yıldız, M. 2007, MNRAS, 374, 1264Zboril, M. & Byrne, P. B. 1998, MNRAS, 299, 753Zuckerman, B., Song, I., Bessell, M. S., & Webb, R. A. 2001, ApJ, 562, L87
List of Objects
‘EQ Peg’ on page 2‘AD Leo’ on page 6‘YY Gem’ on page 10‘AU Mic’ on page 10‘EV Lac’ on page 10‘AD Leo’ on page 10‘Proxima Cen’ on page 10‘AT Mic’ on page 13‘CN Leo’ on page 13