cornell agricultural economics staff...
TRANSCRIPT
CORNELL
AGRICULTURAL ECONOMICS
STAFF PAPER
SEG:MENTING TIlE MILK MARKET
INTO bST·PRODUCED AND
NON·bST·PRODUCED MILK
Loren W. Tauer
January 1993 No. 93-02
Department of Agricultural Economics
Cornell University Agricultural Experiment Station
New York State College of Agriculture and Life Sciences A Slalutory College of the Slate Universily
Cornell University, Ithaca, New York, 14853
• ...

SEGMENTING THE MILK MARKET INTO bST-PRODUCED AND NON-bST-PRODUCED MILK
by
Loren W. Tauer*
Abstract
This paper discusses the value to milk producers and consumers of segmenting
the milk market into bST-produced milk and non-bST-produced milk markets, versus
losing milk consumption from consumers who will not consume bST-produced milk.
Results indicate that both bST-using producers and non-bST-using producers benefit
from a segmented market when compared to losing milk markets. Even if market loss
does not occur, segmenting the market benefits producers not able to effectively use b~T
and may even benefit bST users if the use of bST significantly shifts the supply curve for
milk. Non-bST consuming consumers benefit from the availability of non-bST milk, and
consumers who are indifferent to the use of bST pay about the same price in a segmented
market.
•
·Professor, Department of Agricultural Economics, Cornell University. H.M. Kaiser, R.J. Kalter, B.F. Stanton, and W.G. Tomek provided comments. Paper presented at the 1993 Southern Agricultural Economics Association annual meeting in Tulsa, Oklahoma, January 30 - February 3, 1993. This is a revision of Working Paper 92-09, Department of Agricultural Economics, Cornell University.
SEGMENTING THE MILK MARKET INTO bST·PRODUCED AND NON·bST·PRODUCED MILK
Introduction
The value of product differentiation to producers is well known in industrial
organization and in agricultural marketing where market orders operate (firole). In these
instances, a firm or a coalition of producers are able to differentiate the market for a
product or commodity such that two separate demands exist, with one demand being
more inelastic. The result is the enhancement of revenue with often minimal cost of
differentiation.
Is product differentiation of value when a coalition of producers cannot be
formed, such that the differentiation partitions the set of producers into two groups, with
each group only supplying one of the two markets? This paper looks at that issue in the
context of bST (bovine Somatotropin) and non-bST-produced milk, but the issue applies
to any product where there is a real or perceived difference in quality. Other examples
include organic and nonorganic p'roduce, range-fed versus confinement-produced chick
ens or eggs, and identity-preserved grains. In all of these cases, there is no direct transfer
of revenue from one market segment to the other via market orders or other gain-sharing
mechanisms. Yet, there may be gains to both market segments if farmers producing the
"traditional" product can shift to an "alternative" product and in the process enhance total
revenue to both groups of producers.
In the article, I first discuss the concept of separating the milk market into bST
produced and non-bST-produced milk consumers and discuss the implications of lost
markets. To complete the economic analysis, milk supply curves for both bST- and non
•bST-using producers are presented in both a constant cost and increasing cost industry.
Finally, numerical results computed under various elasticities and supply curve shifts are
presented to show the range of impacts.
2
Milk. Demand
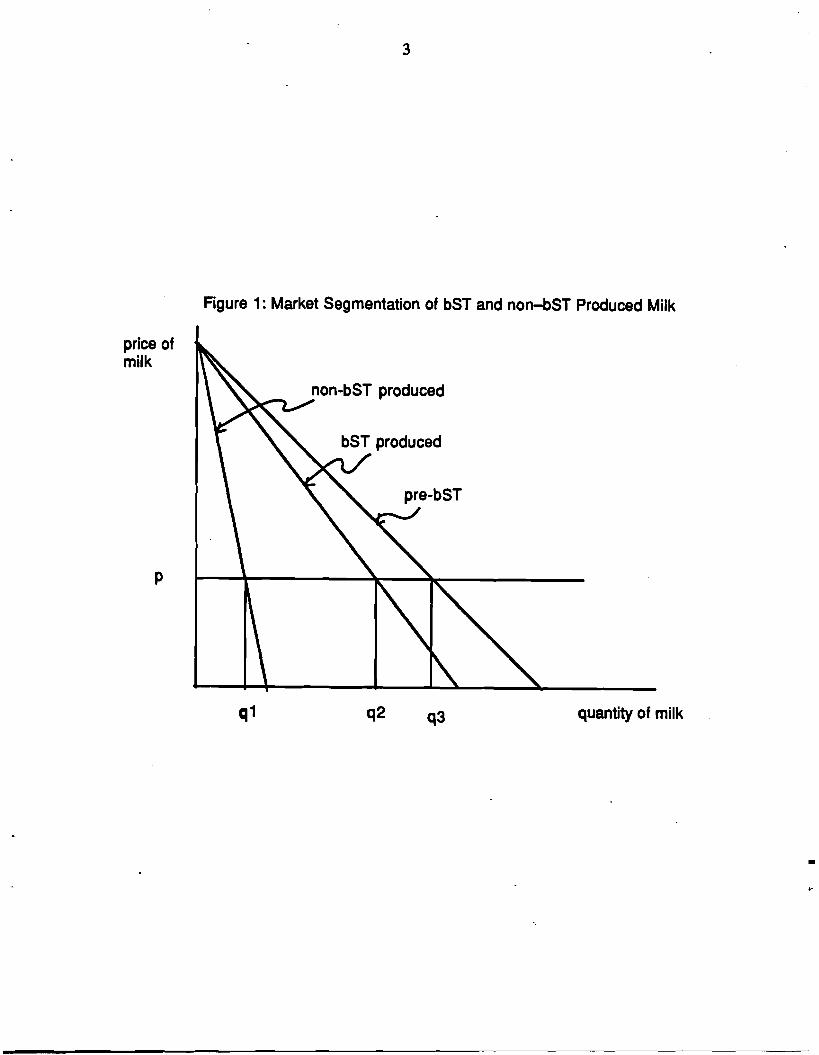
It is assumed that the introduction of bST-produced milk on the market segments
consumers into those who will buy bST-produced milk as if it were regular milk and
those who will only consume non-bST-produced milk. This is illustrated in Figure 1
where the demand curve for milk before the introduction of bST is partitioned into non
bST and bST milk. It is assumed that at any price the quantity of non-bST milk and bST
milk demanded equals the quantity of milk demanded before the introduction of bST. In
Figure 1, ql + q2 ='13. Any difference in total milk consumption post-bST, compared to
pre-bST, would only be due to the price effects of moving up or down the segmented
demand curves.
Partitioning the milk market into bST and non-bST milk requires labeling milk so
that consumers can identify the differentiated product. At a minimum, this necessitates
identifying the non-bST-produced milk with a label, since the transference of demand is
caused by those searching for non-bST-produced milk. The legality and economics of
labeling are separate issues discussed by Caswell and Padberg.
The demand functions shown in Figure 1 are also farm gate, rather than final
demand curves, such that marketing margins are removed. Partitioning the demand
function into two segments that sum to the original function implies that marketing mar
gins are not altered by market segmentation. However, labeling and maintaining two
separate milk markets may increase marketing costs and margins, such that the two seg
mented markets do not sum to the original nondifferentiated market. Marketing margins
are discussed by Gardner. The impact of changing marketing margins on farm prices is
discussed by Fisher.
Some survey studies have shown that some consumers will stop or reduce their •
consumption of milk if bST is introduced (Kaiser, Scherer and Barbano; Preston,
McGuirck and Jones). However, since these consumers were willing to consume milk
before bST, they should be willing to drink non-bST milk. Any reduction in milk
3
Figure 1: Market Segmentation of bST and non-bST Produced Milk
price of milk
p
q1 q2 q3 quantity of milk
•
4
consumed (besides price effects) would be due to protest or lack of confidence that any
milk labeled as non-bST is indeed non-bST produced. This scenario can be illustrated in
Figure 2 by a horizontal shift in the vertical axis of the demand schedule and then the
segmentation of the truncated demand schedule into non-bST and bST-produced milk. It
is clear in this case that with the rightward shift in the quantity origin that ql + q2 < q3>
such that at any price less milk will be consumed after bST is introduced. Even if
consumers do not boycott milk, it is unlikely that every manufactured milk product will
be segmented into bST and non-bST components simply because the market size of some
products is insufficient to warrant separation. Some non-bST product consumers may
substitute non-bST products for these specialty items, but it is unlikely that an additional
American variety of cheese, for instance, can substitute completely for a more "exotic"
cheese. Thus, some market loss is likely to occur.
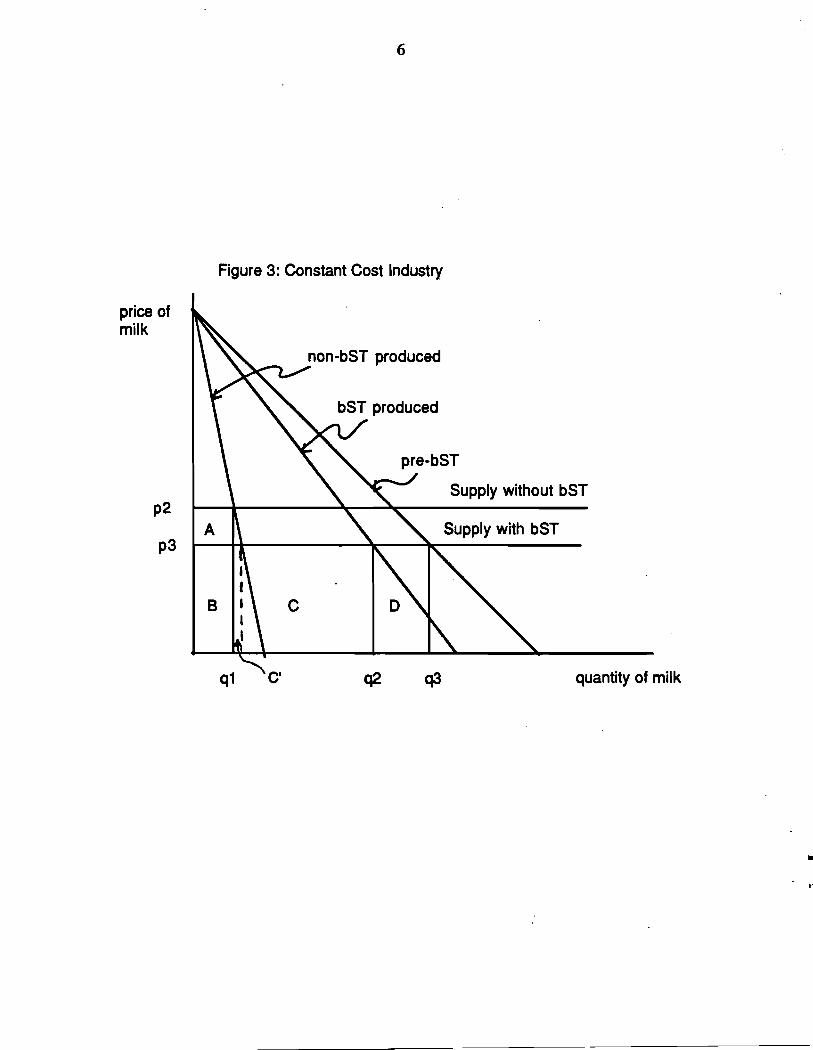
The Constant Cost Industry
In order to determine the welfare effects of segmenting the milk market, it is nec
essary to know the milk supply functions without the introduction of bST, with the use of
bST, and without the use of bST. The simplest case would be if the dairy industry is a
constant cost industry. That scenario is represented in Figure 3. The supply curve with
no bST is shown as a perfectly horizontal line since milk can be produced at a constant
price. This does not preclude an increasing cost curve for individual producers, but that
additional producers can enter or leave the industry with the same minimum cost as other
producers. That minimum cost includes the necessary return to unpaid la~or, manage
ment, and equity to keep those resources in dairy production. Since the use of bST
reduces the unit cost of production, the supply curve for bST users is a parallel downward • shift in the non-bST supply curve. Since producers can freely enter or leave the industry,
the supply curve for non-bST users is identical to the supply curve before the availability
ofbST.
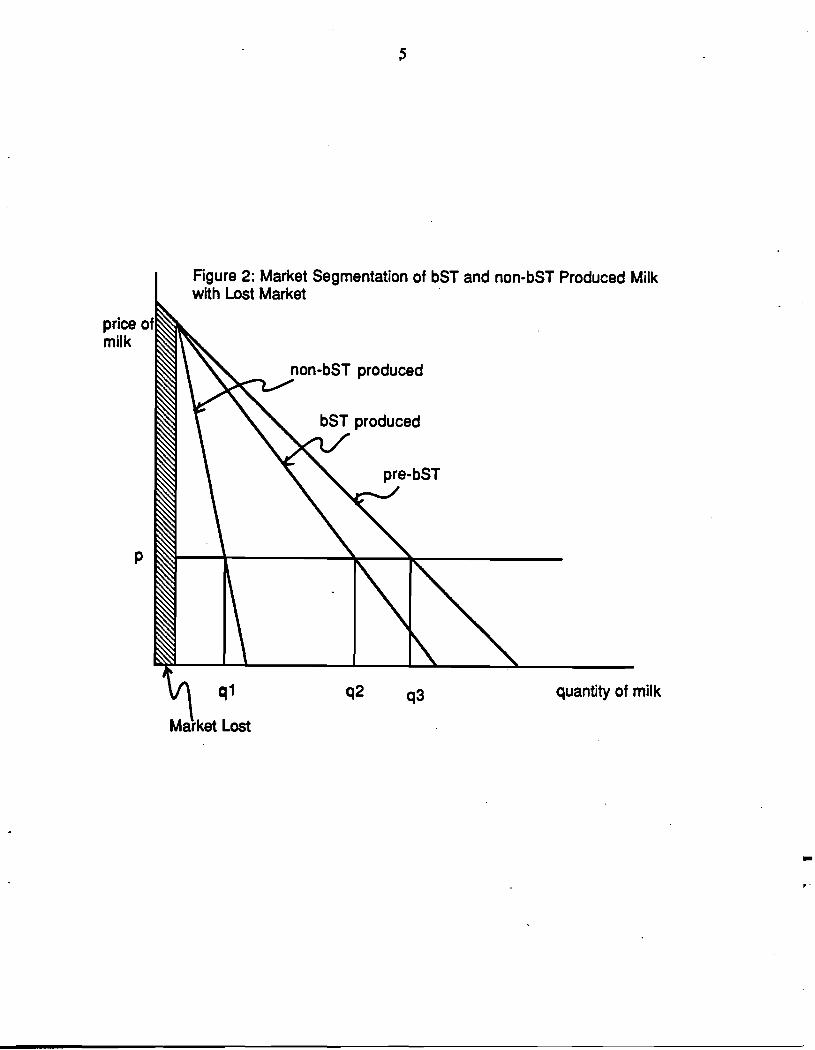
Figure 2: Market Segmentation of bST and non-bST Produced Milk with Lost Market .
quantity of milk
-
price of milk
p
q1 q2 q3
6
Figure 3: Constant Cost Industry
price of milk
pre-bST
Supply without bST p2
A Supply with bST p3
B
q1 q2 q3 quantity of milk
• t
-7
With no market differential, when bST is introduced, the market equilibrium is
price P3 and quantity q3. Total receipts to the industry is area B + C + D. Since this also
entails the cost of production, there is no producer surplus earned. Consumer surplus is
increased, however.
If the market is differentiated, the receipts of the bST users are B + C, and the
receipts of the non-bST users are A + B, for total receipts to the sector of A + 2B + C.
Receipts under market differentiation are greater than without market differentiation if
A + B > D. Since area C ' (which is a subarea of q plus area B is equal to area D
because the price and quantities are the same, moving up an inelastic portion of the non
bST milk demand curve ensures that the areas under the demand curve at the higher
price, A + B, is greater than areas B + C '. Although total receipts are increased with
market differentiation, the total quantity of milk produced is lower since q3 > ql + qz.
The higher price of pz for non-bST-produced milk reduces total demand for all milk but
increases revenue. The larger revenue is necessary to offset the greater costs of
producing some milk without bST than producing all milk with bST. Since less quantity
is produced, fewer dairy producers are necessary if farmers have homogeneous cost
structures, which is typically assumed with a constant cost industry. Fewer farmers
would probably be viewed as a negative development by any organization of fanners.
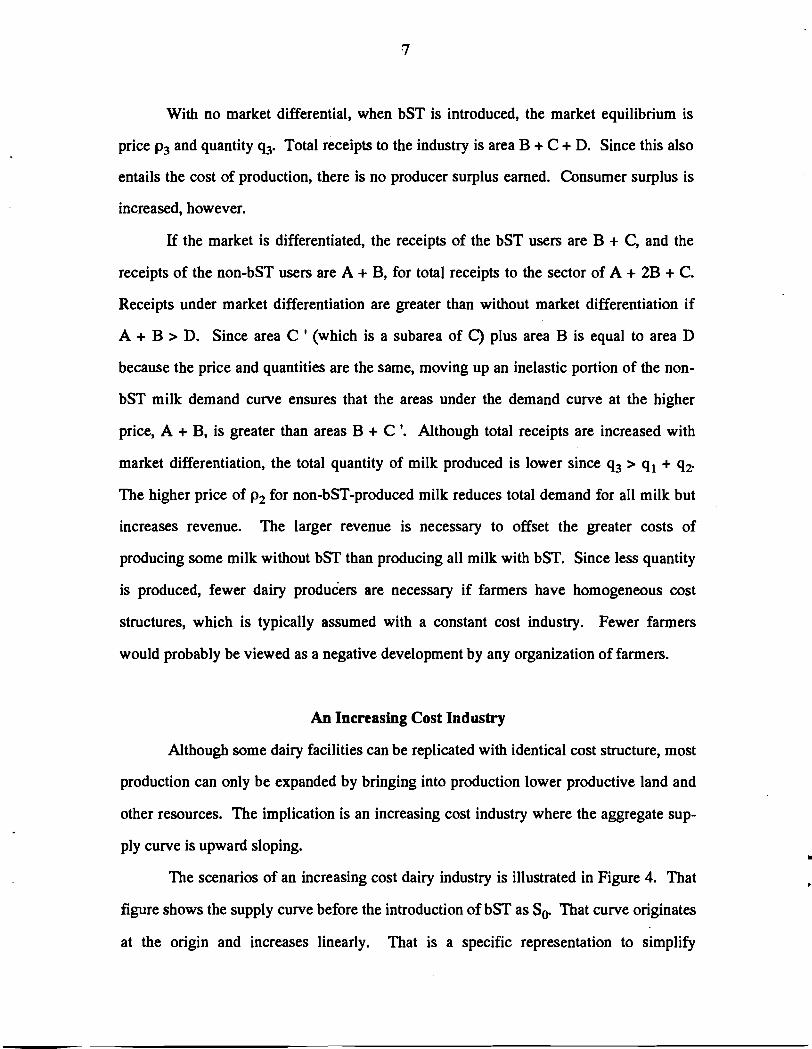
An Increasing Cost Industry
Although some dairy facilities can be replicated with identical cost structure, most
production can only be expanded by bringing into production lower productive land and
other resources. The implication is an increasing cost industry where the aggregate sup
ply curve is upward sloping. •
The scenarios of an increasing cost dairy industry is illustrated in Figure 4. That
figure shows the supply curve before the introduction of bST as So- That curve originates
at the origin and increases linearly. That is a specific representation to simplify
•
8
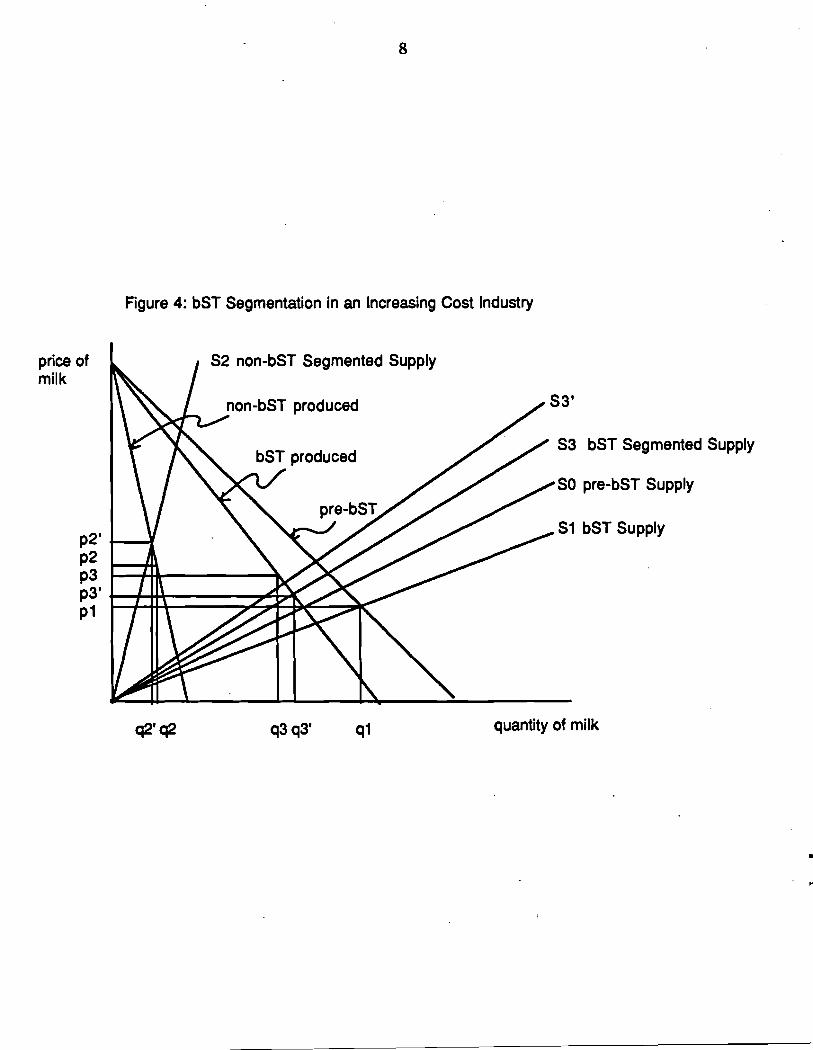
Figure 4: bST Segmentation in an Increasing Cost Industry
price of S2non-bST Segmented Supply milk
S3 bST Segmented Supply
SO pre-bST Supply
S1 bST Supply p2' +---1 p2 p3 p3' +---+-t++----_~.,t[ p1
quantity of milk q2'q2 q3q3' q1
9
exposition. An increasing cost industry can also be represented by a nonlinear,
increasing curve that does not intersect the origin.
The introduction of bST and complete adoption will shift the supply curve from
So to Sl' This is a rotation or divergent shift of w percent. A rotational shift is com
monly used for technological change and simplifies exposition, but it is not universally
accepted. Parallel or convergent shifts have been proposed for technology change, and
alters the economic results (Lindner and Jarrett; Wise). The only complete supply curves
generated with and without bST technology showed irregular shifts in a jagged increasing
supply curve (Magrath and Tauer).
The introduction of bST and complete use leads to an equilibrium price of P1 and
quantity of q1' If the milk market is segmented into bST and non-bST components, the
supply curves become S2 for non-bST use and S3 for bST use. These curves are gener
ated by partitioning the pre-bST supply curve, So> into S2 and S3" such that S2 + S3' = So>
and then by rotating S3' by w percent to produce S3' Thus, So < S2 + S3 < Sl at any price
p. With the demand curve for milk segmented, the equilibrium conditions are P2' and q2'
for non-bST milk and P3' and q3' for bST milk.
However, the above segmentation is only valid if production arbitrage does not
exist between the two markets. Non-bST users may not be able to move into the bST
users group because they are not able to generate the bST yields, but bST users could
stop using (or not use) bST if the price-spread between non-bST and bST milk became
greater than the cost decrease from using bST.
A possible arbitrage is shown by movement of the non-bST market to P2 and q2
and the bST market to P3 and q3' It is assumed that P2 - P3 is the cost advantage of using
bST. Each quantity of milk moved into the non-bST market reduces the quantity of milk in the bST market by 100 plus w percent.
The model illustrated in Figure 4 demonstrates that segmenting the milk market
not only produces a higher milk price for non-bST users but may also for bST users,
10
although the total quantity of milk produced by both groups is less than if the market is
not segmented. However, these results are dependent upon the elasticities of the demand
curves and the bST supply curve shift, as will be demonstrated in the application section.
Consumers who are indifferent to the use of bST may pay a higher price than if the
market were not segmented. Consumers who refuse to drink bST-produced milk are
better off at any price with a differentiated market since they then have non-bST milk to
consume.
Applications
To quantify the changes shown in Figure 4 and to determine the ambiguous
changes in producer prices and surplus, numerical applications were computed using
various demand elasticities and supply curve shifts. A demand elasticity for milk of
approximately -.3 and lower is common in the literature (Kaiser, Streeter and Liu).
Blayney and Mittelhammer estimated a supply elasticity of .89, but Chavas, Kraus and
Jesse report elasticities over 2.0, and estimates as low as .29 are common from
adjustment cost models (Weersink). A supply curve from the origin implies a supply
elasticity of 1.0. Alternative elasticities will be used later. The 1986-1990 national
average price of milk was $12.92 per cwt., and 149.42 billion pounds were consumed.
Given that information and a demand elasticity of milk of -.3 and a supply elasticity of
1.0, linear demand and supply functions were constructed. The aggregate demand
function for milk is P =55.9867 - .28820. The aggregate supply function for milk is P =
.08650.
In a review of the consumer surveys to bST milk, Smith and Warland conclude
that 11.3 percent of respondents would stop drinking milk produced using bST. (A small • percentage would also reduce their consumption.) Thus, the market demand was parti
tioned into 11.3 percent non-bST and 88.7 percent bST milk at every price. That pro
duced a demand function for non-bST-produced milk ofPN=55.9867 - 2.55OQN and for
11
other milk (bS1) of PB = 55.9867 - .3249OB• The demand function for milk if 11.3 per
cent of the market is simply lost is 51.1201 - .28820.
bST impact studies have used various yield increases and cost reductions (Fallert
et al.). I elected to use a bST cost reduction of 8 percent. This means that at any level of
aggregate milk production the cost of producing that milk using bST is 8 percent lower
than if that milk were produced without the use of bST. The supply function for bST
produced milk becomes PB = .079580B• A cost reduction of 20 percent is used later.
Using these values, the model illustrated by Figure 4 was empirically solved with
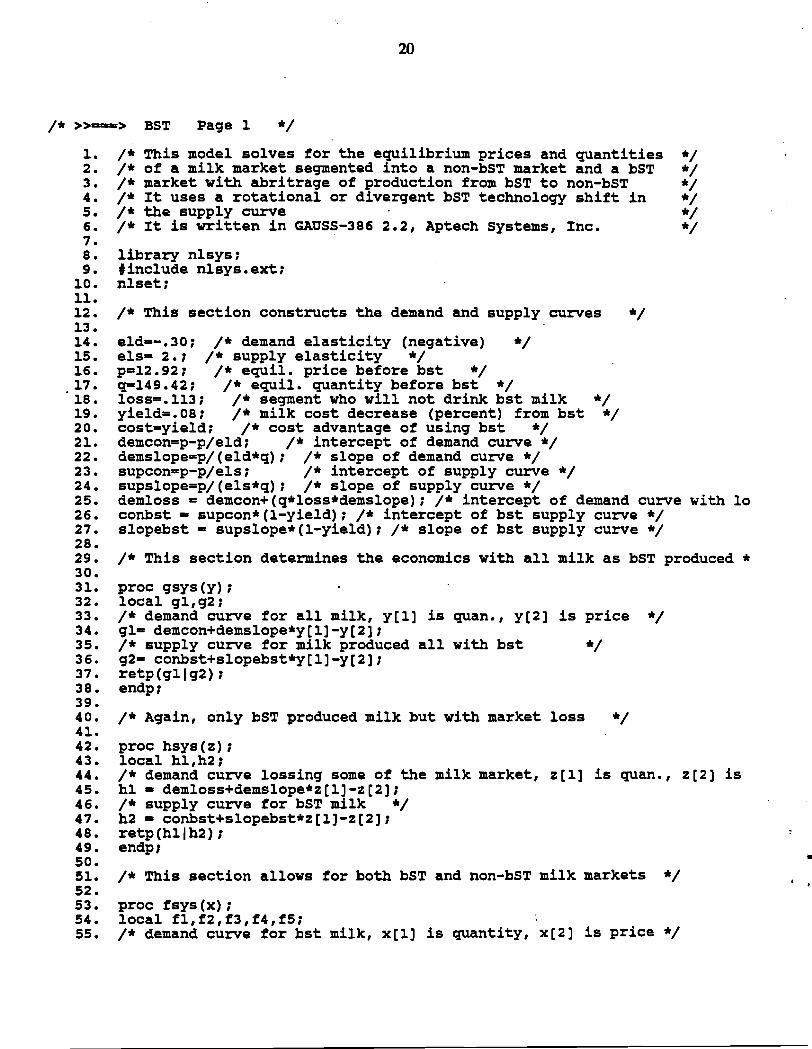
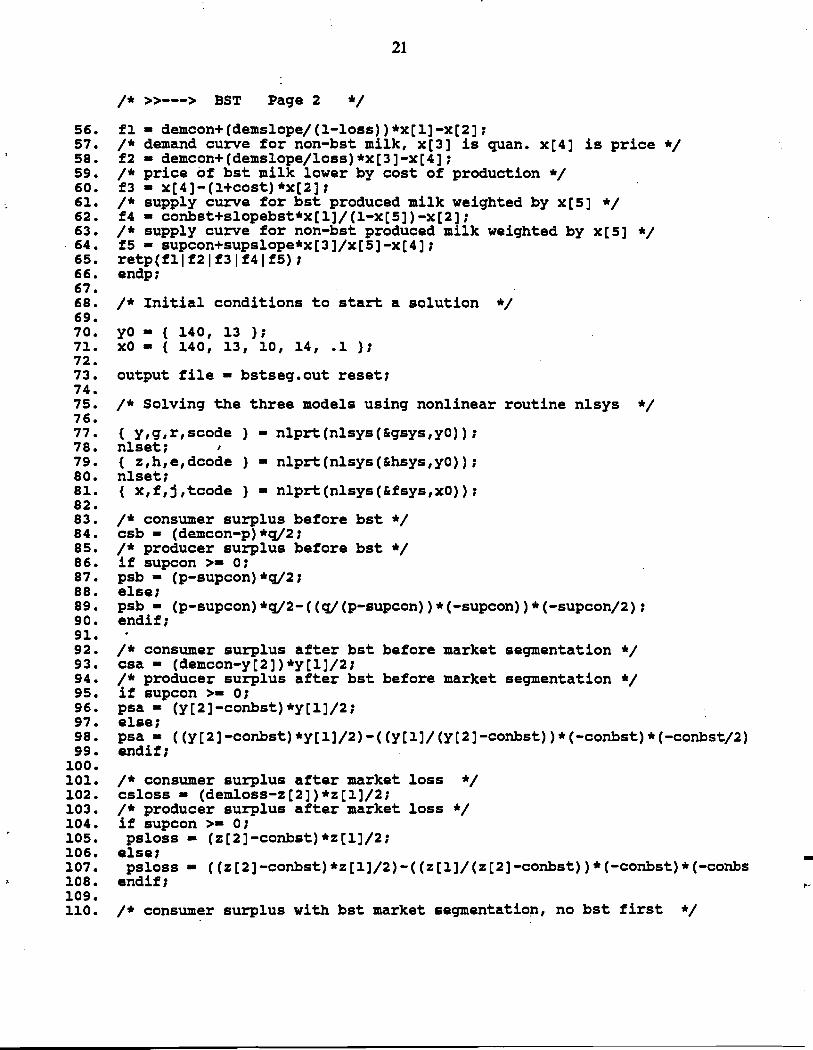
and without a segmented market. Appendix A contains a listing of the GAUSS program
used to solve for equilibrium price and quantity values and to calculate producer and con
sumer surpluses. The results are summarized in Table 1. Before bST, the price of milk is
$12.92 per cwt., and the quantity ofmilk produced is 149.42 billion pounds. Producer
surplus is 965 units; consumer surplus is 3,218 units. The introduction of bST, complete
adoption and a nonsegmented milk market produces Pl = $12.11 per cwt. and ql =
152.23 billion pounds. Producer surplus is reduced to 922, and consumer surplus is
increased to 3,340.
Segmenting the market with arbitrage produces P3 = $12.09 and q3 = 135.08 for
the bST-produced milk, with producer surplus of 817, and P2 =13.06 and q2 =16.83
for the non-bST-produced milk with producer surplus of 110. This is a total producer
surplus of 927, which is larger than the producer surplus with a nonsegmented market.
The bST users receive a price that is $.03 lower than if the market was not segmented,
but the non-bST users receive a price that is even higher than the price before bST is
introduced. The average price received by all producers is $12.20, with total output. of
151.92 billion ~ounds.
•
..
l2
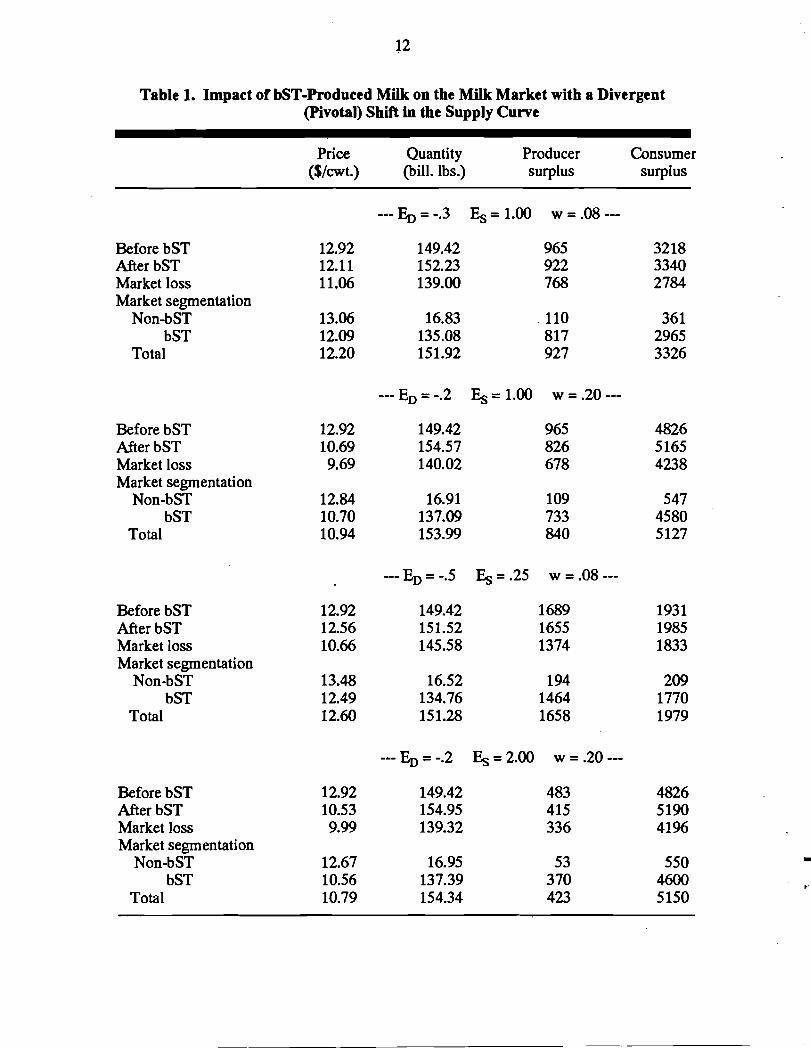
Table 1. Impact of bST-Produced Milk on the Milk Market with a Divergent (Pivotal) Shift in the Supply Curve
Price Quantity Producer (S/ewt.) (bill. lbs.) surplus
--- En =-.3 Es = 1.00 w = .08 --
Before bST 12.92 149.42 965 After bST 12.11 152.23 922 Market loss 11.06 139.00 768 Market segmentation
Non-bST 13.06 16.83 110 bST 12.09 135.08 817
Total 12.20 151.92 927
--- ED = -.2 Es = 1.00 w = .20 --
Before bST 12.92 149.42 965 AfterbST 10.69 154.57 826 Market loss 9.69 140.02 678 Market segmentation
Non-bST 12.84 16.91 109 bST 10.70 137.09 733
Total 10.94 153.99 840
--- ED = -.5 Es = .25 w = .08 --
Before bST 12.92 149.42 1689 AfterbST 12.56 151.52 1655 Market loss 10.66 145.58 1374 Market segmentation
Non-bST 13.48 16.52 194 bST 12.49 134.76 1464
Total 12.60 151.28 1658
--- En = -.2 Es = 2.00 w = .20 --
Before bST 12.92 149.42 483 After bST 10.53 154.95 415 Market loss 9.99 139.32 336 Market segmentation
Non-bST 12.67 16.95 53 bST 10.56 137.39 370
Total 10.79 154.34 423
Consumer surplus
3218 3340 2784
361 2965 3326
4826 5165 4238
547 4580 5127
1931 1985 1833
209 1770 1979
4826 5190 4196
550 4600 5150
-.
13
In contrast, if instead of segmenting the markett 11.3 percent of the demand is
lostt the impact on producers is ·significant. The price of milk falls to $11.06 and only
139 billion pounds are consumed. Producer surplus falls to 768. Although milk con
sumers buy milk at a much lower pricet the exodus of milk consumers because of bST
reduces consumer surplus to 2t784.
The same general results are obtained when the original demand elasticity is -.2t
-.4t or -.5 (not shown). Howevert with a more significant supply curve rotation of .20
rather than .08t and a demand elasticity of -.2t bST-using producers experience a slightly
higher milk price of $10.70 with a segmented market than the $10.69 they would receive
with a nonsegmented market. If the supply curve shift is .25t then the price premium for
bST users in a segmented market is 3 cents rather than 1 cent (not shown). In any caset
all producers are better off than losing a portion of the milk markett and non-bST
producers receive a higher price when they can supply a non-bST market rather than
compete in the bST market. In fact, non-bST users may receive a higher price for their
milk than they received pre-bST.
Also reported in Table 1 are results with a supply elasticity of 2 and of .25 at the
equilibrium price of $12.92 and quantity of 149.42. Since these linear supply curves do
not intersect the origint the impact of bST on these curves were implemented by shifting
the intercepts down by multiplying by (l-w) and reducing the slope by multiplying by (1
w). At any aggregate milk quantitYt bST milk can be produced at a cost w percent lower
than non-bST milk.
The results are similar to the results under a supply elasticity of one. The
introduction of bST lowers the milk pricet and the loss of markets reduces the price
further. Segmenting the milk market into bST and non-bST segments significantly •
increases the price for non-bST users -- in the first case (third scenario in Table 1)
actually increasing the milk price above the level before the introduction of bST. In a
segmented market, bST users may again experience a higher milk price with a segmented
14
market compared to a nonsegmented bST market as illustrated by the fourth scenario in
Table 1.
Conclusions
If some consumers will not buy milk produced with bST, the opportunity to seg
ment the market into bST- and non-bST-produced milk benefits all producers since both
bST users and nonusers receive a higher milk price than if the market were nonseg
mented. Their producer surplus is higher with a segmented market, but it is still lower
than if bST were not introduced. This assumes that some consumers do not stop buying
milk altogether. If, instead of segmenting the market, the consumers who do not wish to
consume bST-produced milk simply stop buying milk, the impact on producers is signifi
cant, with a much lower milk price and producer surplus. It appears that non-bST-using
producers will always benefit from a segmented market, in some circumstances earning a
higher price than even before bST is introduced. Producers using bST may experience a
slightly higher or lower price if the market is segmented, depending upon the
circumstances.
This analysis assumes a national milk market, although regional markets with
integration exist in the U.S. The marketing costs of segmenting the milk market was
assumed identical to a single market. However, the marketing system must bear the cost
of keeping bST- and non-bST-produced milk differentiated. Those costs and how they
are absorbed need to be investigated. Large costs may reduce the benefits shown here.
The permanence of the demand differentiation is another unknown. As time passes, non
bST milk drinkers may migrate to bST milk consumption if they become convinced that
bST-produced milk is healthy to drink. •
Finally, the role of marketing orders or government support programs in a seg
mented market were not incorporated into the analysis. Most ~ilk in the U.S. is sold in
marketing orders where producers receive a blended milk price based upon the disposi

15
tion of milk within their order rather than the use of their own specific milk to the fluid or
processed market. In addition, a floor is placed on milk prices by government's purchase
of milk products. How market order and support programs would operate in a segmented
milk market needs to be explored if a segmented market is likely. However, it is not
unrealistic to think that if bST is approved then milk is milk in the government programs,
regardless of whether or not it was produced using bST technology.
•
17
References
Caswell, J.A and D.I. Padberg. "Toward a More Comprehensive Theory of Food
Labels." American Journal ofAgricultural Economics 74(1992): 460-468.
Blayney, D.P. and R.c. Mittelhammer. "Decomposition of Milk Supply Response into
Technology and Price-Induced Effects." American Journal of Agricultural Eco
nomics 72(1990): 864-872.
Chavas, J.P., AF. Kraus and E.V. Jesse. "A Regional Analysis of Milk Supply Response
in the United States." North Central Journal ofAgricultural Economics 12(1990):
149-164.
Fallert, R., T. McGuckin, C. Betts, and G. Bruner. "bST and the Dairy Industry: A
National, Regional, and Farm Level Analysis." U.S. Department of Agriculture.
October 1987.
Fisher, B.S. "The Impact of Changing Marketing Margins on Farm Prices." American
Journal ofAgricultural Economics 63(1981): 261-263.
Gardner, B.L. "The Farm-Retail Price Spread in a Competitive Food Industry." Ameri
can Journal ofAgricultural Economics 57(1975): 399-409.
Kaiser, H.M., C.W. Scherer and D.M. Barbano. "Consumer Perceptions and Attitudes
Towards Bovine Somatotropin." Northeastern Journal of Agricultural and
Resource Economics 21(1992): 10-20.
Kaiser, H.M., D.H. Streeter and D.J. Liu. "Welfare Comparisons of U.S. Dairy Policies
With and Without Mandatory Supply Control." American Journal ofAgricultural
Economics 70(1988): 848-858.
Lindner, R.K. and F.G. Jarrett. "Supply Shifts and the Size of Research Benefits."
American Journal ofAgricultural Economics 60(1978): 48-58. •
Magrath, W.B. and L.W. Tauer. "New York Milk Supply with Bovine Growth
Hormone." North Central Journal ofAgricultural Economics 10(1988): 233-241.
18
Perrin, R.K. "Ex-Ante Evaluation of Experimental Technology." Dept. of Agricultural
and Resource Economics, North Carolina State University (Unpublished paper).
Preston, W.P., AM. McGuirck and G.M. Jones. "Consumer Reaction to the Introduction
of Bovine Somatotropin." In JA Caswell (ed.), The Economics of Food Safety.
New York: Elsevier Science Publishing Co., Inc. 1991.
Smith, RJ. and R.H. Warland. "Consumer Responses to Milk from bST-Supplemented
Cows." In M.e. Hallberg (ed.), Bovine Somatotropin and Emerging Issues.
Boulder, CO: Westview Press. 1992.
Tirole, J. The Theory ofIndustrial Organization. Cambridge, MA: MIT Press. 1988.
Weersink, A "Nonrobustness of Dynamic Dual Models of the Northeastern and U.S.
Dairy Industries." Northeastern Journal ofAgricultural and Resource Economics
19(1990): 12-16.
Wise, W.S. "The Shift of Cost Curves and Agricultural Research Benefits." Journal of
Agricultural Economics 35(1984): 21-30.
..
19
APPENDIX A
• ,.
20
/* »---> BST Paqe 1 */
1. 2. 3. 4. 5. 6. 7. 8. 9.
10. 11. 12. 13. 14. 15. 16. 17. 18. 19. 20. 21. 22. 23. 24. 25. 26. 27. 28. 29. 30. 31. 32. 33. is quan., y[2] is price */34. 35. all with bst */ 36. 37. 38. 39. 40. /* Aqain, only bST produced milk but with market loss */ 41. 42. proc hsys(z)1 43. local hl,h21 44. /* demand curve lossing some ot the milk market, z[l] is quan., Z[2] is 45. hl - demloss+demslope*z[1]-z[2] 1 46. /* supply curve tor bST milk */ 47. h2 - conbst+slopebst*z[1]-z[2]; 48. retp(hllh2)149. endp; 50. • 51. /* This section allows tor both bST and non-bST milk markets */ 52. 53. proc tsys(x) 1 54. local fl,t2,t3,t4,t51 55. /* demand curve tor bst milk, x[l] is quantity, x[2] is price */
21
/* »---> BST Page 2 */
56. fl - demcon+(demslope/(1-10ss»*x[1]-X[2]; 57. /* demand curve for non-bst milk, x[3] is quan. x[4] is price */ 58. f2 - demcon+(demslope/loss)*X[3]-X[4]; 59. /* price of bst milk lower by cost of production */ 60. f3 - x[4]-(1+cost)*x[2]; 61. /* supply curve for bst produced milk weighted by X[5] */ 62. f4 - conbst+slopebst*X[1]/(1-X[5])-x[2]; 63. /* supply curve for non-bst produced milk weighted by X[5] */ 64. f5 - supcon+supslope*x[3]/X[5]-x[4];65. retp(fllf2If3If4If5);66. endp; 67. 68. /* Initial conditions to start a solution */ 69. 70. yO - { 140, 13 ); 71. xO - { 140, 13, 10, 14, .1 ) 1 72. 73. output file - bstseg.out reset; 74. 75. /* Solving the three models using nonlinear routine nlsys */ 76. 77. { y,g,r,scode ) - nlprt(nlsys(&gsys,yO»1 78. nlset; 79. { z,h,e,dcode ) - nlprt(nlsys(&hsys,yO»; 80. nlsetl 81. { x,f,j,tcode ) - nlprt(nlsys(&fsys,xO»; 82. 83. /* consumer surplus before bst */ 84. csb - (demcon-p)*q/2; 85. /* producer surplus before bst */ 86. if supcon >- 0; 87. psb - (p-supcon)*q/2; 88. else; 89. psb - (p-supcon)*q/2-((q/(p-supcon»*(-supcon»*(-supcon/2); 90. endif; 91. 92. /* consumer surplus after bst before market segmentation */ 93. csa - (demcon-y[2])*y[1]/2; 94. /* producer surplus after bst before market segmentation */ 95. if supcon >- 0; 96. psa - (y[2]-conbst)*y[1]/2; 97. else; 98. psa - ((y[2]-conbst)*y[1]/2)-((y[1]/(y[2]-conbst»*(-conbst)*(-conbst/2) 99. endif;
100. 101. /* consumer surplus after market loss */ 102. cs10ss - (demloss-z[2])*z[1]/2;103. /* producer surplus after market loss */ 104. if supcon >- 0; 105. ps10ss - (z[2]-conbst)*Z[1]/2; 106. else; 107. ps10ss - ((Z[2]-conbst)*z[1]/2)-((Z[1]/(z[2]-conbst»*(-conbst)*(-conbs 108. endif; 109. 110. /* consumer surplus with bst market segmentation, no bst first */
---------------------------------------------
111. 112. 113. 114. 115. 116. 117. 118. 119. 120. 121. 122. 123. 124. 125. 126. 127. 128. 129. 130. 131. 132. 133. 134. 135. 136. 137. 138. 139. 140. 141. 142. 143. 144. 145. 146. 147. 148. 149. 150. 151. 152. 153. 154.
22
1* »---> BST Paqe 3 *1
csan - (demcon-x[4])*x[3]/2; csab - (demcon-x[2])*x[1]/2; csat - csan+csab;1* producer surplus with market seqmentaion, first no bst users *1 if supcon >- 0; psan - (x[4]-supcon)*x[3]/2;else; psan - (x[4]-supcon)*x[3]/2-((x[3]/(x[4]-supcon»*(-supcon)*(-supcon/2»endif; if supcon >- 0; psab - (X[2]-conbst)*X[1]/2;else; psab - (x[2]-conbst)*x[1]/2-((x[1]/(x[2]-conbst»*(-conbst)*(-conbst/2»endif; psat-psan+psab;
1* Printout of the results *1
format lRO 15,2: lprint " DIVERGENT (PIVOTAL) SHIFT IN THE SUPPLY FROM BST ":
lprint "Before bst" p q psb csb:
lprint; lprint " " Prod.
.. " Surplus" "
Price" " Cons. Surplus" ;
.Quantity"
lprint " lprint "After bst "y[2] yell psa csa: lprint "Market loss" z[2] z[l] psloss csloss: lprint "Market seqmentation"; lprint " No-bST " x[4] x[3] psan csan; lprint " bST " x[2] x[l] psab csab; totalq - x[1]+x[3];weiqhedp a (x[4]*x[3]+x[2]*x[1])/totalq;lprint " Total " weiqhedp totalq psat csat; lprintformat lRO,,----------------------------------------------------------------
12,4; lprint "demand elasticity lprint "supply elasticity lprint "bST cost advantaqelprint "proportion no-bST lprint ;
output off;
"eld; "els; " cost; "loss;
•
OTHER AGRICULTURAL ECONOMICS STAFF PAPERS
No. 92-11
No. 92-12
No. 92-13
No. 92-14
No. 92-15
No. 92-16
No. 92-17
No. 92-18
No. 92-19
No. 92-20
No. 93-01
An Economic Analysis of the u.s. Honey Industry: Survey Sample and Mailing
An Economic Analysis of the u.S. Honey Industry: Data Documentation
An Economic Analysis of the u.S. Honey Industry: Data Summary
An Economic Analysis of the u.S. Honey Industry: Econometric Model
sustainable Development and Economic Growth in the Amazon Rainforest
Modifications in Intellectual Property Rights Law and Effects on Agricultural Research
The Cost of Producing Milk as a Management Tool
The Inefficiency and Unfairness of Tradable CO 2 Permits
Environmental Costs and NAFTA Potential Impact on the u.S. Economy and Selected Industries of the North American Free Trade Agreement
Capital Asset Issues for the Farm Financial Standards Task Force
Managing Transboundary Water Conflict: The United States and its Boundary Commissions
Lois Schertz Willett
Lois Schertz Willett .
Lois Schertz Willett
Lois Schertz Willett
Jorge Madeira Nogueira
Steven C. Kyle
William Lesser
Eddy L. LaDue
Jon D. Erickson
Duane Chapman
Eddy L. LaDue •
David J. Allee Leonard B. Dworsky Albert E. Utton