corneal collagen crosslinking for keratoconus and corneal ... · older, axial topography pattern...
TRANSCRIPT
ARTICLE
Corneal collagen cross
linking for keratoconusand corneal ectasia: One-year resultsPeter S. Hersh, MD, Steven A. Greenstein, Kristen L. Fry, OD, MS
Q 2011 A
Published
SCRS an
by Elsev
PURPOSE: To evaluate 1-year outcomes of corneal collagen crosslinking (CXL) for treatment of ker-atoconus and corneal ectasia.
SETTING: Cornea and refractive surgery subspecialty practice.
DESIGN: Prospective randomized controlled clinical trial.
METHODS: Collagen crosslinking was performed in eyes with keratoconus or ectasia. The treatmentgroup received standard CXL and the sham control group received riboflavin alone. Principal out-comes included uncorrected (UDVA) and corrected (CDVA) distance visual acuities, refraction,astigmatism, and topography-derived outcomes of maximum and average keratometry (K) value.
RESULTS: The UDVA improved significantly from 0.84 logMAR G 0.34 (SD) (20/137) to0.77 G 0.37 logMAR (20/117) (P Z .04) and the CDVA, from 0.35 G 0.24 logMAR (20/45) to0.23 G 0.21 logMAR (20/34) (P<.001). Fifteen patients (21.1%) gained and 1 patient lost(1.4%) 2 or more Snellen lines of CDVA. The maximum K value decreased from baseline by 1.7G3.9 diopters (D) (P<.001), 2.0G 4.4 D (PZ .002), and 1.0G 2.5 D (PZ .08) in the entire cohort,keratoconus subgroup, and ectasia subgroup, respectively. The maximum K value decreased by2.0 D or more in 22 patients (31.0%) and increased by 2.0 D or more in 3 patients (4.2%).
CONCLUSIONS: Collagen crosslinking was effective in improving UDVA, CDVA, the maximumK value, and the average K value. Keratoconus patients had more improvement in topographicmeasurements than patients with ectasia. Both CDVA and maximum K value worsened betweenbaseline and 1 month, followed by improvement between 1, 3, and 6 months and stabilizationthereafter.
Financial Disclosure: No author has a financial or proprietary interest in any material or methodmentioned. Additional disclosure is found in the footnotes.
J Cataract Refract Surg 2011; 37:149–160 Q 2011 ASCRS and ESCRS
Keratoconus and corneal ectasia occurring after laserin situ keratomileusis (LASIK) are noninflammatoryprocesses in which the cornea deforms in associationwith thinning and biomechanical weakening.1 The in-cidence of keratoconus is approximately 1 in 2000,2
and the literature contains hundreds of cases of post-LASIK ectasia.3 Both diseases can result in irregularastigmatism, progressive myopia, or visual impair-ment secondary to stromal scarring.2 Because ofoptical aberrations4,5 caused by this progressive dis-tortion and bowing of the cornea in keratoconus andectasia, patients usually require rigid or complexcurvature contact lenses to achieve good functionalvision6; spectacle correction frequently does not resultin acceptable quality of vision. Furthermore, keratoco-nus tends to progress over the second to fifth decadesof life2 and can lead to intolerance of contact lenses
d ESCRS
ier Inc.
and, ultimately, the need for corneal transplantationin 10% to 20% of cases.7 New treatments availableto patients with keratoconus and ectasia includeintrastromal corneal ring segment implantation,8–10
conductive keratoplasty,11 and corneal collagen cross-linking (CXL).
Collagen crosslinking has emerged as a promisingtechnique to slow or stop the progression of keratoco-nus12 as well as post-LASIK ectasia.13 In this proce-dure, riboflavin (vitamin B2) is administered inconjunction with ultraviolet A (UVA, 365 nm). The in-teraction of riboflavin and UVA causes the formationof reactive oxygen species, leading to the formationof additional covalent bonds between collagen mole-cules, with consequent biomechanical stiffening ofthe cornea.14 In this study, we analyzed primary visualacuity, refractive, and topographic outcomes in
0886-3350/$ - see front matter 149doi:10.1016/j.jcrs.2010.07.030

150 CORNEAL COLLAGEN CROSSLINKING IN KERATOCONUS AND ECTASIA
patients with keratoconus and post-LASIK ectasiaover a 1-year postoperative period. In addition, wecompared the treatment groups to sham and fellow-eye control groups.
PATIENTS AND METHODS
Patients were enrolled as part ofmulticenter prospective ran-domized controlled clinical trials performed under guide-lines of the U.S. Food and Drug AdministrationA,B andapproved and monitored by an investigational reviewboard. This study was compliant with the U.S. Health Insur-ance Portability and Accountability Act. All patients pro-vided informed consent. Randomization was computergenerated and, on the procedure day, a sealed envelopewas opened revealing whether the eye would be in thesham or treatment group. Patients were aware of their ran-domly assigned group.
The inclusion criteria included patients 14 years of age orolder, axial topography pattern consistent with keratoconusor corneal ectasia, an inferior–superior ratio greater than 1.5on topography mapping, a corrected distance visual acuity(CDVA) worse than 20/20, and a diagnosis of progressivekeratoconus or LASIK-induced or photorefractive keratec-tomy (PRK)-induced ectasia. Progressive keratoconus orectasia was defined as 1 or more of the following changesover a period of 24 months: an increase of 1.00 diopter (D)or more in the steepest keratometry (K) measurement, anincrease of 1.00 D or more in manifest cylinder, an increaseof 0.50 D or more in manifest refraction spherical equivalent(MRSE). Exclusion criteria included patients with a historyof corneal surgery, corneal pachymetry less than 300 mm,history of chemical injury or delayed epithelial healing,and pregnancy or lactation during the course of the study.
Treatment Group
Contact lens wearers were instructed to discontinuespherical soft lenses for a minimum of 3 days and soft toricrigid-gas permeable and hard lenses for a minimum of
Submitted: March 2, 2010.Final revision submitted: July 30, 2010.Accepted: July 30, 2010.
From the Cornea and Laser Eye Institute–Hersh Vision Group, CLEICenter for Keratoconus (Hersh, Greenstein, Fry), Teaneck, and theDepartment of Ophthalmology, UMDNJ–New Jersey MedicalSchool (Hersh), Newark, New Jersey, USA.
Additional financial disclosure: Dr. Hersh is a paid medical consul-tant to Avedro, Inc.
Supported in part by PeschkeMeditrade GmbH, Zurich, Switzerland,and an unrestricted grant to the Department of Ophthalmology,UMDNJ–New Jersey Medical School from Research to PreventBlindness, Inc., New York, New York, USA.
Corresponding author: Peter S. Hersh, MD, Cornea and Laser EyeInstitute–Hersh Vision Group, CLEI Center for Keratoconus, 300Frank W. Burr Boulevard, Suite 71, Teaneck, New Jersey 07666,USA. E-mail: [email protected].
J CATARACT REFRACT SURG -
2 weeks before the preoperative eye examination. Contactlens wearers required confirmation of a stable refraction at2 examinations that were at least 7 days apart. A stablerefraction was determined as one in which the MRSE andkeratometry measurements at the first visit did not differby more than 0.75 D from the respective measurements atthe second visit.
Patients were initially randomized into a treatment orcontrol group. The treatment group received standardUVA–riboflavin 0.1% CXL treatment. Corneal CXL was per-formed according to the methodology described byWollensak et al.12 Initially, a topical anesthetic agent was ad-ministered and the central 9.0 mm epithelium removed bymechanical debridement. Riboflavin (0.1% in 20% dextranT500 solution) was then administered topically every 2 min-utes for 30 minutes. Riboflavin absorption throughout thecorneal stroma and anterior chamber was confirmed byslitlamp examination. Ultrasound (US) pachymetry wasperformed and if the cornea was thinner than 400 mm,hypotonic riboflavin (0.1% in sterile water) was adminis-tered, 1 drop every 10 seconds for 2-minute sessions, afterwhich US pachymetry was performed to ascertain that thestroma had swollen to more than 400 mm. This was repeateduntil adequate corneal thickness was obtained. The corneawas aligned and exposed toUVA 365 nm light for 30minutesat an irradiance of 3.0 mW/cm2 (UV-X system, IROC AG).During UVA exposure, isotonic riboflavin administrationwas continued every 2 minutes. Postoperatively, antibioticand corticosteroid drops were administered, a soft contactlens bandage was placed, and the eye was reexamined atthe slitlamp. The contact lens was removed after the epithe-lial defect had closed. Antibiotics and corticosteroid dropswere continued 4 times daily for 1 week and 2weeks, respec-tively. Patients were followed for 12 months postoperativelyand had complete examinations at 1, 3, 6, and 12 months.
Sham Control Group
The sham control group received riboflavin 0.1% ophthal-mic solution alone. In this group, the epithelium was notremoved. Riboflavin was administered topically every2 minutes for 30 minutes. Next, the cornea was exposed toa sham treatment in which the UVA light was not turnedon, during which time riboflavin was administered topicallyevery 2 minutes for an additional 30 minutes. The sham con-trol patients were followed for 3 months postoperatively, atwhich point the study eye crossed over to the treatmentgroup and received full CXL treatment.
Fellow-Eye Control Group
In addition to the sham control group, a fellow-eye controlgroupwas analyzed. The fellow eyes of patients who did nothave CXL treatment bilaterally were included in this group.This group consisted of eyes with frank keratoconus or ecta-sia that did not have CXL, eyes with evidence of disease thatdid not meet the inclusion criteria of this study, and eyeswith no evidence of disease. Visual acuity and topographymeasurements were analyzed at baseline and 12 monthsand compared with the postoperative measurements in thetreatment group at the same time points.
Outcome Measures
Visual Acuity and Refraction The uncorrected distancevisual acuity (UDVA) and CDVA were measured
VOL 37, JANUARY 2011

151CORNEAL COLLAGEN CROSSLINKING IN KERATOCONUS AND ECTASIA
preoperatively and postoperatively at 1, 3, 6, and 12 months.Visual acuity measurements were obtained under controlledlighting conditions using amodified Lighthouse Early Treat-ment of Diabetic Retinopathy Study visual acuity test (2ndedition) with Sloan letters. Patients were tested 4 m fromthe visual acuity chart. If patients could not read any lettersat 4 m, they were tested at 2 m. Visual acuity was recordedand analyzed as the logMAR value.15 Manifest refractionwas performed preoperatively and 1, 3, 6, and 12 monthspostoperatively, and the MRSE and manifest astigmatismwere analyzed. In the astigmatism analysis, vector analysiswas performed as described by Holladay et al.16 In thisstudy, the mean surgically induced astigmatism (SIA) andthe vectorial magnitude of the SIA were analyzed usingmethodology similar to that in a previous analysis of PRKand LASIK.17 For a graphic representation of these results,data points were converted to Cartesian coordinates andthe axis of cylinder values were doubled to give a doubled-angle plot.16 Thus, when plotted on an x–y graph, steepeningtoward 90 degrees (induced with the rule) is represented bypoints on the negative x-axis and steepening toward 180 de-grees (induced against the rule) is represented by points onthe positive x-axis. To better ascertain the directionality ofthe induced astigmatism change, right eyes and left eyeswere assessed separately because the astigmatism axis be-tween eyes in keratoconus may exhibit mirror-imagesymmetry.
Topography Topography measurements were obtained us-ing a rotating Scheimpflug camera (Pentacam, Oculus, Inc.).The Scheimpflug system generates a 3-dimensional model ofthe cornea and anterior segment. Topographic data were ob-tained preoperatively and 1, 3, 6, and 12 months postopera-tively. Maximum K values, average K values, flat K values,and steep K values as well as corneal astigmatism (simulatedK)were recorded from the topography data generated by theScheimpflug system.
Statistical Analysis
Statistical analysis was performed using PASW Statisticssoftware (version 18, SPSS, Inc.). Three groups were ana-lyzed: the entire cohort, the individual keratoconus sub-group, and the ectasia subgroup. A paired 2-tailed Studentt test was performed to analyze the postoperative outcomechanges compared with baseline values and to analyze thepostoperative outcome changes over time. An independentt test was performed to compare outcome data 12 monthspostoperatively between the keratoconus subgroup and ec-tasia subgroup and between the treatment group and controlgroup. A P value less than 0.05 was used to determine statis-tical significance.
RESULTS
Seventy-one eyes of 58 patients had CXL and were fol-lowed for 1 year. Of the eyes, 49 were in the keratoco-nus subgroup and 22 in the post-LASIK ectasiasubgroup. The sham control group comprised 41eyes (28 keratoconus, 13 ectasia), and the fellow-eyecontrol group comprised 30 eyes (21 keratoconus, 9ectasia).
J CATARACT REFRACT SURG -
Visual Acuity Changes after Corneal CollagenCrosslinking
Uncorrected Distance Table 1 and Figure 1, top, showthe UDVAover time. The changes in UDVA comparedwith baseline failed to reach statistical significance at1 month, 3 months, or 6 months (P Z .21, P Z .47,and P Z .35, respectively). At 12 months, the changein UDVA comparedwith baseline was statistically sig-nificant (P Z .04). However, when the keratoconusand ectasia subgroups were analyzed individually,changes in UDVA compared with baseline were notstatistically significant at any time point.
The UDVA improved by 2 or more Snellen lines in18 eyes (25.4%); 6 eyes (8.5%) lost 2 or more Snellenlines of UDVA (Figure 1, bottom).
Corrected Distance Table 1 and Figure 2, top, show theCDVA over time. The mean CDVA remained un-changed atmonth 1 (mean change 0.02G 0.18 logMAR;P Z .33). The mean CDVA improved significantly be-tween 1 month and 3 months (mean change �0.07 G0.15 logMAR; P!.001) and between 3 months and6 months (mean change �0.05 G 0.12 logMAR;P!.001). There was no statistically significant changebetween 6 months and 12 months (mean change�0.02 G 0.13, P Z .27). At 12 months, the change inCDVAcompared tobaselinewas statistically significant(P! .001).
Similar to the entire cohort, the mean CDVA im-proved significantly in the keratoconus subgroup(mean change �0.13 G 0.21 logMAR; P!.001) andin the ectasia subgroup (mean change �0.07 G 0.11logMAR; P Z .02) over 1 year. The mean CDVA inthe keratoconus subgroup remained unchangedat 1 month (mean change 0.006 G 0.18 logMAR;P Z .81), improved between 1 month and 3 months(mean change �0.07 G 0.14 logMAR; P Z .001) andbetween 3 months and 6 months (mean change�0.06 G 0.12 logMAR; P!.001), and plateaued bet-ween 6 months and 12 months postoperatively(mean change�0.01G 0.11 logMAR; PZ .70). In con-trast, in the ectasia subgroup, interval changes inCDVA failed to reach statistical significance (0 to1month, PZ .20; 1 to 3months, PZ .08; 3 to 6months,P Z .32; 6 to 12 months, P Z .21).
The CDVA improved by 2 or more Snellen lines in15 eyes (21.1%); 1 eye (1.4%) in a patient with ectasialost 2 Snellen lines of CDVA (Figure 2, bottom).
Refractive Changes after Corneal CollagenCrosslinking
Refraction There was a mean improvement of 0.86 Din theMRSE from preoperatively to 12months postop-eratively; however, the improvement was not statisti-cally significant (P Z .07). There was a statistically
VOL 37, JANUARY 2011

Table 1. Postoperative visual acuity in all eyes, the keratoconus subgroup, and the ectasia subgroup.
Mean LogMAR (Snellen Equivalent)
PostopP Value
(Keratoconus Vs Ectasia)
Acuity/Group Preop 1 Month 3 Months 6 Months 12 Months PreopChange from Baseline
to 12 Months
UDVA .15 .45All eyes 0.84 G 0.34
(20/137)0.87 G 0.31
(20/148)0.82 G 0.37†
(20/131)0.81 G 0.37
(20/129)0.77 G 0.37*
(20/117)Keratoconus 0.87 G 0.35
(20/150)0.91 G 0.31
(20/162)0.85 G 0.37
(20/143)0.86 G 0.40
(20/144)0.82 G 0.39
(20/133)Ectasia 0.75 G 0.30
(20/112)0.78 G 0.30
(20/120)0.74 G 0.36†
(20/109)0.70 G 0.29
(20/101)0.65 G 0.31
(20/89)CDVA .02 .26
All eyes 0.35 G 0.24(20/45)
0.37 G 0.29(20/47)
0.30 G 0.22†,*(20/40)
0.25 G 0.21†,*(20/35)
0.23 G 0.21*(20/34)
Keratoconus 0.39 G 0.27(20/49)
0.39 G 0.30(20/50)
0.32 G 0.24†,*(20/42)
0.26 G 0.23*,†
(20/36)0.25 G 0.23*
(20/36)Ectasia 0.26 G 0.16
(20/37)0.32 G 0.25
(20/42)0.25 G 0.17
(20/35)0.22 G 0.17
(20/33)0.19 G 0.14*
(20/31)
CDVA Z corrected distance visual acuity; UDVA Z uncorrected distance visual acuity*Significant change compared with baseline measurements†Significant change compared with previous visit measurement
152 CORNEAL COLLAGEN CROSSLINKING IN KERATOCONUS AND ECTASIA
significant improvement in MRSE between preopera-tively and 1 month postoperatively (mean changeC0.76 G 2.13 D; P Z .004) but not between 1 monthand 3 months (mean change C0.38 G 2.73 D;
Figure 1. Top: Change in UDVA over time. Numbers reportedare Snellen visual acuity (20/�). Bottom: Change in UDVA Snellenlines between baseline and 12 months postoperatively (KC Zkeratoconus).
J CATARACT REFRACT SURG -
PZ .25), between 3months and 6months (mean change�0.26 G 1.58; P Z .18), or between 6 months and12 months (mean change �0.03 G 2.58; P Z .92)(Table 2 and Figure 3).
Figure 2. Top: Change in CDVA over time. Numbers reported areSnellen visual acuity (20/�). Bottom: Change in CDVA Snellen linesbetween baseline and 12 months postoperatively.
VOL 37, JANUARY 2011

Table 2. Postoperative refractive measurements by group.
Mean (D) G SD
PostopP Value
(Keratoconus Vs Ectasia)
Parameter/Group Preop 1 Month 3 Months 6 Months 12 Months PreopChange from Baseline
to 12 Months
MRSE .10 .42All eyes �8.63 G 5.30 �7.86 G 4.61†,* �7.48 G 4.73* �7.74 G 4.74* �7.77 G 5.40Keratoconus �9.32 G 5.65 �8.34 G 4.95†,* �8.05 G 5.08* �8.20 G 5.04* �8.47 G 5.50Ectasia �7.08 G 4.10 �6.80 G 3.62 �6.23 G 3.63 �6.73 G 3.91 �6.22 G 4.93
Manifest astigmatism .10 .99All eyes 4.76 G 2.52 4.62 G 2.30 4.51 G 2.78 4.76 G 2.50 4.81 G 2.51Keratoconus 5.09 G 2.54 4.95 G 2.21 5.01 G 2.53 5.08 G 2.53 5.01 G 2.43Ectasia 4.05 G 2.36 3.90 G 2.39 3.41 G 3.05 4.05 G 2.34 4.39 G 2.69
MRSE Z manifest refraction spherical equivalent*Significant change compared with baseline measurements†Significant change compared with previous visit measurement
153CORNEAL COLLAGEN CROSSLINKING IN KERATOCONUS AND ECTASIA
Manifest Astigmatism
Absolute In the entire study cohort, all changes in themean absolute manifest astigmatism between preop-eratively and each postoperative visit failed to reachstatistical significance (1 month, P Z .39; 3 months,P Z .24; 6 months, P Z .97; 12 months, P Z .84).Similarly, absolute astigmatism in the keratoconusand ectasia subgroups remained unchanged at 1 year(Table 2). The manifest astigmatism improved by1.00 D ormore in 24 eyes (33.8%) (17 keratoconus, 7 ec-tasia), changed between �1.00 D and 1.00 D in 29 eyes(34.7%) (19 keratoconus, 10 ectasia), and worsened by1.00 D or more in 18 eyes (25.4%) (13 keratoconus,5 ectasia).
Vector Analysis of Surgically Induced Astigmatism Themean SIA at 12 months was 0.61 D � 73.4 degrees,1.12 D � 75.2 degrees, and 0.53 D � 81.7 degreesin the entire cohort, the keratoconus subgroup,and the ectasia subgroup, respectively. In the
Figure 3. Postoperative MRSE measurements. Box-and-whiskerplots (upper bar Z 4th quartile; lower bar Z 1st quartile).
J CATARACT REFRACT SURG -
entire cohort, the mean induced astigmatism was0.99 D � 88.8 degrees and 0.65 D � 44.7 degrees inright eyes and left eyes, respectively (Figure 4).In the keratoconus subgroup, the mean inducedastigmatism was 1.75 D � 87.9 degrees and 1.01 D �49.8 degrees in the right eyes and left eyes, respec-tively. In the ectasia subgroup, the mean inducedastigmatism was 0.65 � 83.3 degrees and 0.42 �79.0 degrees in the right eyes and left eyes, respec-tively. Regarding the induced magnitude of astigma-tism, the mean vectorial magnitude of SIA at12 months was 2.99 G 2.55 D, 3.16 G 2.72 D, and2.61G 2.15D, in the entire cohort, the keratoconus sub-group, and the ectasia subgroup, respectively.
Postoperative Topography
Table 3 shows the postoperative topographicmeasurements.
MaximumKeratometry Therewas a significant decreasein themeanmaximumKvalue (�1.7G 3.9 D) betweenpreoperatively and 12 months postoperatively(P!.001). There was a significant increase betweenbaseline and 1 month (mean 1.39 G 2.80 D; P!.001)and then a significant decrease between 1 month and3months (mean�1.69G 2.55D; P!.001) and between3 months and 6 months (mean �0.93G 3.02; PZ .01).There was no significant change in maximum Kbetween 6 months and 12 months (mean �0.48 G 3.20;P Z .21) (Figure 5, A).
In the keratoconus subgroup, there was a 2.00 D de-crease in the mean maximum K value between preop-eratively and 12 months postoperatively (P Z .002).
VOL 37, JANUARY 2011

Figure 4. Double-angle plot of vector change in astigmatism 1 year after CXL. Left: Right eyes. Right: Left eyes.
Table 3. Postoperative topographic measurements by Scheimpflug imaging.
Mean (D) G SD
PostopP Value
(Keratoconus Vs Ectasia)
Parameter/Group Preop 1 Month 3 Months 6 Months 12 Months PreopChange from Baseline
to 12 Months
Maximum K .02 .22All eyes 58.6 G 9.62 60.0 G 9.80*,† 58.3 G 9.09† 57.4 G 8.54*,† 56.9 G 8.62*Keratoconus 60.4 G 9.99 61.7 G 10.2*,† 60.0 G 9.87† 59.1 G 8.96*,† 58.4 G 8.41*Ectasia 54.7 G 7.52 56.2 G 7.78*,† 54.54 G 7.91† 53.6 G 6.18* 53.7 G 6.86
Average KAll eyes 48.2 G 6.97 48.8 G 7.11*,† 47.7 G 6.78*,† 47.5 G 6.38* 47.1 G 5.56*,† .001 .07Keratoconus 50.4 G 7.06 50.8 G 7.34 49.7 G 6.95*,† 49.6 G 6.45* 48.9 G 5.48*,†
Ectasia 43.4 G 3.54 44.3 G 3.90*,† 43.1 G 3.37† 43.0 G 3.00 43.1 G 3.09Flat K
All eyes 45.8 G 6.42 46.3 G 6.79 45.2 G 6.36*,† 45.2 G6.32* 44.9 G 5.40* .001 .18Keratoconus 47.9 G 6.35 48.2 G 7.09 47.2 G 6.49*,† 47.3 G 6.32 46.7 G 5.29*,†
Ectasia 41.1 G 3.32 42.0 G 3.22 40.8 G 2.92† 40.5 G 2.82 40.7 G 2.63Steep K
All eyes 50.9 G 7.33 51.7 G 7.73*,† 50.5 G 7.53*,† 50.2 G6.70 * 49.7 G 6.08* .001 .37Keratoconus 52.9 G 7.45 53.8 G 7.86*,† 50.5 G 7.53† 52.1 G 6.81* 51.5 G 5.94*,†
Ectasia 46.51 G 4.73 47.0 G 4.98 45.82 G 4.28*,† 45.9 G 3.96 45.7 G 4.33*Astigmatism
All eyes 4.94 G 2.45 5.46 G 2.82 5.37 G 2.76 4.99 G 2.46 4.76 G 2.59 .50 .34Keratoconus 4.80 G 2.42 5.64 G 2.95*,† 5.50 G 2.87* 4.87 G 2.26† 4.76 G 2.26Ectasia 5.24 G 2.55 5.06 G 2.54 5.06 G 2.53 5.28 G 2.89 4.76 G 3.28
K Z keratometry*Significant change compared with baseline measurements†Significant change compared with previous visit measurement
154 CORNEAL COLLAGEN CROSSLINKING IN KERATOCONUS AND ECTASIA
J CATARACT REFRACT SURG - VOL 37, JANUARY 2011

Figure 5. A: Change in maximum Kover time. B: Change in maximumK between baseline and 12 monthspostoperatively. C: Change inaverage K over time (KC Zkeratoconus).
155CORNEAL COLLAGEN CROSSLINKING IN KERATOCONUS AND ECTASIA
There was a significant increase between baseline and1 month (mean change 1.33 G 3.03 D; P Z .003) anda significant decrease between 1 month and 3 months(mean change �1.70 G 2.66 D; P!.001) and 3 monthsand 6 months (mean change �0.94 G 3.22 D;P Z .046). There was no significant change between6 months and 12 months (mean change �0.72 G 3.58 D;PZ .17).
In the ectasia subgroup, there was a 1.00 D decreasein the mean maximum K value between preopera-tively and 12 months postoperatively; however, thisfailed to reach statistical significance (P Z .08). There
J CATARACT REFRACT SURG -
was a significant increase between baseline and1 month (mean change 1.51 G 2.27 D; P Z .005) anda significant decrease between 1 month and 3 months(mean change �1.66 G 2.35 D; P Z .003). There wereno significant changes between 3months and 6months(mean change �0.91 G 2.60 D; P Z .12) or between6 months and 12 months (mean change 0.05 G 2.08 D;P Z .91).
The maximum K value decreased by 2.00 D or morein 22 eyes (31.0%) patients and remained unchanged in28 eyes (39.4%) patients. It increased by 2.00 D or morein 3 eyes (4.2%) (Figure 5, B).
VOL 37, JANUARY 2011
156 CORNEAL COLLAGEN CROSSLINKING IN KERATOCONUS AND ECTASIA
Average Keratometry In the entire cohort, there wasa significant decrease in the mean average K value(�1.10 G 2.39 D) between preoperatively and 12months postoperatively (P!.001). There was a signifi-cant increase between baseline and 1 month (meanchange 0.56G 1.87D;PZ .01) and significant decreasesbetween 1 month and 3 months (mean change �1.11 G1.26 D; P!.001) and between 6 months and 12 months(mean change �0.41G 1.60 D; PZ .03). There was nosignificant change between 3 months and 6 monthsmean change (�0.14 G 1.99 D; P Z .56) (Figure 5, C).
In the keratoconus subgroup, there was a 1.50 D de-crease in the mean average K value between preoper-atively and 12 months postoperatively (P!.001).There was a significant decrease between 1 monthand 3 months (mean change �1.07 G 1.38 D;P!.001) and between 6 months and 12 months(mean change �0.64 G 1.79 D; P Z .02). There wereno significant changes in between baseline and1 month (mean change 0.40 G 2.07 D; P Z .19) orbetween 3 months and 6 months (mean change�0.15 G 2.27 D; P Z .65).
In the ectasia subgroup, there was a 0.3 D decreasein the mean average K value between preoperativelyand 12 months postoperatively; however, this failedto reach statistical significance (P Z .22). There wasa significant increase between baseline and 1 month(mean change 0.91 G 1.28 D; P Z .003) followed bya significant decrease between 1 month and 3 months(mean change�1.21G 0.99 D; P!.001). Therewere nosignificant changes between 3 months and 6 months(mean change �0.12 G 1.16 D; P Z .64) or between6 months and 12 months (mean change 0.09 G 0.92 D;P Z .65).
Corneal Astigmatism (Simulated Keratometry) In the en-tire cohort and the ectasia subgroup, all changes in cor-neal astigmatism, measured by Scheimpflugsimulated K, failed to reach significance at all timepoints. In the keratoconus subgroup, there were signifi-cant increases in corneal astigmatism compared withbaseline at 1 month (P Z .01) and 3 months (P Z .02).However, the simulated K value returned to baselineat 6 months; there were no significant changes in cor-neal astigmatism compared with baseline at 6 months(P Z .76) or 12 months (P Z .87).
Comparison Between Groups
Keratoconus Versus Ectasia The baseline CDVA, maxi-mumK value, average K value , flat K value, and steepK value in the keratoconus subgroup were signifi-cantly different from the same baseline measurementsin the ectasia subgroup (CDVA, PZ .02; maximum K,P Z .02; average K, P!.001; flat K value, P!.001;steep K, P!.001). However, there were no significant
J CATARACT REFRACT SURG -
differences between the keratoconus subgroup and ec-tasia subgroup in changes in visual acuity (UDVA,CDVA), refraction (MRSE, manifest astigmatism), ortopography (maximum K, average K, flat K, steep K,astigmatism) 12 months after CXL (Tables 1 to 3).
Control Groups
Sham In the sham control group, there were no statis-tically significant changes in CDVA,manifest astigma-tism, MRSE, maximum K value, average K value,steep K, or corneal astigmatism at the 1-month or3-month follow-up visits. There was a statistically sig-nificant improvement in UDVA at 1 month (meanchange �0.09 G 0.26 logMAR; PZ .03) and 3 months(mean change �0.08 G 0.23 logMAR; P Z .03)compared with baseline. There was also a statisticallysignificant increase in flat K value from baseline to3 months (mean change 0.54 G 1.65 D; P Z .04).
Fellow-Eye In the fellow-eye control group, therewereno changes in UDVA, CDVA,maximumK, average K,flat K, steep K, MRSE, or corneal astigmatism overthe 12-month study The mean change in UDVAwas �0.04 G 0.18 logMAR (P Z .19); in CDVA,�0.04 G 0.14 logMAR (P Z .17), in the maximum Kvalue, C0.29 G 1.19 D (P Z .19); and in the averageK value, C0.20 G 0.79 D (P Z .18). There was a statis-tically significant increase in manifest astigmatism(mean change 0.34 G 0.82 D; P Z .03) at 1 year.
Treatment Versus Control Groups
At 3 months, there were no significant differencesbetween the treatment and sham control group inchanges from baseline in UDVA, CDVA, maximumK, or average K value (P Z .13, P Z .44, P Z .25,and P Z .89, respectively). At 1 year, all of the out-comes were significantly better in the treatment groupthan in the fellow-eye control group (PZ .02, P!.001,P !.001, and P!.001, respectively) (Figure 6).
DISCUSSION
Corneal collagen crosslinking is a promising newtreatment for keratoconus12 and corneal ectasia.13
Crosslinking is thought to biomechanically strengthenthe corneal stroma and, consequently, slow the pro-gression of keratoconus and ectasia. In many cases,moreover, CXL improves the patient’s visual, refrac-tive, and topographic outcomes18 with few reportedcomplications.19 In this controlled clinical trial, visualacuity, refraction, and topography outcomes were an-alyzed in patients diagnosed with keratoconus and inthose with post-LASIK corneal ectasia. This study rep-resents one of the largest prospectively analyzed treat-ment groups to date. Unique to this investigation are
VOL 37, JANUARY 2011
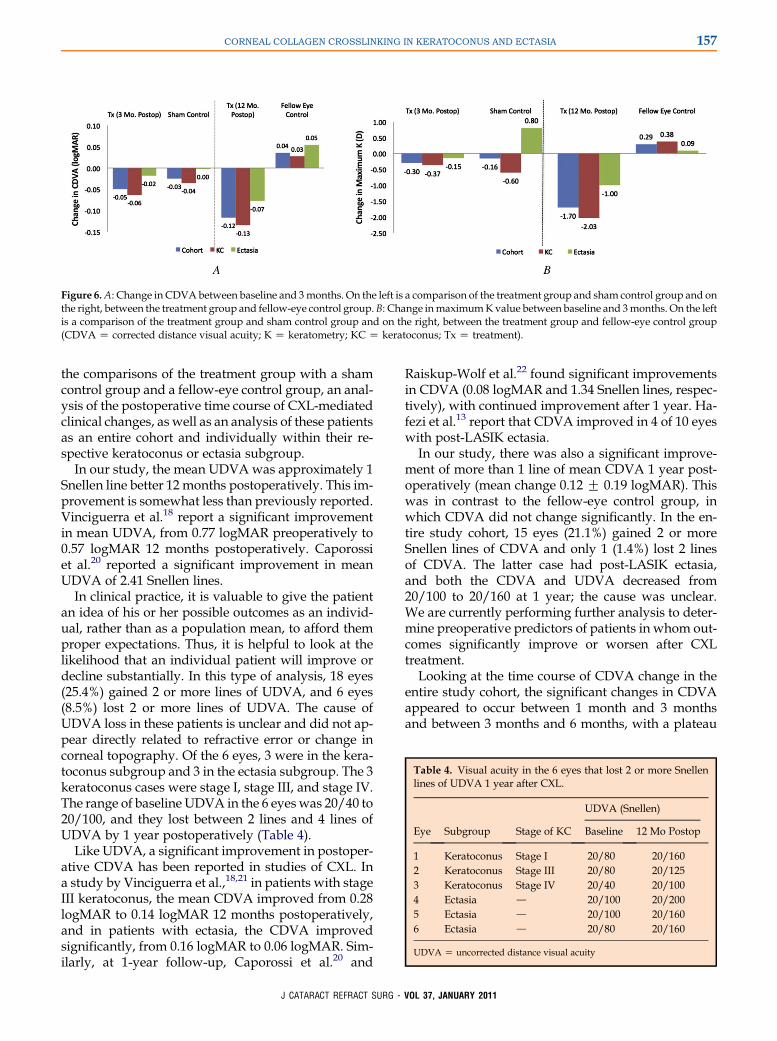
Figure 6.A: Change in CDVAbetween baseline and 3months. On the left is a comparison of the treatment group and sham control group and onthe right, between the treatment group and fellow-eye control group.B: Change inmaximumKvalue between baseline and 3months. On the leftis a comparison of the treatment group and sham control group and on the right, between the treatment group and fellow-eye control group(CDVA Z corrected distance visual acuity; K Z keratometry; KC Z keratoconus; Tx Z treatment).
Table 4. Visual acuity in the 6 eyes that lost 2 or more Snellenlines of UDVA 1 year after CXL.
UDVA (Snellen)
Eye Subgroup Stage of KC Baseline 12 Mo Postop
1 Keratoconus Stage I 20/80 20/1602 Keratoconus Stage III 20/80 20/1253 Keratoconus Stage IV 20/40 20/1004 Ectasia d 20/100 20/2005 Ectasia d 20/100 20/1606 Ectasia d 20/80 20/160
UDVA Z uncorrected distance visual acuity
157CORNEAL COLLAGEN CROSSLINKING IN KERATOCONUS AND ECTASIA
the comparisons of the treatment group with a shamcontrol group and a fellow-eye control group, an anal-ysis of the postoperative time course of CXL-mediatedclinical changes, as well as an analysis of these patientsas an entire cohort and individually within their re-spective keratoconus or ectasia subgroup.
In our study, the mean UDVAwas approximately 1Snellen line better 12 months postoperatively. This im-provement is somewhat less than previously reported.Vinciguerra et al.18 report a significant improvementin mean UDVA, from 0.77 logMAR preoperatively to0.57 logMAR 12 months postoperatively. Caporossiet al.20 reported a significant improvement in meanUDVA of 2.41 Snellen lines.
In clinical practice, it is valuable to give the patientan idea of his or her possible outcomes as an individ-ual, rather than as a population mean, to afford themproper expectations. Thus, it is helpful to look at thelikelihood that an individual patient will improve ordecline substantially. In this type of analysis, 18 eyes(25.4%) gained 2 or more lines of UDVA, and 6 eyes(8.5%) lost 2 or more lines of UDVA. The cause ofUDVA loss in these patients is unclear and did not ap-pear directly related to refractive error or change incorneal topography. Of the 6 eyes, 3 were in the kera-toconus subgroup and 3 in the ectasia subgroup. The 3keratoconus cases were stage I, stage III, and stage IV.The range of baseline UDVA in the 6 eyeswas 20/40 to20/100, and they lost between 2 lines and 4 lines ofUDVA by 1 year postoperatively (Table 4).
Like UDVA, a significant improvement in postoper-ative CDVA has been reported in studies of CXL. Ina study by Vinciguerra et al.,18,21 in patients with stageIII keratoconus, the mean CDVA improved from 0.28logMAR to 0.14 logMAR 12 months postoperatively,and in patients with ectasia, the CDVA improvedsignificantly, from 0.16 logMAR to 0.06 logMAR. Sim-ilarly, at 1-year follow-up, Caporossi et al.20 and
J CATARACT REFRACT SURG -
Raiskup-Wolf et al.22 found significant improvementsin CDVA (0.08 logMAR and 1.34 Snellen lines, respec-tively), with continued improvement after 1 year. Ha-fezi et al.13 report that CDVA improved in 4 of 10 eyeswith post-LASIK ectasia.
In our study, there was also a significant improve-ment of more than 1 line of mean CDVA 1 year post-operatively (mean change 0.12 G 0.19 logMAR). Thiswas in contrast to the fellow-eye control group, inwhich CDVA did not change significantly. In the en-tire study cohort, 15 eyes (21.1%) gained 2 or moreSnellen lines of CDVA and only 1 (1.4%) lost 2 linesof CDVA. The latter case had post-LASIK ectasia,and both the CDVA and UDVA decreased from20/100 to 20/160 at 1 year; the cause was unclear.We are currently performing further analysis to deter-mine preoperative predictors of patients in whom out-comes significantly improve or worsen after CXLtreatment.
Looking at the time course of CDVA change in theentire study cohort, the significant changes in CDVAappeared to occur between 1 month and 3 monthsand between 3 months and 6 months, with a plateau
VOL 37, JANUARY 2011

158 CORNEAL COLLAGEN CROSSLINKING IN KERATOCONUS AND ECTASIA
in improvement thereafter. In the keratoconus sub-group, the change in CDVA over time followed a pat-tern similar to that in the entire cohort. The ectasiasubgroup did not have any significant changes be-tween time points; however, there was a significantchange in CDVA from baseline to 12 monthspostoperatively.
Previous studies report changes in the MRSE of0.40 D,18 1.43 D,23 and 2.20 D.24 In our study, themean improvement in the MRSE at 12 months was0.86 D. However, this change failed to reach statisticalsignificance. Similarly, there were no significantchanges in the MRSE in the keratoconus and ectasiasubgroups. Poor reproducibility of subjective refrac-tion in these patients with irregular corneal topogra-phies might account for the lack of a significantdifference in postoperative refraction after CXL.
Previous studies reported significant changes inmanifest astigmatism of 0.93 D22 and 0.26 D18 respec-tively. In our study, themeanmanifest astigmatism es-sentially remained unchanged after CXL. Similarly, inthe keratoconus and ectasia subgroups, there were nosignificant changes in the mean manifest astigmatism.Vector analysis of SIA showed wide variation in mag-nitude and directionality. Again here, difficulty of re-fraction in these patients could account for ourinability to identify a consistent change in SIA afterCXL.
The maximum K value is a key topographic indica-tor of the success of CXL because it measures, to someextent, the severity of the keratoconic cone. Previousstudies report decreases in maximum the K value of2.01 D,12 1.90 D,24 1.46 D,22 and 1.42 D23 in keratoconicpatients. Hafezi et al.13 report a decrease in maximumK value in patients with ectasia after LASIK. Our cur-rent study corroborates findings in these previousstudies; we found a significant decrease in maximumK value of 1.70 D at 1 year, compared with no signifi-cant change in the fellow-eye control group. The larg-est change was in the keratoconus subgroup, whichshowed a 2.0 D flattening effect, whereas a smallerchange of 1.0 D, which failed to reach statistical signifi-cance, was found in the ectasia subgroup.
In all groups, there was a significant increase inmaximum K value at 1 month, followed by the largestdecrease in maximum K value between 1 month and3 months. In all groups, there was no significantchange in the maximum K value between 6 monthsand 12 months. This contrasts with the findings ofCaporossi et al.20 and Raiskup-Wolf et al.,22 who re-port a continued decrease in maximum K values afterthe 1-year follow-up. Further follow-up is required todetermine whether the maximum K value will con-tinue to decrease after 12 months in patients with ker-atoconus or ectasia.
J CATARACT REFRACT SURG -
Individually, the maximum K value decreased by2.0 D or more in 22 eyes (31.0%) (17 keratoconus, 5 ec-tasia) and increased by 2.0 D or more in 3 eyes (4.2%)(1 keratoconus, 2 ectasia). These latter 3 eyes would beconsidered treatment failures because cone progres-sion was not stabilized. Similar to the results of Kolleret al.,25 the maximum K value increased by 1.00 D ormore in 7 eyes (9.8%) (5 keratoconus, 2 ectasia). Curi-ously, none of the 7 eyes were among those that lost2 or more lines of UDVA and CDVA.
Similar to maximum K value, the decrease in theaverage K value in the entire cohort at 12 months com-pared with baseline was significant. In the keratoco-nus subgroup, the average K value was significantlydecreased at 12 months as well. However, in the ecta-sia subgroup, the average K value did not significantlychange. Analogous to the maximum K value, allgroups had the largest significant decrease in the aver-age K value between 1 month and 3 months.
The flat K and steep K values showed improve-ments similar to those in the maximum K and averageK values. It remains unclear whether the achieved flat-tening of the flat K value at 1 year is, in fact, a desirableoutcome from the clinical viewpoint because it maymilitate irregularity of the corneal topography. Fur-ther study of corneal topography after CXL is neededto determine whether it is this general topographicflattening, or perhaps, more complex changes in thecorneal optical contour, that result in the significantimprovements in CDVA after CXL treatment.
In this study, there were significant differences bet-ween the baseline topographic measurements andCDVA in the keratoconus and ectasia subgroups.Therefore, it is difficult to accurately assess the differ-ences in the changes in postoperative outcome mea-surements in these 2 groups. However, the data hereand in previous studies21 suggest that there may bedifferences between the postoperative CXL outcomesin keratoconus patients and ectasia patients.
In the ectasia group, the only significant change inCDVA was when 1-year postoperative measurementswere compared with baseline. In contrast to the kera-toconus subgroup, the ectasia subgroup had no signifi-cant change in CDVA at any time interval betweenbaseline and 12 months. This may suggest increasedvariability in the time course of CDVA changes in ecta-sia patients compared with changes in keratoconuspatients.
Furthermore, although there was a trend toward im-provement, there were no significant changes in maxi-mum K, average K, or flat K in the ectasia subgroup;only steep K showed a statistically significant improve-ment at the 1-year follow-up. At baseline, the ectatic cor-neas in this study were flatter than those in thekeratoconus subgroup and, therefore, the topographic
VOL 37, JANUARY 2011
159CORNEAL COLLAGEN CROSSLINKING IN KERATOCONUS AND ECTASIA
changes caused by CXL in these corneasmay be subtler.Notwithstanding, our data suggest that ectatic corneasmaynothaveasrobust a response toCXLaskeratoconuscorneas. Similar to our findings, Vinciguerra et al.21
found no significant topographic changes (average K,flat K, steep K) in patients with post-LASIK ectasia.
The cause of a potential difference between kerato-conic corneas and ectatic corneas is, as yet, unclear.Biomechanical differences caused by the LASIK flap;possible differences in the riboflavin diffusion rate inpost-LASIK corneas, especially at the flap interface;and intrinsic pathophysiologic differences betweenkeratoconus and ectasia may all contribute to the dif-ferent responses to CXL between the 2 groups. Cer-tainly, further study with a greater number of ectaticeyes is necessary to further elucidate differences inthe response to CXL between eyes with keratoconusand eyes with ectasia.
Treatment patients were compared with a shamcontrol group and a fellow-eye control group. In thestudy protocol, the sham control group received ribo-flavin alone and was placed under a UVA light thatwas turned off. Most notably, the epithelium was notremoved in any of the control patients. Therefore,any contribution of deepithelialization, rather thanthe UVA light treatment, to patient outcomes wasnot accounted for by this control group. In addition,these patients were only followed for 3 months, atwhich point they crossed over to the treatment group;therefore, our comparison with the treatment groupwas limited to 3 months.
These limitations of the sham control group sug-gested an additional comparison of the treatmentgroup with a 12-month fellow-eye control group. Ide-ally, all fellow eyes would have been compared withtreatment eyes. However, the protocol in this clinicaltrial allowed fellow-eye CXL 3 months after first-eyetreatment. Therefore, in this study, the treatmentgroup was compared only with the fellow eyes of pa-tients who had unilateral treatment. Some fellow eyesin this study had no topographic or visual signs of ker-atoconus or ectasia. Thus, disease progression wouldbe expected to be minimal.
The treatment group was compared with the 2 con-trol groups. The changes in UDVA, CDVA, maximumK, and average K between baseline and 3 months inthe sham control groupwere not significantly differentthan the changes in these measurements in the treat-ment group during the same 3-month period. How-ever, treated eyes had significant improvement inUDVA, CDVA,maximumK, and average K comparedwith the fellow-eye controls. Thus, the efficacy of theCXL procedure in improving patient outcomes andstabilizing corneal ectatic progression over a 1-year pe-riod was clearly shown.
J CATARACT REFRACT SURG -
As seen, the basic clinical outcomes of CXL seem tofollow a reproducible time course after treatment. Ingeneral, visual acuity and corneal steepness worsensomewhat at the 1-month time point. Resolution tobaseline occurs by approximately 3 months, with im-provement thereafter. This is similar to the clinicaltime course of CXL-associated corneal haze, whichwe reported elsewhere.26 In these cases, the haze isgreatest at 1 month, plateaus at 3 months, and de-creases significantly between 3 months and 12 monthspostoperatively. Thus, stromal and epithelial healingresponses to CXL appear to continue over months,concomitant with the changes in clinical outcomes,which we report here.
REFERENCES1. Krachmer JH, Feder RS, Belin MW. Keratoconus and related
noninflammatory corneal thinning disorders. Surv Ophthalmol
1984; 28:293–322
2. Rabinowitz YS. Keratoconus. Surv Ophthalmol 1998; 42:
297–319
3. Seiler T, Koufala K, Richter G. Iatrogenic keratectasia after laser
in situ keratomileusis. J Refract Surg 1998; 14:312–317
4. Ali�o JL, Shabayek MH. Corneal higher order aberrations:
a method to grade keratoconus. J Refract Surg 2006; 22:
539–545
5. Gobbe M, Guillon M. Corneal wavefront aberration measure-
ments to detect keratoconus patients. Cont Lens Anterior Eye
2005; 28:57–66
6. Lembach RG. Use of contact lenses for management of kerato-
conus. Ophthalmol Clin N Am 2003; 16(3):383–394; vi
7. Tuft SJ, Moodaley LC, Gregory WM, Davison CR, Buckley RJ.
Prognostic factors for the progression of keratoconus. Ophthal-
mology 1994; 101:439–447
8. Coskunseven E, Kymionis GD, Tsiklis NS, Atun S, Arslan E,
Jankov MR, Pallikaris IG. One-year results of intrastromal cor-
neal ring segment implantation (KeraRing) using femtosecond
laser in patients with keratoconus. Am J Ophthalmol 2008;
145:775–779
9. Shetty R, Kurian M, Anand D, Mhaske P, Narayana KM,
Shetty BK. Intacs in advanced keratoconus. Cornea 2008; 27:
1022–1029
10. Ertan A, Kamburo�glu G. Intacs implantation using a femtosec-
ond laser for management of keratoconus: comparison of 306
cases in different stages. J Cataract Refract Surg 2008; 34:
1521–1526
11. Ali�o JL, Claramonte PJ, C�aliz A, RamzyMI. Corneal modeling of
keratoconus by conductive keratoplasty. J Cataract Refract
Surg 2005; 31:190–197
12. Wollensak G, Spoerl E, Seiler T. Riboflavin/ultraviolet-A-
induced collagen crosslinking for the treatment of keratoconus.
Am J Ophthalmol 2003; 135:620–627
13. Hafezi F, Kanellopoulos J,WiltfangR, Seiler T. Corneal collagen
crosslinking with riboflavin and ultraviolet A to treat induced ker-
atectasia after laser in situ keratomileusis. J Cataract Refract
Surg 2007; 33:2035–2040
14. Wollensak G, Spoerl E, Seiler T. Stress-strain measurements of
human and porcine corneas after riboflavin-ultraviolet-
A-induced cross-linking. J Cataract Refract Surg 2003; 29:
1780–1785
15. Holladay JT, Prager TC. Mean visual acuity [letter]. Am J Oph-
thalmol 1991; 111:372–374
VOL 37, JANUARY 2011

160 CORNEAL COLLAGEN CROSSLINKING IN KERATOCONUS AND ECTASIA
16. Holladay JT, Dudeja DR, Koch DD. Evaluating and reporting
astigmatism for individual and aggregate data. J Cataract
Refract Surg 1998; 24:57–65
17. Hersh PS, Abbassi R. Surgically induced astigmatism after pho-
torefractive keratectomy and laser in situ keratomileusis; Sum-
mit PRK-LASIK Study Group. J Cataract Refract Surg 1999;
25:389–398
18. Vinciguerra P, Alb�e E, Trazza S, Rosetta P, Vinciguerra R,
Seiler T, Epstein D. Refractive, topographic, tomographic, and
aberrometric analysis of keratoconic eyes undergoing corneal
cross-linking. Ophthalmology 2009; 116:369–378
19. Spoerl E, Mrochen M, Sliney D, Trokel S, Seiler T. Safety of
UVA-riboflavin cross-linking of the cornea. Cornea 2007;
26:385–389
20. Caporossi A, Mazzotta C, Baiocchi S, Caporossi T. Long-term
results of riboflavin ultraviolet A corneal collagen cross-linking
for keratoconus in Italy: The Siena Eye Cross Study. Am J Oph-
thalmol 2010; 149:585–593
21. Vinciguerra P, Camesasca FI, Alb�e E, Trazza S. Corneal colla-
gen cross-linking for ectasia after excimer laser refractive sur-
gery: 1-year results. J Refract Surg 2010; 26:486–497
22. Raiskup-Wolf F, Hoyer A, Spoerl E, Pillunat LE. Collagen cross-
linking with riboflavin and ultraviolet-A light in keratoconus: long-
term results. J Cataract Refract Surg 2008; 34:796–801
23. Grewal DS, Brar GS, Jain R, Sood V, Singla M, Grewal SPS.
Corneal collagen crosslinking using riboflavin and ultraviolet-A
light for keratoconus; one-year analysis using Scheimpflug im-
aging. J Cataract Refract Surg 2009; 35:425–432
24. Caporossi A, Baiocchi S, Mazzotta C, Traversi C, Caporossi T.
Parasurgical therapy for keratoconus by riboflavin-ultraviolet
type A rays induced cross-linking of corneal collagen;
J CATARACT REFRACT SURG -
preliminary refractive results in an Italian study. J Cataract
Refract Surg 2006; 32:837–845
25. Koller T, Mrochen M, Seiler T. Complication and failure rates
after corneal crosslinking. J Cataract Refract Surg 2009; 35:
1358–1362
26. Greenstein SA, Fry KL, Bhatt J, Hersh PS. The natural history of
stromal haze after corneal collagen crosslinking for keratoconus
and corneal ectasia. In press, J Cataract Refract Surg
OTHER CITED MATERIALA. National Institutes of Health Clincial Trials. Corneal
Collagen Cross-linking for Progressive Keratoconus (CXL)
NCT00647699. Available at: http://www.clinicaltrials.gov/
ct2/show/NCT00647699?termZNCT00647699&rankZ1 U.S.
Accessed September 17, 2010
B. National Institutes of Health Clinical Trials. Corneal Collagen
Cross-linking for Ectasia (CXL) NCT00674661. Available at:
http://www.clinicaltrials.gov/ct2/show/NCT00674661?termZNCT00674661&rankZ1. Accessed September 17, 2010
VOL
37, JANUARY 2011First author:Peter S. Hersh, MD
Cornea and Laser Eye Institute - HershVision Group, CLEI Center forKeratoconus, Teaneck, New Jersey, USA