corn production ghg accounting/modeling the state of … alverson.pdf · corn production ghg...
TRANSCRIPT

Corn Production GHG Accounting/Modeling – The State of the Science
Ron Alverson:
Corn Producer, Board of Directors Dakota Ethanol


Topics
Current Corn Grain Ethanol Fuel Carbon (GHG) Intensity Accounting/Modeling
Importance of Using the Latest Science
Soil Carbon Sequestration by High Yield Corn
N2O Emission Reductions with improved Nitrogen Fertilizer Management and using recent Science

A History of Corn Ethanol Carbon Intensity Accounting/Modeling – Argonne GREET Model

Details of Argonne’s most recent modeling (2015)

California (CARB) Still Uses an Older GREET Model and Assumptions

New Science Suggests Corn Production GHGs Should be significantly Lower
Soil Carbon Accounting and Nitrous Oxide Accounting
Soil Carbon accounting is not currently done by Argonne…….except in Land Use Change Calculations……..Modelers assume all biofuel crops (soy biodiesel, canola biodiesel, corn ethanol, sugar cane ethanol) have the same effect on soil carbon stocks!
Nitrous Oxide modeling currently done uses old science…..Nitrogen Use Efficiency during Corn Production has greatly improved in the past two to three decades.

Source: Dr. Rattan Lal, Ohio State University Soil Science Dept.
Dr. Rattan Lal…Historic Soil Carbon Stock Loss….. and Now Gains

Why is soil carbon on the rise? Corn Biomass Production has Increased Greatly, Leading to Significantly More Root/Stover Carbon Additions to Soil
Grain Yield per Plant has not Changed, Just More Plants Crammed on Each Acre

Photosynthesis! A Carbon Sink in Action!


Image Credit: NASA's Goddard Space Flight Center
“The Midwest region of the United States boasts more photosynthetic activity than any other spot on Earth”, according to NASA and university scientists. Data showed that “fluorescence from the Corn Belt, which extends from Ohio to Nebraska and Kansas, peaks in
July at levels 40 percent greater than those observed in the Amazon”.

Chart Data Source: Johnson et al. 2006
USDA Agriculture Research Service Soil Carbon Research

What do Soil Carbon Models Predict?

Trends in Organic Matter Content of Soil - Major Soil Testing Lab Results

Summary of 3 Peer Reviewed Studies on the Effect of Retaining or Removing Stover on Soil Carbon Stocks, and the Effect that Change in Soil Carbon Stocks has on Life Cycle GHG Emissions of Corn Grain Ethanol and Corn Stover Cellulosic Ethanol Produced from those Fields
Without Proper Soil Carbon Accounting/Modeling, Corn Grain Ethanol get all the gasses, and Corn Stover Ethanol gets all the Glory!

Bottom Line: Corn Ethanol is at a Disadvantage in Low Carbon Markets because Argonne, CARB, and the U.S. EPA do not Consider/Account for Corn’s effect on Soil Carbon Stocks !
10 Peer Reviewed Corn Soil Carbon Studies - Average CI Credit is more than 30 Grams!
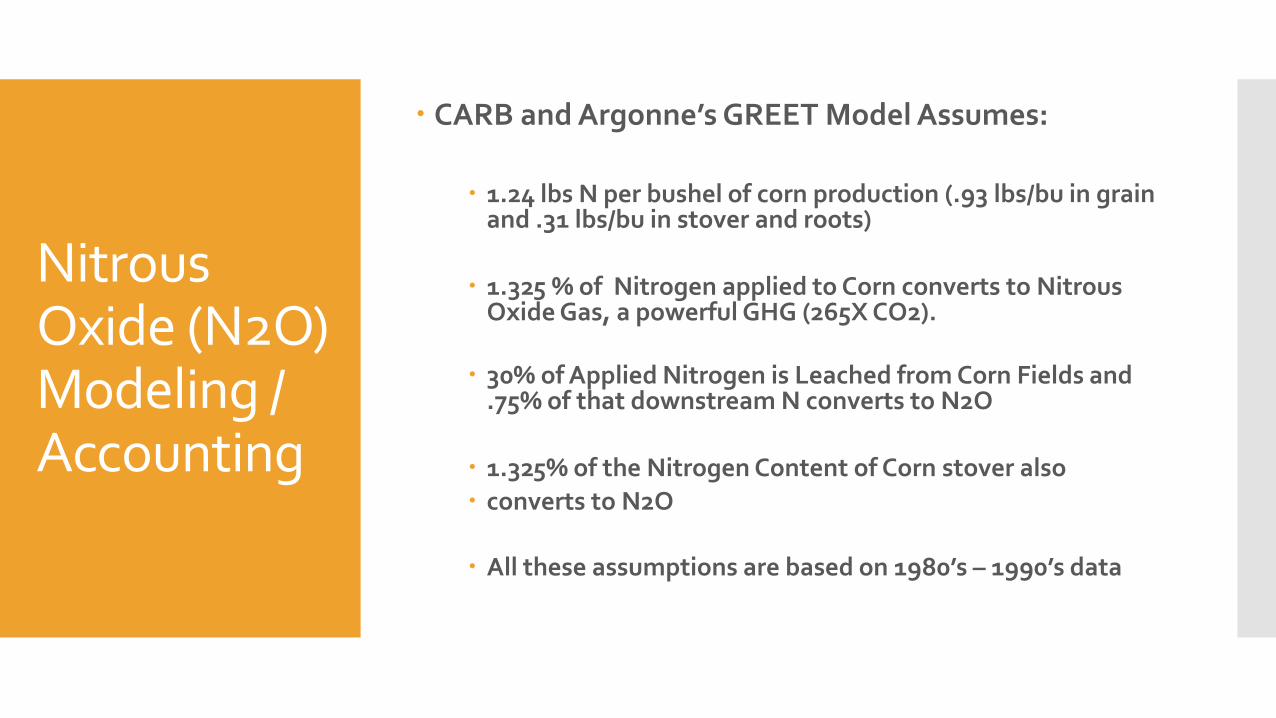
Nitrous Oxide (N2O) Modeling / Accounting
CARB and Argonne’s GREET Model Assumes:
1.24 lbs N per bushel of corn production (.93 lbs/bu in grain
and .31 lbs/bu in stover and roots)
1.325 % of Nitrogen applied to Corn converts to Nitrous Oxide Gas, a powerful GHG (265X CO2).
30% of Applied Nitrogen is Leached from Corn Fields and .75% of that downstream N converts to N2O
1.325% of the Nitrogen Content of Corn stover also
converts to N2O
All these assumptions are based on 1980’s – 1990’s data
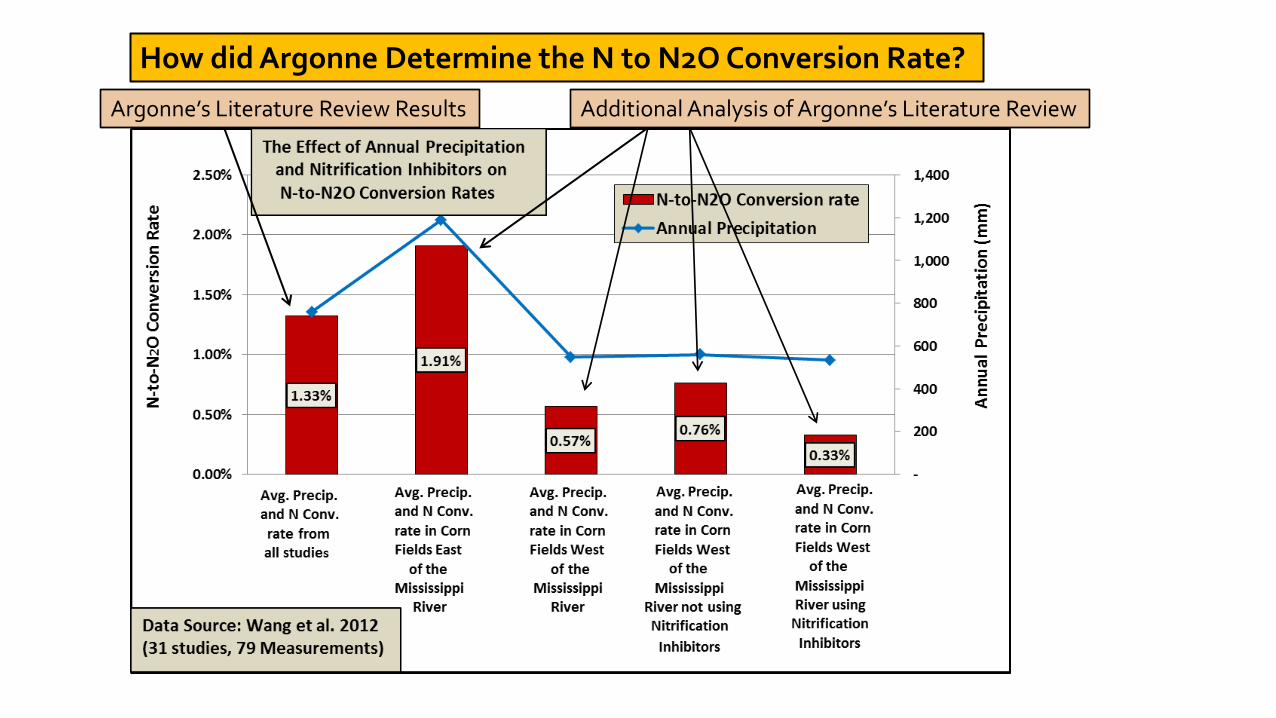
How did Argonne Determine the N to N2O Conversion Rate?
Additional Analysis of Argonne’s Literature Review Argonne’s Literature Review Results

Precipitation adjusted Fertilizer N-to-N2O Conversion Rates
70% of Corn is grown in regions with precipitation adjusted N-to-N2O conversion rates of 1.21 or less. Data Source: Lesschen et al.

Historic Nitrogen Use and Efficiency on Corn
Nitrogen Use Efficiency on Corn Farms has Improved Dramatically in the Past 2-3 Decades!

Corn Production
In the U.S., about 20% of corn is grown on tile drained land.

Per Unit of Fertilizer, Water and Land, Corn Produces Far more Calories and Protein than any other Crop!
And Builds soil Carbon Stocks to boot! The Efficiency of C4 Crops!
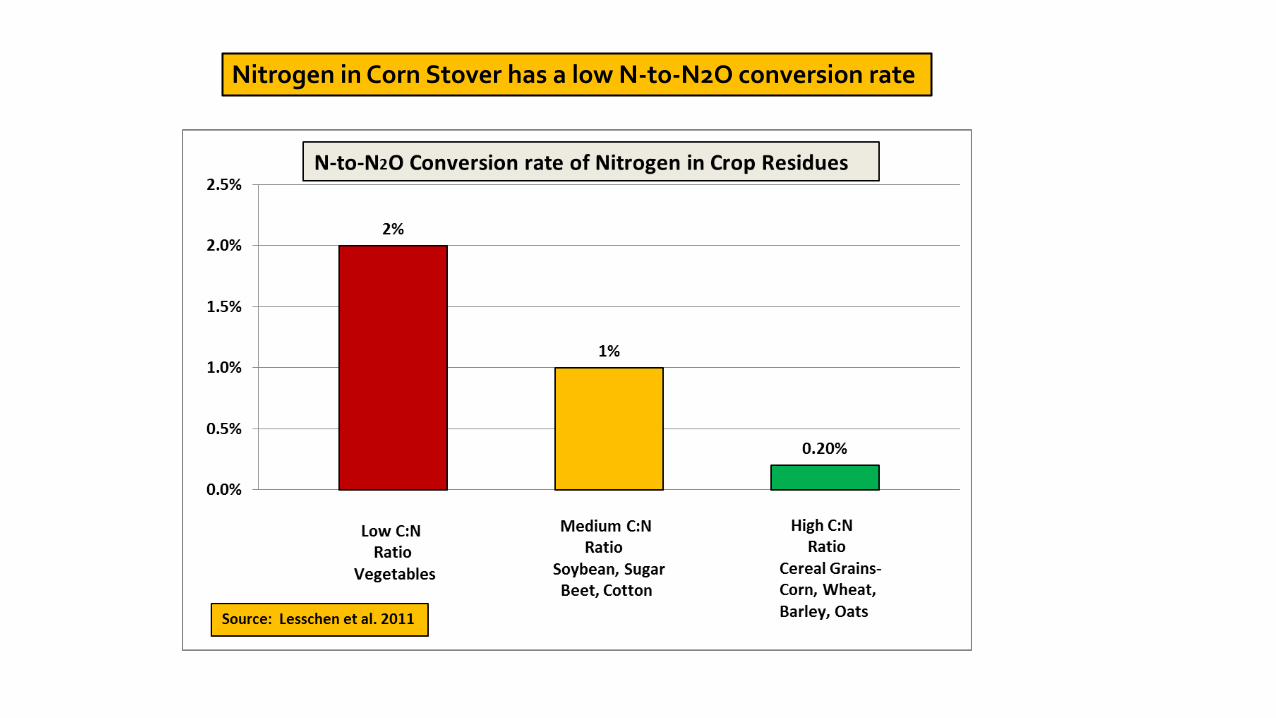
Nitrogen in Corn Stover has a low N-to-N2O conversion rate

Summary of Nitrous Oxide Emissions Reductions
Nitrogen fertilizer leaching losses used to be 30%......recent science indicates in worse case areas (high precip. and tile drained) 10%. So 5% average corn belt wide loss ?
N-to-N2O conversion rates average 1.325%......a regional precipitation weighted corn belt average indicates .9%
N-to-N2O conversion rate of N in corn stover is far less than 1 %.....recent science says .2%
Nitrous Oxide Emissions should be 7 grams CI, rather than the 16 g that is currently modeled in GREET?

Corn Ethanol’s Carbon Intensity Would be only 15 Grams if the Modeling/Accounting was Done using the Latest Science!
Getting Close To Zero Carbon Corn Ethanol !

SUMMARY
Ethanol Plants and Corn Producers have dramatically Reduced Energy Use and GHG Emissions
GHG Modelers must update their accounting with the latest science that reflects the efficiency of modern Corn Production
The Trend is our Friend, Fossil Fuel LCA GHGs are going , Biofuels

If you’re serious about improving soil health and increasing soil carbon stocks and also about growing the most calories and protein per unit of land, water and fertilizer, planting anything else but corn is like pinch hitting for Babe Ruth!
Corn is King