cork electronics industry association cansat 2014 users … · - 3 - cork electronics industry...
TRANSCRIPT

Cork Electronics Industry Association
CanSat 2014 Users Manual
October 2013 – Eamon Connolly CEIA
Cork Electronics Industry Association – CanSat 2014 – Users Manual
Table of Contents
Acknowledgements 1
1. CanSat Overview 2 2. Arduino UNO for temperature and pressure measurements 3 2.1 Temperature measurement using a Thermistor 3 2.1.1 COM port selection 4 2.1.2 Explanation of ReadAnalogVoltage program 5 2.1.3 Uploading the ReadAnalogVoltage program to the Arduino UNO 6 2.2 Pressure measurement using the MPX4115 pressure sensor 8 2.2.1 Writing an Arduino program to measure pressure 9 2.2.2 Calculating altitude from pressure 10 3. Radio Communications 11 3.1 Transmitting data using the APC220 module 11 3.2 Receiving data using the APC220 module 12 3.3 Changing the APC220 operating frequency 13 4. AAU CanSat sensor board 14 5. CanSat construction 16 5.1 CanSat frame and housing 16 5.2 CanSat antenna 18 6. Parachute design 19 7. Testing & Calibration of sensors 20 8. Data analysis & presentation 20 9. Outreach & Communications 21 10. Arduino & CanSat resources 21 11. Secondary Mission ideas 21
Appendices
Appendix 1 – Arduino UNO Set-up 22 Appendix 2 – Thermistor data sheet 26 Appendix 3 – Solderless breadboard 31 Appendix 4 – MPX4115 Pressure sensor data sheet 32
Appendix 5 – APC220 wireless telemetry data sheet 40 Appendix 6 – AAU Sensor board 51
- 1 - Cork Electronics Industry Association – CanSat 2014 Users Manual
Acknowledgements
We would like to thank Prof. Jens Dalsgaard Nielsen, Simon Jensen and other colleagues from Aalborg University College (AAU) in Denmark and NAROM in Norway for providing information regarding CanSat design, allowing us to use and providing us with the Gerber files for the AAU CanSat sensor shield, and allowing us to use information from the CanSat Handbook 2013 Edition in the preparation of this manual.
This user manual is written for CanSat teams new to the CanSat concept and can be used both as an introduction to Arduino programming/interfacing and CanSat. As a next step after this user manual, the CanSat Handbook 2013 Edition – available to download from www.narom.no – is highly recommended.
- 2 - Cork Electronics Industry Association – CanSat 2014 Users Manual
1. CanSat Overview
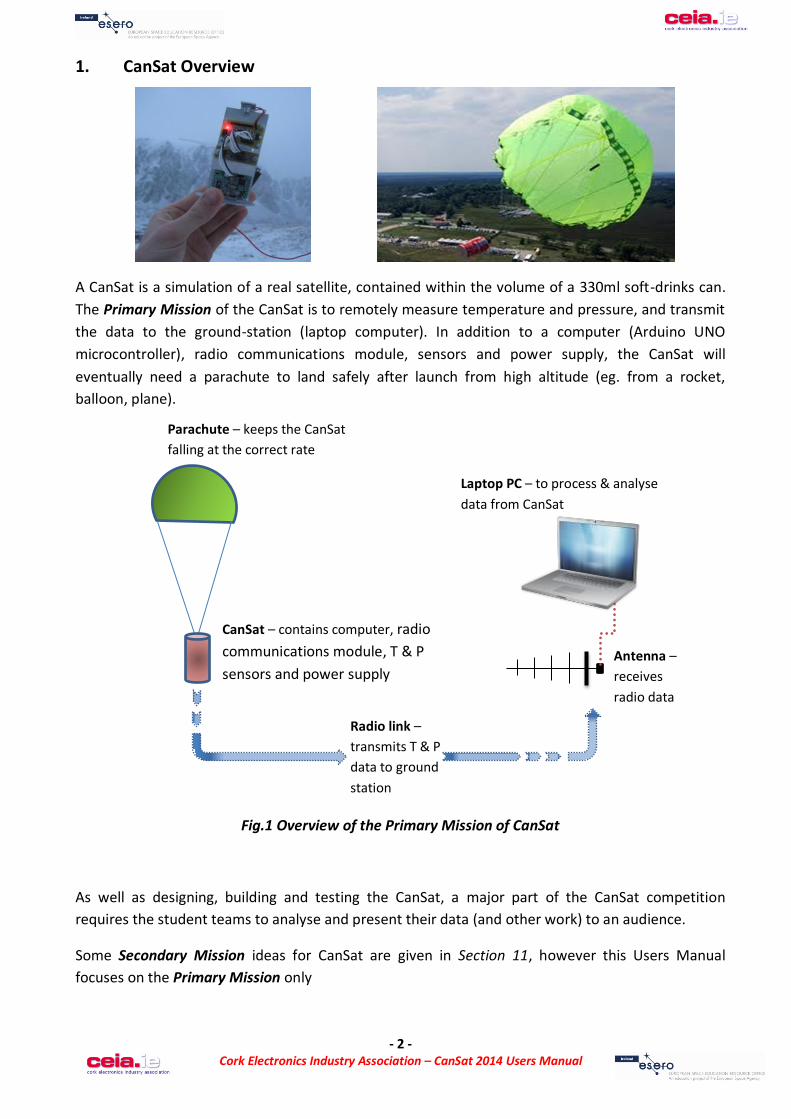
A CanSat is a simulation of a real satellite, contained within the volume of a 330ml soft-drinks can. The Primary Mission of the CanSat is to remotely measure temperature and pressure, and transmit the data to the ground-station (laptop computer). In addition to a computer (Arduino UNO microcontroller), radio communications module, sensors and power supply, the CanSat will eventually need a parachute to land safely after launch from high altitude (eg. from a rocket, balloon, plane).
Fig.1 Overview of the Primary Mission of CanSat
As well as designing, building and testing the CanSat, a major part of the CanSat competition requires the student teams to analyse and present their data (and other work) to an audience.
Some Secondary Mission ideas for CanSat are given in Section 11, however this Users Manual focuses on the Primary Mission only
Parachute – keeps the CanSat falling at the correct rate
CanSat – contains computer, radio communications module, T & P sensors and power supply
Radio link – transmits T & P data to ground station
Laptop PC – to process & analyse data from CanSat
Antenna – receives radio data
- 3 - Cork Electronics Industry Association – CanSat 2014 Users Manual
2. Arduino UNO for temperature and pressure measurements
See Appendix 1 for instructions about installing drivers for your Arduino UNO board and uploading programs from your computer to Arduino.
In this section we will see how to program the Arduino to measure a voltage input to the Arduino from a sensor output.
2.1 Temperature measurement using a Thermistor
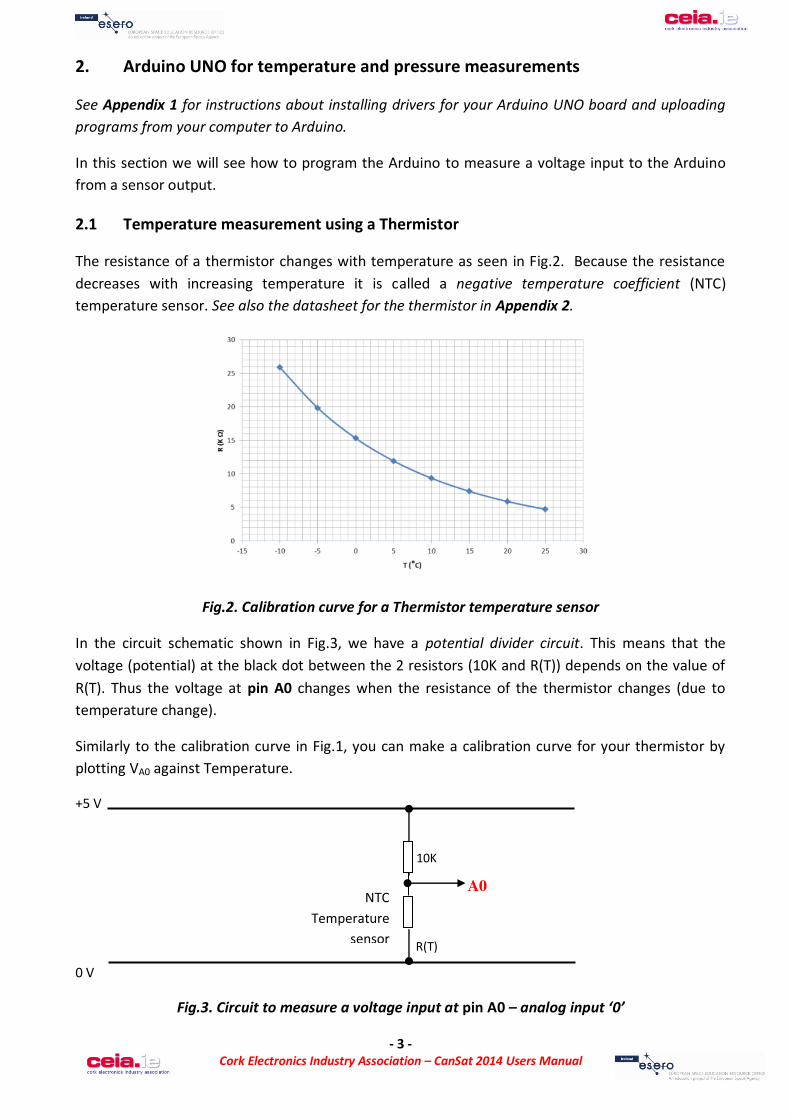
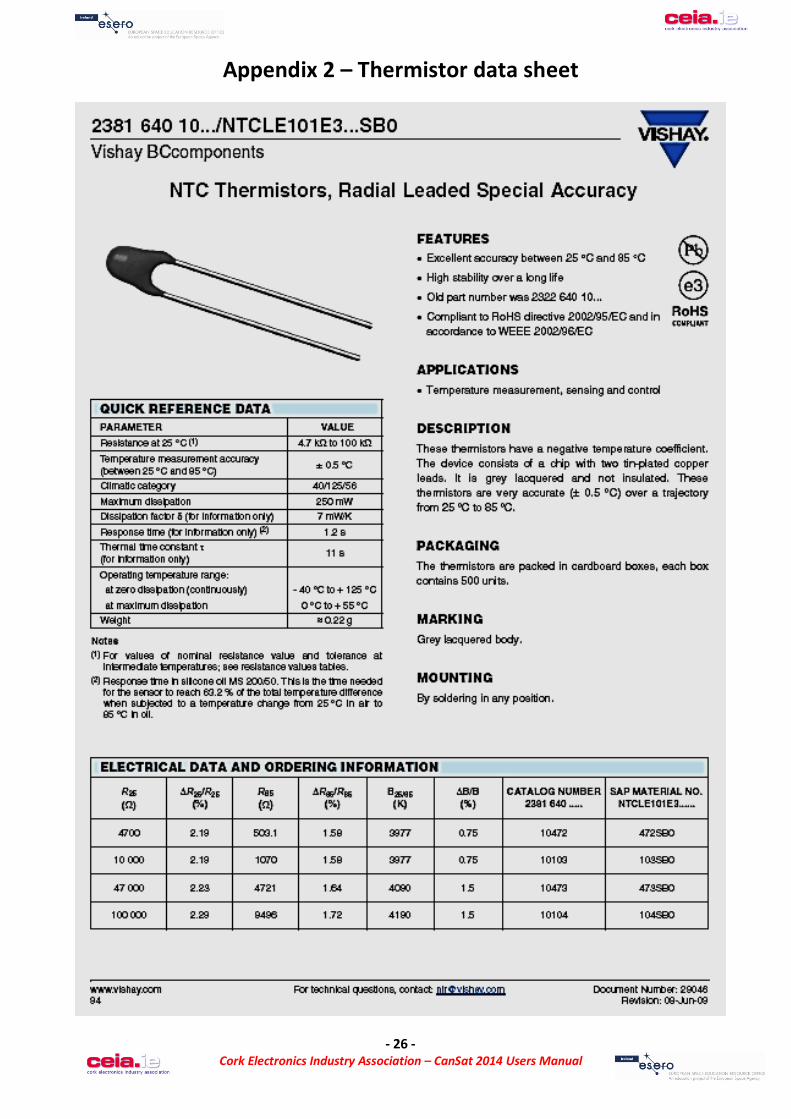
The resistance of a thermistor changes with temperature as seen in Fig.2. Because the resistance decreases with increasing temperature it is called a negative temperature coefficient (NTC) temperature sensor. See also the datasheet for the thermistor in Appendix 2.
Fig.2. Calibration curve for a Thermistor temperature sensor
In the circuit schematic shown in Fig.3, we have a potential divider circuit. This means that the voltage (potential) at the black dot between the 2 resistors (10K and R(T)) depends on the value of R(T). Thus the voltage at pin A0 changes when the resistance of the thermistor changes (due to temperature change).
Similarly to the calibration curve in Fig.1, you can make a calibration curve for your thermistor by plotting VA0 against Temperature.
+5 V
0 V
Fig.3. Circuit to measure a voltage input at pin A0 – analog input ‘0’
NTC Temperature
sensor
A0
10K
R(T)
- 4 - Cork Electronics Industry Association – CanSat 2014 Users Manual
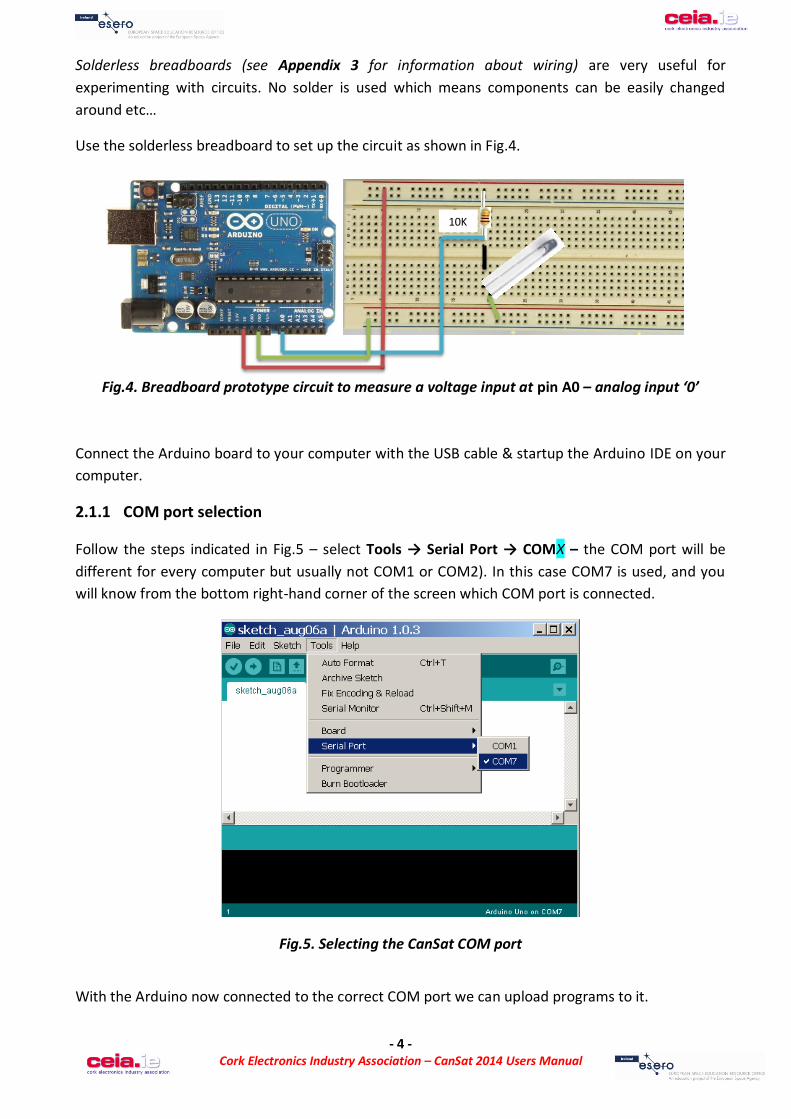
Solderless breadboards (see Appendix 3 for information about wiring) are very useful for experimenting with circuits. No solder is used which means components can be easily changed around etc…
Use the solderless breadboard to set up the circuit as shown in Fig.4.
Fig.4. Breadboard prototype circuit to measure a voltage input at pin A0 – analog input ‘0’
Connect the Arduino board to your computer with the USB cable & startup the Arduino IDE on your computer.
2.1.1 COM port selection
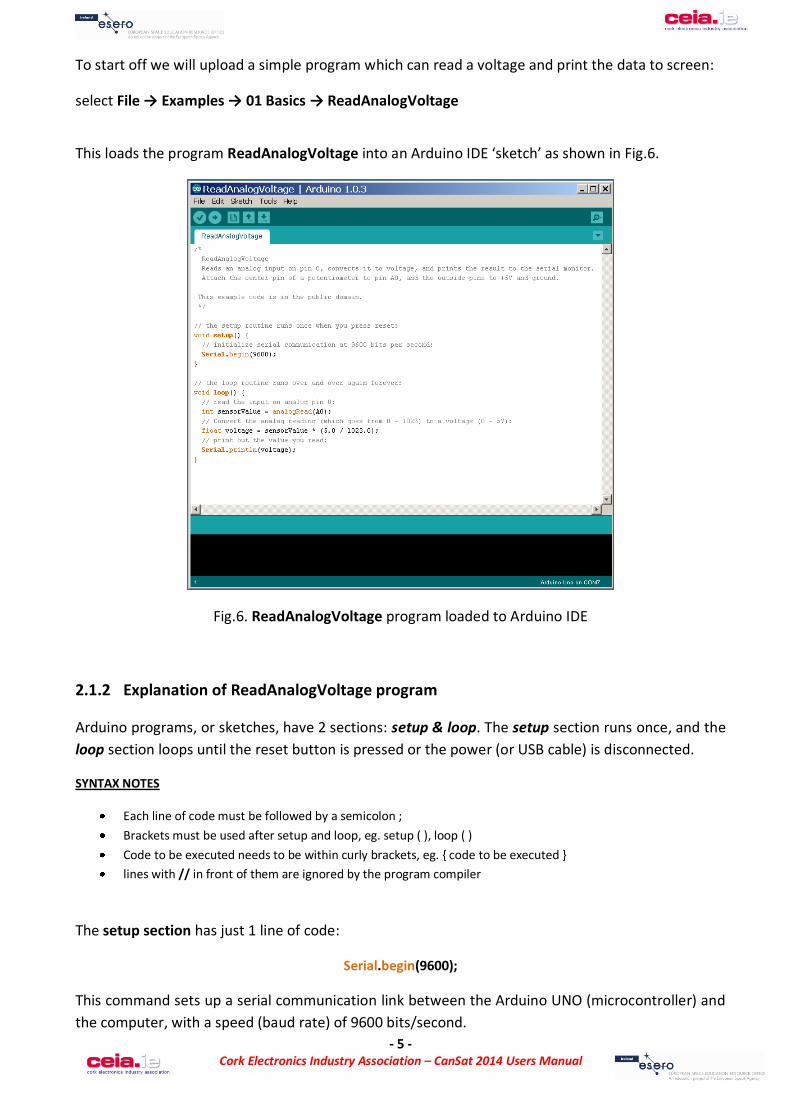
Follow the steps indicated in Fig.5 – select Tools → Serial Port → COMX – the COM port will be different for every computer but usually not COM1 or COM2). In this case COM7 is used, and you will know from the bottom right-hand corner of the screen which COM port is connected.
Fig.5. Selecting the CanSat COM port
With the Arduino now connected to the correct COM port we can upload programs to it.
10K
- 5 - Cork Electronics Industry Association – CanSat 2014 Users Manual
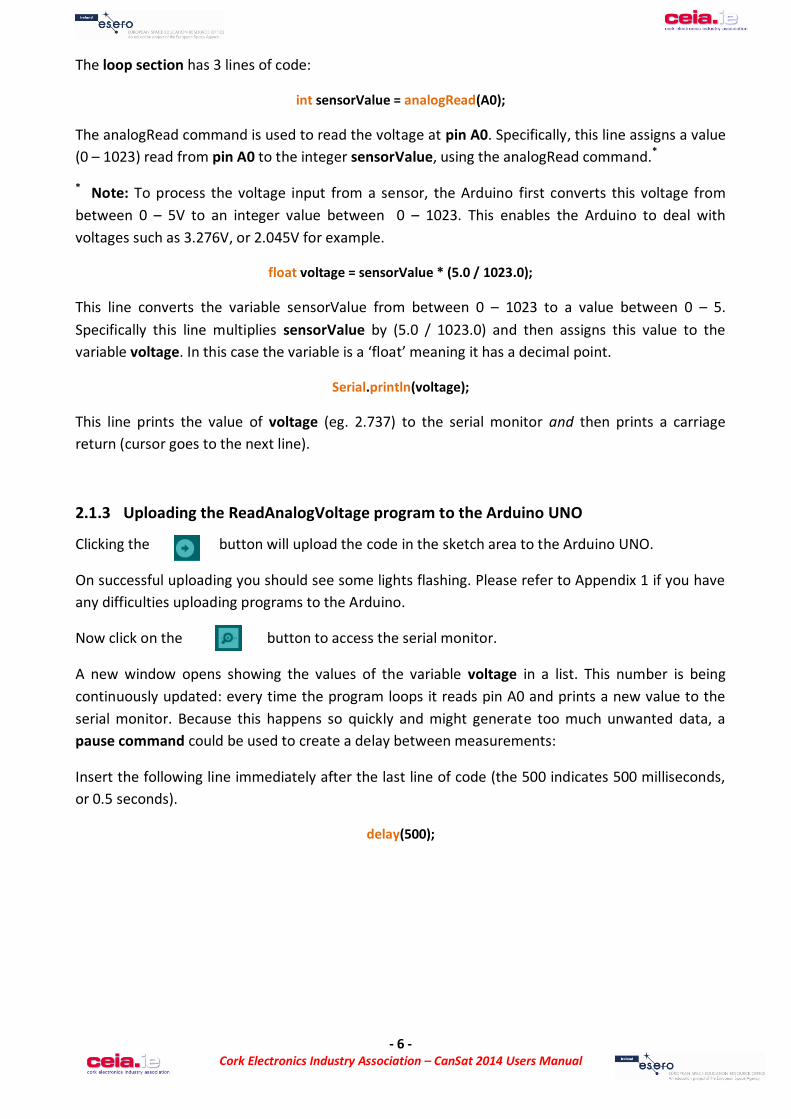
To start off we will upload a simple program which can read a voltage and print the data to screen:
select File → Examples → 01 Basics → ReadAnalogVoltage
This loads the program ReadAnalogVoltage into an Arduino IDE ‘sketch’ as shown in Fig.6.
Fig.6. ReadAnalogVoltage program loaded to Arduino IDE
2.1.2 Explanation of ReadAnalogVoltage program
Arduino programs, or sketches, have 2 sections: setup & loop. The setup section runs once, and the loop section loops until the reset button is pressed or the power (or USB cable) is disconnected.
SYNTAX NOTES
Each line of code must be followed by a semicolon ; Brackets must be used after setup and loop, eg. setup ( ), loop ( ) Code to be executed needs to be within curly brackets, eg. code to be executed lines with // in front of them are ignored by the program compiler
The setup section has just 1 line of code:
Serial.begin(9600);
This command sets up a serial communication link between the Arduino UNO (microcontroller) and the computer, with a speed (baud rate) of 9600 bits/second.
- 6 - Cork Electronics Industry Association – CanSat 2014 Users Manual
The loop section has 3 lines of code:
int sensorValue = analogRead(A0);
The analogRead command is used to read the voltage at pin A0. Specifically, this line assigns a value (0 – 1023) read from pin A0 to the integer sensorValue, using the analogRead command.*
* Note: To process the voltage input from a sensor, the Arduino first converts this voltage from between 0 – 5V to an integer value between 0 – 1023. This enables the Arduino to deal with voltages such as 3.276V, or 2.045V for example.
float voltage = sensorValue * (5.0 / 1023.0);
This line converts the variable sensorValue from between 0 – 1023 to a value between 0 – 5. Specifically this line multiplies sensorValue by (5.0 / 1023.0) and then assigns this value to the variable voltage. In this case the variable is a ‘float’ meaning it has a decimal point.
Serial.println(voltage);
This line prints the value of voltage (eg. 2.737) to the serial monitor and then prints a carriage return (cursor goes to the next line).
2.1.3 Uploading the ReadAnalogVoltage program to the Arduino UNO
Clicking the button will upload the code in the sketch area to the Arduino UNO.
On successful uploading you should see some lights flashing. Please refer to Appendix 1 if you have any difficulties uploading programs to the Arduino.
Now click on the button to access the serial monitor.
A new window opens showing the values of the variable voltage in a list. This number is being continuously updated: every time the program loops it reads pin A0 and prints a new value to the serial monitor. Because this happens so quickly and might generate too much unwanted data, a pause command could be used to create a delay between measurements:
Insert the following line immediately after the last line of code (the 500 indicates 500 milliseconds, or 0.5 seconds).
delay(500);
- 7 - Cork Electronics Industry Association – CanSat 2014 Users Manual
It’s a good idea to try to write the complete program into another blank sketch. First close the window with the ReadAnalogVoltage program (don’t save changes). Open up a new Arduino IDE sketch area :
Select File → New
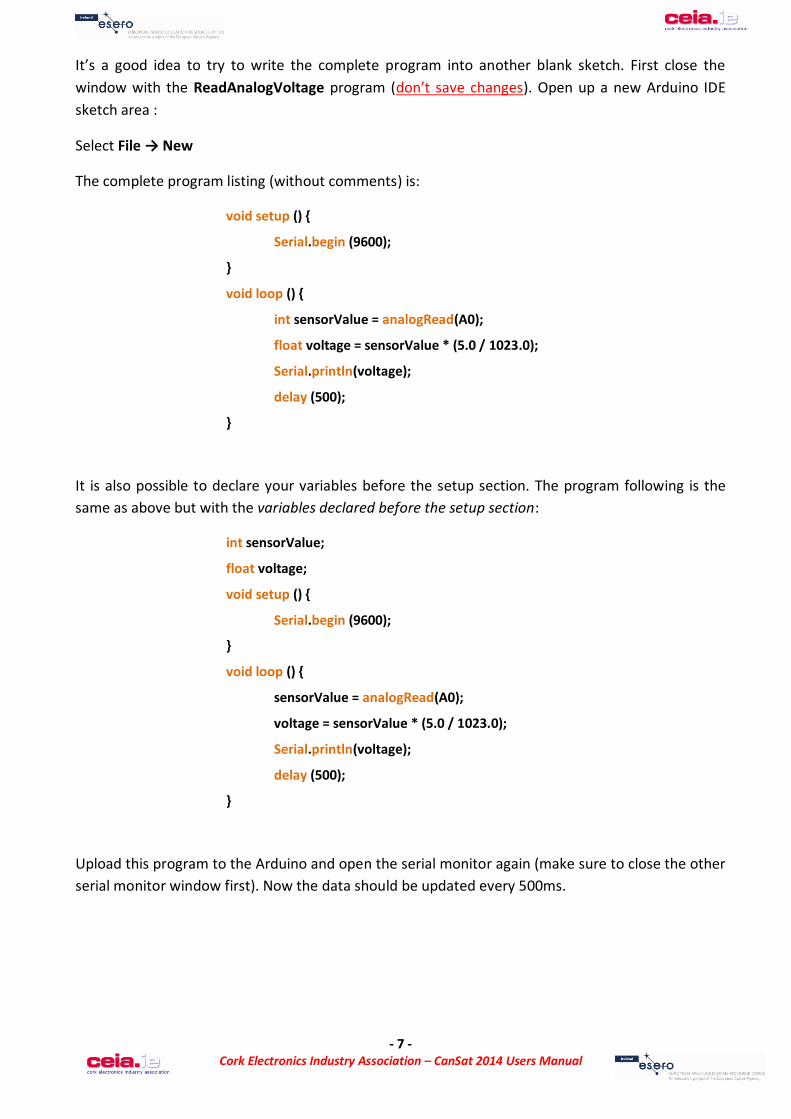
The complete program listing (without comments) is:
void setup ()
Serial.begin (9600);
void loop ()
int sensorValue = analogRead(A0);
float voltage = sensorValue * (5.0 / 1023.0);
Serial.println(voltage);
delay (500);
It is also possible to declare your variables before the setup section. The program following is the same as above but with the variables declared before the setup section:
int sensorValue;
float voltage;
void setup ()
Serial.begin (9600);
void loop ()
sensorValue = analogRead(A0);
voltage = sensorValue * (5.0 / 1023.0);
Serial.println(voltage);
delay (500);
Upload this program to the Arduino and open the serial monitor again (make sure to close the other serial monitor window first). Now the data should be updated every 500ms.
- 8 - Cork Electronics Industry Association – CanSat 2014 Users Manual
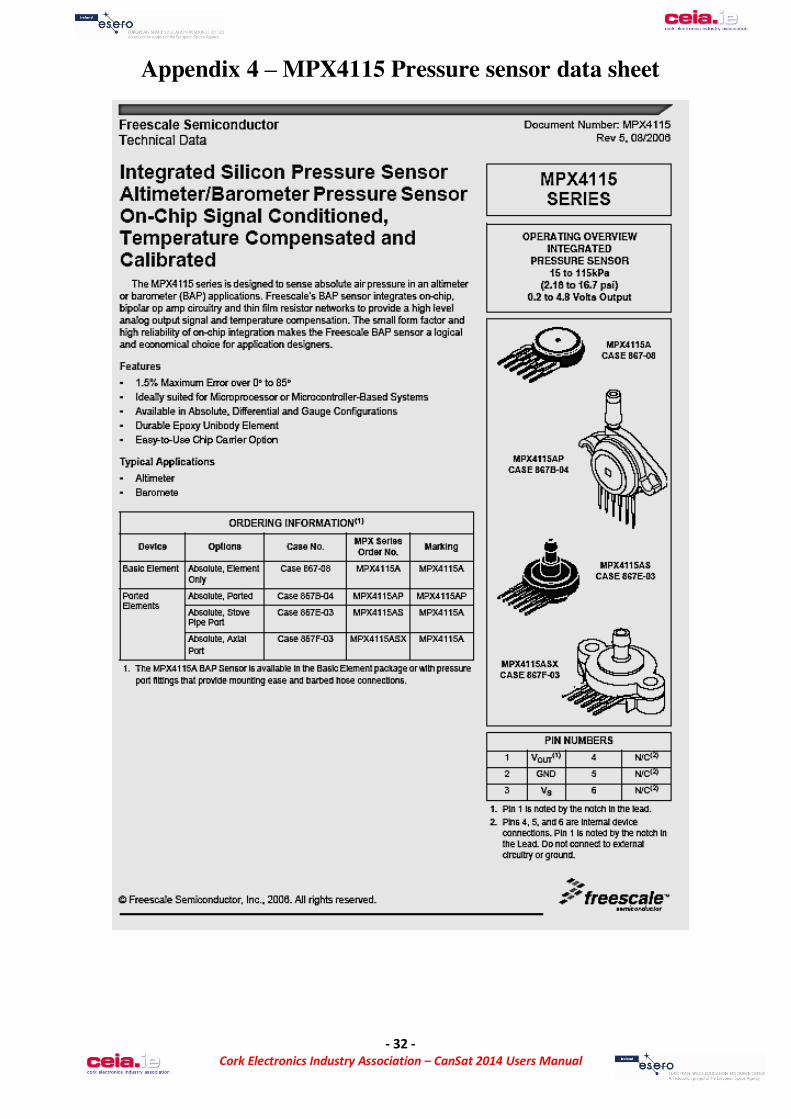
2.2 Pressure measurement using the MPX4115 pressure sensor
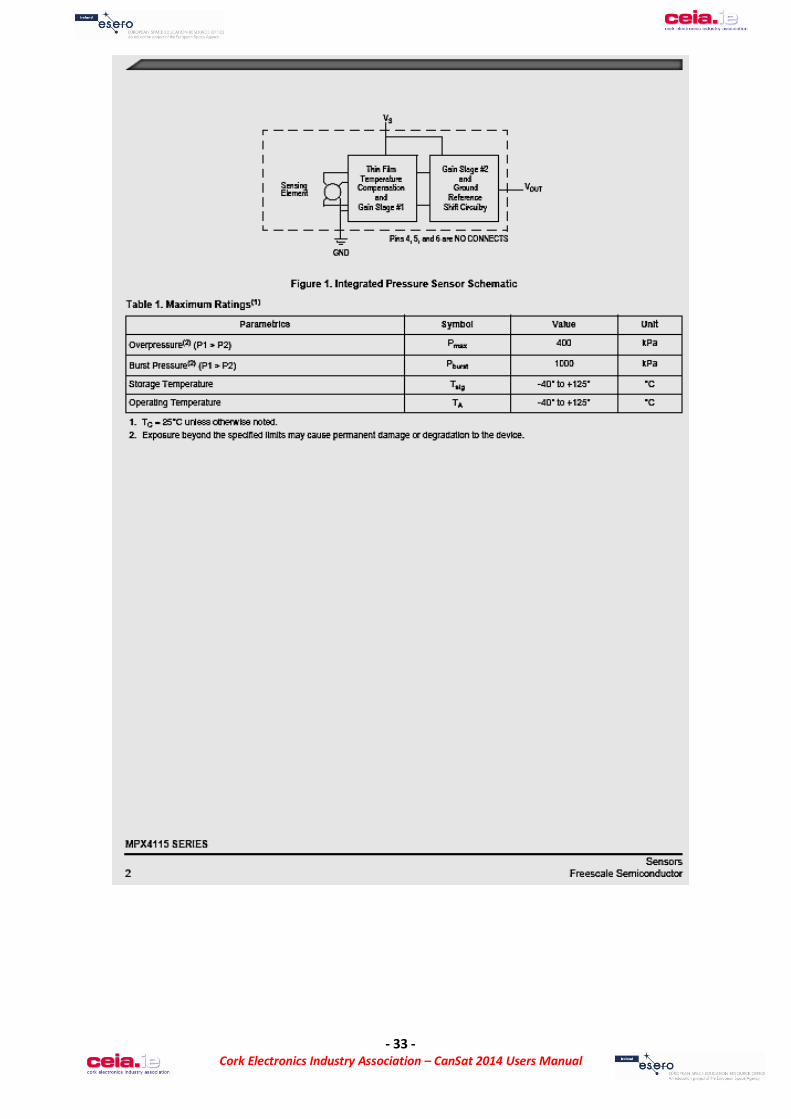
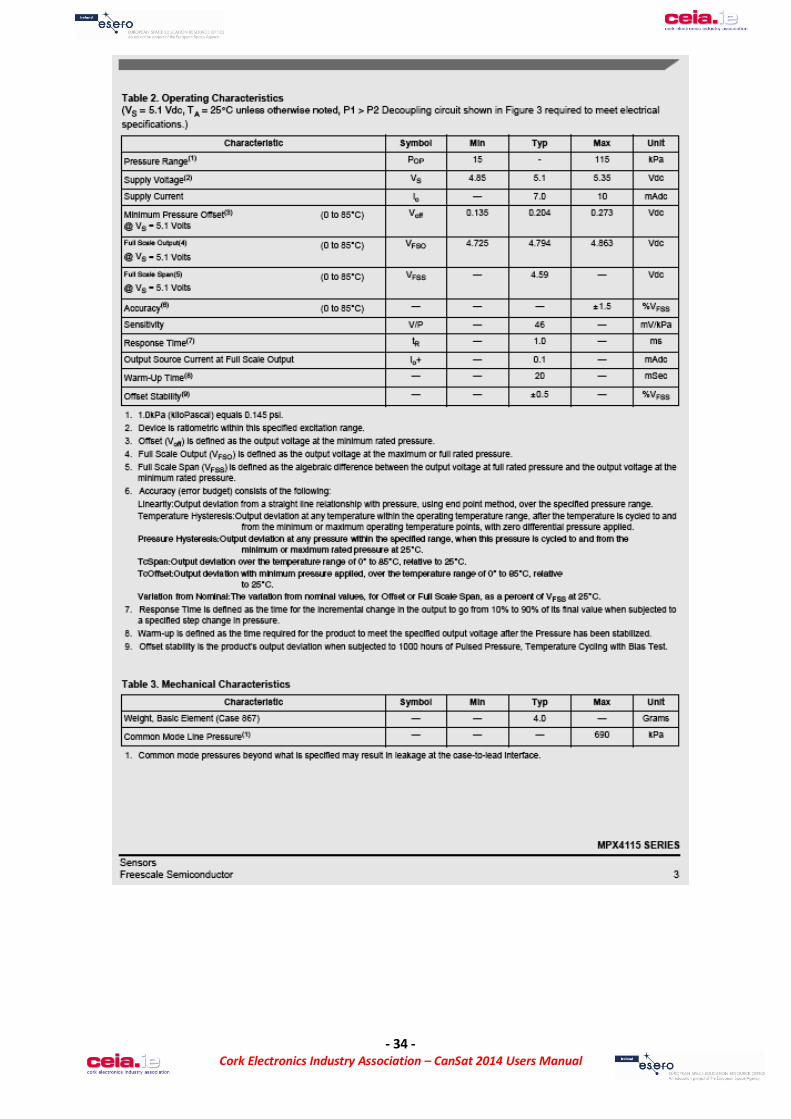
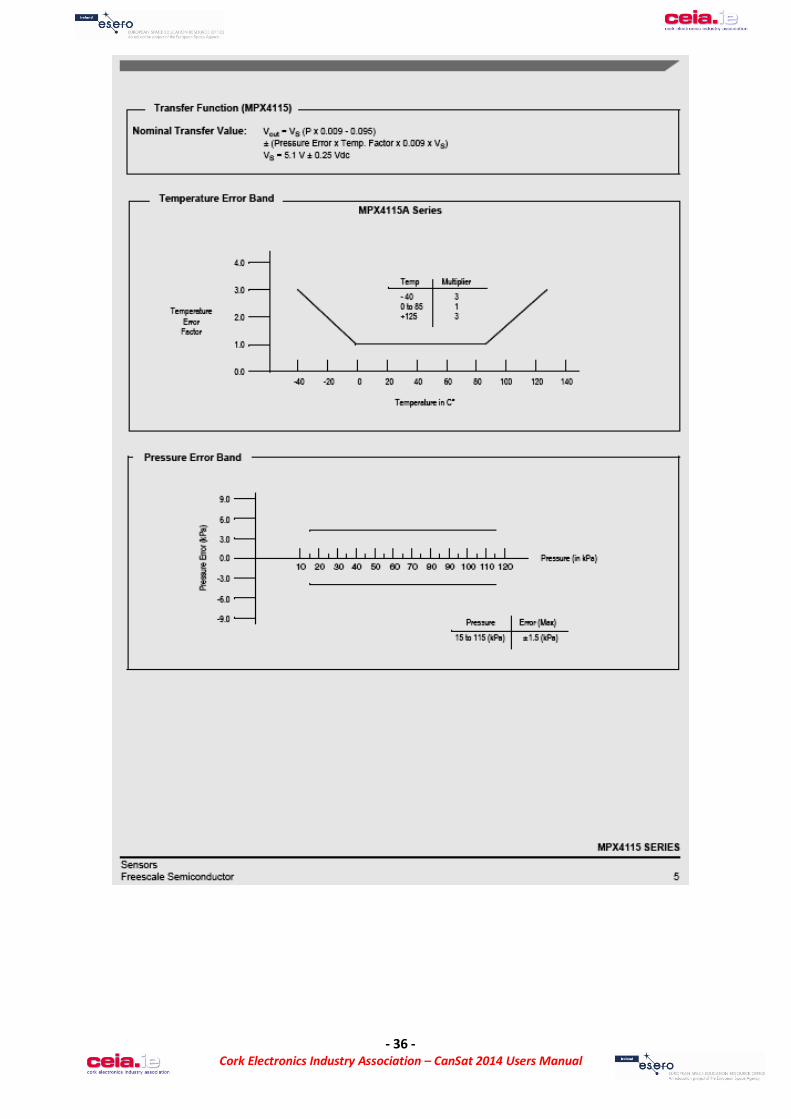
The pressure sensor used is the MPX4115A from Freescale Semiconductor. It uses a silicon piezoresistive sensor element. Fig.7 shows a schematic of the sensor. For more information see the MPX4115A pressure sensor datasheet in Appendix 4.
Piezoresistive means that the resistance of a material change when a mechanical stress is applied. In this case silicon is used. The changes of resistance for silicon are magnitudes of times larger than for metals, making this material very useful to use in a pressure sensor.
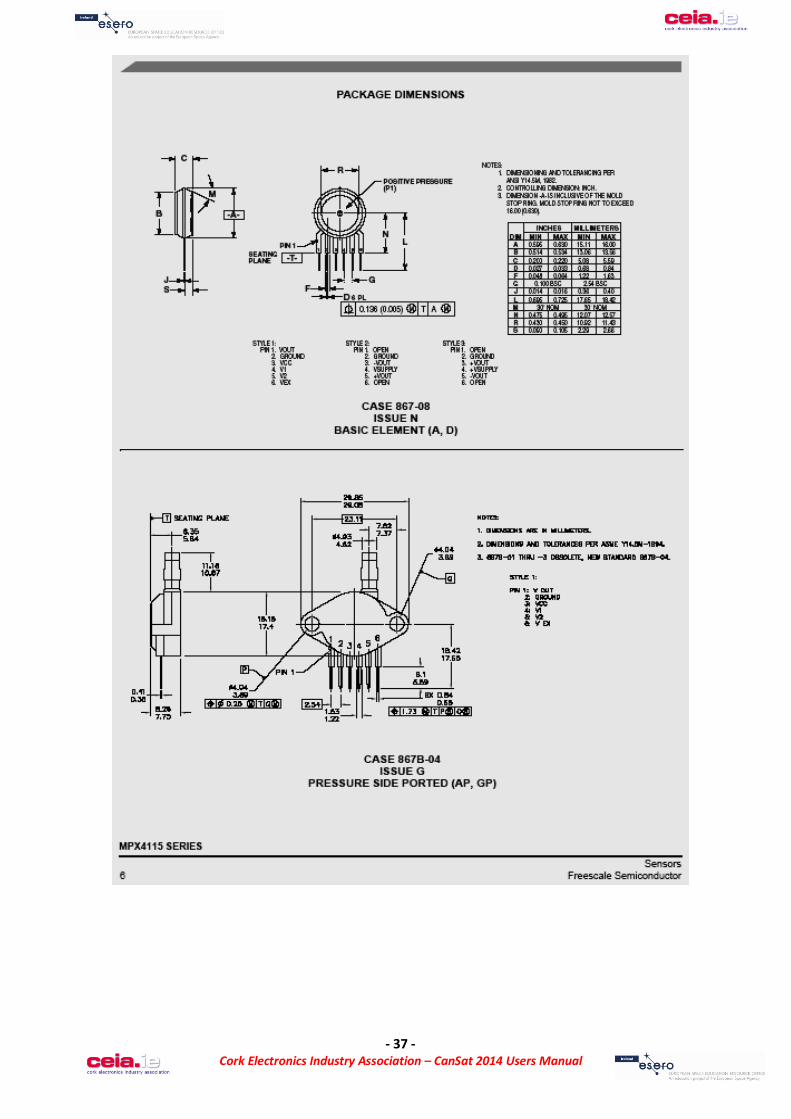
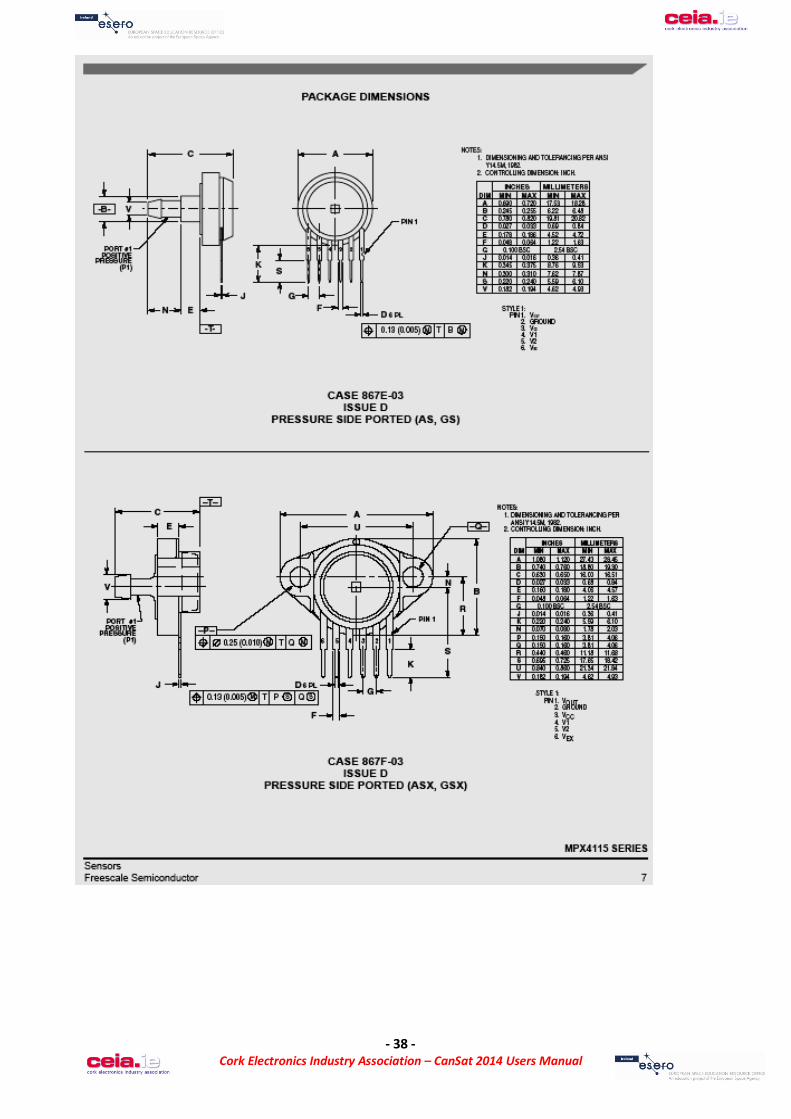
The MPX4115A pressure sensor has 6 pins, and that pin 1 can be identified by a small notch on the leg. Pins 1, 2 and 3 are assigned to Vout, 0 V, and Vsupply respectively.
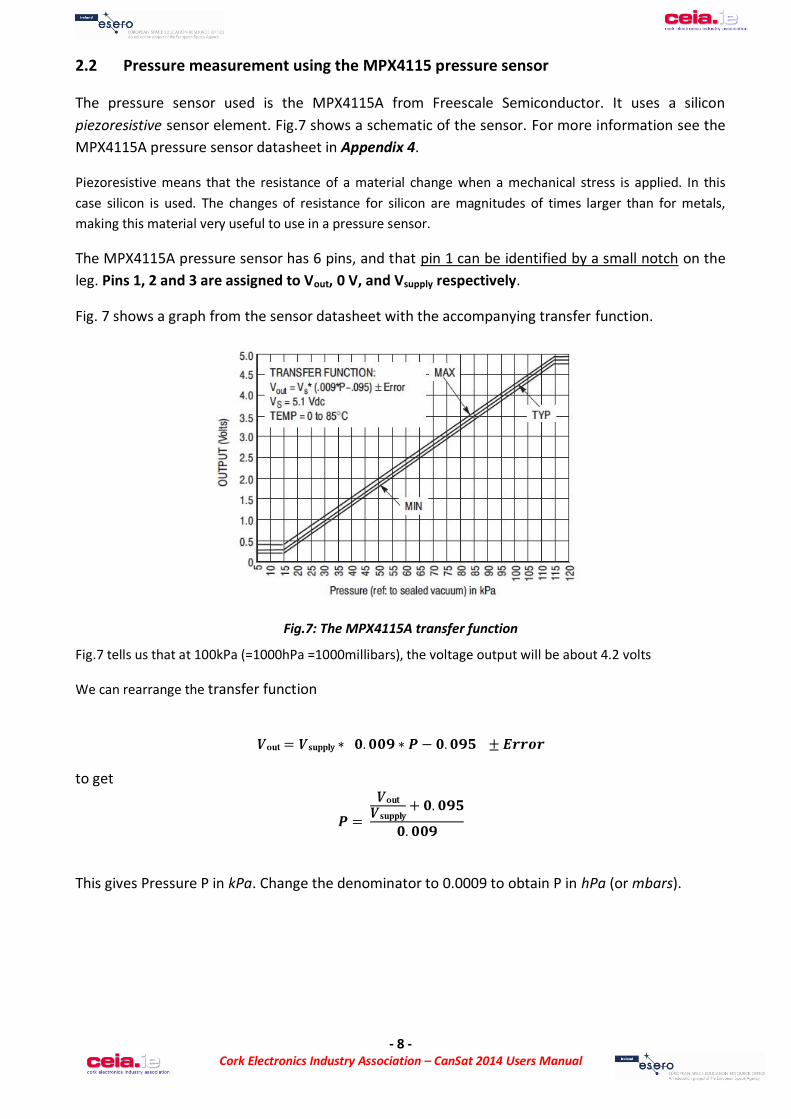
Fig. 7 shows a graph from the sensor datasheet with the accompanying transfer function.
Fig.7: The MPX4115A transfer function
Fig.7 tells us that at 100kPa (=1000hPa =1000millibars), the voltage output will be about 4.2 volts
We can rearrange the transfer function
to get
This gives Pressure P in kPa. Change the denominator to 0.0009 to obtain P in hPa (or mbars).
- 9 - Cork Electronics Industry Association – CanSat 2014 Users Manual
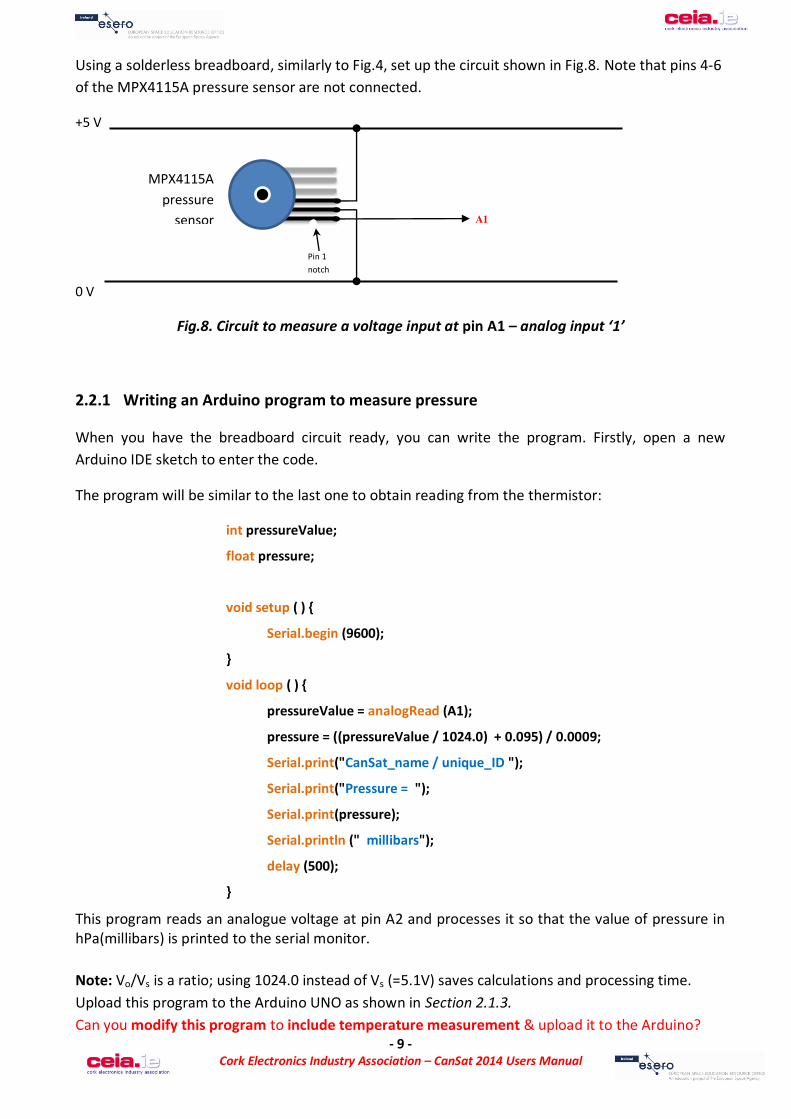
Using a solderless breadboard, similarly to Fig.4, set up the circuit shown in Fig.8. Note that pins 4-6 of the MPX4115A pressure sensor are not connected.
+5 V
0 V
Fig.8. Circuit to measure a voltage input at pin A1 – analog input ‘1’
2.2.1 Writing an Arduino program to measure pressure
When you have the breadboard circuit ready, you can write the program. Firstly, open a new Arduino IDE sketch to enter the code.
The program will be similar to the last one to obtain reading from the thermistor:
int pressureValue;
float pressure;
void setup ( )
Serial.begin (9600);
void loop ( )
pressureValue = analogRead (A1);
pressure = ((pressureValue / 1024.0) + 0.095) / 0.0009;
Serial.print("CanSat_name / unique_ID ");
Serial.print("Pressure = ");
Serial.print(pressure);
Serial.println (" millibars");
delay (500);
This program reads an analogue voltage at pin A2 and processes it so that the value of pressure in hPa(millibars) is printed to the serial monitor. Note: Vo/Vs is a ratio; using 1024.0 instead of Vs (=5.1V) saves calculations and processing time. Upload this program to the Arduino UNO as shown in Section 2.1.3. Can you modify this program to include temperature measurement & upload it to the Arduino?
MPX4115A pressure
sensor A1
Pin 1 notch
- 10 - Cork Electronics Industry Association – CanSat 2014 Users Manual
2.2.2 Calculating altitude from pressure (this section can be skipped & returned to later)
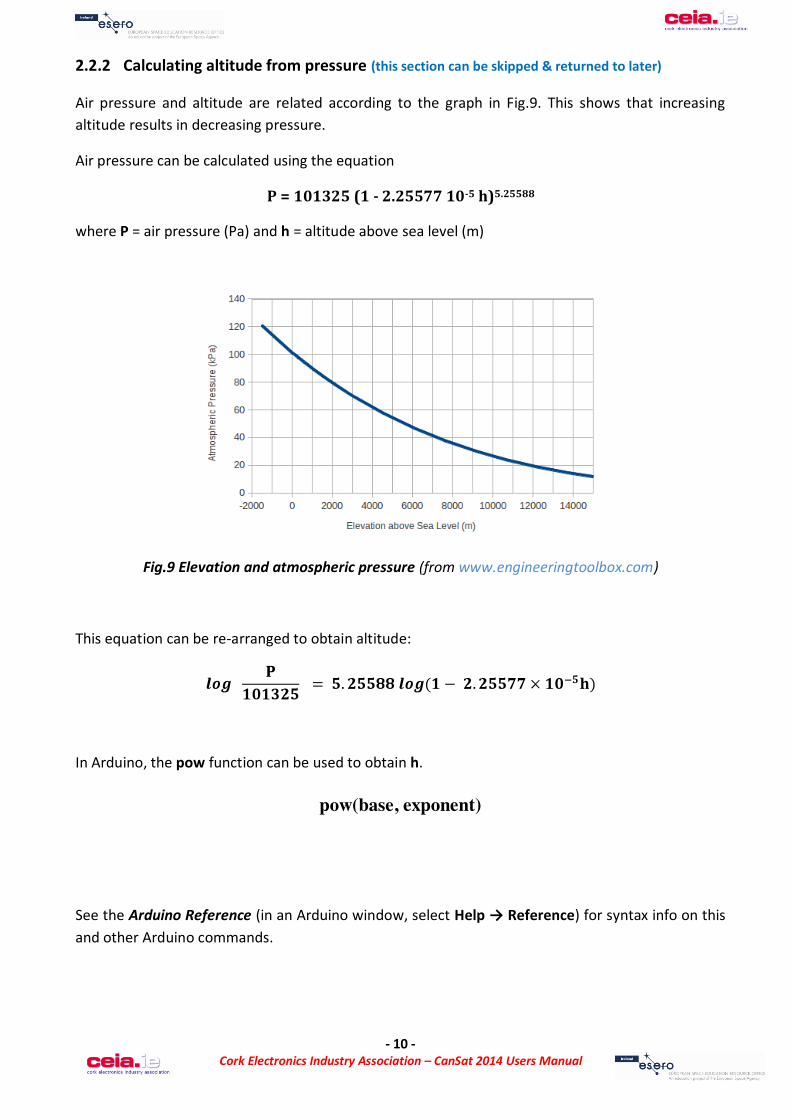
Air pressure and altitude are related according to the graph in Fig.9. This shows that increasing altitude results in decreasing pressure.
Air pressure can be calculated using the equation
P = 101325 (1 - 2.25577 10-5 h)5.25588
where P = air pressure (Pa) and h = altitude above sea level (m)
Fig.9 Elevation and atmospheric pressure (from www.engineeringtoolbox.com)
This equation can be re-arranged to obtain altitude:
In Arduino, the pow function can be used to obtain h.
pow(base, exponent)
See the Arduino Reference (in an Arduino window, select Help → Reference) for syntax info on this and other Arduino commands.
- 11 - Cork Electronics Industry Association – CanSat 2014 Users Manual
3. Radio Communications
See Appendix 5 for the APC220 Wireless Communication Module data sheet
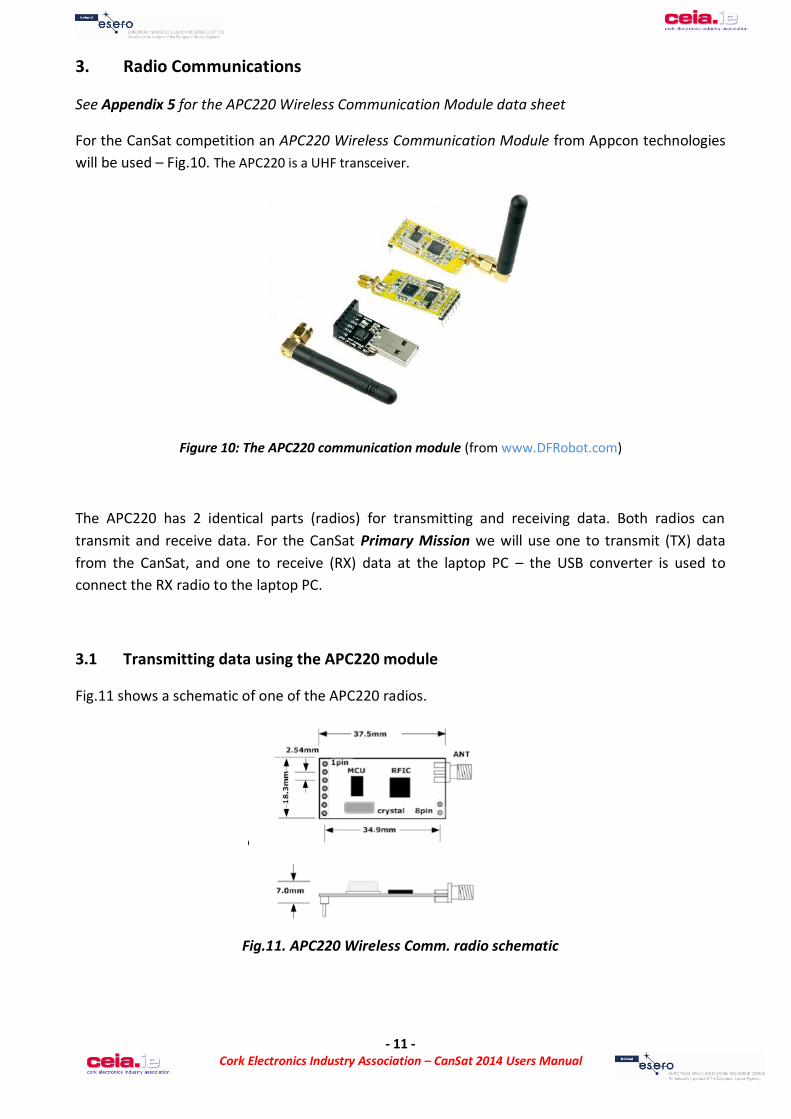
For the CanSat competition an APC220 Wireless Communication Module from Appcon technologies will be used – Fig.10. The APC220 is a UHF transceiver.
Figure 10: The APC220 communication module (from www.DFRobot.com)
The APC220 has 2 identical parts (radios) for transmitting and receiving data. Both radios can transmit and receive data. For the CanSat Primary Mission we will use one to transmit (TX) data from the CanSat, and one to receive (RX) data at the laptop PC – the USB converter is used to connect the RX radio to the laptop PC.
3.1 Transmitting data using the APC220 module
Fig.11 shows a schematic of one of the APC220 radios.
Fig.11. APC220 Wireless Comm. radio schematic
- 12 - Cork Electronics Industry Association – CanSat 2014 Users Manual
+5 V
0 V
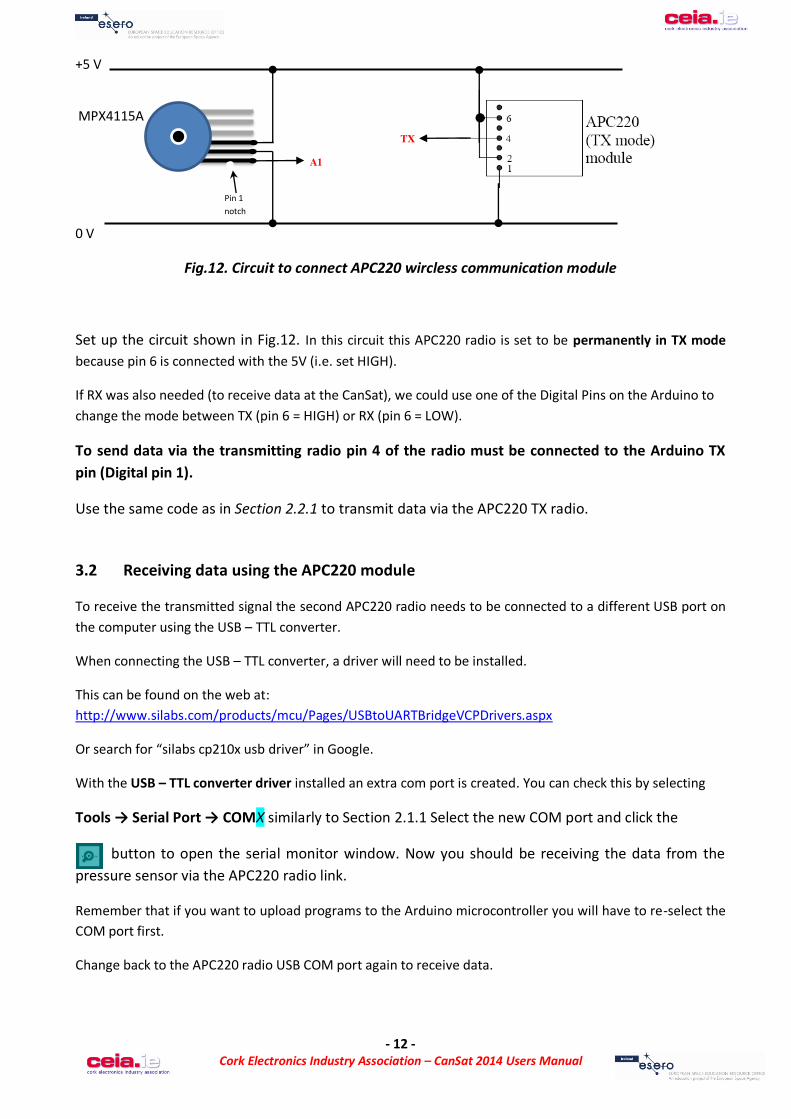
Fig.12. Circuit to connect APC220 wircless communication module
Set up the circuit shown in Fig.12. In this circuit this APC220 radio is set to be permanently in TX mode because pin 6 is connected with the 5V (i.e. set HIGH).
If RX was also needed (to receive data at the CanSat), we could use one of the Digital Pins on the Arduino to change the mode between TX (pin 6 = HIGH) or RX (pin 6 = LOW).
To send data via the transmitting radio pin 4 of the radio must be connected to the Arduino TX pin (Digital pin 1).
Use the same code as in Section 2.2.1 to transmit data via the APC220 TX radio.
3.2 Receiving data using the APC220 module
To receive the transmitted signal the second APC220 radio needs to be connected to a different USB port on the computer using the USB – TTL converter.
When connecting the USB – TTL converter, a driver will need to be installed.
This can be found on the web at: http://www.silabs.com/products/mcu/Pages/USBtoUARTBridgeVCPDrivers.aspx
Or search for “silabs cp210x usb driver” in Google.
With the USB – TTL converter driver installed an extra com port is created. You can check this by selecting
Tools → Serial Port → COMX similarly to Section 2.1.1 Select the new COM port and click the
button to open the serial monitor window. Now you should be receiving the data from the pressure sensor via the APC220 radio link.
Remember that if you want to upload programs to the Arduino microcontroller you will have to re-select the COM port first.
Change back to the APC220 radio USB COM port again to receive data.
MPX4115A
A1
Pin 1 notch
TX
- 13 - Cork Electronics Industry Association – CanSat 2014 Users Manual
3.3 Changing the APC220 operating frequency (adapted from The CanSat Book)
When there are several CanSats operating in close proximity (eg. during group sessions and CanSat competition), assigning different ‘operating’ frequencies to different CanSats will facilitate data collection – without this option, all ‘ground stations’ would be receiving data from all CanSats.
Connect the Arduino board to the computer and upload the program “apc220cfg.ino” which is found on the memory stick (or NAROM’s web site - http://www.narom.no/).
Make sure you upload the program before you try to connect the transceiver to the Arduino board. Disconnect the USB cable (and battery) from the Arduino board and connect the transceiver to the Arduino as shown in Fig 13.
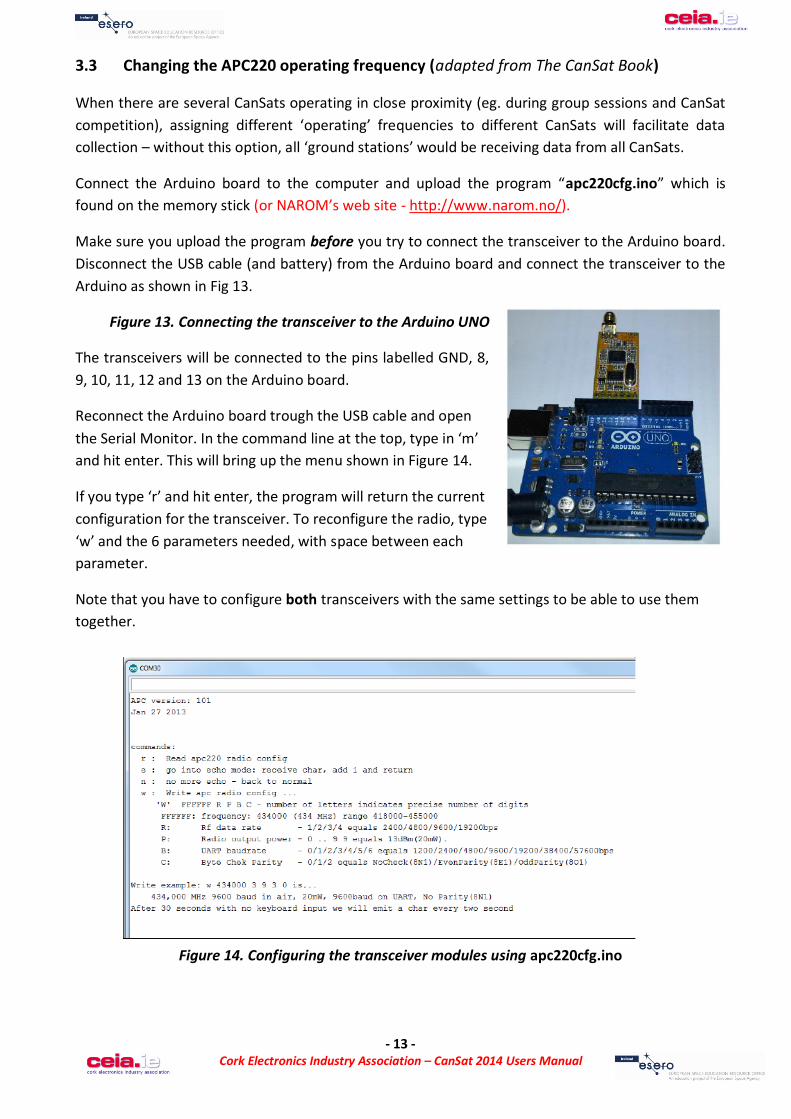
Figure 13. Connecting the transceiver to the Arduino UNO
The transceivers will be connected to the pins labelled GND, 8, 9, 10, 11, 12 and 13 on the Arduino board.
Reconnect the Arduino board trough the USB cable and open the Serial Monitor. In the command line at the top, type in ‘m’ and hit enter. This will bring up the menu shown in Figure 14.
If you type ‘r’ and hit enter, the program will return the current configuration for the transceiver. To reconfigure the radio, type ‘w’ and the 6 parameters needed, with space between each parameter.
Note that you have to configure both transceivers with the same settings to be able to use them together.
Figure 14. Configuring the transceiver modules using apc220cfg.ino
- 14 - Cork Electronics Industry Association – CanSat 2014 Users Manual
4. AAU CanSat sensor board (adapted from The CanSat Book)
In order to fit all the components neatly inside the can we will use a printed circuit board (PCB) from AAU in Denmark. Instead of wires between the components a PCB uses layers of printed conductors (metals).
Using a PCB will save space and keep everything in its correct position. The circuits will be robust but more difficult to change than with the solderless breadboards.
Appendix 6 gives more details about the AAU PCB.
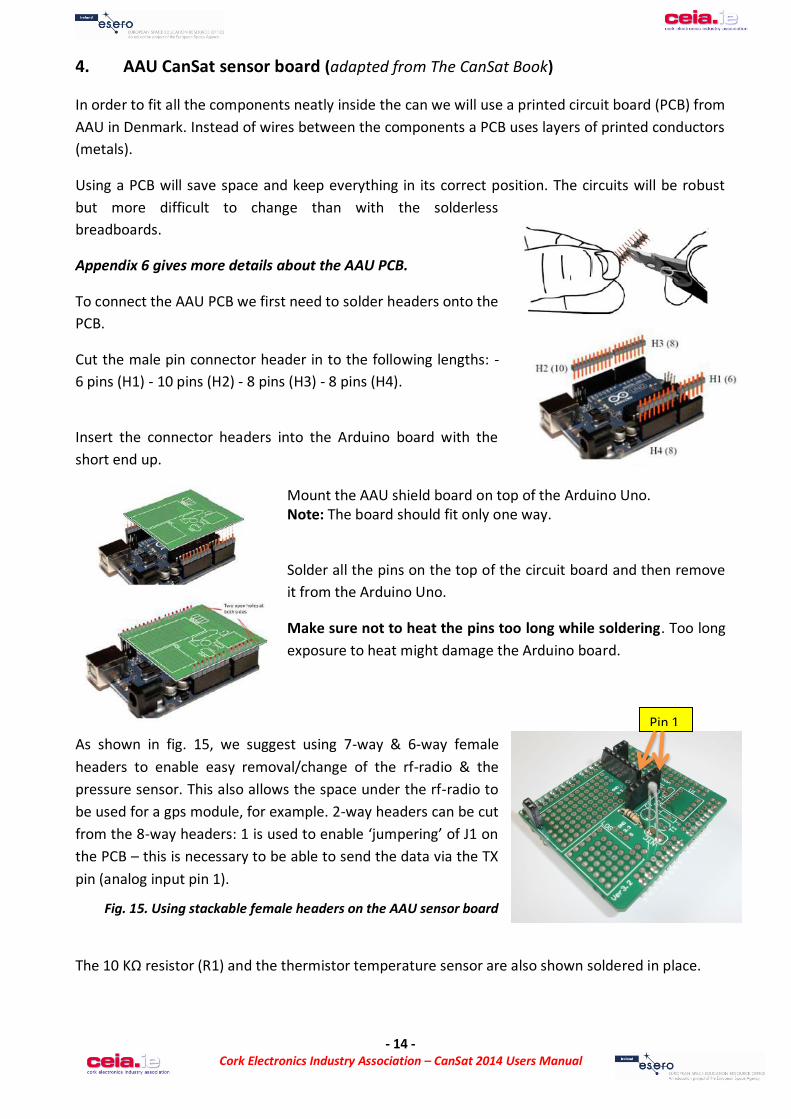
To connect the AAU PCB we first need to solder headers onto the PCB.
Cut the male pin connector header in to the following lengths: - 6 pins (H1) - 10 pins (H2) - 8 pins (H3) - 8 pins (H4).
Insert the connector headers into the Arduino board with the short end up.
Mount the AAU shield board on top of the Arduino Uno. Note: The board should fit only one way.
Solder all the pins on the top of the circuit board and then remove it from the Arduino Uno.
Make sure not to heat the pins too long while soldering. Too long exposure to heat might damage the Arduino board.
As shown in fig. 15, we suggest using 7-way & 6-way female headers to enable easy removal/change of the rf-radio & the pressure sensor. This also allows the space under the rf-radio to be used for a gps module, for example. 2-way headers can be cut from the 8-way headers: 1 is used to enable ‘jumpering’ of J1 on the PCB – this is necessary to be able to send the data via the TX pin (analog input pin 1).
Fig. 15. Using stackable female headers on the AAU sensor board
The 10 KΩ resistor (R1) and the thermistor temperature sensor are also shown soldered in place.
Pin 1

- 15 - Cork Electronics Industry Association – CanSat 2014 Users Manual
A 2-pin ‘stabilising’ header should also be soldered on to the TX rf-module as shown on the right.
Fig. 16 Indicating pin 1 positions for the MPX4115A pressure sensor and the APC220 radio, the J2 jumper and
the 9V battery connector
Fig. 16 shows the pin 1 positions for the MPX4115A pressure sensor and the APC220 radio. Also shown is the 10KΩ resistor and the connections for the 9V battery connector.
To transmit data via the Arduino TX pin, we also need to ‘jumper’ the J2 holes as shown in red.
It is a good idea to use headers to connect the MPX4115A and APC220 to the sensor board instead of soldering them in directly – this will enable easy removal/replacement of these components if necessary.
Pin 1
9V battery connector
- 16 - Cork Electronics Industry Association – CanSat 2014 Users Manual
5. CanSat construction
5.1 CanSat frame and housing
A piece of aluminium is provided in the CanSat kit as a frame to attach the parachute to and mount the Arduino & electronics/sensors etc.
Of course it is not a requirement to use the Aluminium plate provided as the CanSat frame, and figure 17 shows just one way the CanSat might be designed.
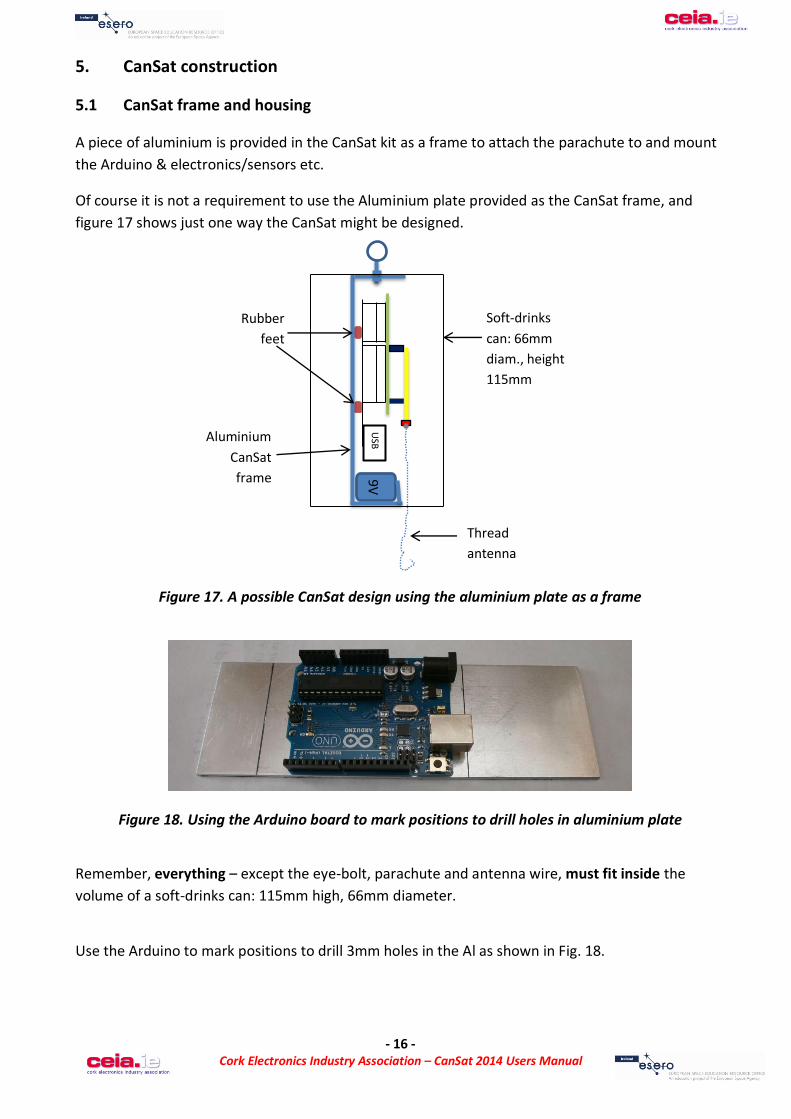
Figure 17. A possible CanSat design using the aluminium plate as a frame
Figure 18. Using the Arduino board to mark positions to drill holes in aluminium plate
Remember, everything – except the eye-bolt, parachute and antenna wire, must fit inside the volume of a soft-drinks can: 115mm high, 66mm diameter.
Use the Arduino to mark positions to drill 3mm holes in the Al as shown in Fig. 18.
USB
BB 9V
Rubber feet
Soft-drinks can: 66mm diam., height 115mm
Aluminium CanSat frame
Thread antenna

- 17 - Cork Electronics Industry Association – CanSat 2014 Users Manual
You will also need to drill a 6mm hole for the eye-bolt to attach the parachute, and a bigger hole for the USB cable (otherwise you will have to remove your Arduino from the frame every time you want to change the program – not a good design!).
The Al plate has to be bent into shape to create the battery holder.
The parachute eye-bolt section also needs to be bent into shape. Several different designs are shown in the images below.
Fig.19 CanSat frame & housing construction – several ways to design the CanSat
- 18 - Cork Electronics Industry Association – CanSat 2014 Users Manual
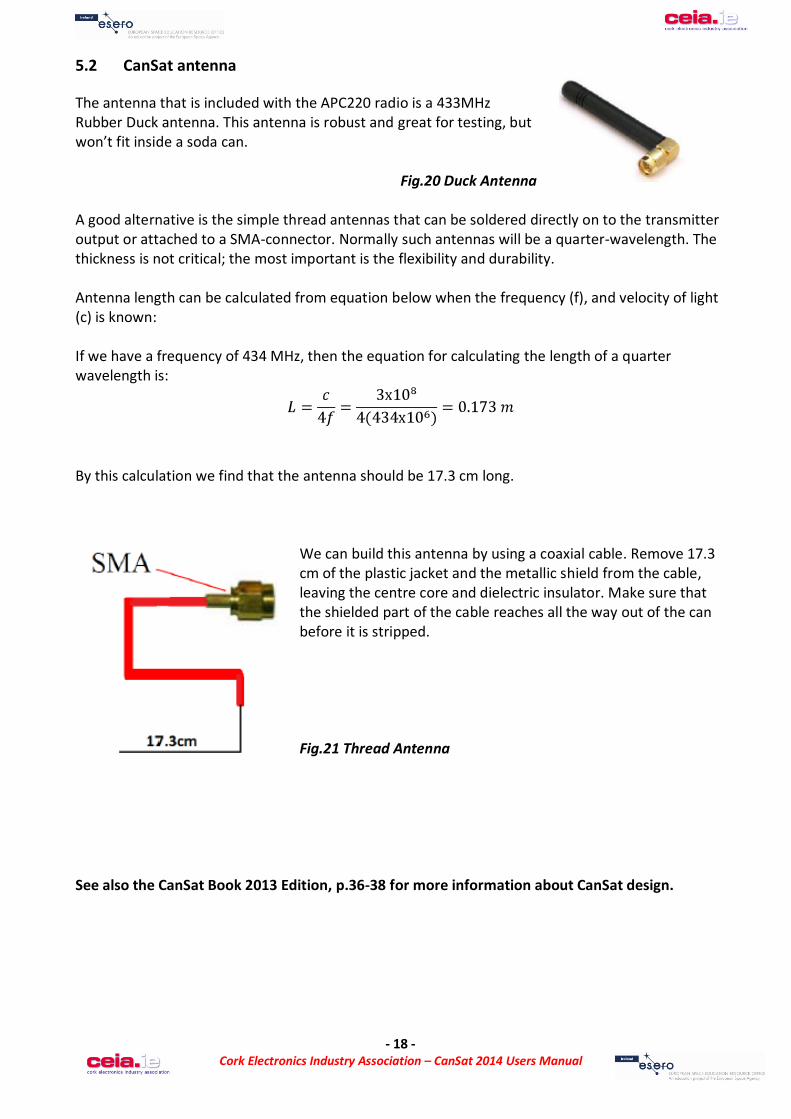
5.2 CanSat antenna
The antenna that is included with the APC220 radio is a 433MHz Rubber Duck antenna. This antenna is robust and great for testing, but won’t fit inside a soda can.
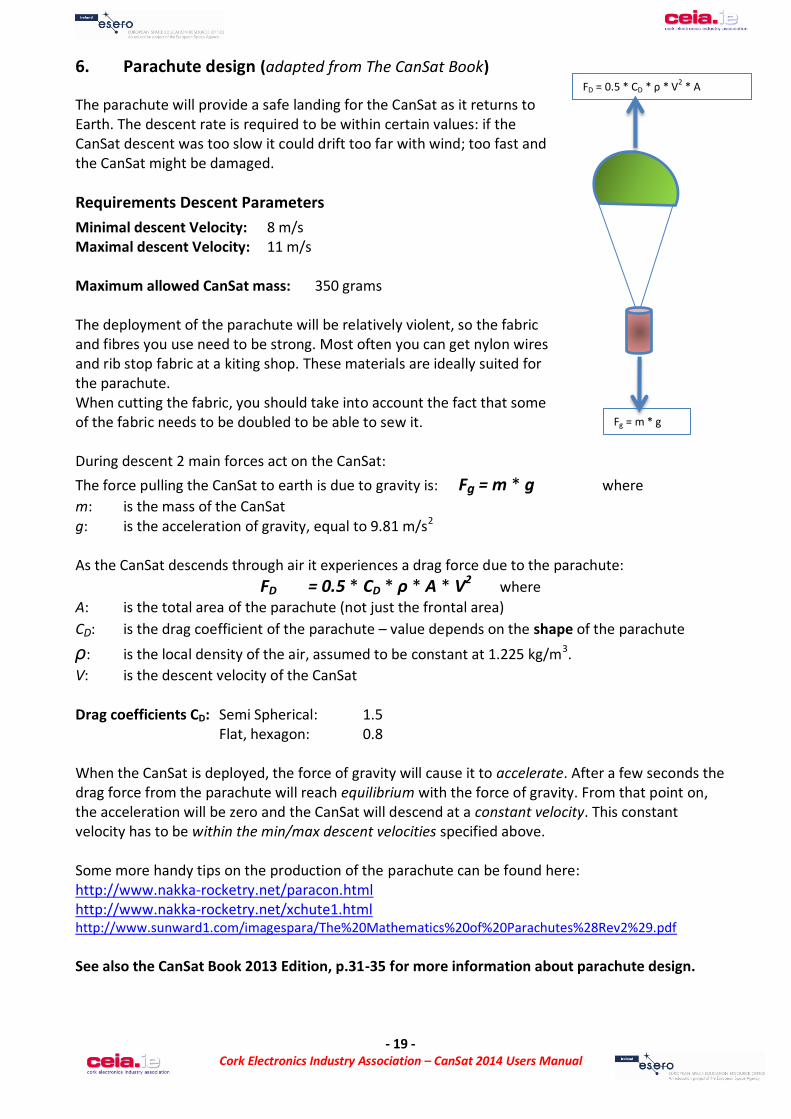
Fig.20 Duck Antenna A good alternative is the simple thread antennas that can be soldered directly on to the transmitter output or attached to a SMA-connector. Normally such antennas will be a quarter-wavelength. The thickness is not critical; the most important is the flexibility and durability. Antenna length can be calculated from equation below when the frequency (f), and velocity of light (c) is known: If we have a frequency of 434 MHz, then the equation for calculating the length of a quarter wavelength is:
By this calculation we find that the antenna should be 17.3 cm long.
We can build this antenna by using a coaxial cable. Remove 17.3 cm of the plastic jacket and the metallic shield from the cable, leaving the centre core and dielectric insulator. Make sure that the shielded part of the cable reaches all the way out of the can before it is stripped. Fig.21 Thread Antenna
See also the CanSat Book 2013 Edition, p.36-38 for more information about CanSat design.
- 19 - Cork Electronics Industry Association – CanSat 2014 Users Manual
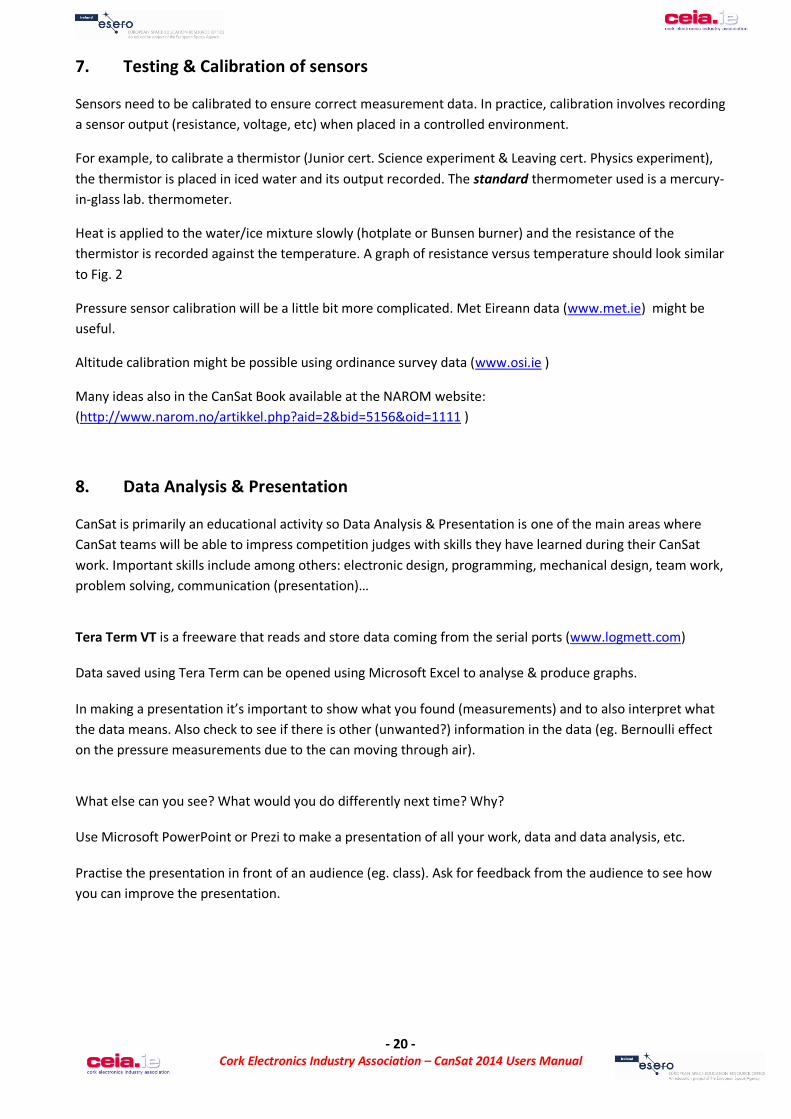
6. Parachute design (adapted from The CanSat Book)
The parachute will provide a safe landing for the CanSat as it returns to Earth. The descent rate is required to be within certain values: if the CanSat descent was too slow it could drift too far with wind; too fast and the CanSat might be damaged. Requirements Descent Parameters Minimal descent Velocity: 8 m/s Maximal descent Velocity: 11 m/s Maximum allowed CanSat mass: 350 grams The deployment of the parachute will be relatively violent, so the fabric and fibres you use need to be strong. Most often you can get nylon wires and rib stop fabric at a kiting shop. These materials are ideally suited for the parachute. When cutting the fabric, you should take into account the fact that some of the fabric needs to be doubled to be able to sew it. During descent 2 main forces act on the CanSat: The force pulling the CanSat to earth is due to gravity is: Fg = m * g where m: is the mass of the CanSat g: is the acceleration of gravity, equal to 9.81 m/s2 As the CanSat descends through air it experiences a drag force due to the parachute:
FD = 0.5 * CD * ρ * A * V2 where A: is the total area of the parachute (not just the frontal area) CD: is the drag coefficient of the parachute – value depends on the shape of the parachute ρ: is the local density of the air, assumed to be constant at 1.225 kg/m3. V: is the descent velocity of the CanSat Drag coefficients CD: Semi Spherical: 1.5 Flat, hexagon: 0.8 When the CanSat is deployed, the force of gravity will cause it to accelerate. After a few seconds the drag force from the parachute will reach equilibrium with the force of gravity. From that point on, the acceleration will be zero and the CanSat will descend at a constant velocity. This constant velocity has to be within the min/max descent velocities specified above. Some more handy tips on the production of the parachute can be found here: http://www.nakka-rocketry.net/paracon.html http://www.nakka-rocketry.net/xchute1.html http://www.sunward1.com/imagespara/The%20Mathematics%20of%20Parachutes%28Rev2%29.pdf See also the CanSat Book 2013 Edition, p.31-35 for more information about parachute design.
FD = 0.5 * CD * ρ * V2 * A
Fg = m * g
- 20 - Cork Electronics Industry Association – CanSat 2014 Users Manual
7. Testing & Calibration of sensors
Sensors need to be calibrated to ensure correct measurement data. In practice, calibration involves recording a sensor output (resistance, voltage, etc) when placed in a controlled environment.
For example, to calibrate a thermistor (Junior cert. Science experiment & Leaving cert. Physics experiment), the thermistor is placed in iced water and its output recorded. The standard thermometer used is a mercury-in-glass lab. thermometer.
Heat is applied to the water/ice mixture slowly (hotplate or Bunsen burner) and the resistance of the thermistor is recorded against the temperature. A graph of resistance versus temperature should look similar to Fig. 2
Pressure sensor calibration will be a little bit more complicated. Met Eireann data (www.met.ie) might be useful.
Altitude calibration might be possible using ordinance survey data (www.osi.ie )
Many ideas also in the CanSat Book available at the NAROM website: (http://www.narom.no/artikkel.php?aid=2&bid=5156&oid=1111 )
8. Data Analysis & Presentation
CanSat is primarily an educational activity so Data Analysis & Presentation is one of the main areas where CanSat teams will be able to impress competition judges with skills they have learned during their CanSat work. Important skills include among others: electronic design, programming, mechanical design, team work, problem solving, communication (presentation)…
Tera Term VT is a freeware that reads and store data coming from the serial ports (www.logmett.com) Data saved using Tera Term can be opened using Microsoft Excel to analyse & produce graphs. In making a presentation it’s important to show what you found (measurements) and to also interpret what the data means. Also check to see if there is other (unwanted?) information in the data (eg. Bernoulli effect on the pressure measurements due to the can moving through air).
What else can you see? What would you do differently next time? Why? Use Microsoft PowerPoint or Prezi to make a presentation of all your work, data and data analysis, etc. Practise the presentation in front of an audience (eg. class). Ask for feedback from the audience to see how you can improve the presentation.
- 21 - Cork Electronics Industry Association – CanSat 2014 Users Manual
9. Outreach & Communications
As well as making publicity for your CanSat team, communicating your CanSat work/progress to the public will be very useful in making the final presentation. Some tips include:
Take photos regularly to record your progress.
Keep a logbook – enter everything here (it doesn’t have to be really neat, just useful/readable).
Set up a Facebook page to document your CanSat activities.
Write articles for local/national papers etc.
Check previous CanSat winning projects
10. Arduino & CanSat resources
There are many internet resources available for Arduino & CanSat. A few really useful links are:
www.arduino.cc
www.element14.com
www.cansat.eu
www.narom.no - check English version of site; download CanSat Book 2013 Edition from here
www.engineeringtoolbox.com
11. Secondary Mission ideas
The secondary mission is open to your imagination, scientific understanding and engineering skills. Some ideas from past secondary missions are:
Determine exact CanSat position using accelerometer and/or GPS module
Land CanSat at pre-determined location – difficult; requires 2-way communication to steer CanSat
Deploy an experiment outside the CanSat – eg. monitor CO2 concentration during descent
Take videos when descending
Generate power when descending
A lot of information on satellites missions can be found on the internet. Try and see what ESA is doing at the moment, or NASA. Search on the website of Arduino (www.arduino.cc/) to see what would be possible.
- 22 - Cork Electronics Industry Association – CanSat 2014 Users Manual
Appendix 1 – Getting started with Arduino
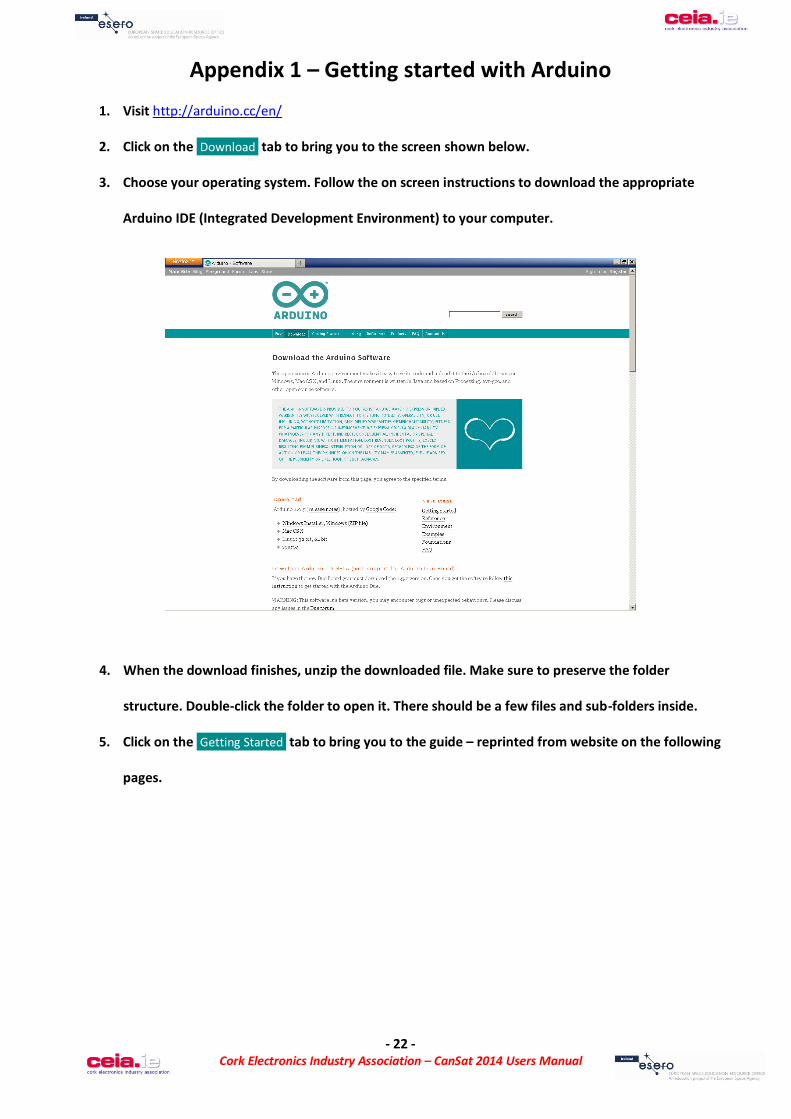
1. Visit http://arduino.cc/en/
2. Click on the Download tab to bring you to the screen shown below.
3. Choose your operating system. Follow the on screen instructions to download the appropriate
Arduino IDE (Integrated Development Environment) to your computer.
4. When the download finishes, unzip the downloaded file. Make sure to preserve the folder
structure. Double-click the folder to open it. There should be a few files and sub-folders inside.
5. Click on the Getting Started tab to bring you to the guide – reprinted from website on the following
pages.
- 23 - Cork Electronics Industry Association – CanSat 2014 Users Manual
Document below copied from http://arduino.cc/en/ website. Licensed to copy under terms at: http://creativecommons.org/licenses/by-sa/3.0/
Getting Started w/ Arduino on Windows
1 | Get an Arduino UNO board and USB cable
You’ll need a standard USB cable (A plug to B plug): the kind you would connect to a USB printer, for example. (For the Arduino Nano, you'll need an A to Mini-B cable instead.)
2 | Connect the board
Connect the Arduino to your computer using the USB cable. The green power LED (labelled PWR) should go on.
3 | Install the drivers
Installing drivers for the Arduino Uno or Arduino Mega 2560 with Windows7, Vista, or XP:
Plug in your board and wait for Windows to begin it's driver installation process. After a few moments, the process will fail, despite its best efforts
Click on the Start Menu, and open up the Control Panel. While in the Control Panel, navigate to System and Security. Next, click on System. Once the
System window is up, open the Device Manager. Look under Ports (COM & LPT). You should see an open port named "Arduino UNO
(COMxx)" Right click on the "Arduino UNO (COmxx)" port and choose the "Update Driver Software"
option. Next, choose the "Browse my computer for Driver software" option. Finally, navigate to and select the driver file named "arduino.inf", located in the "Drivers"
folder of the Arduino Software download (not the "FTDI USB Drivers" sub-directory). If you are using an old version of the IDE (1.0.3 or older), choose the Uno's driver file named "Arduino UNO.inf"
Windows will finish up the driver installation from there.
See also: step-by-step screenshots for installing the Uno under Windows XP.
4 | Launch the Arduino application
Double-click the Arduino application. (Note: if the Arduino software loads in the wrong language, you can change it in the preferences dialog. See the environment page for details.)
5 | Open the blink example
- 24 - Cork Electronics Industry Association – CanSat 2014 Users Manual
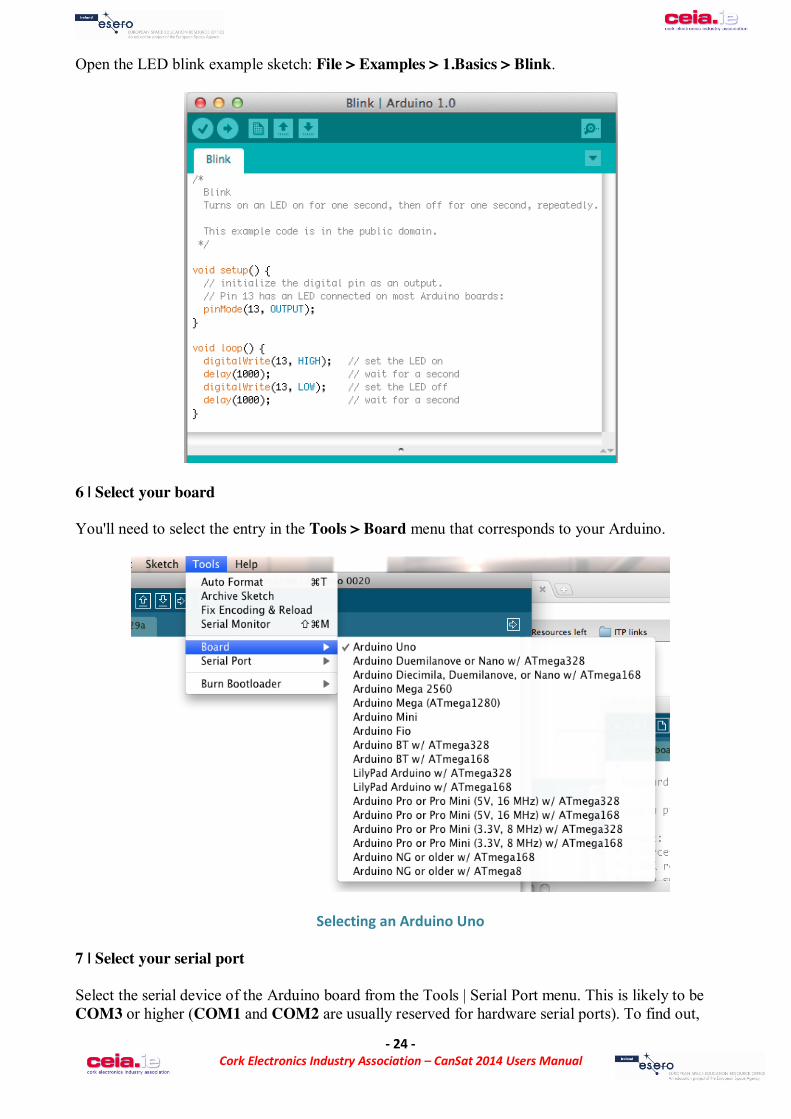
Open the LED blink example sketch: File > Examples > 1.Basics > Blink.
6 | Select your board
You'll need to select the entry in the Tools > Board menu that corresponds to your Arduino.
Selecting an Arduino Uno
7 | Select your serial port
Select the serial device of the Arduino board from the Tools | Serial Port menu. This is likely to be COM3 or higher (COM1 and COM2 are usually reserved for hardware serial ports). To find out,

- 25 - Cork Electronics Industry Association – CanSat 2014 Users Manual
you can disconnect your Arduino board and re-open the menu; the entry that disappears should be the Arduino board. Reconnect the board and select that serial port.
8 | Upload the program
Now, simply click the "Upload" button in the environment. Wait a few seconds - you should see the RX and TX leds on the board flashing. If the upload is successful, the message "Done uploading." will appear in the status bar. (Note: If you have an Arduino Mini, NG, or other board, you'll need to physically present the reset button on the board immediately before pressing the upload button.)
A few seconds after the upload finishes, you should see the pin 13 (L) LED on the board start to blink (in orange). If it does, congratulations! You've gotten Arduino up-and-running.
If you have problems, please see the troubleshooting suggestions.
The text of this Arduino getting started guide is licensed under a Creative Commons Attribution-ShareAlike 3.0 License (http://creativecommons.org/licenses/by-sa/3.0/) Code samples in the guide are released into the public domain.
- 26 - Cork Electronics Industry Association – CanSat 2014 Users Manual
Appendix 2 – Thermistor data sheet
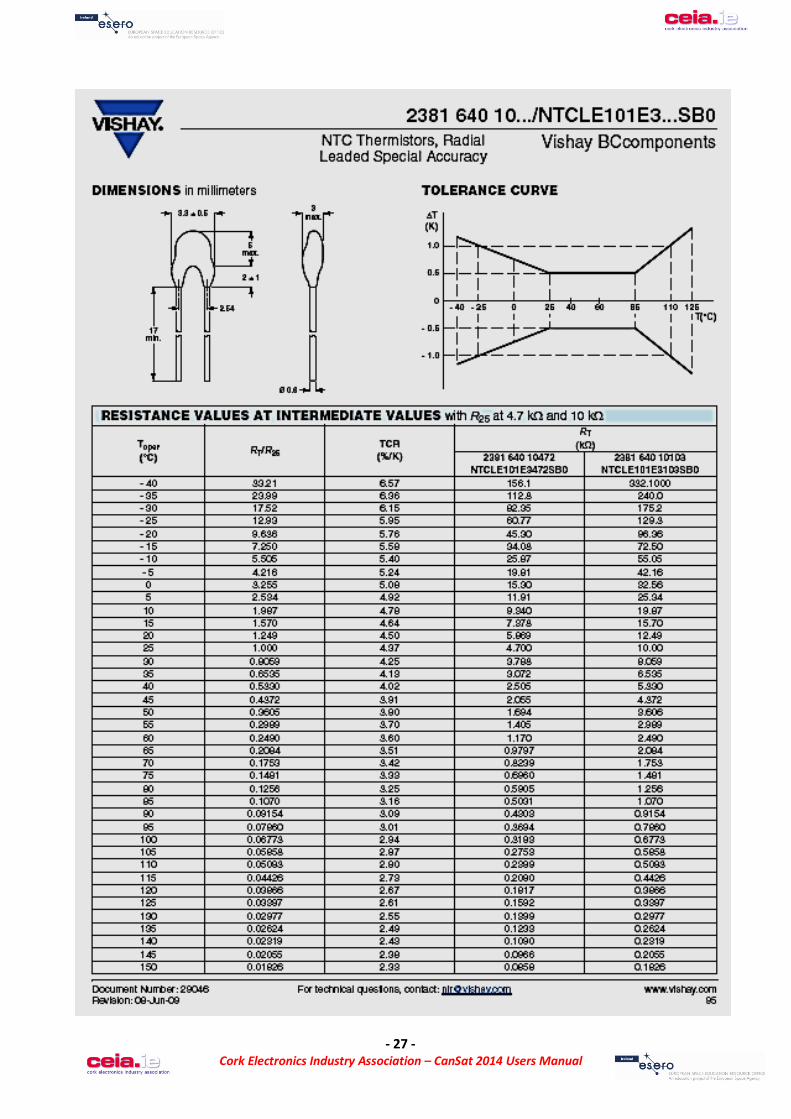
- 27 - Cork Electronics Industry Association – CanSat 2014 Users Manual
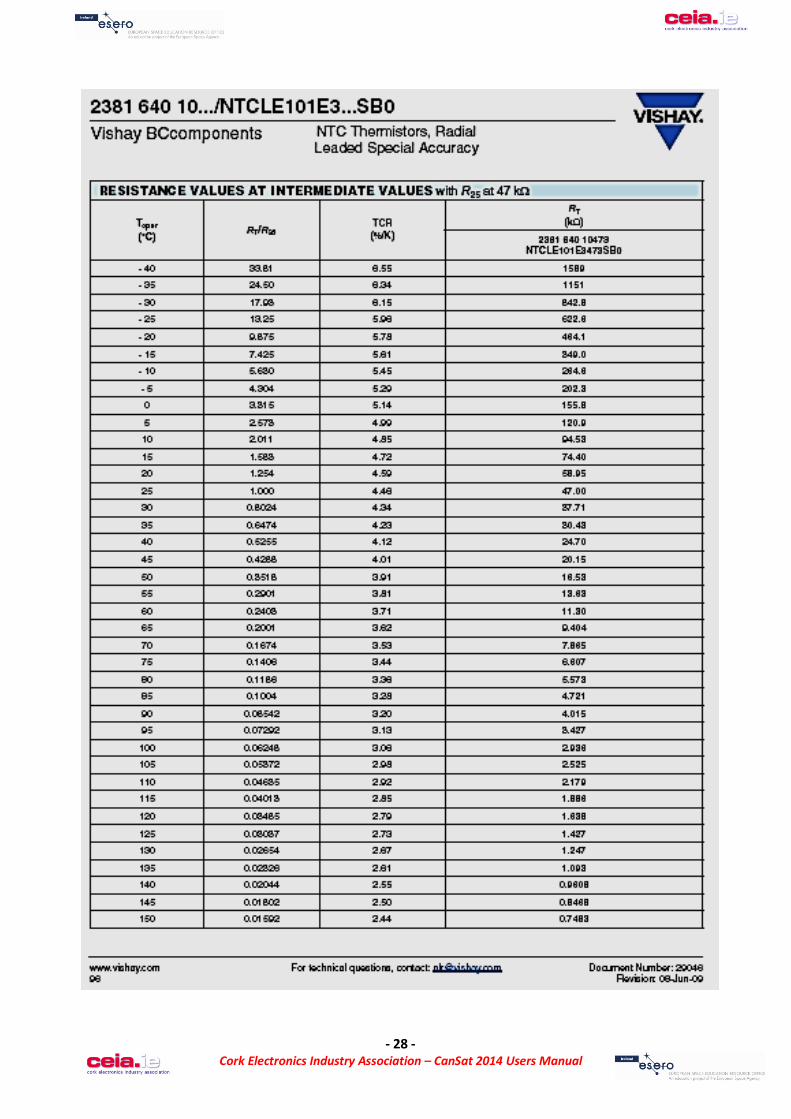
- 28 - Cork Electronics Industry Association – CanSat 2014 Users Manual
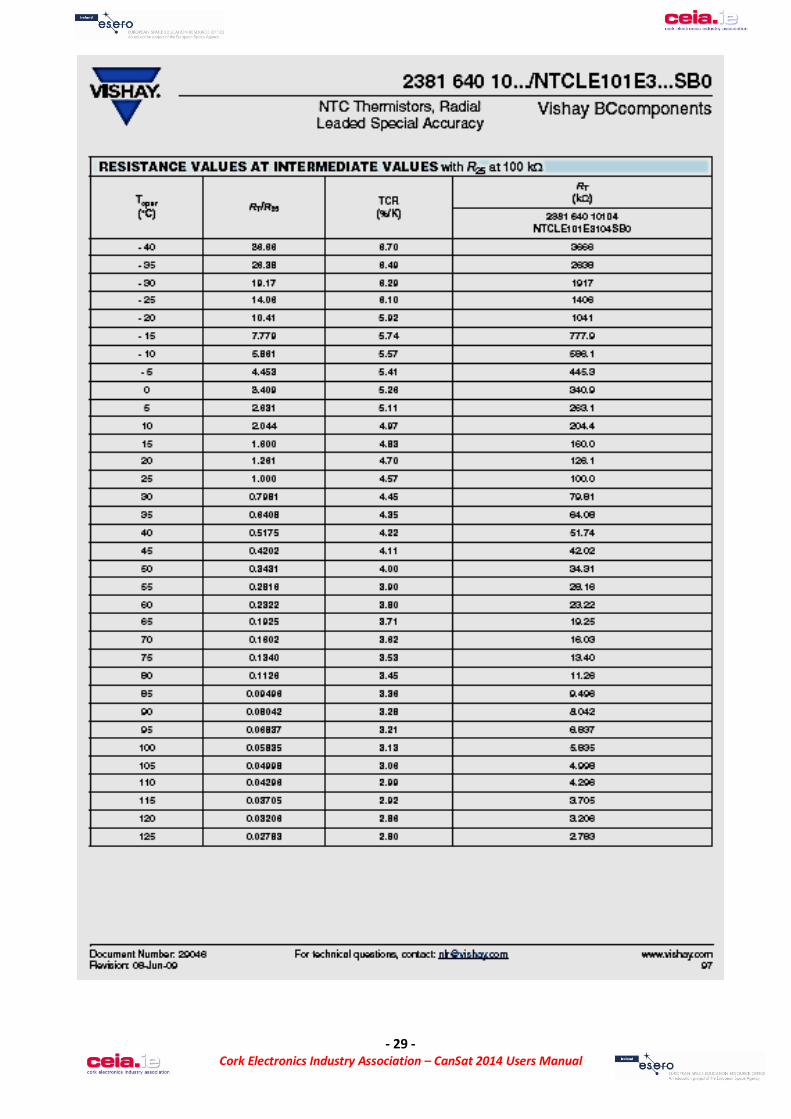
- 29 - Cork Electronics Industry Association – CanSat 2014 Users Manual
- 30 - Cork Electronics Industry Association – CanSat 2014 Users Manual
- 31 - Cork Electronics Industry Association – CanSat 2014 Users Manual
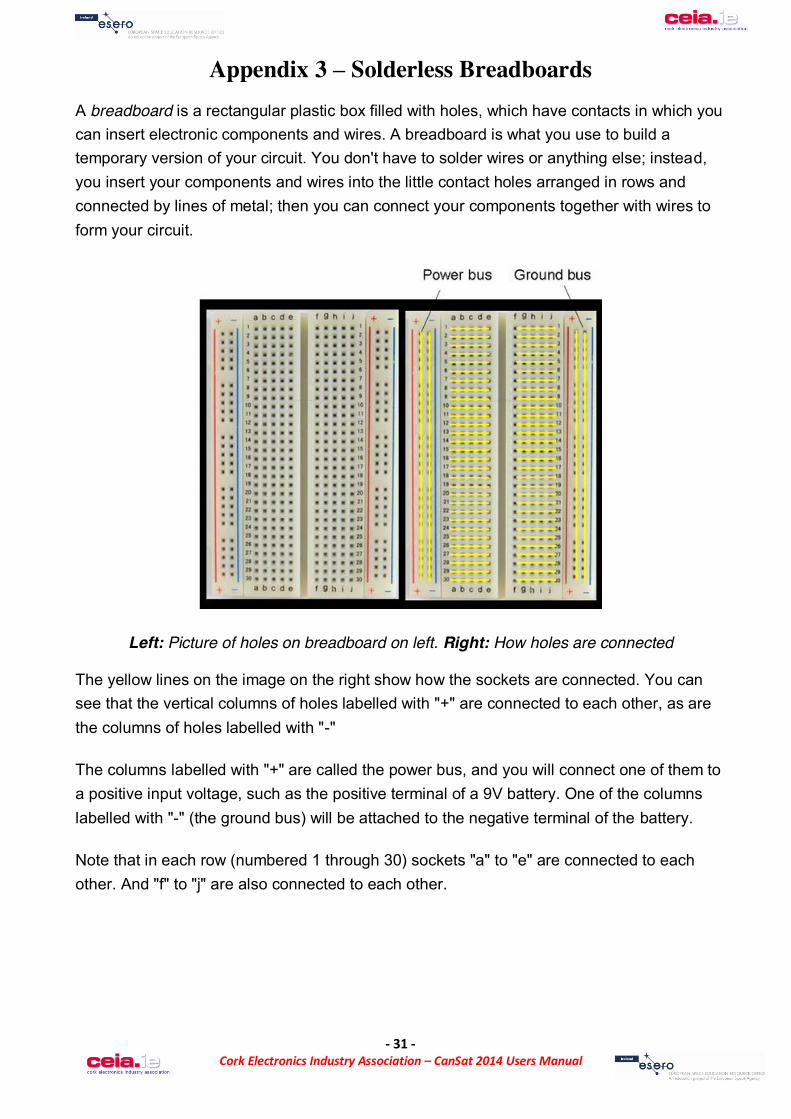
Appendix 3 – Solderless Breadboards A breadboard is a rectangular plastic box filled with holes, which have contacts in which you can insert electronic components and wires. A breadboard is what you use to build a temporary version of your circuit. You don't have to solder wires or anything else; instead, you insert your components and wires into the little contact holes arranged in rows and connected by lines of metal; then you can connect your components together with wires to form your circuit.
Left: Picture of holes on breadboard on left. Right: How holes are connected
The yellow lines on the image on the right show how the sockets are connected. You can see that the vertical columns of holes labelled with "+" are connected to each other, as are the columns of holes labelled with "-"
The columns labelled with "+" are called the power bus, and you will connect one of them to a positive input voltage, such as the positive terminal of a 9V battery. One of the columns labelled with "-" (the ground bus) will be attached to the negative terminal of the battery.
Note that in each row (numbered 1 through 30) sockets "a" to "e" are connected to each other. And "f" to "j" are also connected to each other.
- 32 - Cork Electronics Industry Association – CanSat 2014 Users Manual
Appendix 4 – MPX4115 Pressure sensor data sheet
- 33 - Cork Electronics Industry Association – CanSat 2014 Users Manual
- 34 - Cork Electronics Industry Association – CanSat 2014 Users Manual

- 35 - Cork Electronics Industry Association – CanSat 2014 Users Manual
- 36 - Cork Electronics Industry Association – CanSat 2014 Users Manual
- 37 - Cork Electronics Industry Association – CanSat 2014 Users Manual
- 38 - Cork Electronics Industry Association – CanSat 2014 Users Manual
- 39 - Cork Electronics Industry Association – CanSat 2014 Users Manual

- 40 - Cork Electronics Industry Association – CanSat 2014 Users Manual
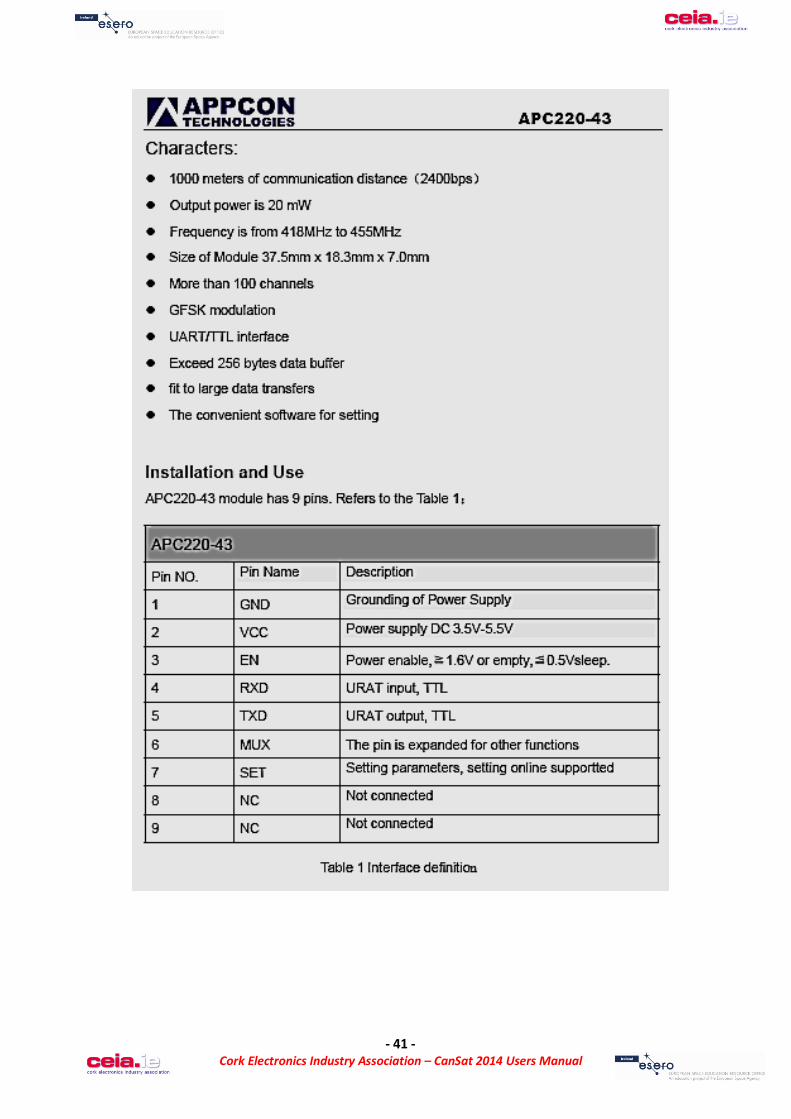
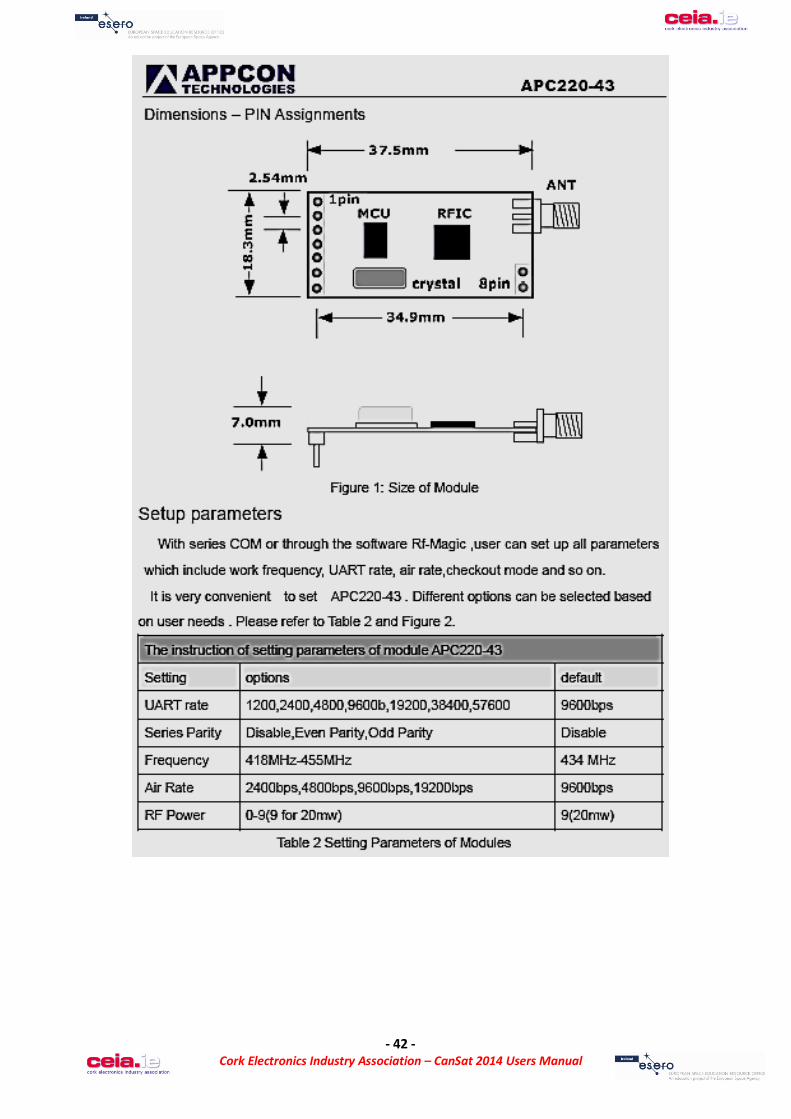
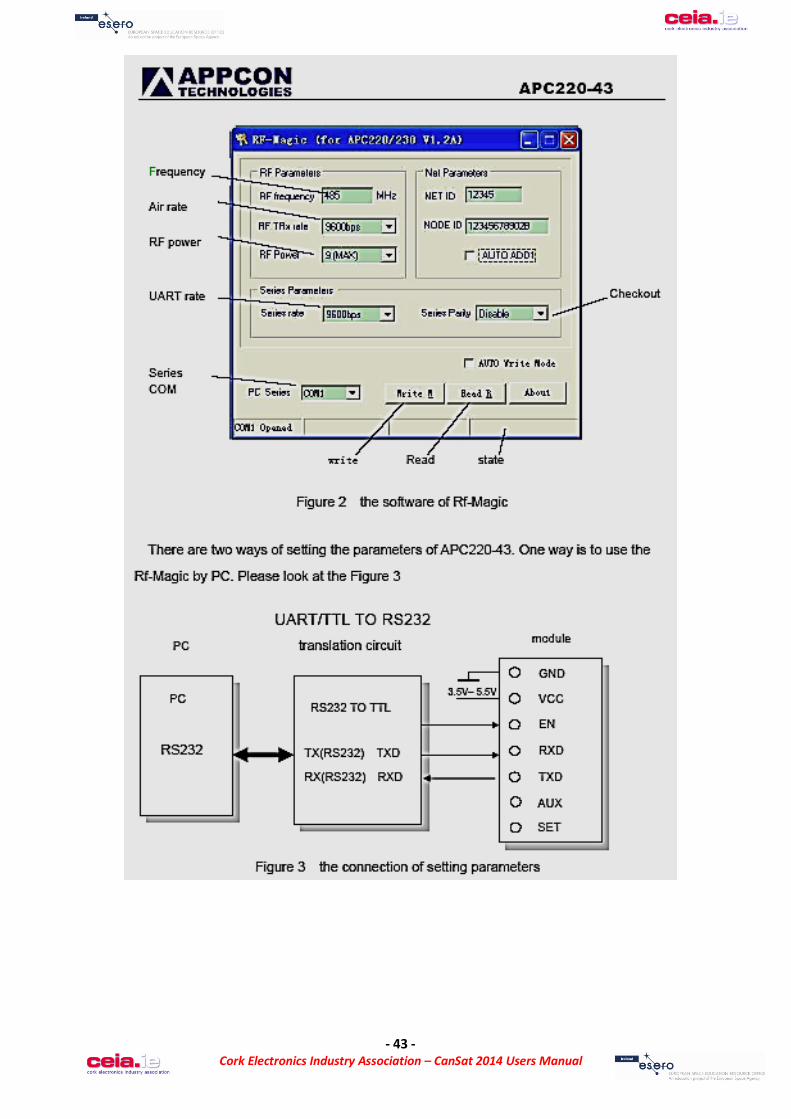
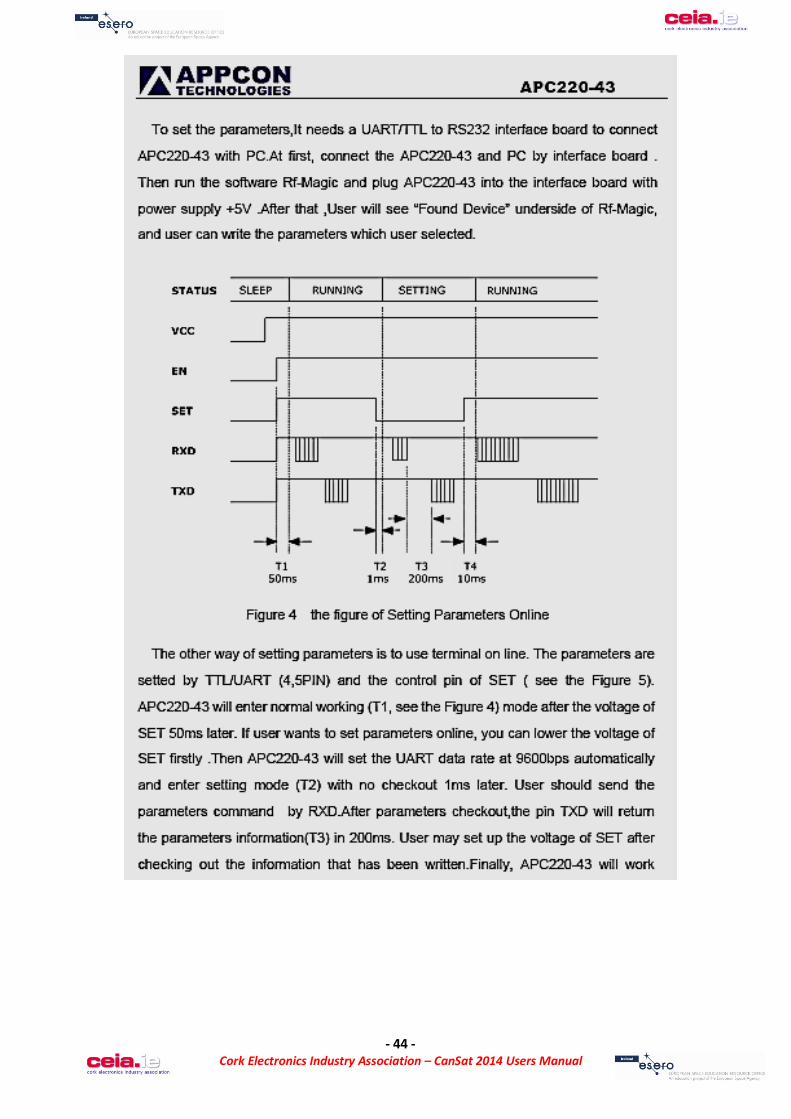
Appendix 5 – APC220 wireless telemetry data sheet
- 41 - Cork Electronics Industry Association – CanSat 2014 Users Manual
- 42 - Cork Electronics Industry Association – CanSat 2014 Users Manual
- 43 - Cork Electronics Industry Association – CanSat 2014 Users Manual
- 44 - Cork Electronics Industry Association – CanSat 2014 Users Manual
- 45 - Cork Electronics Industry Association – CanSat 2014 Users Manual
- 46 - Cork Electronics Industry Association – CanSat 2014 Users Manual
- 47 - Cork Electronics Industry Association – CanSat 2014 Users Manual
- 48 - Cork Electronics Industry Association – CanSat 2014 Users Manual
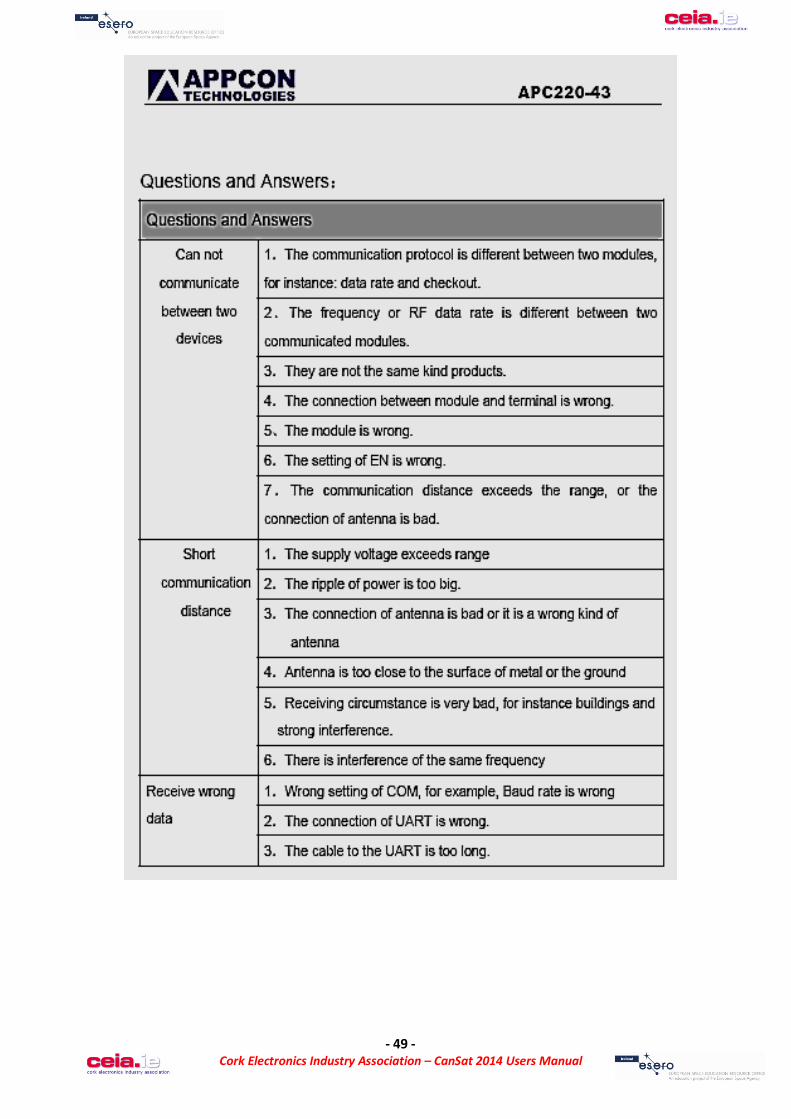
- 49 - Cork Electronics Industry Association – CanSat 2014 Users Manual

- 50 - Cork Electronics Industry Association – CanSat 2014 Users Manual
- 51 - Cork Electronics Industry Association – CanSat 2014 Users Manual
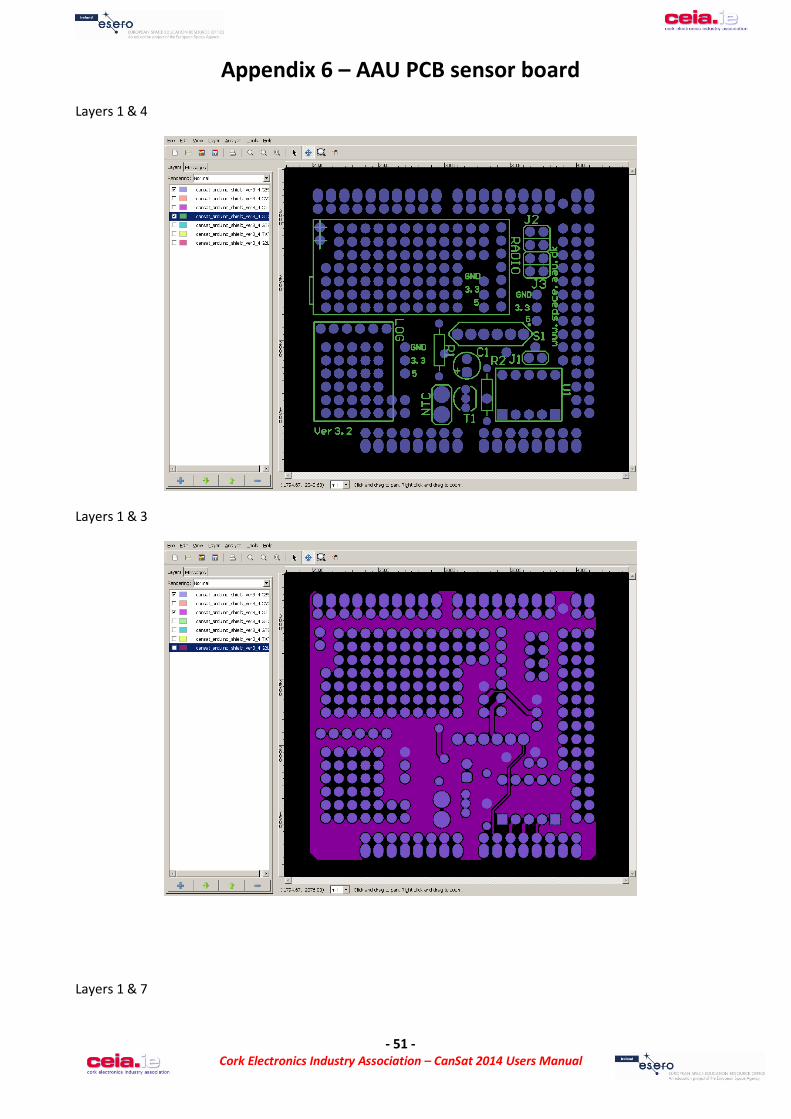
Appendix 6 – AAU PCB sensor board
Layers 1 & 4
Layers 1 & 3
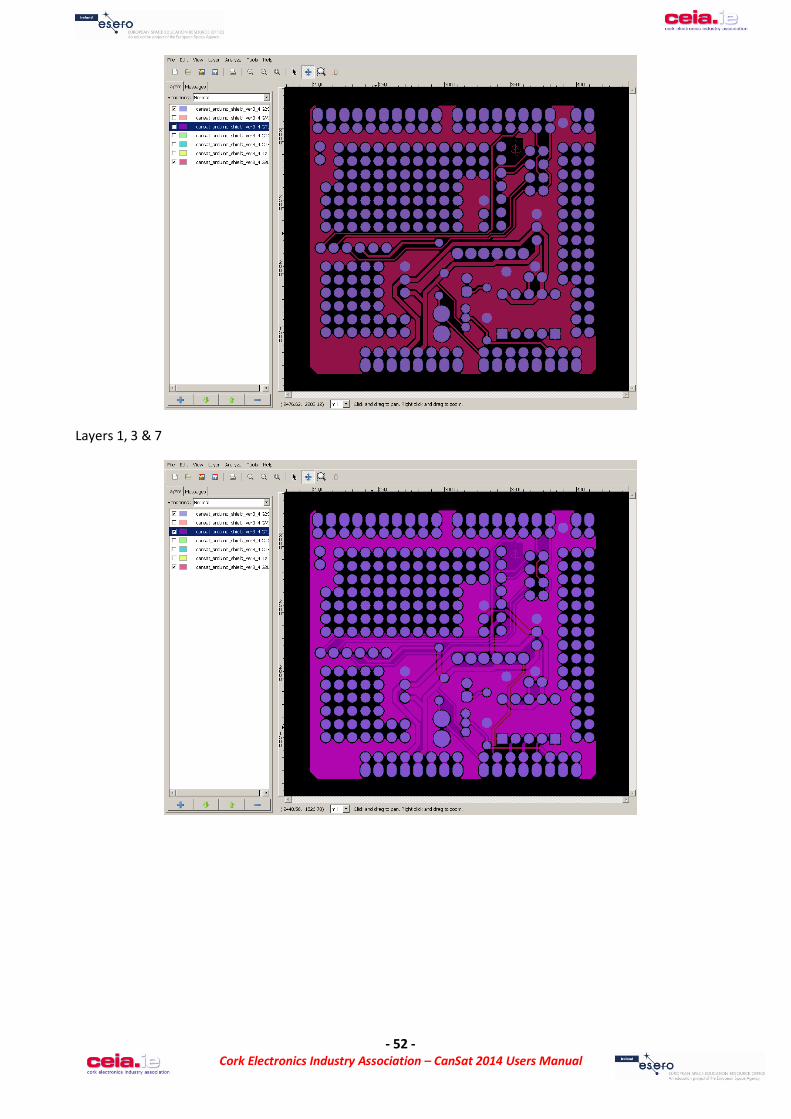
Layers 1 & 7
- 52 - Cork Electronics Industry Association – CanSat 2014 Users Manual
Layers 1, 3 & 7