coring and compaction: best practice in blue carbon stock
TRANSCRIPT

This is a repository copy of Coring and compaction: Best practice in blue carbon stock andburial estimations.
White Rose Research Online URL for this paper:http://eprints.whiterose.ac.uk/155877/
Version: Accepted Version
Article:
Smeaton, C, Barlow, NLM orcid.org/0000-0002-2713-2543 and Austin, WEN (2020) Coringand compaction: Best practice in blue carbon stock and burial estimations. Geoderma, 364. 114180. ISSN 0016-7061
https://doi.org/10.1016/j.geoderma.2020.114180
© 2020 Elsevier B.V. All rights reserved. This manuscript version is made available under the CC-BY-NC-ND 4.0 license http://creativecommons.org/licenses/by-nc-nd/4.0/.
[email protected]://eprints.whiterose.ac.uk/
Reuse
This article is distributed under the terms of the Creative Commons Attribution-NonCommercial-NoDerivs (CC BY-NC-ND) licence. This licence only allows you to download this work and share it with others as long as you credit the authors, but you can’t change the article in any way or use it commercially. More information and the full terms of the licence here: https://creativecommons.org/licenses/
Takedown
If you consider content in White Rose Research Online to be in breach of UK law, please notify us by emailing [email protected] including the URL of the record and the reason for the withdrawal request.

1
Coring and Compaction: Best Practice in Blue Carbon Stock and 1
Burial Estimations 2
Craig Smeaton1*, Natasha L.M. Barlow2 and William E.N. Austin1,3 3
4
1 School of Geography & Sustainable Development, University of St Andrews, St Andrews, 5
KY16 9AL, UK 6
2 School of Earth and Environment, University of Leeds, Leeds, LS2 9JT, UK 7
3 Scottish Association for Marine Science, Scottish Marine Institute, Oban, PA37 1QA, UK 8
9
Corresponding Author: Craig Smeaton ([email protected]) 10
Abstract 11
A comparison of gouge and hammer coring techniques in intertidal wetland soils highlights a 12
significant effect of soil compaction of up to 28% associated with the widely applied hammer 13
coring method employed in Blue Carbon research. Hammer coring reduces the thickness of the 14
soil profile and increases the dry bulk density, which results in an overestimation of the soil 15
OC stock of up to 22%. In saltmarshes with multiple different soil units, we show that hammer 16
coring is unsuitable for the calculation of OC stocks and should be avoided in favour of Russian 17
or gouge cores. Compaction changes both soil dry bulk density and porosity and we show that 18
resultant radiometric chronologies are compromised, almost doubling mass accumulation rates. 19
While we show that the OC (%) content of these sediments is largely unchanged by coring 20
method, the implication for OC burial rates are profound because of the significant effect of 21
hammer coring on soil mass accumulation rates. 22

2
Highlights 23
Hammer coring causes soil compaction of up to 28% in saltmarsh soils. 24
Hammer coring is unsuitable for the calculation of OC stocks in saltmarsh soils. 25
Compaction due to hammer coring almost doubles calculated mass accumulation 26
rates. 27
Hammer coring artificially elevates calculated OC burial rates. 28
29
Keywords: Sediment, Coring; Compaction, Carbon; Intertidal; Saltmarsh; 30
31
32
33
34
35
36
37
38
39
40
41
42
43

3
1. Introduction 44
Carbon (C) buried and stored in costal ecosystems (saltmarsh, seagrass and mangroves) is 45
known as blue carbon (Nellemann et al., 2009). In the last decade blue carbon habitats have 46
risen in prominence and are increasingly recognised as potentially valuable nature-based 47
solutions to help reduce atmospheric CO2 and mitigate climate change (Duarte et al., 2013, 48
Mcleod et al., 2011, Pendelton et al., 2012, Rogers et al., 2019). Underpinning this 49
understanding is a wealth of research largely focused on calculating both the quantity of 50
organic carbon (OC) stored and the rate at which this OC is buried in coastal ecosystems. The 51
foundation of these estimates is the collection and measurement of soil samples, normally 52
through sediment coring. Across the body of published blue carbon research different coring 53
approaches are adopted, generally falling into two categories: (i) palaeo-environmental 54
methods which often employ Russian and gouge corers (Frew, 2014; Glew et al., 2002), and 55
(ii) low cost, often disposable hammer/impact/piston techniques, where plastic piping is 56
hammered into the soil (e.g. Howard et al., 2014). 57
Russian and gouge corers have long histories of use across a variety of applications including 58
peatland research, sea-level reconstructions, as well as blue carbon research (van Ardenne et 59
al, 2018, Wollenberg et al., 2018). The low-cost hammer approach is almost exclusively used 60
for blue carbon research, but generally not used in palaeo-environmental research. Initially, the 61
hammer coring technique was used to sample seagrass soils; these soils are often submerged 62
and sandy in nature making them difficult to core using other sampling methods (Macreadie et 63
al., 2015, Serrano et al., 2018). However, in recent years the use of this approach has also been 64
gaining popularity in saltmarsh and mangrove ecosystems (Kelleway et al., 2016a, Macreadie 65
et al., 2013, Unger et al., 2016). 66

4
Gouge coring is minimally invasive and causes little disturbance to the soil; it largely avoids 67
compacting the soil, where soil compaction is more widely recognised as a significant problem 68
in achieving successful paleo-environmental reconstructions (Brain, 2016, Brain et al., 2017, 69
Edwards, 2006). Within blue carbon research, a number of studies acknowledge that hammer 70
coring causes compaction (Ewers Lewis et al., 2019, Kelleway et al., 2016a, b) but this 71
recognition is not universal. Where compaction is recognized during the coring procedure, a 72
simple linear correction, where the length of the soil core is divided by the sampling depth is 73
often applied (Ewers Lewis et al., 2019, Kelleway et al., 2016a, b). Compaction of the soils 74
increases the bulk density, decreases the porosity and dewaters the soil (Archer and Smith, 75
1972, Håkansson and Lipiec, 2000). Additionally, the loss of water may potentially flush 76
soluble and porewater OC from the soil, all of which will have a bearing on the OC stock and 77
burial estimates; it is therefore unlikely that simple linear corrections address this complexity. 78
The widespread use of these different coring methods in saltmarshes raise questions about their 79
direct impact on any subsequent calculation of OC stock and burial rate. In this study, we 80
explore two of the most commonly employed coring techniques (gouge and hammer) to 81
determine how each method influences the recovered soil (i.e. physical properties, compaction) 82
and how, in turn, this alters the OC stock and burial estimates in a temperate saltmarsh. 83
2. Study Site 84
The Kyle of Tongue saltmarsh is one of the most northerly marshes found on the UK mainland 85
(Fig.1). The marsh is situated at the head of the Kyle of Tongue (an infilled fjord), and as such 86
is categorised as a loch-head marsh; a classification unique to Scotland in a UK context 87
(Haynes, 2016). The marsh occupies an area of 9.31 ha with the majority of that being high-88
mid marsh (9.08 ha) with only 0.23 ha considered low marsh (Fig.1) as characterised by 89
vegetation communities and elevation (Haynes, 2016). The vegetation coverage of the marsh 90

5
is dominated by Carex flacca, Filipendulo-Iridetum pseudacori, Puccinellia-turf fucoid and 91
stunted forms of Phragmites australis. As with the loch-head marsh type, this vegetation 92
community is only found on the marshes of western and northern Scotland (Adam, 1978, Burd, 93
1989, Haynes, 2016). 94
95
Figure.1 Location map detailing (a) the site in context of Scotland and (b) Ordnance Survey Map 96
detailing the location of the saltmarsh in relation to the Kyle of Tongue with the high (orange) and low 97
marsh (purple) highlighted (Haynes, 2016). (c) A regional overview. (d) Sampling locations across the 98
marsh environments (© Crown copyright and database rights [2019] Ordnance Survey (100025252). 99
3. Methods 100
3.1 Coring 101
Dual coring (gouge and hammer) was undertaken at four sites on the Kyle of Tongue saltmarsh 102
in November 2018. Three of the core sites were situated along a transect perpendicular to the 103
shoreline, while a fourth site was located on a protruding raised platform to the west of the 104
saltmarsh (Fig.1d). Gouge and hammer cores were collected at each site; the gouge cores were 105
collected first to ensure minimal disturbance of the soils prior to collection of the hammer cores. 106

6
The gouge cores were collected using a 1m fixed length core barrel with a 3 cm diameter. The 107
corer was manually pushed into the soil to the point of refusal, rotated and removed. Before 108
removal, the degree of compaction was assessed by measuring the soil surface within the core 109
tube relative to the height of the outer marsh surface; the difference between the measurements 110
was used to calculate compaction (Kelleway et al., 2016b). On site, the core face was cleaned 111
with a sharp knife, photographed and the soil profile described using the Tröels-Smith, (1955) 112
classification scheme for unconsolidated sediments. Once described, fixed volume (4 cm3) 113
samples were collected every 10 cm along the length of the core. The location and elevation of 114
the core was recorded using DGPS. 115
Adjacent hammer cores were collected 25 cm from the gouge core locations; each new location 116
was recorded with DGPS. The core tube consisted of 150 cm lengths of polyvinyl chloride 117
(PVC) piping with a 6.16 cm inner-diameter and a wall thickness of 0.24 cm. The PVC pipe 118
was enhanced with a sharpened bevelled edge to allow more efficient cutting of root material 119
during the insertion of the core tube into the soil. Core tubes were manually hammered into the 120
soil to a depth of 100 cm below the external soil surface. The top of the core was sealed to 121
create a vacuum and the core was pulled out of the soil using a tractor jack. Total compaction 122
was measured in the field by comparing the external and internal elevation of the marsh surface 123
recorded from outside and inside the core tube. The top end of the core was plugged with foam, 124
while both ends were capped and sealed with tape to prevent disturbance during transport. 125
Cores were stored at 4°C in a cold room at the University of St Andrews until processing. 126
127
3.2 Laboratory Analysis 128
3.2.1 Physical Properties 129
The hammer cores were cut lengthways and split into working and archive sections; the soils 130
were described using the Tröels-Smith (1955) classification scheme. The distance between the 131

7
core top within the liner was compared to the ground level marked on the linear in the field 132
allowing the total compaction of the core to be determined and assure no additional compaction 133
or expansion has taken place post collection. Fixed volumetric samples (4 cm3) were extracted 134
at 10 cm intervals throughout the length of the core using a fixed volume sampler (syringe). 135
Sub-samples from both the gouge and hammer cores were weighed before and after drying at 136
50°C for 48 hrs. This data allowed wet bulk density (WBD), dry bulk density (DBD), porosity 137
and water content to be calculated following the standard methodologies (Athy, 1930, Appleby 138
and Oldfield, 1978, Dadey et al., 1992): 139
𝑊𝑒𝑡 𝐵𝑢𝑙𝑘 𝐷𝑒𝑛𝑠𝑖𝑡𝑦 (𝑔 𝑐𝑚−3) = 𝑊𝑒𝑡 𝑀𝑎𝑠𝑠 (𝑔)𝑊𝑒𝑡 𝑆𝑎𝑚𝑝𝑙𝑒 𝑉𝑜𝑙𝑢𝑚𝑒 (𝑐𝑚3) (1) 140 𝐷𝑟𝑦 𝐵𝑢𝑙𝑘 𝐷𝑒𝑛𝑠𝑖𝑡𝑦 (𝑔 𝑐𝑚−3) = 𝐷𝑟𝑦 𝑀𝑎𝑠𝑠 (𝑔)𝑊𝑒𝑡 𝑆𝑎𝑚𝑝𝑙𝑒 𝑉𝑜𝑙𝑢𝑚𝑒 (𝑐𝑚3) (2) 141 𝑊𝑎𝑡𝑒𝑟 𝐶𝑜𝑛𝑡𝑒𝑛𝑡 (%) = 𝑊𝑒𝑡 𝑀𝑎𝑠𝑠 (𝑔)−𝐷𝑟𝑦 𝑀𝑎𝑠𝑠(𝑔)𝑊𝑒𝑡 𝑀𝑎𝑠𝑠 (𝑔) × 100 (3) 142 𝑃𝑜𝑟𝑜𝑠𝑖𝑡𝑦 (%) = 𝑀𝑎𝑠𝑠 𝑜𝑓 𝑊𝑎𝑡𝑒𝑟 𝑖𝑛 𝑡ℎ𝑒 𝑆𝑜𝑖𝑙 (𝑔) 𝑀𝑎𝑠𝑠 𝑜𝑓 𝑊𝑎𝑡𝑒𝑟 𝑖𝑛 𝑡ℎ𝑒 𝑆𝑜𝑖𝑙 (𝑔)+( 𝐷𝑟𝑦 𝑀𝑎𝑠𝑠 (𝑔)𝐷𝑟𝑦 𝐵𝑢𝑙𝑘 𝐷𝑒𝑛𝑠𝑖𝑡𝑦 (𝑔 𝑐𝑚−3)) (4) 143
The degree of compaction of the soils collected by hammer coring was determined by 144
comparing the thickness of discrete soil horizons observed in the adjacent gouge cores. 145
3.2.2 Elemental Analysis 146
Elemental analysis (EA) was used to quantify the OC content of the saltmarsh soils. The oven 147
dried samples were milled to a powder, and a 10 mg sub-sample was placed in a silver capsule. 148
The soils within the silver capsules were treated with HCl through acid fumigation to remove 149
carbonate (Harris et al., 2001) and, after drying (24 hrs at 50°C), the samples were analysed 150
using an Elementar EL Vario following the methodology of Verardo et al. (1990). Analytical 151
precision was estimated from repeat analyses (n=18) of standard reference material B2178 152
(Medium Organic Content Standard; Elemental Microanalysis, UK); the analytical precision 153
for the OC measurements was ± 0.09 %. 154

8
3.2.3 Assessing OC stocks and burial rates 155
To test the potential impacts of compaction associated with hammer coring on soil mass and 156
OC stock estimations; we undertook a simple test, where we calculated both soil mass (kg) and 157
OC stock (kg) for an area of 1 m2 using the thickness (m) of the different soil horizons 158
associated with each coring method. The saltmarsh soil mass and OC stocks were calculated 159
down to the depth were the basal silts are introduced in the stratigraphy (Fig.2) as these 160
represent the switch from saltmarsh to intertidal mudflat habitat which is currently not 161
considered a blue carbon environment (Nellemann, et al., 2009). The test assumed that each 162
core was representative of the surrounding 1 m2 of saltmarsh soil. Using the data collected from 163
the cores the mass of soil and the OC stock for the soil underlying the 1 m2 was estimated. 164
These estimates were made following the standard methodology: 165
166 𝑆𝑜𝑖𝑙 𝑉𝑜𝑙𝑢𝑚𝑒 (𝑚3) = 𝐴𝑟𝑒𝑎 (𝑚2) × 𝑆𝑜𝑖𝑙 𝑈𝑛𝑖𝑡 𝑇ℎ𝑖𝑐𝑘𝑛𝑒𝑠𝑠 (𝑚) (5) 167 𝑆𝑜𝑖𝑙 𝑀𝑎𝑠𝑠 (𝑘𝑔) = 𝑆𝑜𝑖𝑙 𝑉𝑜𝑙𝑢𝑚𝑒 (𝑚3) × 𝐷𝑟𝑦 𝐵𝑢𝑙𝑘 𝐷𝑒𝑛𝑠𝑖𝑡𝑦 (𝑘𝑔 𝑚−3) (6) 168 𝑂𝐶 𝑆𝑡𝑜𝑐𝑘 (𝑘𝑔) = 𝑆𝑜𝑖𝑙 𝑀𝑎𝑠𝑠 (𝑘𝑔) × 𝑂𝐶 𝐶𝑜𝑛𝑡𝑒𝑛𝑡 (%) (7) 169
170
This approach was used with the stratigraphic data collected from both the hammer and gouge 171
cores, enabling the soil mass and OC stock estimates to be compared in order to assess any 172
effect of coring-related compaction on the soils. 173
Sedimentation and mass accumulation rates of saltmarsh soils are commonly calculated using 174
radiometric age control (210Pb and 137Cs) (Krishnaswamy et al., 1971, Appleby and Oldfield, 175
1978). Dry bulk density and porosity are key to these calculations. In order to test the effect of 176
soil compaction on calculated sedimentation and mass accumulation rates, we have used a 177
previously published (Barlow et al., 2014) radiometric age model from a core collected using 178
a wide dimeter gouge corer from the same location as core KT-18-03. The new DBD and 179
9
porosity data from the gouge and hammer cores collected at site KT-18-03 were used, together 180
with the original radiometric age control data, to recalculate the most common age-depth 181
methods: simple linear interpolation, the constant rate of supply (CRS) model (Appleby and 182
Oldfield, 1978) and the constant initial concentration (CIC) model (Robbins and Edgington 183
1975). 184
4. Results and Interpretation 185
4.1 Saltmarsh Soil Profiles 186
The soil profiles of the Kyle of Tongue saltmarsh have four main units, with a fibrous peat 187
(Turfa herbacea) surficial layer overlying humified peat (Substantia humosa) and organic rich 188
silt, which sits upon a basal layer of marine mud (Fig.2), (and further summarised in Barlow et 189
al, 2014). Core KT18-05, the more seaward core of the main transect, however, differs from 190
the others in that it lacks the surficial fibrous peat layer and has a thin layer of humified peat 191
capping the underlying silts. In places, iron (Fe) staining is observed in the silt layer, indicating 192
the presence of Fe oxides, most likely a consequence of increased oxygen penetration into the 193
soil layer (Luther III et al., 1992, Kostka, and Luther III, 1994) at this site. The soil units 194
themselves differ significantly in thickness between coring sites, with the fibrous peat ranging 195
from 4-9 cm, the humified peat ranging from 120-310 cm and the organic rich silts ranging 196
from 70-350 cm (Fig.2). The hammer core generally penetrated further into the basal silty mud 197
than the gouge core. 198

10
199
Figure 2. Comparison of the effects of the coring method on the soil profiles, OC content and 200
dry bulk density across the four sites. The grey lines represent the difference in cumulative 201
depth (cm) of the soil horizons in each core as described by the Tröels-Smith classification 202
scheme (1955). The thickness of the different soil units can be found in the supplementary table 203
2. 204
205
206
207

11
4.2 Compaction 208
By comparing the soil profiles obtained from the hammer cores (both in the field and the 209
laboratory) to those recorded from the gouge cores, where compaction observed in the field 210
was minimal (< 2 %), it is estimated that the soils from the hammer cores were compacted by 211
between 22.9% and 27.8% (Fig.3). The laboratory-based compaction calculations compare 212
favourably to the field-measurements, confirming that the field-based estimates of total depth 213
compaction are robust (Fig.3). KT18-02 and 03 are the only cores where the field 214
measurements are exceeded by the laboratory-based estimates of compaction. This is 215
potentially due to the stretching (a piston effect) of certain soil horizons during extraction. For 216
example, it was observed upon extraction of core KT18-03 that the degree of overall 217
compaction had reduced from the in situ measurements in the field. Indeed, when the soil 218
profile is examined in greater detail, the equivalent silt unit in the hammer core is thicker than 219
that in the adjacent gouge core, further suggesting that stretching of the soil profile has taken 220
place whilst extracting the material from the ground (Fig.3). 221
KT18-02 KT18-03 KT18-05 KT18-21
Co
mp
actio
n [%
]
0
5
10
15
20
25
30
Laboratory Comparison
Field Measurment
222
Figure 3. Comparison of field- and laboratory-based measurements of total soil compaction 223
(%) in the four hammer cores. 224

12
225
These measurements are useful to quantify the total amount of compaction which has occurred 226
during the coring process, but they don’t provide the required insight into the degree of 227
compaction of the individual soil units. However, by comparing the adjacent soil profiles 228
recovered from the two coring techniques, the level of compaction for each of the soil units 229
can be calculated (Table 1). 230
231
Table 1. Comparison of the dry bulk density (g cm-3) and water content (%) of the saltmarsh 232
soils across the four coring sites, using the two coring methods. Additionally, the degree of 233
compaction (%) for each soil unit calculated by comparing the thickness of each soil unit 234
(Fig.2) from the gouge and hammer cores (negative compaction values are indicative of 235
stretching). 236
Mean Dry Bulk
Density (g cm-3)
Mean Water
Content (%)
Porosity (%) Compaction
(%)
Site Soil Unit Gouge Hammer Gouge Hammer Gouge Hammer Hammer
KT18-02 Peat 0.39 0.36 70.09 25.14 51.69 45.67 53.85
Humified Peat 0.45 0.67 58.90 36.11 53.94 41.68 21.4
Silt with Organics 0.70 0.62 45.25 42.01 45.93 36.96 25
KT18-03 Peat 0.23 0.27 81.36 23.86 46.09 44.46 63.64
Humified Peat 0.24 0.39 71.83 30.76 46.89 38.01 20.51
Silt with Organics 0.40 0.90 58.76 49.94 46.13 39.51 -19.23
KT18-05 Humified Peat 0.61 0.59 58.42 42.78 44.24 33.28 50
Silt with Organics (Fe) 0.60 0.81 43.22 54.73 40.23 34.05 53.85
Silt with Organics 0.79 0.88 36.63 60.92 36.11 33.75 28.13
KT18-21 Peat 0.36 0.43 67.55 35.65 43.67 40.58 60.87
Humified Peat 0.54 0.60 57.33 42.56 44.82 41.68 21.21
Silt with Organics 1.02 0.98 36.82 61.05 38.49 37.13 61.11
13
The surficial layers of fibrous and humified peat experience the greatest compaction (Table 1). 237
In core KT18-05, we observe above average compaction of the silt layer (Table 1), most likely 238
due to the thin overlying peat layers (Fig.2). The compaction of the soil profiles significantly 239
dewatered the upper peat units, which in turn increases soil DBD (Table 1). It was hypothesised 240
that dewatering of the soils would flush the soluble OC from the compacted sediment and, in 241
turn, evacuate porewater dissolved organic carbon (DOC) and reduce the measured OC content. 242
However, a comparison of the down core OC content of the sediments obtained by both coring 243
methods (Fig.2) indicates only minimal differences between OC content. These differences in 244
OC are well within the range of natural variability and we therefore conclude that coring 245
compaction in itself does not directly impact the relative (%) OC content of saltmarsh soils. 246
4.3 Consequences for OC stock and burial estimations 247
The alteration (generally reduction) in the thickness of the individual soil units, combined with 248
increases in DBD associated with the hammer coring technique, are likely to alter soil mass 249
and OC stock estimates. However, the reduction in soil thickness and increase in DBD may act 250
to offset one another, while still resulting in accurate estimates of soil mass and OC stock. 251
Saltmarsh soil mass and OC stock estimates differ between the hammer and gouge cores for all 252
sites (Table 2). The hammer cores KT18-02, 05 and 21 all overestimate the normalized soil 253
mass by between 3.9 - 37 % in comparison to the gouge core estimates. The resulting OC stocks 254
derived from these cores are also overestimated by between 14.8 to 22%. KT18-03 differs 255
from the other sites in that the hammer core estimates are slightly lower than the gouge 256
equivalents for both the soil mass and OC stock (Table 2). This difference is potentially a 257
consequence of the material stretching when the core was removed from the ground (Fig.2), 258
resulting in a soil profile similar to that observed in the gouge core. 259
260

14
261
Soil Mass (kg) OC Stock (kg)
Site Soil Unit Gouge Hammer Gouge Hammer
KT18-02 Peat 21.6 41.3 6.2 10.8 Humified Peat 120.3 117.1 19.8 16.7 Silt with Organics 237.1 235.0 5.7 9.6 Total 379 393.4 31.6 37.1
Difference (H-G) +14.4 kg (3.9 %) +5.5 kg (14.8 %)
KT18-03 Peat 10.7 25.6 3.37 7.4
Humified Peat 129.5 124.7 32.74 31.1
Silt with Organics 233.4 163.1 24.34 19.5
Total 373.6 313.1 60.46 57.9
Difference (H-G) -60.5 kg (16.1%) -2.56 kg (4.2 %)
KT18-05 Humified Peat 23.7 56.1 2.06 5.0
Silt with Organics 437.5 447.8 15.47 17.5
Total 461.3 503.9 17.53 22.5
Difference (H-G) +42.6 kg (8.5%) +5.0 kg (22.1 %)
KT18-21 Peat 38.6 92.8 4.4 13.7
Humified Peat 156.8 187.3 17.1 18.1
Silt with Organics 72.7 143.2 6.0 2.78
Total 268.12 423.2 27.5 34.0
Difference (H-G) +155.2 kg (36.7 %) +6.5 kg (19.2 %) 262
Table 2. Soil mass and OC stock estimates for 1 m2 of saltmarsh using the thickness of each 263
unit measured from each of the cores. 264
265
While the differences between the gouge and hammer core-derived OC stocks may seem 266
relatively small (-2.56 to 6.51 kg) it is worth highlighting that these estimates are for an area 1 267
m2. When these estimates are scaled up to the total area of the Kyle of Tongue saltmarsh (9.31 268
ha), itself a relatively small saltmarsh by UK standards, the OC stock calculation could result 269
in an underestimation of 238 tonnes OC all the way to an overestimation of 606 tonnes OC, if 270
the hammer coring method was employed in deriving those soil OC stocks. 271
Furthermore, as bulk density and porosity are essential components required for the successful 272
radiometric age-calculation of soil profiles (Appleby and Oldfield, 1978, Appleby, 2002) these 273
coring-related compaction changes will directly impact the calculation of OC burial rates. By 274
inputting the DBD and porosity value calculated for the gouge and hammer core from site KT-275
15
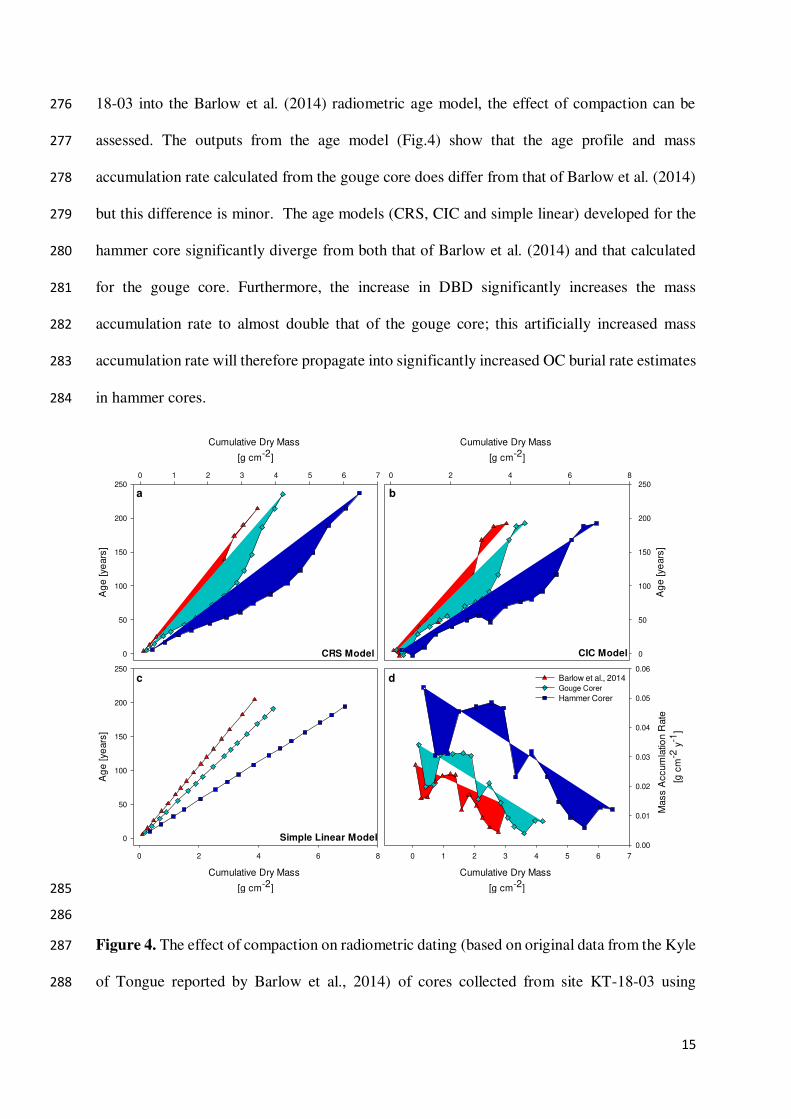
18-03 into the Barlow et al. (2014) radiometric age model, the effect of compaction can be 276
assessed. The outputs from the age model (Fig.4) show that the age profile and mass 277
accumulation rate calculated from the gouge core does differ from that of Barlow et al. (2014) 278
but this difference is minor. The age models (CRS, CIC and simple linear) developed for the 279
hammer core significantly diverge from both that of Barlow et al. (2014) and that calculated 280
for the gouge core. Furthermore, the increase in DBD significantly increases the mass 281
accumulation rate to almost double that of the gouge core; this artificially increased mass 282
accumulation rate will therefore propagate into significantly increased OC burial rate estimates 283
in hammer cores. 284
Cumulative Dry Mass
[g cm-2]
0 1 2 3 4 5 6 7
Mass A
ccum
latio
n R
ate
[g c
m-2
y-1
]
0.00
0.01
0.02
0.03
0.04
0.05
0.06
Cumulative Dry Mass
[g cm-2]
0 1 2 3 4 5 6 7
Ag
e [ye
ars
]
0
50
100
150
200
250
Cumulative Dry Mass
[g cm-2]
0 2 4 6 8
Ag
e [ye
ars
]0
50
100
150
200
250
Barlow et al., 2014Gouge Corer
Hammer Corer
Cumulative Dry Mass
[g cm-2]
0 2 4 6 8
Ag
e [ye
ars
]
0
50
100
150
200
250
CRS Model CIC Model
Simple Linear Model
a b
c d
285
286
Figure 4. The effect of compaction on radiometric dating (based on original data from the Kyle 287
of Tongue reported by Barlow et al., 2014) of cores collected from site KT-18-03 using 288

16
different calculation approaches (a) constant rate of supply (CRS) model (Appleby and 289
Oldfield, 1978). (b) Constant initial concentration (CIC) model (Robbins and Edgington 1975). 290
(c) Simple linear model (d) Mass sedimentation rates calculated from the CRS model. 291
292
5. Discussion 293
The comparison of the two coring techniques clearly highlights that hammer coring can cause 294
significant compaction and alter the physical properties of collected saltmarsh soils (Fig.2). 295
While soil compaction using the hammer coring method has previously been observed in 296
saltmarshes (Callaway et al., 2012, Ewers Lewis et al., 2019, Kelleway et al., 2016a, b, Unger 297
et al., 2016), the consequences of compaction are rarely discussed in light of their impact on 298
OC stock and burial estimates. 299
300
OC stock estimates are calculated using the thickness of a soil unit and DBD, yet both these 301
properties are shown to have been altered during hammer coring (Fig.2). By comparing the soil 302
profiles collected in the gouge compared to the hammer cores, we observe that hammer coring 303
has a significant impact, by both reducing the thickness of each soil unit and increasing the 304
DBD, which generally leads to an overestimation of the saltmarsh soil OC stock (Table 2). Yet 305
the degree of this uncertainty in OC stock is highly variable because each unit within the soil 306
profile compresses by different amounts (Table 1). This highlights that the linear corrections 307
used to compensate for coring-related compaction (Ewers Lewis et al., 2019, Kelleway et al., 308
2016a, b) would be unsuitable to deal with the stratigraphic complexity of the soils examined 309
here. In saltmarshes with complex soil profiles (i.e. multiple different soil units), we have 310
shown that hammer coring is unsuitable for the calculation of OC stocks and should be avoided. 311
Callaway et al., (2012) suggested that where compaction was >3 cm in cores of 50 cm length, 312

17
that those cores should not be used for OC stock calculations; we consider this to be a 313
reasonable suggestion. 314
315
OC burial rates for the recent past (last 150 years) are often calculated from chronologies 316
produced from 210Pb and 137Cs radiometric dating of soils, while long-term burial rates are often 317
estimated using radiocarbon (14C). DBD and porosity are key components to the measurement 318
and production of radiometric chronologies (Appleby and Oldfield, 1978, Appleby, 2002). As 319
compaction changes both of these soil properties, the resultant radiometric chronologies will 320
be compromised (Fig.4). Johannessen and Macdonald (2016), for example, have recently 321
critically reviewed the misunderstanding and use of 210Pb dating, arguing that this has resulted 322
in significant overestimation of OC burial in seagrass soils. However, soil compaction during 323
the coring process and resulting errors in the 210Pb chronology were not considered by 324
Johannessen and Macdonald, (2016) nor in the response by Arias-Ortiz et al., (2018). For the 325
reason discussed, there are few studies which use hammer cores for dating in saltmarshes (Boyd 326
et al., 2017, Unger et al., 2016) and as there is no way to correct for the alteration to any 327
complex soil profile, OC burial rates derived from hammer cores should be treated with caution. 328
329
The advantages to hammer coring are its low cost, provision of large quantities of sample 330
material and its application in settings and soils where other corers would struggle to recover 331
sediments (i.e. submerged soils, sands). Indeed, this explains why the hammer coring method 332
is so widely used for seagrass sampling, for example. However, in saltmarshes, other effective 333
coring options are available and are therefore preferable. 334
335
336
337
18
6. Recommendations 338
By comparing gouge and hammer cores, we show that the hammer coring method is unsuitable 339
for the reliable estimation of OC stocks and burial rates in saltmarsh soils. We acknowledge 340
that in some environments and sediment types hammer coring is the only viable, practical 341
option. In these circumstances, some simple steps can be taken to improve research outcomes: 342
(i) report if compaction took place and the correction factor applied; (ii) provide a description 343
of the soil profile; (iii) set a threshold (e.g >3cm for 50cm cores, Callaway et al., 2012) for 344
compaction which, if exceeded, will preclude the cores being used for OC stock estimates; (iv) 345
avoid the dating of bulk soil samples collected by hammer cores. While the above steps will 346
not resolve all of the coring-related issues identified in this study, they will allow the 347
calculation of OC stocks with an appropriate reporting of potential errors due to compaction. 348
Where possible, we therefore strongly recommend the use of tried and tested coring methods, 349
such as gouge and Russian corers, which provide a strong foundation to reliably estimate 350
saltmarsh blue carbon stocks and burial rates. 351
352
Acknowledgments 353
This work was supported by the Natural Environment Research Council (grant NE/R010846/1) 354
Carbon Storage in Intertidal Environments (C-SIDE) project. Further we would like to thank 355
Luis Rees-Hughes (University of Leeds) for field assistance. 356
357
References 358
Adam, P. (1978). Geographical variation in British saltmarsh vegetation. The Journal of 359
Ecology, 339-366. 360

19
Appleby, P. G. (2002). Chronostratigraphic techniques in recent sediments. In Tracking 361
environmental change using lake sediments (pp. 171-203). Springer, Dordrecht. 362
Appleby, P. G., & Oldfield, F. (1978). The calculation of lead-210 dates assuming a constant 363
rate of supply of unsupported 210Pb to the sediment. Catena, 5(1), 1-8. 364
Archer, J. R., & Smith, P. D. (1972). The relation between bulk density, available water 365
capacity, and air capacity of soils. Journal of Soil Science, 23(4), 475-480. 366
Arias-Ortiz, A., Masqué, P., Garcia-Orellana, J., Serrano, O., Mazarrasa, I., Marbà, N., ... & 367
Duarte, C. M. (2018). Reviews and syntheses: 210Pb-derived sediment and carbon 368
accumulation rates in vegetated coastal ecosystems–setting the record straight. 369
Athy, L. F. (1930). Density, porosity, and compaction of sedimentary rocks. AAPG 370
Bulletin, 14(1), 1-24. 371
Barlow N.L.M, Long A.J., Saher M.H., Gehrels W.R., Garnett M, Scaife R. 2014. Salt-marsh 372
reconstructions of relative sea-level change in the North Atlantic during the last 2000 373
years. Quaternary Science Reviews. 99 1-16 374
Boyd, B. M., Sommerfield, C. K., & Elsey-Quirk, T. (2017). Hydrogeomorphic influences on 375
salt marsh sediment accumulation and accretion in two estuaries of the US Mid-Atlantic 376
coast. Marine Geology, 383, 132-145. 377
Brain, M. J. (2016). Past, present and future perspectives of sediment compaction as a driver 378
of relative sea level and coastal change. Current Climate Change Reports, 2(3), 75-85 379
Brain, M. J., Kemp, A. C., Hawkes, A. D., Engelhart, S. E., Vane, C. H., Cahill, N., ... & Horton, 380
B. P. (2017). Exploring mechanisms of compaction in salt-marsh sediments using Common 381
Era relative sea-level reconstructions. Quaternary Science Reviews, 167, 96-111. 382

20
Burd, F. (1989). Saltmarsh survey of Great Britain: an inventory of British Saltmarshes (No. 383
17). 384
Callaway, J. C., Borgnis, E. L., Turner, R. E., & Milan, C. S. (2012). Carbon sequestration and 385
sediment accretion in San Francisco Bay tidal wetlands. Estuaries and Coasts, 35(5), 1163-386
1181. 387
Dadey, K. A., Janecek, T., & Klaus, A. (1992). Dry-bulk density: its use and determination. 388
In Proceedings of the Ocean Drilling Program, Scientific Results (Vol. 126, pp. 551-554). 389
College Station, TX, USA: National Science Foundation, & Joint Oceanographic Institutions 390
Incorporated. 391
Duarte, C. M., Losada, I. J., Hendriks, I. E., Mazarrasa, I., & Marbà, N. (2013). The role of 392
coastal plant communities for climate change mitigation and adaptation. Nature Climate 393
Change, 3(11), 961. 394
Edwards, R. J. (2006). Mid-to late-Holocene relative sea-level change in southwest Britain and 395
the influence of sediment compaction. The Holocene, 16(4), 575-587. 396
Ewers Lewis, C. J., Baldock, J. A., Hawke, B., Gadd, P. S., Zawadzki, A., Heijnis, H., ... & 397
Macreadie, P. I. (2019). Impacts of land reclamation on tidal marsh ‘blue 398
carbon’stocks. Science of The Total Environment, 672, 427-437. 399
Frew, C. (2012). Section 4.1.1: Coring Methods. In: Cook, S.J., Clarke, L.E. & Nield, J.M. 400
(Eds.) Geomorphological Techniques (Online Edition). British Society for Geomorphology; 401
London, UK. ISSN: 2047-0371. 402
Glew, J. R., Smol, J. P., & Last, W. M. (2002). Sediment core collection and extrusion. 403
In Tracking environmental change using lake sediments (pp. 73-105). Springer, Dordrecht. 404

21
Håkansson, I., & Lipiec, J. (2000). A review of the usefulness of relative bulk density values 405
in studies of soil structure and compaction. Soil and Tillage Research, 53(2), 71-85. 406
Harris, D., Horwáth, W. R., & Van Kessel, C. (2001). Acid fumigation of soils to remove 407
carbonates prior to total organic carbon or carbon-13 isotopic analysis. Soil Science Society of 408
America Journal, 65(6), 1853-1856. 409
Haynes, T.A. (2016). Scottish saltmarsh survey national report. Scottish Natural Heritage 410
Commissioned Report No. 786 411
Howard, J., Hoyt, S., Isensee, K., Telszewski, M., & Pidgeon, E. (2014). Coastal blue carbon: 412
methods for assessing carbon stocks and emissions factors in mangroves, tidal salt marshes, 413
and seagrasses. 414
Johannessen, S. C., & Macdonald, R. W. (2016). Geoengineering with seagrasses: is credit due 415
where credit is given?. Environmental Research Letters, 11(11), 113001. 416
Kelleway, J. J., Saintilan, N., Macreadie, P. I., & Ralph, P. J. (2016b). Sedimentary factors are 417
key predictors of carbon storage in SE Australian saltmarshes. Ecosystems, 19(5), 865-880. 418
Kelleway, J. J., Saintilan, N., Macreadie, P. I., Skilbeck, C. G., Zawadzki, A., & Ralph, P. J. 419
(2016a). Seventy years of continuous encroachment substantially increases ‘blue 420
carbon’capacity as mangroves replace intertidal salt marshes. Global change biology, 22(3), 421
1097-1109. 422
Krishnaswamy, S., Lal, D., Martin, J.M. and Meybeck, M., 1971. Geochronology of lake 423
sediments. Earth and Planetary Science Letters, 11(1-5), pp.407-414. 424
Kostka, J. E., & Luther III, G. W. (1994). Partitioning and speciation of solid phase iron in 425
saltmarsh sediments. Geochimica et Cosmochimica Acta, 58(7), 1701-1710. 426

22
Luther III, G. W., Kostka, J. E., Church, T. M., Sulzberger, B., & Stumm, W. (1992). Seasonal 427
iron cycling in the salt-marsh sedimentary environment: the importance of ligand complexes 428
with Fe (II) and Fe (III) in the dissolution of Fe (III) minerals and pyrite, respectively. Marine 429
chemistry, 40(1-2), 81-103. 430
Macreadie, P. I., Hughes, A. R., & Kimbro, D. L. (2013). Loss of ‘blue carbon’from coastal 431
salt marshes following habitat disturbance. PloS one, 8(7), e69244. 432
Macreadie, P. I., Trevathan-Tackett, S. M., Skilbeck, C. G., Sanderman, J., Curlevski, N., 433
Jacobsen, G., & Seymour, J. R. (2015). Losses and recovery of organic carbon from a seagrass 434
ecosystem following disturbance. Proceedings of the Royal Society B: Biological 435
Sciences, 282(1817), 20151537. 436
Mcleod, E., Chmura, G. L., Bouillon, S., Salm, R., Björk, M., Duarte, C. M., ... & Silliman, B. 437
R. (2011). A blueprint for blue carbon: toward an improved understanding of the role of 438
vegetated coastal habitats in sequestering CO2. Frontiers in Ecology and the Environment, 439
9(10), 552-560. 440
Nellemann, C., & Corcoran, E. (Eds.). (2009). Blue carbon: the role of healthy oceans in 441
binding carbon: a rapid response assessment. UNEP/Earthprint. 442
Pendleton, L., Donato, D. C., Murray, B. C., Crooks, S., Jenkins, W. A., Sifleet, S., ... & 443
Megonigal, P. (2012). Estimating global “blue carbon” emissions from conversion and 444
degradation of vegetated coastal ecosystems. PloS one, 7(9), e43542. 445
Robbins, J.A. and Edgington, D.N., 1975. Determination of recent sedimentation rates in Lake 446
Michigan using Pb-210 and Cs-137. Geochimica et Cosmochimica Acta, 39(3), pp.285-304. 447
23
Rogers, K., Kelleway, J. J., Saintilan, N., Megonigal, J. P., Adams, J. B., Holmquist, J. R., ... 448
& Woodroffe, C. D. (2019). Wetland carbon storage controlled by millennial-scale variation 449
in relative sea-level rise. Nature, 567(7746), 91. 450
Serrano, O., Almahasheer, H., Duarte, C. M., & Irigoien, X. (2018). Carbon stocks and 451
accumulation rates in Red Sea seagrass meadows. Scientific reports, 8(1), 15037. 452
Tröels-Smith, J. (1955). Characterization of unconsolidated sediments: Dansk Geologiske 453
Undersøgelse, ser. 454
Unger, V., Elsey-Quirk, T., Sommerfield, C., & Velinsky, D. (2016). Stability of organic 455
carbon accumulating in Spartina alterniflora-dominated salt marshes of the Mid-Atlantic 456
US. Estuarine, Coastal and Shelf Science, 182, 179-189. 457
van Ardenne, L. B., Jolicouer, S., Bérubé, D., Burdick, D., & Chmura, G. L. (2018). The 458
importance of geomorphic context for estimating the carbon stock of salt 459
marshes. Geoderma, 330, 264-275. 460
Verardo, D. J., Froelich, P. N., & McIntyre, A. (1990). Determination of organic carbon and 461
nitrogen in marine sediments using the Carlo Erba NA-1500 Analyzer. Deep Sea Research Part 462
A. Oceanographic Research Papers, 37(1), 157-165. 463
Wollenberg, J. T., Ollerhead, J., & Chmura, G. L. (2018). Rapid carbon accumulation 464
following managed realignment on the Bay of Fundy. PloS one, 13(3), e0193930. 465