core case study south asia’s massive brown...
TRANSCRIPT

C O R E C A S E S T U D Y
India by about 7% because less sunlight reaches the ground, ac-cording to a 2008 report by atmospheric scientist Veerabhadran Ramanathan, who heads the UNEP’s Atmospheric Brown Cloud Project. Acids in the haze fall to the surface and damage crops, trees, and aquatic life in lakes.
Instead of blue skies, many of the people living under this cloud see brown or gray polluted skies much of the year (Fig-ure 18-2). UNEP scientists estimate that the pollution in the cloud contributes to at least 700,000 premature deaths every year.
Originally, scientists thought that the brown cloud deflected sunlight and tended to cool the atmosphere above it. But a study
of black carbon particles in the cloud, done in 2006 and 2008 by a team of climate scientists led by Ramanathan, found that these parti-cles helped to warm the atmosphere above the cloud by about as much as CO2 and other greenhouse gases do.
The Asian Brown Cloud is also bad news for other parts of the world because it doesn’t stay put. In 2006, a U.S. satellite tracked the spread of a dense cloud of pollut-ants from northern China to Seoul, South Korea, and then across the Pacific Ocean to the United States. The U.S. Environmental Protection Agency (EPA) estimates that on certain days, nearly 25% of the par-ticulate matter, 77% of the black carbon, and 33% of the toxic mer-cury in the skies above Los Angeles, California, can be traced to coal-fired power plants, smelters, diesel
trucks, and dust storms caused by drought and deforestation in China.
Satellite measurements show that it takes about 2 weeks for long-lived air pollutants to circle the world. Thus, long-lived air pollutants from China, India, the United States, or anywhere can affect the entire world. Air pollution connects us all.
The history of air pollution control in Europe and the United States shows that pollution such as that in the Asian cloud can be cleared up fairly quickly by setting strict pollution control standards for coal-burning industries and utilities and by shifting from coal to cleaner-burning natural gas in industries and homes. China is beginning to take such steps but has a long way to go. India’s capital city of Delhi, under orders from India’s Supreme Court, has also made progress in reducing air pollution.
South Asia’s Massive Brown Cloud
Air pollution is no longer viewed as mostly a localized urban problem. Satellite images, along with a 2002 study by the U.N. Environment Programme (UNEP), revealed a massive brown cloud of pollution—called the Asian Brown Cloud—stretching nearly continuously across much of India, Bangladesh, the industrial heart of China, and the open sea east of this area (Figure 18-1).
The cloud is about 3 kilometers (2 miles) thick, hangs at an elevation of 2–5 kilometers (1–3 miles), and covers an area about the size of the continental United States. About a third of it is dust, smoke, and ash resulting from drought and the clearing and burning of forests for planting crops. The rest is made up of acidic compounds, soot, toxic metals such as mercury and lead, hundreds of organic compounds, and fly ash produced by the burn-ing of coal, diesel, and other fossil fuels in industries, motor vehicles, and homes.
Beneath the cloud, photo-synthesis has been reduced in China by about 7–10% and in
Air Pollution18
Figure 18-2 Air pollution in Shanghai, China, in 2004.
Figure 18-1 The Asian Brown Cloud. A gigantic cloud of dust, smoke, soot, and other pollutants stretches over much of Asia, visible here over eastern China.
The
SeaW
iFS
Proj
ect,
NAS
A/Go
ddar
d Sp
ace
Flig
ht C
ente
r, an
d Or
bim
age
ulls
tein
-His
s/Pe
ter A
rnol
d, In
c.

The Atmosphere Consists of Several LayersWe live at the bottom of a thin envelope of gases sur-rounding the earth, called the atmosphere. It is divided into several spherical layers (Figure 18-3, p. 470), each characterized by abrupt changes in temperature caused by differences in the absorption of incoming solar energy.
Two other factors that vary throughout the atmo-sphere are density and atmospheric pressure, both in-fluenced by gravity, which pulls the gas molecules in the atmosphere toward the earth’s surface. Because of this, the air we breathe at sea level has a higher den-sity—more molecules per liter—than the air we would inhale on top of the world’s highest mountain. Atmo-spheric pressure is the force, or mass, per unit area of a column of air. This force is caused by the bombard-ment of a surface such as your skin by air molecules.
Atmospheric pressure decreases with altitude because there are fewer gas molecules at higher altitudes.
Air Movements in the Troposphere Play a Key Role in the Earth’s Weather and ClimateAbout 75–80% of the earth’s air mass is found in the troposphere, the atmospheric layer closest to the earth’s surface. This layer extends only about 17 kilo-meters (11 miles) above sea level at the equator and 8 kilometers (5 miles) over the poles. If the earth were the size of an apple, this lower layer containing the air we breathe would be no thicker than the apple’s skin.
Take a deep breath. About 99% of the air you in-haled consists of two gases: nitrogen (78%) and oxygen
Key Questions and Concepts
18-1 What is the nature of the atmosphere?CONCEPT 18 -1 The atmosphere is structured in layers, including the troposphere, which supports life, and the stratosphere, which contains the protective ozone layer.
18-2 What are the major outdoor air pollution problems?CONCEPT 18 -2 Pollutants mix in the air to form industrial smog, mostly the result of burning coal, and photochemical smog, caused by motor vehicle, industrial, and power plant emissions.
18-3 What is acid deposition and why is it a problem?CONCEPT 18 -3 Acid deposition is caused mainly by coal-burning power plant and motor vehicle emissions, and in some regions, threatens human health, aquatic life and ecosystems, forests, and human-built structures.
18-4 What are the major indoor air pollution problems?CONCEPT 18 -4 The most threatening indoor air pollutants are smoke and soot from wood and coal cooking fires (a hazard found mostly in developing countries) and chemicals used in building materials and products.
18-5 What are the health effects of air pollution?CONCEPT 18 -5 Air pollution can contribute to asthma, chronic bronchitis, emphysema, lung cancer, heart attack, and stroke.
18-6 How should we deal with air pollution?CONCEPT 18 -6 Legal, economic, and technological tools can help to clean up air pollution, but much greater emphasis should be focused on preventing air pollution.
Note: Supplements 2 (p. S4), 6 (p. S39) and 13 (p. S78) can be used with this chapter.
I thought I saw a blue jay this morning. But the smog was so bad that it turned out to be
a cardinal holding its breath.
MICHAEL J. COHEN
18-1 What Is the Nature of the Atmosphere?CONCEPT 18-1 The atmosphere is structured in layers, including the troposphere, which supports life, and the stratosphere, which contains the protective ozone layer.
▲
469Links: refers to the Core Case Study. refers to the book’s sustainability theme. indicates links to key concepts in earlier chapters.

470 CHAPTER 18 Air Pollution
(21%). The remainder consists of water vapor (vary-ing from 0.01% at the frigid poles to 4% in the humid tropics), 0.93% argon (Ar), 0.038% carbon dioxide (CO2), and trace amounts of dust and soot particles and
other gases including methane (CH4), ozone (O3), and nitrous oxide (N2O).
The troposphere is a dynamic system involved in the chemical cycling of the earth’s vital nutrients (Concept 3-5, p. 65). Its rising and falling air currents and winds are largely responsible for the planet’s short-term weather and long-term climate (Concept 7-1, p. 141).
The Stratosphere Is Our Global SunscreenThe atmosphere’s second layer is the stratosphere, which extends from about 17 to about 48 kilometers (from 11 to 30 miles) above the earth’s surface (Fig-ure 18-3). Although the stratosphere contains less mat-ter than the troposphere, its composition is similar, with two notable exceptions: its volume of water vapor is about 1/1,000 that of the troposphere, and its con-centration of ozone (O3) is much higher.
Much of the atmosphere’s small amount of ozone (O3) is concentrated in a portion of the stratosphere called the ozone layer, found roughly 17–30 kilome-ters (11–19 miles) above sea level. Stratospheric ozone is produced when some of the oxygen molecules there interact with ultraviolet (UV) radiation emitted by the sun (3 O2 � UV 2 O3). This “global sunscreen” of ozone in the stratosphere keeps about 95% of the sun’s harmful UV radiation (Figure 3-8, p. 56) from reaching the earth’s surface.
The UV filter of ozone in the lower stratosphere allows us and other forms of life to exist on land and helps to protect us from sunburn, skin and eye cancer, cataracts, and damage to our immune systems. It also prevents much of the oxygen in the troposphere from being converted to photochemical ozone, a harmful air pollutant when found near the ground.
Atmospheric pressure (millibars)0 200 400 600 800 1,000
Alti
tude
(kilo
met
ers)
120
100
80
60
40
20
0(Sealevel) –80 –40 0 40 80 120
Temperature (˚C)
75
55
35
15
Alti
tude
(mile
s)Pressure =1,000millibars atground level
Temperature
Pressure
Thermosphere
Mesopause
Mesosphere
Stratopause
Stratosphere
Tropopause
Troposphere
Ozone layer
50
5
25
45
65110
90
70
30
10
Figure 18-3 Natural capital: The earth’s atmosphere is a dynamic system that includes four layers. The average temperature of the at-mosphere varies with altitude (red line). Most UV radiation from the sun is absorbed by ozone (O3), found primarily in the stratosphere in the ozone layer 17–26 kilometers (10–16 miles) above sea level. Question: Why do you think the temperature falls and rises twice, going from lower to higher altitudes?
18-2 What Are the Major Outdoor Air Pollution Problems?
CONCEPT 18-2 Pollutants mix in the air to form industrial smog, mostly the result of burning coal, and photochemical smog, caused by motor vehicle, industrial, and power plant emissions.
▲
Air pollutants come from natural and human sources. Natural sources include dust blown by wind (Figure 7-1, p. 140), pollutants from wildfires and vol-canic eruptions, and volatile organic chemicals released by some plants. Most natural air pollutants are spread out over the globe or removed by chemical cycles, pre-cipitation, and gravity. However, chemicals emitted
Air Pollution Comes from Natural and Human SourcesAir pollution is the presence of chemicals in the at-mosphere in concentrations high enough to harm or-ganisms, ecosystems, or human-made materials. The effects of air pollution range from annoying to lethal.
CONCEPT 18-2 471
from volcanic eruptions and some natural forest fires can temporarily reach harmful levels in areas where they occur.
Human inputs of outdoor air pollutants occur mostly in industrialized and urban areas where peo-ple, cars, and factories are concentrated. Most of these pollutants are generated by the burning of fossil fuels in power and industrial plants (stationary sources, Fig-ure 1-11, p. 17) and in motor vehicles (mobile sources). However, human inputs began long before the indus-trial era, and have steadily increased. Air pollution is a very old problem (see Case Study that follows).
■ CASE STUDY
Air Pollution in the Past: The Bad Old DaysModern civilization did not invent air pollution. It prob-ably began when humans discovered fire and used it to burn wood in poorly ventilated caves for warmth and cooking, as they inhaled unhealthy smoke and soot.
During the Middle Ages, a haze of wood smoke hung over densely packed urban areas. The Industrial Revolu-tion, starting in the late 1700s, brought even worse air pollution as coal was burned to power factories and heat homes. As a result, there were great increases in respi-ratory diseases such as asthma, bronchitis, and allergies. Many people died from these ailments, especially chil-dren and elderly people.
By the 1850s, dense mixtures of coal smoke and fog as “thick as pea soup” engulfed London in a sunless gloom during winter months. In 1880, a prolonged coal fog killed an estimated 2,200 people. In 1905, a physi-cian used the word smog to describe the deadly mixture of smoke and fog that afflicted London. Another epi-sode in 1911 killed more than 1,100 Londoners.
In December 1952, an even worse yellow fog lasted for 5 days and killed 4,000–12,000 Londoners. Visibil-ity was so low that people walking outside during the day could not see their feet. So many people died that undertakers ran out of coffins.
This tragedy prompted the British Parliament to pass the Clean Air Act of 1956. Before the beneficial effects of the law could be realized, additional air pol-lution disasters in 1956, 1957, and 1962 killed 2,500 more people. Because of strong air pollution laws, Lon-don’s air today is much cleaner, and “pea soup” fogs are a thing of the past.
The Industrial Revolution, powered by coal, brought air pollution to the United States. Large industrial cities such as Pittsburgh, Pennsylvania, and St. Louis, Mis-souri, were known for their smoky air. By the 1940s, the air over some cities was so polluted that people had to turn their automobile headlights on during the day.
The first documented air pollution disaster in the United States occurred in October of 1948, in the small industrial town of Donora in Pennsylvania’s Monongahela River Valley south of Pittsburgh. Pollut-
ants from the area’s coal-burning factories, steel mill, zinc smelter, and sulfuric acid plant became trapped in a dense fog that stagnated over the valley for 5 days. This killer fog resulted from a combination of moun-tainous terrain surrounding the valley and weather conditions that trapped and concentrated deadly pol-lutants. About 6,000 of the town’s 14,000 inhabitants became sick, and 20 of them died.
In 1963, high concentrations of air pollutants in New York City killed about 300 people and injured thousands. Incidents like these finally resulted in city, state, and federal air pollution control programs in the United States, with the U.S. state of California leading the way. As a result, air quality has dramatically im-proved throughout the country.
However, many major urban areas in develop-ing countries, such as China (Figure 18-2), India (Fig-ure 15-13, p. 384), and parts of Eastern Europe that de-pend on burning coal in industries and in some homes face air pollution levels similar to those in London, England, and in American industrial cities in the 1950s.
THINKING ABOUTOutdoor Air Pollution—Past and Present
Explain why you agree or disagree with the statement: “Air pollution in the United States should no longer be a major concern because of the significant progress made in reducing outdoor air pollution since 1970.”
Some Pollutants in the Atmosphere Combine to Form Other PollutantsScientists classify outdoor air pollutants into two cat-egories. Primary pollutants are harmful chemicals emitted directly into the air from natural processes and human activities (Figure 18-4, center, p. 472). While in the atmosphere, some primary pollutants react with one another and with the basic components of air to form new harmful chemicals, called secondary pol-lutants (Figure 18-4, right).
With their high concentrations of cars and factories, urban areas normally have higher outdoor air pollution levels than rural areas have. But prevailing winds can spread long-lived primary and secondary air pollutants from urban and industrial areas to the countryside and to other urban areas.
Good news. Over the past 30 years, the quality of outdoor air in most developed countries has improved greatly. This occurred mostly because grassroots pres-sure from citizens caused governments to pass and en-force air pollution control laws.
Bad news. According to the World Health Organiza-tion (WHO), more than 1.1 billion people (one of every six people on the earth) live in urban areas where out-door air is unhealthy to breathe. Most of them live in densely populated cities in developing countries where air pollution control laws do not exist or are poorly en-forced. However, the biggest pollution threat to poor

472 CHAPTER 18 Air Pollution
people is indoor air pollution caused by their burning of wood, charcoal, coal, or dung in open fires or poorly designed stoves to heat their dwellings and cook their food. Also, they often must work in poorly ventilated and highly polluted spaces (Figure 18-5).
Air pollution was once a regional problem limited mostly to cities. Now it is a global problem, largely due to the sheer volume of pollutants produced. Pollut-ants entering the atmosphere in India and China now find their way across the Pacific where they affect the west coast of North America (Core Case Study). Even in arctic regions with vir-tually no population, air pol-lutants from northern Eurasia flow north and collect to form arctic haze. There is no place on the planet that has not been affected by air pollution.
What Are the Major Outdoor Air Pollutants?Carbon oxides. Carbon monoxide (CO) is a colorless, odorless, and highly toxic gas that forms during the in-complete combustion of carbon-containing materials (see Table 18-1). Major sources are motor vehicle ex-haust, burning of forests and grasslands, tobacco smoke, and open fires and inefficient stoves used for cooking.
Primary Pollutants
Sources
Secondary Pollutants
Natural
Mobile
Stationary
CO
Most hydrocarbons
Most suspended particles
CO2
SO2 NO NO2
SO3
HNO3 H2SO4
H2O2
Most NO3– and SO4
2– salts
O3 PANs
Figure 18-5 Indoor air pollution. These children are working in a plastic factory in an urban slum in Dhaka, Bangladesh. They have very long work-ing days in this highly polluted room with little ventilation. Jo
rgen
Sch
ytte
/Pet
er A
rnol
d, In
c.
Figure 18-4 Sources and types of air pollutants. Human inputs of air pollutants come from mobile sources (such as cars) and stationary sources (such as industrial and power plants). Some primary air pollutants react with one another and with other chemicals in the air to form secondary air pollutants.

CONCEPT 18-2 473
CO reacts with hemoglobin in red blood cells and reduces the ability of blood to transport oxygen to body cells and tissues. Chronic exposure can trigger heart attacks and aggravate lung diseases such as asthma and emphysema. At high levels, CO can cause head-ache, nausea, drowsiness, mental impairment, collapse, coma, and death. CO detectors, similar to smoke detec-tors, can warn people of dangerously high indoor levels of CO.
Carbon dioxide (CO2) is a colorless, odorless gas. About 93% of the CO2 in the atmosphere is the result of the natural carbon cycle (Figure 3-18, p. 68). The rest comes from human activities, mostly burning fossil fuels and clearing CO2-absorbing forests and grasslands. Such emissions have been rising since the industrial revolution and especially since 1950 (Figure 20, p. S71, in Supplement 10). There is considerable scientific evi-dence that increasing levels of CO2 from human ac-tivities are contributing to global warming and climate change (Science Focus, p. 33). We discuss this problem in detail in Chapter 19.
Nitrogen oxides and nitric acid. Nitric oxide (NO) is a colorless gas that forms when nitrogen and oxy-gen gas in air react at the high-combustion tempera-tures in automobile engines and coal-burning plants (Table 18-1). Lightning and certain bacteria in soil and water also produce NO as part of the nitrogen cycle (Figure 3-19, p. 69).
In the air, NO reacts with oxygen to form nitrogen dioxide (NO2), a reddish-brown gas. Collectively, NO and NO2 are called nitrogen oxides (NOx). Some of the NO2 reacts with water vapor in the air to form nitric acid (HNO3) and nitrate salts (NO3
�)—components of harmful acid deposition, which we discuss later in this chapter. Both NO and NO2 play a role in the formation of photochemical smog—a mix of chemicals formed un-der the influence of sunlight in cities with heavy traffic (discussed further below). Nitrous oxide (N2O), a green-house gas, is emitted from fertilizers and animal wastes and is produced by burning fossil fuels.
Nitrogen oxides can irritate the eyes, nose, and throat; aggravate lung ailments such as asthma and bronchitis; and increase susceptibility to respiratory infections by impairing the immune system. They can also suppress plant growth and reduce visibility when they are converted to nitric acid and nitrate salts.
Sulfur dioxide and sulfuric acid. Sulfur dioxide (SO2) is a colorless gas with an irritating odor. About one-third of the SO2 in the atmosphere comes from natural sources as part of the sulfur cycle (Figure 3-22, p. 72). The other two-thirds (and as much as 90% in some ur-ban areas) come from human sources, mostly combus-tion of sulfur-containing coal in electric power and in-dustrial plants (Table 18-1) and oil refining and smelting of sulfide ores. Sulfur dioxide emissions feeding the Asian Brown Cloud (Core Case Study) have
increased by over a third in the past decade, according to a 2007 U.S. National Academy of Sciences report.
In the atmosphere, SO2 can be converted to aerosols, which are microscopic suspended droplets of sulfuric acid (H2SO4) and suspended particles of sulfate (SO4
2�) salts that return to the earth as a component of acid deposition. Sulfur dioxide, sulfuric acid droplets, and sulfate particles reduce visibility and aggravate breath-ing problems. SO2 and H2SO4 can damage crops, trees, soils, and aquatic life in lakes. They also corrode metals and damage paint, paper, leather, and stone on build-ings and statues (Figure 18-6).
Table 18-1
Chemical Reactions That Form Major Outdoor Air Pollutants
Pollutant Chemical Reaction
Carbon monoxide (CO) 2C � O2 2CO
Carbon dioxide (CO2) C � O2 CO2
Nitric oxide (NO) N2 � O2 2 NO
Nitrogen dioxide (NO2) 2NO � O2 2NO2
Sulfur dioxide (SO2) S � O2 SO2
Figure 18-6 Statue in Newport, Rhode Island (USA), corroded by acid deposition and other forms of air pollution.
© L
ione
l Del
evin
gue/
Phot
otak
e

474 CHAPTER 18 Air Pollution
Particulates. Suspended particulate matter (SPM) con-sists of a variety of solid particles and liquid droplets small and light enough to remain suspended in the air for long periods. About 62% of the SPM in outdoor air comes from natural sources such as dust, wild fires, and sea salt. The remaining 38% comes from human sources such as coal-burning power and industrial plants, motor vehicles, plowed fields, road construc-tion, unpaved roads, and tobacco smoke.
Scientists are increasingly concerned about partic-ulates. More than 2,000 studies published since 1990 link SPM with adverse health effects, according to the American Lung Association. The most harmful forms of SPM are fine particles (PM-10, with an average diam-eter of less than 10 micrometers) and ultrafine particles (PM-2.5, with an average diameter of less than 2.5 mi-crometers, about one-fortieth the diameter of a human hair). These particles can irritate the nose and throat, damage the lungs, aggravate asthma and bronchitis, and shorten life. Toxic particulates, such as lead (Case Study, at right), cadmium, and polychlorinated biphe-nyls (PCBs, Case Study, p. 449), can cause mutations, reproductive problems, and cancer. Particulates also re-duce visibility, corrode metals, and discolor clothes and paints. In the United States, particulate air pollution—mostly from fine and ultrafine particles—is responsible for 60,000–70,000 premature deaths a year, according to the U.S. Environmental Protection Agency (EPA) and the Harvard School of Public Health.
Ozone. Ozone (O3), a colorless and highly reactive gas, is a major component of photochemical smog. It can cause coughing and breathing problems, aggravate lung and heart diseases, reduce resistance to colds and pneumonia, and irritate the eyes, nose, and throat. It also damages plants, rubber in tires, fabrics, and paints.
Ozone in the troposphere near ground level is often referred to as “bad” ozone, whereas we think of ozone in the stratosphere as “good” ozone that protects us from harmful UV radiation. Both are the same chemi-cal. Much evidence indicates that some human activi-ties are decreasing the amount of beneficial ozone in the stratosphere and increasing the amount of harmful ozone in the troposphere near ground level—especially in some urban areas. We examine the issue of strato-spheric ozone thinning in the next chapter.
Volatile organic compounds (VOCs). Organic com-pounds that exist as gases in the atmosphere are called volatile organic compounds (VOCs). Most are hydrocar-bons, such as isoprene (C3H8) and terpenes such as C10H15 emitted by the leaves of many plants, and methane (CH4), a greenhouse gas. About a third of global meth-ane emissions come from natural sources, mostly plants, wetlands, and termites. The rest comes from human sources, primarily rice paddies, landfills, oil and natural gas wells, and cows (mostly from their belching).
Other VOCs, including benzene, vinyl chloride, and trichloroethylene (TCE), are used as industrial sol-vents, dry-cleaning fluids, and components of gasoline, plastics, drugs, synthetic rubber, and other products. Benzene (C6H6) is found in motor vehicle and power plant emissions and tobacco smoke. Long-term expo-sure to benzene can cause leukemia, numerous blood disorders, and immune system damage. Short-term ex-posure to high levels can cause dizziness, unconscious-ness, and death. Scientists use a variety of methods to detect the presence and concentrations of air pollutants (Science Focus, at right).
■ CASE STUDY
Lead Is a Highly Toxic PollutantBecause it is a chemical element, lead (Pb) does not break down in the environment. This potent neurotoxin can harm the nervous system, especially in young chil-dren. Each year, 12,000–16,000 American children un-der age 9 are treated for acute lead poisoning, and about 200 die. About 30% of the survivors suffer from palsy, partial paralysis, blindness, and mental retardation.
Children under age 6 and unborn fetuses even with low blood levels of lead are especially vulnerable to nervous system impairment, lowered IQ (by an aver-age of 7.4 points), shortened attention span, hyperac-tivity, hearing damage, and various behavior disorders. A 1993 study by the U.S. National Academy of Sciences and numerous other studies indicate there is no safe level of lead in children’s blood.
Good news. Between 1976 and 2000, the percentage of U.S. children ages 1–5 with blood lead levels above the safety standard dropped from 85% to 2.2%; at least 9 million childhood lead poisonings were prevented. The primary reason for this drop was that government regulations banned leaded gasoline in 1976 (with a complete phase-out by 1986) and lead-based paints in 1970 (but illegal use continued until about 1978). This is an excellent example of the effectiveness of pollution prevention.
But the U.S. Centers for Disease Control and Pre-vention estimates that at least 310,000 U.S. children still have unsafe blood levels of lead caused by expo-sure to a number of sources. Major sources are particles of peeling lead-based paint found in about 38 million houses built in the United States before 1960 and lead-contaminated dust in deteriorating buildings.
In 2007, major U.S. toy companies had to recall vari-ous toys made in China that contained lead paint. Also in 2007, tests revealed that almost two-thirds of the red, long-lasting lipsticks manufactured in the United States contained surprisingly high levels of lead, although none of them listed lead as an ingredient.* Lead can also
*Here is a way to test a lipstick for lead. Put some on your hand and scratch it with a gold ring. If the lipstick color changes to black, it contains lead.

CONCEPT 18-2 475
leach from water pipes and faucets that contain it. And in 2008, Brian Schwartz and other researchers at Johns Hopkins University reported that high lifetime expo-sure to lead appears to decrease mental functions, like verbal and visual memory and language ability, in older people.
Health scientists have proposed a number of ways to help protect children from lead poisoning, as listed in Figure 18-7 (p. 476). Although the threat from lead has been greatly reduced in the United States, this is not the case in many developing countries. About 80% of the gasoline sold in the world today is unleaded, but about 100 countries still use leaded gasoline. The WHO estimates that 130 million–200 million children around the world are at risk from lead poisoning, and
15 million–18 million children in developing countries have permanent brain damage because of lead poison-ing—mostly because of the use of leaded gasoline in their countries.
Environmental and health scientists call for global bans on leaded gasoline and lead-based paints. Some good news is that China recently phased out leaded gasoline in less than 3 years.
THINKING ABOUTReductions in Lead Poisoning
Why do you think the decline in lead poisoning in the United States since 1976 is such an excellent example of the power of pollution prevention?
SCIENCE FOCUS
Detecting Air Pollutants
tists discovered sulfur dioxide pollution on Isle Royale, Michigan (USA) in Lake Superior, an island where no car or smoke-stack has ever intruded. They used Evernia lichens to point the finger northward to coal-burning facilities at Thunder Bay, Ontario, Canada.
Critical ThinkingLook for lichens on rocks, trees, and build-ings in the area where you live or go to school. What do they indicate about air pollution levels?
continually absorb air as a source of nour-ishment. A highly polluted area around an industrial plant may have only gray-green crusty lichens or none at all. An area with moderate air pollution may have orange crusty lichens on outdoor walls. Walls and trees in areas with fairly clean air can support leafy lichens.
Some lichen species are sensitive to specific air-polluting chemicals. Old man’s beard (Usnea trichodea, Figure 18-A, left) and yellow Evernia lichens, for ex-ample, sicken or die in the presence of excess sulfur dioxide, even if the pollutant originates far away. For example, scien-
he presence of pollutants in the air can be detected with
the use of chemical instruments and satel-lites. The scientists who discovered the com-ponents and effects of the Asian Brown Cloud (Figure 18-1, Core Case Study) used small unmanned aircraft and miniaturized instruments to study the cloud. The aircraft flew in stacked formations and measured chemical concen-trations and temperatures at different altitudes.
Aerodyne Research in the U.S. city of Boston, Massachusetts, has developed a mobile laboratory that uses sophisticated instruments to make instant measurements of primary and secondary air pollutants from motor vehicles, factories, and other sources. It also records how their concentrations change throughout a day or under different weather conditions (see The Habitable Planet, Video 11, at www.learner.org/resources/series209.html). In addition to providing real-time measurements of key air pollutants, the mobile van can measure the effectiveness of various air pollution control devices used in cars, trucks, and buses.
Scientists are also using nanotechnology (Science Focus, p. 362) to try to develop in-expensive nanodetectors for various air pol-lutants. Another way to detect air pollutants is through biological indicators, including lichens (Figure 18-A).
A lichen consists of a fungus and an alga living together, usually in a mutually beneficial (mutualistic) relationship. These hardy pioneer species are good biologi-cal indicators of air pollution because they
T
Figure 18-A Natural capital: Old man’s beard (Usnea trichodea) lichen growing on a branch of a larch tree in Gifford Pinchot National Park, Washington (USA) (left) and red and yellow crustose lichens growing on slate rock in the foothills of the Sierra Nevada near Merced, California (USA) (right). The vulnerability of various lichen species to specific air pollutants can help researchers detect levels of these pollutants and track down their sources.
Milt
on R
and/
Tom
Sta
ck &
Ass
ocia
tes
Gera
ld &
Buf
f Cor
si/V
isua
ls U
nlim
ited

476 CHAPTER 18 Air Pollution
Burning Coal Produces Industrial SmogFifty years ago, cities such as London, England, and the U.S. cities of Chicago, Illinois, and Pittsburgh, Pennsyl-vania, burned large amounts of coal in power plants, factories, and homes. People in such cities, especially during winter, were exposed to industrial smog con-sisting mostly of sulfur dioxide, suspended droplets of sulfuric acid, and a variety of suspended solid particles.
The chemistry of industrial smog is fairly simple. When burned, most of the carbon in coal and oil is converted to carbon monoxide (CO) and carbon diox-ide (CO2). Unburned carbon in coal also ends up in the atmosphere as suspended particulate matter (soot).
When coal and oil are burned (Figure 18-8), the sul-fur compounds they contain react with oxygen to pro-duce sulfur dioxide (SO2) gas, some of which reacts with water vapor and is converted to tiny suspended drop-lets of sulfuric acid (H2SO4). Some of these droplets react with ammonia (NH3) in the atmosphere to form solid particles of ammonium sulfate [(NH4)2SO4]. The sus-pended particles of such salts and soot give the result-
ing smog a gray color (Figure 18-2, Core Case Study), which is why it is sometimes called gray-air smog (Concept 18-2).
Today, urban industrial smog is rarely a problem in most developed countries where coal and heavy oil are burned only in large boilers with reasonably good pollution control or with tall smokestacks that trans-fer the pollutants to downwind rural areas. However, industrial smog remains a problem in industrialized urban areas of China, India (Figure 15-13, p. 384), Ukraine, and some eastern European countries, where large quantities of coal are still burned in houses, power plants, and factories with inadequate pollution controls. This is contributing to the gigantic Asian pol-lution cloud (Core Case Study).
Because of its heavy reliance on coal, China has some of the world’s highest levels of industrial smog and 16 of the world’s 20 most polluted cities. In 2007, China’s State Environmental Protection Admin-istration (SEPA) reported that 62% of China’s cities were plagued by industrial smog and that each year, air pollution prematurely kills 358,000 Chinese—an average of 981 deaths per day. However, a 2007 study by the World Bank puts the annual death toll from air pollution in China at about 750,000 people a year, about 500,000 of them from outdoor air pollution and 250,000 from indoor air pollution (mostly from burn-ing coal for heating and cooking).
Sunlight Plus Cars Equals Photochemical SmogA photochemical reaction is any chemical reaction acti-vated by light. Photochemical smog is a mixture of
Replace lead pipes and plumbing fixtures containing lead solder
Remove leaded paint and lead dust from older houses and apartments
Sharply reduce lead emissions from incinerators
Remove lead from TV sets and computer monitors before incineration or land disposal
Test for lead in existing ceramicware used to serve food
Test existing candles for lead
Wash fresh fruits and vegetables
Phase out leaded gasoline worldwide
Phase out waste incineration
Ban use of lead solder
Ban use of lead in computer and TV monitors
Ban lead glazing for ceramicware used to serve food
Ban candles with lead cores
Test blood for lead by age 1
Prevention Control
S O L U T I O N SLead Poisoning
Figure 18-7 Ways to help protect children from lead poisoning. Question: Which two of these solutions do you think are the most important? Why?
Oxygen (O2)
Water vapor (H2O)
Ammonia (NH3)
Sulfur (S) incoal and oil
Burning coal and oil
Carbon (C) incoal and oil
Oxygen (O2)
Sulfur dioxide (SO2)
Carbon monoxide (CO)and
carbon dioxide (CO2)Sulfur trioxide (SO3)
Sulfuric acid (H2SO4)
Ammonium sulfate [(NH4)2SO4]
Figure 18-8 How pollutants are formed from burning of coal and oil. The result is industrial smog (Concept 18-2).
CONCEPT 18-2 477
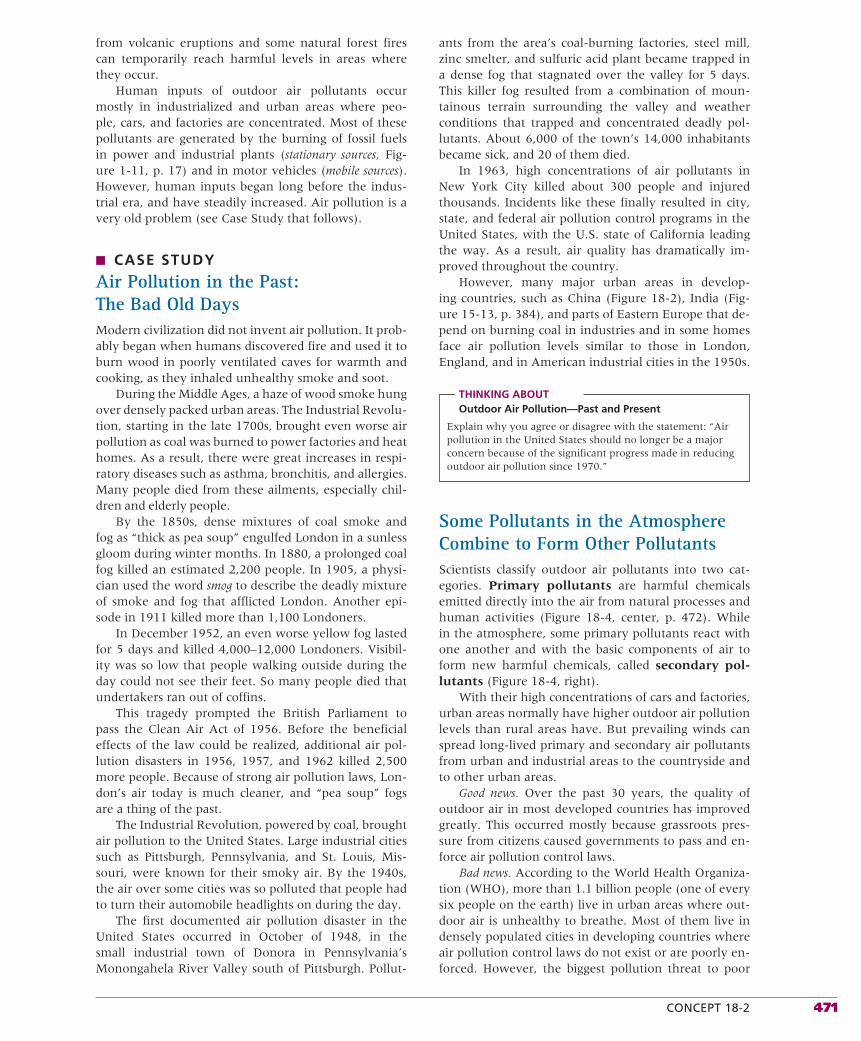
primary and secondary pollutants formed under the in-fluence of UV radiation from the sun. In greatly simpli-fied terms,
ground level ozone (O3)
� other photochemical
VOCs � NOx � heat � sunlight oxidants
� aldehydes
� other secondary
pollutants
The formation of photochemical smog (Figure 18-9) begins when exhaust from morning commuter vehi-cles releases large amounts of NO and VOCs into the air over a city. The NO is converted to reddish-brown NO2, explaining why photochemical smog is sometimes called brown-air smog. When exposed to ultraviolet ra-diation from the sun, some of the NO2 reacts in com-plex ways with VOCs released by certain trees (such as some oak species, sweet gums, and poplars), mo-tor vehicles, and businesses (such as bakeries and dry cleaners).
The resulting photochemical smog is a mixture of ozone, nitric acid, aldehydes, peroxyacyl nitrates (PANs), and other secondary pollutants. Collectively, NO2, O3, and PANs in this chemical brew are called pho-tochemical oxidants because these damaging chemicals can react with and oxidize certain compounds in the at-mosphere or inside your lungs.
Hotter days lead to higher levels of ozone and other components of smog. As traffic increases on a sunny day, photochemical smog (dominated by ozone) usu-ally builds up to peak levels by late morning, irritating people’s eyes and respiratory tracts.
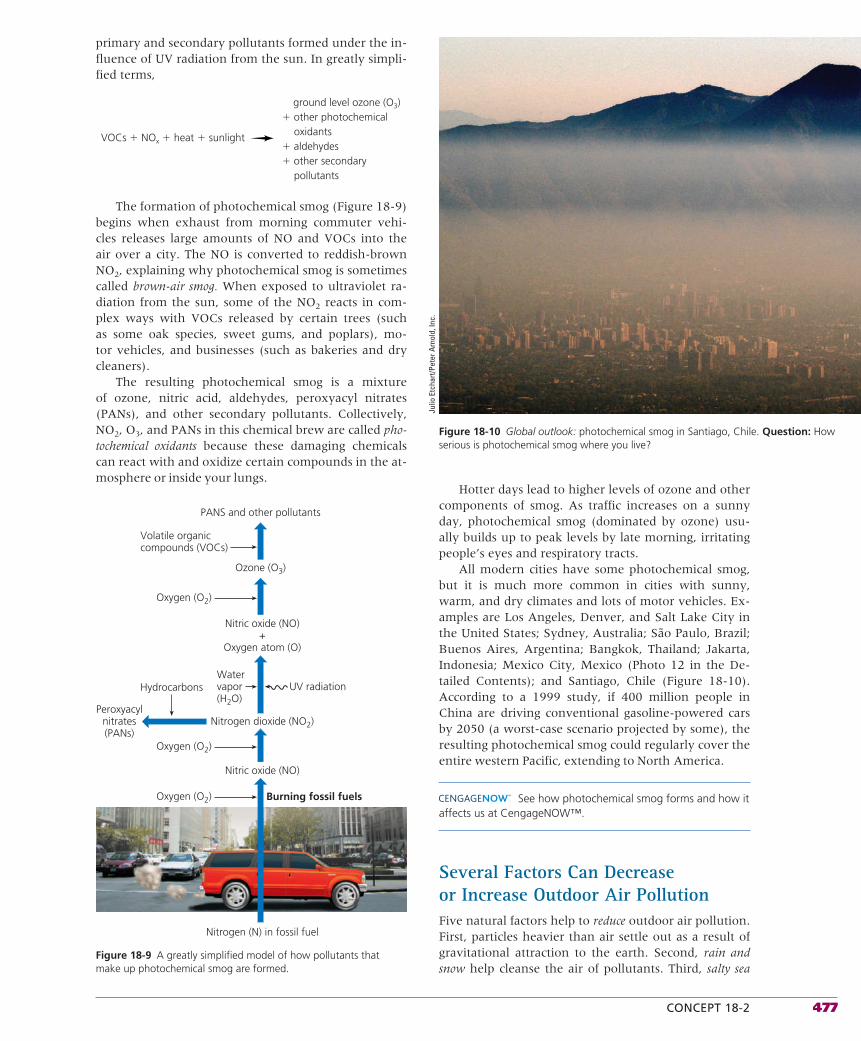
All modern cities have some photochemical smog, but it is much more common in cities with sunny, warm, and dry climates and lots of motor vehicles. Ex-amples are Los Angeles, Denver, and Salt Lake City in the United States; Sydney, Australia; São Paulo, Brazil; Buenos Aires, Argentina; Bangkok, Thailand; Jakarta, Indonesia; Mexico City, Mexico (Photo 12 in the De-tailed Contents); and Santiago, Chile (Figure 18-10). According to a 1999 study, if 400 million people in China are driving conventional gasoline-powered cars by 2050 (a worst-case scenario projected by some), the resulting photochemical smog could regularly cover the entire western Pacific, extending to North America.
See how photochemical smog forms and how it affects us at CengageNOW™.
Several Factors Can Decrease or Increase Outdoor Air PollutionFive natural factors help to reduce outdoor air pollution. First, particles heavier than air settle out as a result of gravitational attraction to the earth. Second, rain and snow help cleanse the air of pollutants. Third, salty sea
Oxygen (O2)
UV radiation
Nitrogen (N) in fossil fuel
Burning fossil fuels
Nitric oxide (NO)
Nitrogen dioxide (NO2)Peroxyacyl
nitrates(PANs)
Oxygen (O2)
Watervapor(H2O)
Hydrocarbons
Oxygen (O2)
Nitric oxide (NO)+
Oxygen atom (O)
Ozone (O3)
Volatile organiccompounds (VOCs)
PANS and other pollutants
Figure 18-9 A greatly simplified model of how pollutants that make up photochemical smog are formed.
Figure 18-10 Global outlook: photochemical smog in Santiago, Chile. Question: How serious is photochemical smog where you live?
Julio
Etc
hart/
Pete
r Arn
old,
Inc.

478 CHAPTER 18 Air Pollution
spray from the oceans wash out much of the particulates and other water-soluble pollutants from air that flows from land over the oceans. Fourth, winds sweep pollut-ants away, diluting them by mixing them with cleaner air, and bringing in fresh air. Fifth, some pollutants are removed by chemical reactions. For example, SO2 can re-act with O2 in the atmosphere to form SO3, which re-acts with water vapor to form droplets of H2SO4 that fall out of the atmosphere as acid precipitation.
Six other factors can increase outdoor air pollution. First, urban buildings can slow wind speed and reduce dilution and removal of pollutants. Second, hills and mountains can reduce the flow of air in valleys below them (Figure 18-10) and allow pollutant levels to build up at ground level. Third, high temperatures promote the chemical reactions leading to photochemical smog formation, which means that global warming could in-crease photochemical smog in many of the world’s cit-ies. Fourth, emissions of volatile organic compounds (VOCs) from certain trees and plants such as some oak species, sweet gums, poplars, and kudzu (Figure 9-15, p. 200) in heavily wooded urban areas can play a large role in the formation of photochemical smog.
A fifth factor—the so-called grasshopper effect—oc-curs when volatile air pollutants are transported by evaporation and winds from tropical and temperate ar-eas through the atmosphere to the earth’s polar areas, where they are deposited. This happens mostly during winter. It explains why, for decades, pilots have re-ported seeing dense layers of reddish-brown haze over the Arctic. It also explains why polar bears, sharks, and other top carnivores and native peoples in remote arctic areas have high levels of toxic pollutants in their bodies.
Sixth, temperature inversions can cause pollutants to build to high levels. During daylight, the sun warms the air near the earth’s surface. Normally, this warm air and most of the pollutants it contains rise to mix and
disperse the pollutants with the cooler air above it. Un-der certain atmospheric conditions, however, a layer of warm air can temporarily lie atop a layer of cooler air nearer the ground. This is called a temperature inver-sion. Because the cooler air is denser than the warmer air above it, the air near the surface does not rise and mix with the air above. This allows pollutants to build up in the stagnant layer of cool air near the ground.
Two types of areas are especially susceptible to pro-longed temperature inversions. The first is a town or city located in a valley surrounded by mountains where the weather turns cloudy and cold during part of the year (Figure 18-11, left). In such a case, the surround-ing mountains and the clouds block much of the winter sunlight that causes air to heat and rise, and the moun-tains block the wind. As long as these stagnant condi-tions persist, pollutants in the valley below will build up to harmful and even lethal concentrations. The tragic pollution event in Donora, Pennsylvania (Case Study, p. 471), was partly the result of such a tempera-ture inversion.
The other type of area vulnerable to temperature inversions is a city with several million motor vehicles in an area with a sunny climate, light winds, moun-tains on three sides, and an ocean on the other side (Figure 18-11, right). Here, the conditions are ideal for photochemical smog worsened by frequent ther-mal inversions, and the surrounding mountains pre-vent the polluted surface air from being blown away by sea breezes. This describes the U.S. state of California’s heavily populated Los Angeles basin, which has pro-longed temperature inversions, mostly during summer and fall.
Learn more about thermal inversions and what they can mean for people in some cities at CengageNOW.
Sea breeze
Increasingaltitude
Decreasing temperature
Descending warm air massWarmer air
Inversion layerInversion layer
Figure 18-11 A temperature inversion, in which a warm air layer sits atop a cooler air layer, can take place in either of two sets of topography and weather conditions. Air pollutants can build to harmful levels during an inversion, which can occur during cold, cloudy weather in a valley surrounded by mountains (left). Frequent and prolonged temperature inversions can also occur in an area with a sunny climate, light winds, mountains on three sides, and the ocean on the other (right). A layer of descending warm air from a high-pressure system prevents ocean-cooled air near the ground from ascending enough to disperse and dilute pollutants. Because of their topography, Los An-geles, California (USA), and Mexico City, Mexico, have frequent temperature inversions, many of them prolonged, during the summer and fall.

CONCEPT 18-3 479
18-3 What Is Acid Deposition and Why Is It a Problem?
CONCEPT 18-3 Acid deposition is caused mainly by coal-burning power plant and motor vehicle emissions, and in some regions, threatens human health, aquatic life and ecosystems, forests, and human-built structures.
▲
Acid Deposition Is a Serious Regional Air Pollution ProblemMost coal-burning power plants, ore smelters, and other industrial plants in developed countries use tall smokestacks to emit sulfur dioxide, suspended particles, and nitrogen oxides high into the atmosphere where wind can mix, dilute, and disperse them.
These tall smokestacks reduce local air pollution, but can increase regional air pollution downwind. The primary pollutants (sulfur dioxide and nitrogen oxides) emitted high into the troposphere may be transported as far as 1,000 kilometers (600 miles) by prevailing winds. During their trip, they form secondary pollut-ants such as droplets of sulfuric acid (H2SO4), nitric acid vapor (HNO3), and particles of acid-forming sulfate (SO4
2�) and nitrate (NO3�) salts.
These acidic substances remain in the atmosphere for 2–14 days, depending mostly on prevailing winds, precipitation, and other weather patterns. During this period, they descend to the earth’s surface in two forms: wet deposition consisting of acidic rain, snow, fog,
and cloud vapor with a pH less than 5.6* and dry deposi-tion consisting of acidic particles. (See Figure 5, p. S41, in Supplement 6.) The resulting mixture is called acid deposition (Figure 18-12)—sometimes termed acid rain. Most dry deposition occurs within 2–3 days fairly near the emission sources, whereas most wet depo-sition takes place within 4–14 days in more distant downwind areas.
Acid deposition has been occurring since the In-dustrial Revolution. In 1872, British chemist Robert A. Smith coined the term acid rain after observing that rain was eating away stone in the walls of buildings in ma-jor industrial areas. Acid deposition occurs when hu-man activities disrupt the natural nitrogen and sulfur cycles (Figures 3-19, p. 69, and 3-22, p. 72) by adding excessive amounts of nitrogen oxides and sulfur diox-ide to the atmosphere.
Acid deposition is a regional air pollution prob-lem (Concept 18-3) in areas that lie downwind from coal-burning facilities and in urban areas with large
Active Figure 18-12 Natural capital degradation: acid deposition, which consists of rain, snow, dust, or gas with a pH lower than 5.6, is commonly called acid rain. Soils and lakes vary in their ability to neutralize excess acidity. See an animation based on this figure at CengageNOW. Question: What are three ways in which your daily activities contribute to acid deposition?
Wind
Transformation tosulfuric acid (H2SO4)and nitric acid (HNO3)
Wet acid depostion(droplets of H2SO4 andHNO3 dissolved in rainand snow)
Windborne ammonia gasand some soil particles partiallyneutralize acids and form drysulfate and nitrate salts
Dry acid deposition(sulfur dioxide gasand particles ofsulfate and nitrate salts)
Lakes in deepsoil high in limestoneare buffered
Lakes in shallow soillow in limestonebecome acidic
Sulfur dioxide(SO2) and NO
Nitric oxide (NO)
Acid fog
* Unpolluted rain is acidic with a pH of about 5.6 because of the reaction of CO2 and water to form carbonic acid (H2CO3).

480 CHAPTER 18 Air Pollution
numbers of motor vehicles. Such areas include the east-ern United States and other parts of the world shown in Figure 18-13. In some areas, soils contain basic com-pounds (Figure 5, p. S41, in Supplement 6) such as calcium carbonate (CaCO3) or limestone that can react with and neutralize, or buffer, some inputs of acids. The areas most sensitive to acid deposition are those with thin, acidic soils that provide no such natural buffer-ing (Figure 18-13, green and most red areas) and those where the buffering capacity of soils has been depleted by decades of acid deposition.
In the United States, older, coal-burning power and industrial plants without adequate pollution controls in the Midwest emit the largest quantities of sulfur dioxide and other pollutants that cause acid deposition. Because of these emissions, and those of motor vehicles and other urban sources, typical precipitation in the eastern United States is at least 10 times more acidic than natu-ral precipitation is. (Figure 14, p. S9, in Supplement 2 is a map of pH values in the continental United States in 2005.) Some mountaintop forests in the eastern United States and east of Los Angeles, California, are bathed in fog and dews as acidic as lemon juice—with about 1,000 times the acidity of normal precipitation.
Many acid-producing chemicals generated in one country are exported to other countries by prevailing winds. For example, acidic emissions from the United Kingdom and Germany blow into Switzerland, Austria, Norway, and neighboring countries. Some SO2 and
other emissions from coal-burning power and indus-trial plants in the United States end up in southeastern Canada.
The worst acid deposition occurs in Asia, especially in China, which gets 70% of its total energy and 80% of its electricity from burning coal. According to its government, China is the world’s top emitter of SO2. The resulting acid precipitation is damaging crops and threatening food security in China, Japan, and North and South Korea. In addition, air pollution that con-tributes to acid deposition is produced by the greatly increased use of cheap diesel generators to provide electricity for rural villages and to run irrigation pumps in China, India, and other developing countries. All of this contributes to the Asian Brown Cloud (Core Case Study).
Learn more about the sources of acid deposi-tion, how it forms, and what it can do to lakes and soils at CengageNOW.
Acid Deposition Has a Number of Harmful EffectsAcid deposition causes harm in several ways. It con-tributes to human respiratory diseases, and damages statues (Figure 18-6), national monuments, buildings,
Potential problem areas because of sensitive soils
Potential problem areas because of air pollution:emissions leading to acid deposition
Current problem areas (including lakes and rivers)
Figure 18-13 Regions where acid deposition is now a problem and regions with the potential to develop this prob-lem (Concept 18-3). Such regions have large inputs of air pollution (mostly from power plants, industrial plants, and ore smelters) or are sensitive areas with soils and bedrock that cannot neutralize (buffer) inputs of acidic com-pounds. Question: Do you live in or near an area that is affected by acid deposition or any area that is likely to be affected by acid deposition in the future? (Data from World Resources Institute and U.S. Environmental Protection Agency)

CONCEPT 18-3 481
metals, and car finishes. Also, acidic particles in the air can decrease visibility.
One of the most alarming and often unseen effects of acid deposition is that it can leach toxic metals (such as lead and mercury) from soils and rocks into lakes used as sources of drinking water. These toxic metals can accumulate in the tissues of fish eaten by people, other mammals, and birds. Currently, 45 U.S. states have issued statements warning people (especially pregnant women) not to eat fish caught from some of their waters because of mercury contamination (Fig-ure 17-A, p. 450).
THINKING ABOUTAcid Deposition and Mercury
Do you live in or near an area where government officials have warned people not to eat fish caught from waters con-taminated with mercury? If so, what do you think are the specific sources of the mercury pollution?
Acid deposition harms aquatic ecosystems. Most fish cannot survive in water with a pH less than 4.5. Acid deposition can also release aluminum ions (Al3�), which are attached to minerals in nearby soil, into lakes. These ions asphyxiate many kinds of fish by stimulating excessive mucus formation, which clogs their gills.
Because of excess acidity, several thousand lakes in Norway and Sweden contain no fish, and many more
lakes there have lost most of their acid-neutralizing capacity. In Ontario, Canada, at least 1,200 acidified lakes contain few if any fish, and fish populations in thousands of other lakes are declining because of in-creased acidity. In the United States, several hundred lakes (most in the Northeast) are threatened in this way. And scientists are just beginning to study the ef-fects of the Asian Brown Cloud on oceans (Core Case Study). Aerosols in the cloud get pulled into thunderstorms that dump acid rain into the Indian and Pacific Oceans, possibly harming marine life and ecosystems.
Acid deposition (often along with other air pollut-ants such as ozone) can harm crops, especially when the soil pH is below 5.1. It reduces plant productivity and the ability of soils to buffer or neutralize acidic inputs. An estimated 30% of China’s cropland suffers from excess acidity.
Acid deposition can affect forests by leaching es-sential plant nutrients, such as calcium and mag-nesium, from soils and releasing ions of aluminum, lead, cadmium, and mercury, which are toxic to the trees (Figure 18-14). This rarely kills trees directly, but it can weaken them and leave them vulnerable to stresses such as severe cold, diseases, insect attacks, and drought.
Mountaintop forests are the terrestrial areas hard-est hit by acid deposition (see photo insert in Fig-ure 18-14). These areas tend to have thin soils without
Aciddeposition
SO2
H2O2
PANs
NOx
O3
Others
Lake
GroundwaterGroundwaterGroundwater
Emissions
Tree death
Reduced photosynthesis and growth
Reduced nutrient and water uptake
Root damage
Increased susceptibility to drought, extreme cold, insects, mosses, and disease organisms
Release of toxic metal ions
Soil acidification
AcidsLeaching of soil nutrients
Direct damage to leaves and bark
Active Figure 18-14 Natural capital degradation: Air pollu-tion is one of several interacting stresses that can damage, weaken, or kill trees and pollute surface and groundwater. The photo insert shows air pollution dam-age to trees at a high elevation in Mount Mitchell State Park, North Carolina (USA). See an animation based on this figure at CengageNOW.
Caro
lina
Biol
ogic
al/V
isua
ls U
nlim
ited

482 CHAPTER 18 Air Pollution
much buffering capacity. And trees on mountaintops (especially conifers such as red spruce and balsam fir) are bathed almost continuously in highly acidic fog and clouds. However, uncontrolled emissions of sulfur di-oxide and other pollutants can devastate the vegetation in an area.
Examine how acid deposition can harm a pine forest and what it means to surrounding land and waters at CengageNOW.
Most of the world’s forests and lakes are not being de-stroyed or seriously harmed by acid deposition. Rather, this regional problem is harming forests and lakes that lie downwind from large car-dominated cities and from coal-burning facilities without adequate pollution con-trols (Concept 18-3). Also, acid deposition has not re-duced overall tree growth in the vast majority of for-ests in the United States and Canada, partly because of significant reductions in SO2 and NOx emissions from coal-fired power and industrial plants under 1990 amendments to the U.S. Clean Air Act.
However, acid deposition has accelerated the leach-ing of plant nutrients from soils in some areas, which has hindered tree growth, as researchers found in the on-going Hubbard Brook studies (see Science Focus, above, and the Chapter 2 Core Case Study, p. 28). Sci-entists estimate that an additional 80% reduction in SO2 emissions from coal-burning power and industrial
plants in the midwestern United States will be needed before northeastern lakes, forests, and streams can re-cover from past and projected effects of acid deposition.
RESEARCH FRONTIER
Learning more about the extent and effects of acid deposi-tion throughout the world. See academic.cengage.com/biology/miller.
We Know How to Reduce Acid DepositionFigure 18-15 summarizes ways to reduce acid deposi-tion. According to most scientists studying the problem, the best solutions are prevention approaches that reduce or eliminate emissions of sulfur dioxide, nitrogen ox-ides, and particulates.
Controlling acid deposition is politically difficult. One problem is that the people and ecosystems it affects often are quite distant from those who cause the prob-lem. Also, countries with large supplies of coal (such as China, India, Russia, and the United States) have a strong incentive to use it as a major energy resource. Owners of coal-burning power plants resist taking mea-sures such as adding the latest pollution control equip-ment, using low-sulfur coal, or removing sulfur from coal before burning it. They argue that these precautions would increase the cost of electricity for consumers.
SCIENCE FOCUS
Revisiting Hubbard Brook to Study Effects of Acid Deposition
several years. But in 2003, they found that during the winter, red spruce trees in the untreated forest lost about three times more of their needles than did the red spruce in the calcium-treated forest.
These studies support the hypothesis that trees do not suffer from direct con-tact with acid precipitation, but rather from in sufficient nutrients in depleted soil (Figure 18-14). The researchers also con-cluded that, in order for damaged forests to recover, their soil nutrients must be restored, and that it could take decades for natural processes to repair the damage to these for-ests from acid precipitation.
Critical ThinkingExplain why it will take decades for natural processes to repair forests damaged by acid precipitation? (Hint: think about nutrient cycling, see Section 3-5, p. 65.)
The scientists first turned to data they had collected since the 1950s and found that, since that time, most of the calcium ions (Ca2�) in the soils had been leached into streams, which carried them away. They hypothesized that acid rain and snow had stripped the soils of these nutrients, and that, by the 1990s, this had essentially stopped the growth of trees and other vegetation.
In 1998, Likens and his team began a new experiment to further test this hypoth-esis. For 2 years, they made measurements in control and experimental forests (Fig-ure 2-1, p. 28). Then they used a helicopter to drop quantities of a calcium salt into the experimental forest to add calcium to the soil. Subsequent examination of the soil showed that soil nitrate concentrations increased sig-nificantly, along with soil pH (showing lower soil acidity) in the experimental forest. The researchers projected that changes to plant growth patterns would not be recorded for
n the Core Case Study for Chapter 2 (p. 28), we discussed controlled ex-
periments by scientists in the Hubbard Brook Experimental Forest in the White Mountains of the northeastern U.S. state of New Hampshire—an area where forests are suffering the effects of acid deposition.
Ecologist Gene Likens and his colleagues considered the effects of acid deposition on the experimental forest. They noticed that after SO2 and particulate levels in the atmosphere declined as a result of pollution controls mandated by the Clean Air Acts, damaged trees in the forest did not recover as expected. One hypothesis they considered to explain this was that nutrients required for tree health and growth—particularly cal-cium and magnesium—had been stripped from the soil by acid precipitation. It takes decades for soil to rebuild these nutrients, which would explain the lag in recovery of the trees.
I

CONCEPT 18-4 483
Environmental scientists counter that affordable and much cleaner resources are available to produce elec-tricity, including wind, hydropower, and natural gas. They also point out that the largely hidden health and environmental costs of burning coal are up to five times its market price (Table 16-1, p. 416). Including these costs in the market prices of coal would reduce coal use, spur the use of cleaner ways to generate electricity, help to prevent acid deposition, and reduce CO2 emissions.
As for technological fixes, large amounts of lime-stone or lime are used to neutralize some acidified lakes and surrounding soil—the only cleanup approach now being used. However, this expensive and tempo-rary remedy usually must be repeated annually. Also, it can kill some types of plankton and aquatic plants and can harm wetland plants that need acidic water. And it is difficult to know how much lime to put where (in the water or at selected locations on the ground). In 2002, researchers in England found that adding a small amount of phosphate fertilizer can neutralize excess acidity in a lake. The effectiveness of this approach is being evaluated.
Air pollution laws in the United States have reduced the acidity of rainfall in parts of the northeast, mid-At-lantic, and midwest regions, but there is still a long way to go in reducing emissions from older coal-burning power and industrial plants. Some plants have lowered SO2 emissions by switching from high-sulfur to low-sulfur coals. However, this has increased CO2 emissions that contribute to global warming, because low-sulfur coal has a lower heat value, which means that more coal must be burned to generate a given amount of electric-ity. Low-sulfur coal also has higher levels of toxic mer-cury and other trace metals, so burning it emits more of these hazardous chemicals into the atmosphere.
THINKING ABOUTLow-Sulfur Coal
Do you think that the advantages of burning low-sulfur coal outweigh the disadvantages? Explain. Are there better options?
S O L U T I O N SAcid Deposition
Add lime to neutralizeacidified lakes
Add phosphatefertilizer to neutralizeacidified lakes
Reduce coal use
Burn low-sulfur coal
Increase natural gas use
Increase use of renewable energy resources
Remove SO2 particulatesand NOx from smokestack gases
Remove NOx from motor vehicular exhaust
Tax emissions of SO2
Reduce air pollution by improving energy efficiency
Prevention Cleanup
Figure 18-15 Methods for reducing acid deposition and its damage. Question: Which two of these solutions do you think are the most important? Why?
18-4 What Are the Major Indoor Air Pollution Problems?
CONCEPT 18-4 The most threatening indoor air pollutants are smoke and soot from wood and coal cooking fires (a hazard found mostly in developing countries) and chemicals used in building materials and products.
Indoor Air Pollution Is a Serious ProblemIn developing countries, the indoor burning of wood, charcoal, dung, crop residues, coal, and other cook-ing and heating fuels in open fires or in unvented or poorly vented stoves exposes people to dangerous lev-els of particulate air pollution. And workers, including children (Figure 18-5), can be exposed to high levels of indoor air pollution where there are few if any laws or regulations for controlling such pollution. According to
the WHO and the World Bank, indoor air pollution is, for poor people, the world’s most serious air pollution problem. This is a glaring example of the relationship between poverty, environmental quality, and human health.
Indoor air pollution is also a serious problem in de-veloped countries. If you live in such a country and are reading this book indoors, you may be inhaling more air pollutants than you would if you were outside. Fig-ure 18-16 (p. 484) shows some typical sources of in-door air pollution in a modern home.
▲

484 CHAPTER 18 Air Pollution
Indoor air pollution usually poses a much greater threat to human health than does outdoor air pollu-tion. EPA studies have revealed some alarming facts about indoor air pollution in the United States and in other developed countries. First, levels of 11 common pollutants generally are two to five times higher inside U.S. homes and commercial buildings than they are outdoors, and as much as 100 times higher in some cases. Second, pollution levels inside cars in traffic-clogged urban areas can be up to 18 times higher than outside levels. Third, the health risks from exposure to such chemicals are magnified because most people in developed countries spend 70–98% of their time in-doors or inside vehicles.
Since 1990, the EPA has placed indoor air pollu-tion at the top of the list of 18 sources of cancer risk. It causes as many as 6,000 premature cancer deaths per year in the United States. At greatest risk are smokers, children younger than age 5, the elderly, the sick, preg-nant women, people with respiratory or heart prob-lems, and factory workers.
Pesticide residues and lead particles brought in on shoes can collect in carpets, which is why some people
remove their shoes after entering a house. According to the EPA, three of every four U.S. homes use pesticides indoors at least once a year. And many chemicals con-taining potentially harmful organic solvents are found in paints and various sprays.
Living organisms and their excrements can also pol-lute indoor air. Evidence indicates that exposure to al-lergens such as dust mites (Figure 18-17) and cockroach droppings found in some homes plays an important role in the almost threefold increase between 1972 and 2002 in the number of people suffering from asthma in the United States.
Another living source of indoor air pollution is toxic airborne spores of molds (fungal growths) and mil-dew that can cause headaches and allergic reactions and aggravate asthma and other respiratory diseases. Some evidence suggests that spores from molds and mildew growing underneath houses and on inside walls are the single greatest cause of allergic reactions to indoor air.
Danish and U.S. EPA studies have linked various air pollutants found in buildings to a number of health effects, a phenomenon known as the sick-building syn-drome (SBS). Such effects include dizziness, headaches,
Tobacco smokeSource: CigarettesThreat: Lung cancer, respiratoryailments, heart disease
Methylene chlorideSource: Paint strippers and thinnersThreat: Nerve disorders, diabetes
AsbestosSource: Pipe insulation, vinylceiling and floor tilesThreat: Lung disease, lung cancer
ParticulatesSource: Pollen, petdander, dust mites,cooking smoke particlesThreat: Irritated lungs,asthma attacks, itchyeyes, runny nose,lung disease
Nitrogen oxidesSource: Unvented gasstoves and keroseneheaters, woodstovesThreat: Irritated lungs,children's colds,headaches Benzo-α-pyrene
Source: Tobacco smoke,woodstovesThreat: Lung cancer
StyreneSource: Carpets,plastic productsThreat: Kidney andliver damage
FormaldehydeSource: Furniture stuffing,paneling, particleboard,foam insulationThreat: Irritation of eyes,throat, skin, and lungs;nausea; dizziness
TetrachloroethyleneSource: Dry-cleaningfluid fumes on clothesThreat: Nerve disorders,damage to liver andkidneys, possible cancer
Para-dichlorobenzeneSource: Air fresheners,mothball crystalsThreat: Cancer
ChloroformSource: Chlorine-treated water inhot showersPossible threat: Cancer
1,1,1-TrichloroethaneSource: Aerosol spraysThreat: Dizziness,irregular breathing
Carbon monoxideSource: Faulty furnaces,unvented gas stoves andkerosene heaters,woodstovesThreat: Headaches,drowsiness, irregularheartbeat, death
Radon-222Source: Radioactive soiland rock surroundingfoundation, water supplyThreat: Lung cancer
Figure 18-16 Some impor-tant indoor air pollutants (Concept 18-4). Question: Which of these pollutants are you exposed to? (Data from U.S. Environmen-tal Protection Agency)

manufactured homes for more than 10 years will de-velop cancer from formaldehyde exposure. In 2008, the U.S. Centers for Disease Control and Prevention (CDC) measured unhealthy indoor air levels of formaldehyde in many of the trailers and mobile homes provided by the government to house thousands of people displaced from their homes in 2005 by Hurricane Katrina.
RESEARCH FRONTIER
Learning more about indoor air pollutants and how to prevent them. See academic.cengage.com/biology/miller.
■ CASE STUDY
Radioactive Radon GasRadon-222 is a colorless, odorless, radioactive gas that is produced by the natural radioactive decay of urani-um-238, small amounts of which are contained in most rocks and soils. But this isotope is much more concen-trated in underground deposits of minerals such as ura-nium, phosphate, granite, and shale.
When radon gas from such deposits seeps upward through the soil and is released outdoors, it disperses quickly in the air and decays to harmless levels. How-ever, in buildings above such deposits, radon gas can enter through cracks in foundations and walls, open-ings around sump pumps and drains, and hollow con-crete blocks (Figure 18-18). Once inside it can build up to high levels, especially in unventilated lower levels of homes and buildings.
Radon-222 gas quickly decays into solid particles of other radioactive elements such as polonium-210, which if inhaled, expose lung tissue to large amounts of ionizing radiation from alpha particles. This expo-sure can damage lung tissue and lead to lung cancer over the course of a 70-year lifetime. Your chances of
CONCEPT 18-4 485
coughing, sneezing, shortness of breath, nausea, burn-ing eyes, sore throats, chronic fatigue, irritability, skin dryness and irritation, respiratory infections, flu-like symptoms, and depression. EPA and Labor Department studies indicate that almost one in five commercial buildings in the United States is considered “sick,” ex-posing employees to these health risks. GREEN CAREER: Indoor air pollution specialist
According to the EPA and public health officials, the four most dangerous indoor air pollutants in developed countries are tobacco smoke (Case Study, p. 462); formal-dehyde found in many building materials and household products; radioactive radon-222 gas, which can seep into houses from underground rock deposits (Case Study, right); and very small particles.
The chemical that causes most people in developed countries difficulty is formaldehyde (CH2O, a colorless, extremely irritating chemical). According to the EPA and the American Lung Association, 20–40 million Americans suffer from chronic breathing problems, diz-ziness, rash, headaches, sore throat, sinus and eye ir-ritation, skin irritation, wheezing, and nausea caused by daily exposure to low levels of formaldehyde emit-ted from common household materials. In 2008, Marc Weisskopf at the Harvard School of Public Health, re-ported on a 15-year study of more than 1,100 people exposed to formaldehyde. Those people had a 34% higher than normal risk of getting Lou Gehrig’s disease, which progressively kills nerve cells that control muscle movement.
Formaldehyde is found in building materials (such as plywood, particleboard, paneling, and high-gloss wood used in floors and cabinets), furniture, drapes, uphol-stery, adhesives in carpeting and wallpaper, urethane-formaldehyde foam insulation, fingernail hardener, and wrinkle-free coating on permanent-press clothing. The EPA estimates that 1 of every 5,000 people who live in
Figure 18-17 Science: magnified view of a household dust mite in a dust ball. This minute eight-legged relative of spiders feeds on dead human skin and household dust and lives in materials such as bedding and furniture fabrics. Dead dust mites and their excrement can cause asthma attacks and allergic reactions in some people. Questions: Were you aware that you are exposed to large numbers of dust mites? How could you reduce such exposure?
Outlet vents for furnaces and dryers
FurnaceClothesdryer
Wood stove
Slab joints
Openwindow
Openingsaround pipes
Cracks in wall
Slab joints
Openwindow
Openingsaround pipes
Cracks in wall
Cracksin floor
Slab
Soil
SumpSumppumppumpSumppump
Uranium-238
Radon-222 gas
Figure 18-18 Science: sources and paths of entry for in-door radon-222 gas. Question: Have you tested the indoor air where you live for radon-222? (Data from U.S. Environmental Protection Agency)
Davi
d Sc
harf/
Pete
r Arn
old,
Inc.

486 CHAPTER 18 Air Pollution
getting lung cancer from radon depend mostly on how much radon is in your home, how much time you spend in your home, and whether you are a smoker or have ever smoked. About 90% of radon-related lung cancers occur among current or former smokers.
Ideally, radon levels should be monitored continu-ously in the main living areas (not basements or crawl spaces) for 2 months to a year. But less than 10% of U.S. households have followed the EPA’s recommenda-tion to conduct radon tests (most lasting only 2–7 days and costing $20–100 per home).
For information about radon testing, visit the EPA website at www.epa.gov/iaq/radon. According to the
EPA, radon control could add $350–500 to the cost of a new home, and correcting a radon problem in an ex-isting house could run $800–2,500. Remedies include sealing cracks in the foundation and walls, increasing ventilation by cracking a window or installing vents, and using a fan to create cross ventilation.
THINKING ABOUTPreventing Indoor Air Pollution
What are some steps you could take to prevent indoor air pollution where you live, especially regarding the four most dangerous indoor air pollutants listed above.
18-5 What Are the Health Effects of Air Pollution?
CONCEPT 18-5 Air pollution can contribute to asthma, chronic bronchitis, emphysema, lung cancer, heart attack, and stroke.
▲
Your Body’s Natural Defenses against Air Pollution Can Be OverwhelmedYour respiratory system (Figure 18-19) has a number of mechanisms that help to protect you from air pollu-tion. Hairs in your nose filter out large particles. Sticky
mucus in the lining of your upper respiratory tract cap-tures smaller (but not the smallest) particles and dis-solves some gaseous pollutants. Sneezing and coughing expel contaminated air and mucus when pollutants ir-ritate your respiratory system.
In addition, hundreds of thousands of tiny mucus-coated hair-like structures called cilia line your upper
Nasal cavity
Oral cavity
Pharynx (throat)
Trachea (windpipe)
Bronchus
Right lung
Bronchioles
Bronchioles
Alveolar duct
Alveolar sac(sectioned)
Alveoli
Mucus
Goblet cell(secretingmucus)
Epithelial cell
Cilia
Figure 18-19 Major components of the human respiratory system. Question: Can you think of times when pollution might have affected your respiratory system?

CONCEPT 18-5 487
respiratory tract. They continually wave back and forth and transport mucus and the pollutants they trap to your throat where they are swallowed or expelled.
Prolonged or acute exposure to air pollutants, in-cluding tobacco smoke, can overload or break down these natural defenses. Fine and ultrafine particulates get lodged deep in the lungs, contributing to lung can-cer, asthma attack, heart attack, and stroke. For exam-ple, in the United States, about 17 million people, 6% of the population, suffer from asthma, and about 14 of them die each day from asthma attacks. A French study found that asthma attacks increased by about 30% on smoggy days.
Years of smoking or breathing polluted air can lead to other lung ailments such as chronic bronchitis. Another such disease is emphysema, in which irreversible damage to air sacs or alveoli (Figure 18-19, bottom right) leads to abnormal dilation of air spaces, loss of lung elasticity, and acute shortness of breath (Figure 18-20).
Air Pollution Is a Big KillerAccording to the WHO, at least 3 million people world-wide (most of them in Asia) die prematurely each year from the effects of air pollution—an average of 8,200 deaths per day. About 2.2 million of these deaths (73%) result from indoor air pollution, typically from heart attacks, respiratory diseases, and lung cancer re-lated to daily breathing of polluted air.
In the United States, the EPA estimates that annual deaths related to indoor and outdoor air pollution range from 150,000 to 350,000 people—equivalent to 2–5 fully loaded, 200-passenger airliners crashing each day with no survivors. Millions more suffer from asthma attacks and other respiratory disorders, and they lose work time. Studies indicate that 60,000–70,000 of these
deaths are related to inhalation of very small, fine, and ultrafine particulates from coal-burning power plants (Figure 18-21).
According to recent EPA studies, each year, more than 125,000 Americans (96% of them in urban areas) get cancer from breathing soot-laden diesel fumes from buses and trucks. Other sources of these fumes include tractors, bulldozers and other construction equipment, and trains. A large diesel truck emits as much particu-late matter as 150 cars, and particulate emissions from a diesel train engine equal those from 1,500 cars.
The EPA has proposed stricter emission standards for diesel-powered vehicles. The agency estimates that these standards should reduce diesel-fuel emissions by more than 90% and prevent as many as 12,000 prema-
Deaths per 100,000 adults per year
<1 1–5 5–10 10–20 20–30 30+
Figure 18-21 Premature deaths from air pollution in the United States, mostly from very small, fine, and ultrafine particles added to the atmosphere by coal-burning power plants. Question: What is the risk where you live or go to school? (Data from U.S. Environ-mental Protection Agency)
Figure 18-20 Normal human lungs (left) and the lungs of a person who died of emphysema (right). Prolonged smoking and ex-posure to air pollutants can cause emphysema in anyone, but about 2% of emphysema cases result from a defective gene that reduces the elasticity of the air sacs in the lungs. Anyone with this hereditary condition, for which testing is available, should not smoke and should not live or work in a highly polluted area.
Mat
t Mea
dow
s/ P
eter
Arn
old,
Inc.
Mat
t Mea
dow
s/ P
eter
Arn
old,
Inc.

488 CHAPTER 18 Air Pollution
ture deaths. Manufacturers of diesel-powered engines and vehicles dispute the EPA findings and hope to re-lax or delay the standards.
There is also a connection between international trade and air pollution. Currently, about 75% of the world’s international trade is transported in large rect-angular aluminum containers carried by increasingly larger cargo ships. As they come into harbors, the mas-sive diesel motors propelling these ships pollute the air. Long lines of diesel-powered trucks idling their engines while waiting to be loaded with the arriving containers emit additional air pollution.
For example, the current average daily emissions of PM-10 particulates at California’s Port of Los Angeles equal the daily particulate emissions from 500,000 U.S. cars. In 2005, California’s Air Resources Board estimated that diesel fuel emissions from the state’s booming cargo shipping industry cause as many as 750 premature deaths per year. In a 2007 study, a team of scientists led by James Corbett and James Winebrake estimated that emissions from ocean-going ships are responsible for about 60,000 premature deaths per year worldwide.
18-6 How Should We Deal with Air Pollution?
CONCEPT 18-6 Legal, economic, and technological tools can help to clean up air pollution, but much greater emphasis should be focused on preventing air pollution.
▲
Laws and Regulations Can Reduce Outdoor Air PollutionThe United States provides an excellent example of how a regulatory approach can reduce pollution (Con-cept 18-6). The U.S. Congress passed the Clean Air Acts in 1970, 1977, and 1990. With these laws, the federal government established air pollution regulations that are enforced by states and major cities, and that focus on key pollutants.
Congress directed the EPA to establish national ambi-ent air quality standards (NAAQS ) for six outdoor criteria pollutants—carbon monoxide, nitrogen oxides, sulfur di-oxide, suspended particulate matter (less than PM-10), ozone, and lead. One limit, called a primary standard, is set to protect human health. Another limit, called a sec-ondary standard, is intended to prevent en vironmental and property damage. Each standard specifies the max-imum allowable level, averaged over a specific period, for a certain pollutant in outdoor (ambient) air.
The EPA has also established national emission standards for more than 188 hazardous air pollutants (HAPs) that may cause serious health and ecological effects. Most of these chemicals are chlorinated hydro-carbons, volatile organic compounds, or compounds of toxic metals. An important public source of informa-tion about hazardous air pollutants is the annual Toxic Release Inventory (TRI ). The TRI law requires 21,500 re-fineries, power plants, hard rock mines, chemical man-ufacturers, and factories to report their releases and waste management methods for 667 toxic chemicals.
The TRI, which is now available on the Internet, lists this information by community, which allows in-dividuals and local groups to evaluate potential threats to their health. Since the first TRI report was released
in 1988, reported emissions of toxic chemicals have dropped sharply.
In 2005, the EPA proposed that industries be re-quired to report their HAP emissions every other year and that the thresholds for reporting these chemicals be raised tenfold. This means that more than 922 com-munities would no longer have numerical data on local polluters. Environmental and health scientists, emer-gency responders, and many citizens strongly oppose this weakening of the TRI, which has saved many lives and stimulated industries to reduce their emissions of such chemicals.
The good news is that, according to a 2007 EPA re-port (see www.epa.gov/air/airtrends/sixpoll.html), the combined emissions of the six major air pollutants decreased 49% between 1980 and 2006, even with sig-nificant increases during the same period in gross do-mestic product (up 121%), vehicle miles traveled (up 101%), population (up 32%), and energy consumption (up 29%). The decreases in emissions during this pe-riod were 97% for lead (Pb), 52% for volatile organic compounds (VOCs), 50% for carbon monoxide (CO), 47% for sulfur dioxide (SO2), 33% for nitrogen oxides (NOx), 28% for suspended particulate matter (PM10), and 21% for ground-level ozone.
According to the EPA, in 2006, about one of every three Americans lived in an area where the air was un-healthy to breathe during part of the year. This occurred mostly because levels of ozone and particulate matter exceeded the national air quality standards at various times.
An encouraging development in 2006 and 2007 was the arrival of low-sulfur diesel fuel, mandated by a regulation written in the 1990s. With it came a push for a new generation of diesel engines that will eventu-

CONCEPT 18-6 489
ally cut particulate pollution by up to 95%. The new rules added about 5 cents per gallon to diesel prices but are projected to result in annual health care cost sav-ings of $150 billion.
Elsewhere in the world, especially in developing countries, pollution levels are much worse. But some countries, such as Taiwan, Singapore, Malaysia, South Korea, Thailand, and parts of China, are making prog-ress in improving outdoor urban air quality.
While the U.S. regulatory model has been success-ful in reducing outdoor air pollution, environmental scientists point to areas where it could stand improve-ment (see the following Case Study).
■ CASE STUDY
U.S. Air Pollution Laws Can Be ImprovedThe reduction of outdoor air pollution in the United States since 1970 has been a remarkable success story that can be attributed to two factors. First, U.S. citizens insisted that laws be passed and enforced to improve air quality. Second, the country was affluent enough to afford such controls and improvements.
Environmental scientists applaud the success of U.S. air pollution control laws but point to the follow-ing deficiencies:
• The United States continues to rely mostly on pollution cleanup rather than prevention. The power of preven-tion is clear (Concept 18-6). In the United States, the air pollutant with the largest drop in its atmospheric level was lead (97% between 1980 and 2006 and 99% since 1970), which was largely banned in gasoline (Case Study, p. 474). This has prevented a generation of children from suffering lead poison-ing and is viewed as one the country’s greatest en-vironmental success stories. Despite such success, in 2007, environmental scientists were shocked that the EPA was considering removing lead from the list of regulated pollutants.
• For decades, the U.S. Congress failed to increase fuel-efficiency standards for cars, sport utility vehicles (SUVs), and light trucks (Figure 16-5, left, p. 404) and is far behind European Union countries, Japan, and China (Figure 16-5, right). According to environmental scientists, increased fuel ef-ficiency would reduce air pollution from motor vehicles more quickly and effectively than any other measure. It would also reduce CO2 emissions, reduce dependence on imported oil, save energy, and save consumers enormous amounts of money. Many scientists and economists believe that a feebate program (p. 405) is the best way to encourage the use of fuel-efficient motor vehicles.
• Regulation of emissions from motorcycles and two-cycle gasoline engines remains inadequate. A 2005 Swiss study indicated that motorcycles collectively emit 16 times more hydrocarbons and three times more carbon monoxide than do cars. And two-cycle engines used in lawn mowers, leaf blow-ers, chain saws, personal watercraft, outboard motors, and snowmobiles emit high levels of pollutants (although less-polluting versions are becoming available). According to the California Air Resources Board, a 1-hour ride on a typi-cal personal watercraft creates more air pollution than the average U.S. car does in a year. And for each unit of fuel burned, a 2006-model, gasoline-powered lawn mower emits 93 times the amount of smog-forming pollutants that a 2006 car emits, on average. In 2007, the EPA proposed rules to cut such emissions from lawn mowers and boat motors by 35% to 70%. Manufacturers of two-cycle engines regularly push for extending legal deadlines and for weakening these standards.
• There is little or no regulation of air pollution from oceangoing ships in American ports. According to the Earth Justice Legal Defense Fund, a single cargo ship emits more air pollution than 2,000 diesel trucks or 350,000 cars. Ships burn the dirtiest grades of diesel fuel and threaten the health of millions of dockworkers and other people living in port cities. The EPA has proposed regulations to cut such diesel emissions by 90% between 2008 and 2015.
• Airports are exempt from many air pollution regula-tions. Major U.S. airports in cities such as New York; Los Angeles, California; and Chicago, Illinois, are among the top polluters in these metropolitan ar-eas. A study of the health records of people living downwind from the airport in Seattle, Washington, found that they had significantly higher rates of re-spiratory diseases, infant mortality, and pregnancy complications than people not exposed to pollution from the airport.
• The laws do not regulate emissions of the greenhouse gas CO2, which can alter climate and cause numer-ous harmful ecological, health, and economic ef-fects. This may change, because in 2007, the U.S. Supreme Court ruled that the EPA can use the Clean Air Act to regulate CO2.
• Ultrafine particulates are not regulated. These ex-tremely small particles can penetrate the lung’s defenses and are a major contributor to premature deaths from air pollution.
• Urban ozone levels are still too high in many ar-eas. Because O3 is a secondary pollutant, the only way to reduce its levels is to decrease the

490 CHAPTER 18 Air Pollution
■✓
■✓
emissions of NOx and VOCs from point and non-point sources—something that is politically difficult to accomplish.
• The laws have failed to deal seriously with indoor air pollution, even though it is by far the most serious air pollution problem in terms of poorer health, premature death, and economic losses due to lost work time and increased health costs.
• There is a need for better enforcement of the Clean Air Acts. Under the Clean Air Acts, state and local officials have primary responsibility for imple-menting federal clean air standards, with federal funding. However, a 2006 study by the Center for American Progress found that, since 1993, enforce-ment has become lax because of a sharp drop in federal grants to state and local air quality agencies and relaxed federal inspection standards. Accord-ing to a 2002 government study, more rigorous enforcement would save about 6,000 lives and prevent 140,000 asthma attacks each year in the United States.
Executives of companies that would be affected by implementing stronger air pollution regulations claim that correcting these deficiencies would cost too much and would harm economic growth. But his-tory has shown that most industry estimates of the costs of implementing U.S. air pollution control stan-dards have been many times higher than the actual costs. In addition, implementing such standards has boosted economic growth and created jobs by stimulat-ing companies to develop new technologies for reduc-ing air pollution emissions—many of which can be sold in the global marketplace. Without intense pressure from citizens, it is unlikely that the U.S. Congress will strengthen the Clean Air Acts.
HOW WOULD YOU VOTE?
Should the 1990 U.S. Clean Air Act be strengthened? Cast your vote online at academic.cengage.com/biology/miller.
We Can Use the Marketplace to Reduce Outdoor Air PollutionAllowing producers of air pollutants to buy and sell government air pollution allotments in the market-place can help reduce emissions (Concept 18-6). To help reduce SO2 emissions, the Clean Air Act of 1990 au-thorizes an emissions trading, or cap-and-trade, program, which enables the 110 most polluting power plants in 21 states (primarily in the midwestern and eastern United States, Figure 14, p. S9, in Supplement 2) to
buy and sell SO2 pollution rights. Each of these coal-burning plants is annually given a number of pollution credits, which allow it to emit a certain amount of SO2. A utility that emits less than its allotment of SO2 has a surplus of pollution credits. It can use these credits to avoid reductions in SO2 emissions at another of its plants, keep them for future plant expansions, or sell them to other utilities, private citizens, or environmen-tal groups.
Proponents argue that this approach is cheaper and more efficient than having the government dictate how to control air pollution. Critics of this plan contend that it allows utilities with older, dirtier power plants to buy their way out of their environmental responsibilities and continue polluting. This approach also can encour-age cheating, because it is based largely on self-report-ing of emissions.
The ultimate success of any emissions trading ap-proach depends on how low the initial cap is set and then on the lowering of the cap every few years, which should promote continuing innovation in air pollution prevention and control. Without these two provisions, emissions trading programs mostly move air pollutants from one area to another without achieving any over-all reduction in air quality.
Good news. Between 1990 and 2006, the emissions trading system helped to reduce SO2 emissions from electric power plants in the United States by 53% at a cost of less than one-tenth the cost projected by indus-try. By 2010, the EPA estimates that this approach will annually generate health and environmental benefits that are 60 times higher than the annual cost of the program.
Emissions trading is also being tried for NOx and perhaps will be used in the future for other air pol-lutants. However, environmental and health scientists strongly oppose the cap-and-trade program set to begin in 2010 for controlling emissions of mercury by coal-burning power plants and industries. They note that mercury is highly toxic and does not break down in the environment, and that coal-burning plants choosing to buy permits instead of sharply reducing their mercury emissions will create toxic hotspots with unacceptably high levels of mercury.
The jury is still out for emissions trading programs in general. In 2002, the EPA reported results from the country’s oldest and largest emissions trading program, in effect since 1993 in southern California. According to the EPA, this cap-and-trade model fell far short of projected emissions reductions. The same study also found accounting abuses. This highlights the need for more careful monitoring of all cap-and-trade programs.
HOW WOULD YOU VOTE?
Should emissions trading be used to help control emis-sions of all major air pollutants? Cast your vote online at academic.cengage.com/biology/miller.

CONCEPT 18-6 491
■✓
There Are Many Ways to Reduce Outdoor Air PollutionFigure 18-22 summarizes ways to reduce emissions of sulfur oxides, nitrogen oxides, and particulate matter from stationary sources such as electric power plants and industrial plants that burn coal.
Between 1980 and 2006, emissions of SO2 from U.S. electric power plants were decreased by 66%,
S O L U T I O N SStationary Source Air Pollution
Disperse emissions above thermal inversion layer with tall smokestacks
Remove pollutants after combustion
Tax each unit of pollution produced
Burn low-sulfur coal
Remove sulfur from coal
Convert coal to a liquid or gaseous fuel
Shift to less polluting energy sources
Prevention Dispersion orCleanup
S O L U T I O N SMotor Vehicle Air Pollution
Require emission control devices
Inspect car exhaust systems twice a year
Set strict emission standards
Use mass transit
Walk or bike
Use less polluting fuels
Improve fuel efficiency
Get older, polluting cars off the road
Give large tax write-offs or rebates for buying low-polluting, energy efficient vehicles
Prevention Cleanup
Figure 18-22 Methods for reducing emissions of sulfur oxides, nitrogen oxides, and particulate matter from stationary sources such as coal-burning electric power plants and industrial plants (Concept 18-6). Question: Which two of these solutions do you think are the most important? Why?
Figure 18-23 Methods for reducing emissions from motor vehicles (Concept 18-6). To find out what and how much your car emits, go to www.cleancarsforkids.org. Question: Which two of these solutions do you think are the most impor-tant? Why?
emissions of NOx by 41%, and particu-late (PM10) emissions by 28%, mostly through use of output cleanup methods (Figure 18-22, right). However, approxi-mately 20,000 older coal-burning plants, industrial plants, and oil refineries in the United States have not been required to
meet the air pollution standards required for new facil-ities under the Clean Air Acts. Officials of states subject to pollution from such plants have been trying to get Congress to correct this shortcoming since 1970. But they have not been successful because of strong lobby-ing efforts by U.S. coal and electric power industries.
HOW WOULD YOU VOTE?
Should older coal-burning power and industrial plants in the country where you live have to meet the same air pollution standards that new facilities have to meet? Cast your vote online at academic.cengage.com/biology/miller.
Figure 18-23 lists ways to reduce emissions from motor vehicles, the primary factor in the formation of photochemical smog.
Unfortunately, the already poor air quality in urban areas of many developing countries is worsening as the number of motor vehicles in these countries rises. Many of these vehicles are 10 or more years old, have no pollution control devices, and burn leaded gasoline.

492 CHAPTER 18 Air Pollution
The good news is that because of the Clean Air Acts, a new car today in the United States emits 75% less pollu-tion than did pre-1970 cars. Over the next 10–20 years, technology will bring more gains through improved en-gine and emission systems, conventional hybrid-electric vehicles and plug-in hybrids (Figure 16-6, p. 405), and vehicles powered by hydrogen fuel cells (Figure 16-30, p. 429).
Reducing Indoor Air Pollution Should Be a PriorityLittle effort has been devoted to reducing indoor air pollution, even though it poses a much greater threat to human health than does outdoor air pollution. Air pollution experts suggest several ways to prevent or re-duce indoor air pollution, as shown in Figure 18-24.
In developing countries, indoor air pollution from open fires and leaky and inefficient stoves that burn wood, charcoal, or coal could be reduced. People could use inexpensive clay or metal stoves that burn bio fuels more efficiently, while venting their exhaust to the out-side. They could use stoves that run on biogas (mostly methane) produced in biodigesters from animal and other organic wastes, or they could use stoves that use solar energy to cook food (Figure 16-16, p. 414). This would also reduce deforestation by cutting demand for fuelwood and charcoal.
In developed countries, where VOCs present the greatest indoor air pollution threats, houseplants may provide some relief. Scientists have found that some common houseplants—such as the Boston fern, peace lily, rubber plant, and bamboo palm—absorb VOCs and use them as nutrients.
Figure 18-25 lists some ways in which you can re-duce your exposure to indoor air pollution.
S O L U T I O N SIndoor Air Pollution
Use adjustable fresh air vents for work spaces
Increase intake of outside air
Change air more frequently
Circulate a building’s air through rooftop greenhouses
Use efficient venting systems for wood-burning stoves
Use exhaust hoods for stoves and appliances burning natural gas
Clean ceiling tiles and line AC ducts to prevent release of mineral fibers
Ban smoking or limit it to well-ventilated areas
Set stricter formaldehyde emissions standards for carpet, furniture, and building materials
Prevent radon infiltration
Use office machines in well-ventilated areas
Use less polluting substitutes for harmful cleaning agents, paints, and other products
Prevention Cleanup orDilution
Figure 18-24 Ways to prevent and reduce indoor air pollution (Concept 18-6). Question: Which two of these solutions do you think are the most important? Why?
Figure 18-25 Individuals matter: ways to reduce your exposure to indoor air pollution. Question: Which three of these actions do you think are the most important? Why?
■ Test for radon and formaldehyde inside your home and take corrective measures as needed
■ Do not buy furniture and other products containing formaldehyde
■ Remove your shoes before entering your house to reduce inputs of dust, lead, and pesticides
■ Test your house or workplace for asbestos fiber levels, and check for any crumbling asbestos materials if it was built before 1980
■ Do not store gasoline, solvents, or other volatile hazardous chemicals inside a home or attached garage
■ If you smoke, do it outside or in a closed room vented to the outside
■ Make sure that wood-burning stoves, fireplaces, and kerosene- and gas-burning heaters are properly installed, vented, and maintained
■ Install carbon monoxide detectors in all sleeping areas
Indoor Air Pollution
WHAT CAN YOU DO?

ACADEMIC.CENGAGE.COM/BIOLOGY/MILLER 493
S O L U T I O N SAir Pollution
Reduce poverty
Distribute cheap and efficient cookstoves or solar cookers to poor families in developing countries
Reduce or ban indoor smoking
Develop simple and cheap tests for indoor pollutants such as particulates, radon, and formaldehyde
Improve energy efficiency to reduce fossil fuel use
Rely more on lower-polluting natural gas
Rely more on renewable energy (especially solar cells, wind, and solar-produced hydrogen)
Transfer energy efficiency, renewable energy, and pollution prevention technologies to developing countries
Outdoor Indoor
Figure 18-26 Ways to prevent outdoor and in-door air pollution over the next 30–40 years (Con-cept 18-6). Question: Which two of these solutions do you think are the most important? Why?
We Need to Put More Emphasis on Pollution PreventionSince 1970, most of the world’s developed countries have enacted laws and regulations that have signifi-cantly reduced outdoor air pollution. Most of these laws emphasize controlling outdoor air pollution by using output approaches. To environmental and health scientists, the next step is to shift to preventing air pollu-tion (Concept 1-4, p. 16). With this approach, the question is not ”What can we do about the air pollutants we produce?” but rather ”How can we avoid producing these pollutants in the first place?”
Figure 18-26 shows ways to prevent outdoor and indoor air pollution over the next 30–40 years (Con-cept 18-6). Like the shift to controlling outdoor air pollu-tion between 1970 and 2007, this new shift to preventing outdoor and indoor air pollution will not take place unless individual citizens and groups put political pressure on elected officials and economic pressure on companies through their purchases.
The Asian Brown Cloud and Sustainability
The Asian Brown Cloud (Core Case Study) is a striking example of how bad air pollution can get. It results from large and dense populations of people relying mostly on fossil fuels (especially coal) for their energy, and wasting too many resources, rather than recycling and reusing products. It is an example of what can happen when people violate all four scientific principles of sus-tainability (see back cover) on a massive scale.
However, we can use these four principles to help reduce air pollution. We can reduce inputs of conventional air pollutants into the atmosphere by relying more on direct and indirect forms
of solar energy than on fossils fuels; reducing the waste of matter and energy resources and recycling and reusing matter resources; mimicking biodiversity by using a diversity of nonpolluting or low-polluting renewable energy resources; and reducing human popu-lation growth and wasteful resource consumption.
A key strategy for solving air pollution problems is to focus on preventing or sharply reducing outdoor and indoor air pollution at global, regional, national, local, and individual levels. Each of us has an important role to play in protecting the atmosphere that sustains life and supports our economies.
R E V I S I T I N G
The atmosphere is the key symbol of global interdependence. If we can’t solve some of our problems in the face of threats to this global commons,
then I can’t be very optimistic about the future of the world.
MARGARET MEAD
REVIEW
1. Review the Key Questions and Concepts for this chapter on p. 469. Describe the nature and harmful effects of the massive Asian Brown Cloud (Core Case Study).
2. Define density, atmospheric pressure, troposphere, stratosphere, and ozone layer. Describe how the tropo-sphere and stratosphere differ.

494 CHAPTER 18 Air Pollution
3. What is air pollution? Summarize the history of air pol-lution. Distinguish between primary pollutants and secondary pollutants and give an example of each. List the major outdoor air pollutants and their harmful effects.
4. Describe the effects of lead as a pollutant and how we can reduce our exposure to this chemical. Describe a chemi-cal method and a biological method for detecting air pollutants.
5. Distinguish between industrial smog and photochemi-cal smog in terms of their chemical composition and formation. List and briefly describe five natural factors that help to reduce outdoor air pollution and six natural factors that help to worsen it. What is a temperature in-version and how can it affect air pollution levels?
6. What is acid deposition and how does it form? Briefly describe its major environmental impacts on vegetation, lakes, human-build structures, and human health. List three major ways to reduce acid deposition.
7. What are the top four indoor air pollutants in the United States? What is the major indoor air pollutant in many developing countries? Describe indoor air pollution by radon-222 and what can be done about it.
8. Briefly describe the human body’s defenses against air pollution, how they can be overwhelmed, and illnesses that can result. About how many people die prematurely from air pollution each year?
9. Describe air pollution laws in the United States. Summa-rize the accomplishments of such laws and discuss how they can be improved. List the advantages and disadvan-tages of using an emissions trading program. Summarize the major ways to reduce emissions from power plants and motor vehicles. What are four ways to reduce indoor air pollution?
10. Discuss the relationship between the Asian Brown Cloud (Core Case Study) and the ways in which people have violated the four scien-tific principles of sustainability.
Note: Key Terms are in bold type.
CRITICAL THINKING
1. The Asian Brown Cloud (Core Case Study) exists mainly in southern and eastern Asia, and some people blame Asians for its existence. Others argue that its causes, as well as its effects, are global in nature. What is your position on this? Explain your reasoning.
2. Investigate rocks, trees, and buildings in the area where you live for the presence of various lichens. Use their presence, color, and type to identify high- and low-pollution areas, and explain your reasoning.
3. China relies on coal for 70% of its commercial energy usage, partly because the country has abundant supplies of this resource. Yet China’s coal burning has caused in-numerable and growing problems for China and neigh-boring countries, and now, because of the Asian Brown Cloud (Core Case Study), for the Pacific Ocean and west coast of North America. Do you think China is justified in developing this resource to the maximum, as other countries including the United States have done with their coal resources? Explain. What are China’s alternatives?
4. Photochemical smog is largely the result of motor vehicle emissions. Considering your use, now and in the future, of motor vehicles, what are three ways in which you could reduce your contribution to photochemical smog?
5. Should all tall smokestacks be banned in an effort to pro-mote greater emphasis on preventing air pollution and acid deposition? Explain.
6. Explain how sulfur impurities in coal can increase the acidity of rainwater and deplete soil nutrients.
7. List three important ways in which your life would be dif-ferent today if grassroots actions by U.S. citizens between the 1970s and 1990s had not led to the Clean Air Acts of 1970, 1977, and 1990, despite strong political opposition by the affected industries. List three important ways in which your life in the future might be different if grass-roots actions now do not lead to strengthening of the U.S. Clean Air Act or a similar act in the country where you live. Do you think the U.S. Clean Air Act should be strengthened? Explain.
8. List three ways in which you could apply Concept 18-6 to making your lifestyle more environmentally sustainable.
9. Congratulations! You are in charge of the world. List your three most important strategies for dealing with the problems of (a) outdoor air pollution and (b) indoor air pollution.
10. List two questions that you would like to have answered as a result of reading this chapter.
Note: See Supplement 13 (p. S78) for a list of Projects related to this chapter.

ACADEMIC.CENGAGE.COM/BIOLOGY/MILLER 495
DATA ANALYSIS
Coal often contains sulfur (S) as an impurity that is released as gaseous SO2 during combustion. SO2 is one of six primary air pollutants monitored by the U.S. Environmental Protection Agency. The U.S. Clean Air Act limits sulfur emissions from
large coal-fired boilers to 0.54 kilograms (1.2 pounds) of sul-fur per million Btus of heat generated. (Note: 1 metric ton � 1,000 kilograms � 2,200 pounds � 1.1 ton; 1 kilogram � 2.20 pounds)
1. Given that coal used by electric power plants has a heat-ing value of 27.5 million Btus per metric ton (25 million Btus per ton), determine the number of kilograms (and pounds) of coal needed to produce 1 million Btus of heat.
2. Assuming that all of the sulfur in the coal is released to the atmosphere during combustion, what is the maximum percentage of sulfur the coal can contain and still allow the utility to meet the standards of the U.S. Clean Air Act?
3. About 10,000 Btus of heat input are required for an electric utility to produce 1 kilowatt-hour (kwh) of electrical energy. How many metric tons (and how many tons) of coal must be supplied each hour to pro-vide the input heat requirements for a 1,000-megawatt (1 million-kilowatt) power plant?
LEARNING ONLINE
Log on to the Student Companion Site for this book at academic.cengage.com/biology/miller, and choose Chapter 18 for many study aids and ideas for further read-
ing and research. These include flash cards, practice quiz-zing, Weblinks, information on Green Careers, and InfoTrac® College Edition articles.

495A
Questions 1–4 refer to the diagram of earth’s atmosphere shown below.
1. The ozone layer is found at this location.
2. The atmosphere is at its warmest point at this location.
3. The section of the atmosphere responsible for our daily weather is found at this location.
4. The section of the atmosphere with 75–80% of the mass of the atmosphere is found at this location.
5. A large cloud of dust and pollution that originates over Southeast Asia is
(A) now a permanent fixture in the atmosphere. (B) often a part of the pollution over California. (C) being ignored by the governments of India
and China. (D) cooling the lower atmosphere by reflecting
sunlight. (E) intermittent and only found during the
summertime.
6. The source of the ozone in the ozone layer is (A) oxygen molecules’ gas interacting with UV light to
produce ozone. (B) ozone molecules formed at the earth’s surface drifting
upwards. (C) ozone formed by plants during photosynthesis
moving upwards. (D) oxygen molecules forming the more stable compound
of ozone through catalysis. (E) carbon dioxide molecules breaking down in the
upper atmosphere when struck by UV light.
Questions 7 and 8 refer to the air pollutants below.
(A) SO2
(B) O3
(C) CO (D) Hydrocarbons (E) Suspended particles
7. A secondary pollutant and component of photochemical smog.
8. Can be solid or liquid in form and can often aggravate asthma or bronchitis.
9. Which of the situations below is NOT an area in which US air pollution laws are deficient and could be addressed to improve air pollution in the United States?
(A) Airports are exempt from most air pollution regulations.
(B) The United States relies on pollution cleanup rather than prevention.
(C) Ultrafine particles are not regulated. (D) The release of hazardous air pollutants (HAPs) has
increased over the last century. (E) There is little to no regulation of air pollution from
oceangoing ships in our ports.
10. Which of the methods below is designed to prevent indoor air pollution?
(A) Change indoor air more frequently (B) Ban smoking indoors (C) Use exhaust hoods for volatile chemicals (D) Increase the intake of outdoor air for office machines (E) Use adjustable fresh air vents for work spaces
11. What do all photochemical reactions have in common? (A) They release photons of light called fluorescence as
byproducts. (B) They absorb light and release heat in the process. (C) They are activated by light. (D) They utilize red light to boost electrons to higher
orbitals. (E) They couple visible light with heat to drive reactions.
AP* Review Questions for Chapter 18
Atmospheric pressure (millibars)0 200 400 600 800 1,000
Alti
tude
(kilo
met
ers)
120
100
80
60
40
20
0(Sealevel) –80 –40 0 40 80 120
Temperature (˚C)
75
55
35
15
Alti
tude
(mile
s)
Pressure =1,000millibars atground level
Temperature
Pressure
A
B
C
D
E
50
5
25
45
65110
90
70
30
10

AP* REVIEW QUESTIONS FOR CHAPTER 18 495B
12. Which of the elements below is found as an air pollutant causing nerve damage?
(A) Lead (B) Ozone (C) Particulates (D) Carbon oxides (E) Acid rain
13. Aquatic ecosystems are harmed from air pollution primarily through
(A) deposition of particulates. (B) radon gas dissolving in the water. (C) mercury bonding with water molecules. (D) photochemical reactions of water and sunlight. (E) deposition of acid rain.