copyright is owned by the author of the thesis. permission is … · samples from taro (colocasia...
TRANSCRIPT

Copyright is owned by the Author of the thesis. Permission is given for a copy to be downloaded by an individual for the purpose of research and private study only. The thesis may not be reproduced elsewhere without the permission of the Author.

Evolutionary Dynamics in Taro
(Colocasia esculenta L.)
A thesis submitted in partial fulfilment
of the requirements for the degree of
Doctor of Philosophy
in
Plant Biology
at Massey University, Palmerston North,
New Zealand
Ibrar Ahmed
2014

ii

iii
ABSTRACT
Understanding domestication is fundamental to understanding crop history and one of
the most significant advancements in human history – the emergence of agriculture.
Taro (Colocasia esculenta; family Araceae) is a root crop of importance to hundreds of
millions of people in tropical to sub-tropical and temperate regions of the world.
Despite its cultural and historical significance, the origins, domestication and worldwide
distribution of this crop have been the focus of only a few phylogenetic and
phylogeographic studies. This gap in understanding the history of taro can be partly
attributed to the non-suitability of available molecular markers, and the scale of targeted
plant sampling required. In this study, chloroplast genome sequences were determined
for two morphotypes of taro (var. RR and var. GP) using an Illumina sequencing
protocol and bioinformatic analyses. These genomes were compared to each other as
well as to four publicly available aroid chloroplast genomes. Such comparisons enabled
an analysis of the extent of genome-wide correlations between oligonucleotide repeats,
substitutions and insertion – deletion mutations (indels). Recent studies have suggested
such correlations in eukaryotic and prokaryotic genomes, but genome-wide studies on
organelles have not been undertaken. The finding of a significant correlation among
different kinds of mutational events in the chloroplast genomes of aroids led to a further
hypothesis being proposed that the distribution of oligonucleotide repeat sequences in a
single representative chloroplast genome could be used to predict mutational hotspot
loci suitable for population genetic, phylogenetic and phylogeographic studies in other
closely related plant species. To test this hypothesis, 30 primer pairs were designed to
amplify and sequence loci predicted to be mutational hotspots in the chloroplast genome
of taro. The phylogenetic and phylogeographic usefulness of these loci was then
determined in a range of intra-specific to inter-generic analyses, which included
samples from taro (Colocasia esculenta), four other Colocasia species (C. affinis,
C. fallax, C. formosana, C. gigantea), and species from three other aroid genera
(Remusatia vivipara, Alocasia brisbanensis and Amorphophallus konjac). Six of the 30
chloroplast DNA loci were sequenced from 170 wild and cultivated taro accessions
from 20 Asian and Oceanic countries, and 35 accessions from closely related out-group
species. This study provided further evaluation of novel markers that can be used to
elucidate the origins, domestication and dispersal history of taro. The results provided a
number of insights on the history of taro. Taro as a species most likely originated in

iv
South to Southeast Asia during the Miocene to Pliocene period, and reached Australia
and New Guinea separately in wild and possibly cultivated forms. Neighbor-Net and
maximum likelihood analyses of the chloroplast DNA loci revealed the existence of
three main super-clades in the wider taro germplasm. These super-clades were
identified as: (i) a subtropical to tropical Indo-Pacific (IP) super-clade consisting of wild
and cultivated, as well as diploid and triploid taros, (ii) a temperate to subtropical
Himalayan (H) super-clade consisting of triploid cultivars, and (iii) a tropical Southeast
Asian – Australian (SEAA) super-clade consisting of wild diploid taros. The current
study does not support the prevailing hypothesis of taro domestication in New Guinea,
but suggests that the domestication might have taken place independently for taros
belonging to the IP and H super-clades. Hybridization of taro with other sympatric
species in northern Vietnam was indicated by analysing sequences from six chloroplast
and two nuclear DNA loci (Phytochrome C and internal transcribed spacer) in a subset
of taro and other sympatric Colocasia species. This observation suggests that in taro as
in many other plant species, hybridization has been a significant feature of their
evolution. In total, this study significantly advances our understanding of the history of
taro. The inferred phylogenetic relationships also have relevance for developing future
taro breeding strategies.

v
DEDICATION
I dedicate this thesis to my late mother, who always encouraged me to seek and spread knowledge.

vi
ACKNOWLEDGEMENTS
I am thankful to Allah for all His bounties throughout my life. I highly regard Massey
University for providing me an excellent learning environment, and the Higher
Education Commission of Pakistan for awarding me a scholarship to pursue doctoral
studies at Massey University.
I am indebted to my supervisor Professor Peter J. Lockhart at the Institute of
Fundamental Sciences, Massey University, Palmerston North, for his kind guidance and
support throughout this study. He provided me an excellent working atmosphere to
plan, work and learn. I consider myself very fortunate to have learnt a lot from him.
I am grateful to my co-supervisor Dr. Peter J. Matthews at the National Museum of
Ethnology, Osaka, Japan, for not only providing most of the plant samples used in this
study, but also for remaining available for useful discussions throughout the study. His
long experience of working on taro has been very beneficial in this study.
I am thankful to my co-supervisors, Professor Michael D. Hendy at Otago University,
Dunedin, and Dr. Austen R. Ganley at New Zealand Institute for Advanced Study,
Massey University, Albany, for all their help and discussions. Professor Michael Hendy
and Professor David Penny were instrumental in encouraging me to study in New
Zealand and to work on this project. I am glad that this has been such an enjoyable
experience.
I am thankful to Dr. Lesley Collins and Dr. Patrick Biggs for their support in developing
my expertise in bioinformatics analyses. I acknowledge and thank Patricia A.
McLenachan (Trish) for her help in this study. Thanks also go to my current and past
colleagues at Institute of Molecular Biosciences and Allan Wilson Centre: Tariq
Mahmood, Atheer Matroud, Simon Hills, Gillian Gibb, Bennet McComish, Barbara
Schoenfeld, Robin Atherton, Andrew Clarke, Timothy White, Jing Wang, Bojian
Zhong, Jian Han, Matthias Becker, Simon Cox and Christina Marshall for their pleasant
company.
The period of my study at Massey University became much more memorable due to my
sincere friends Muhammad Naeem, Aamir Ghafoor, Hamid Irshad, Zahid-ur-Rehman,
Islah-ud-Din, Jibran Tahir, Saqib Sharif, Faisal Rana, Abdur Rehman, Asad Razzaq,

vii
Zafar Iqbal, Shujjaat Khan, Zia-ur-Rehman, Jawad Hussain and all other Pakistani
students at Massey University. I would also like to commend Pakistani community at
Palmerston North, particularly Zulfiqar Haider Butt, Babar Saeed, Muhammad Imran,
Khawaja Ahmer, Wajid Hussain, Muhammad Islam, Majid Hussain and Kamran Khan.
In presence of such a caring community, I did not feel as if I have been away from
home for so many years.
I am very thankful to my family, Sammia, Saad and Muhammad, for spending a very
pleasant time. I always consider myself as having been blessed with such loving
parents, siblings, extended family and friends, who always cared and prayed for me. My
father has been an icon of motivation and hard work for me. My parents always longed
for me to complete my studies and serve people with what I learned. Sadly, my beloved
mother departed in March 2012 while I was still a doctoral student. I wish she could
have lived to see me completing my career as a student!

viii
CONTENTS
Abstract iii
Acknowledgements vi
1. Introduction 1
General introduction 2
Species in the genus Colocasia 2
Ploidy in taro 3
Growth habitat and cultivation 4
Natural geographic range 6
Geographic origin, dispersal and domestication history 10
Hybridization in taro 11
Biochemical and molecular markers used to study genetic
diversity in taro resources
12
Limitations of previous studies with respect to elucidating
the evolutionary history of taro
14
Aims of the present study 15
Organization of the thesis 16
2. Mutational dynamics of aroid chloroplast genomes 17
Abstract 18
Introduction 19
The Colocasia esculenta chloroplast genome 20
Correlations among repeats, indels and substitutions in
aroid cp genomes
23
Materials and methods 29
Supplementary information 33
3. Identification of chloroplast genome loci suitable for high-
resolution phylogeographic studies of Colocasia esculenta (L.)
Schott (Araceae) and closely related taxa
36
Abstract 37
Introduction 38
Materials and methods 39
Results 43
Discussion 50

ix
Supplementary information 53
4. A phylogeographic study to investigate the origins,
domestication and dispersal of taro (Colocasia esculenta,
Araceae)
55
Abstract 56
Introduction 57
Materials and methods 60
Results 65
Discussion 76
Supplementary information 82
5. Conclusions and future outlook 84
Important conclusions of the study and future work
directions
85
Mutational dynamics 85
Novel chloroplast DNA markers for taro and related
species
87
Distinct chloroplast DNA super-clades and domestication
of taro
87
References 91
Appendix 110

x

1
CHAPTER 1
Introduction

2
General introduction Colocasia esculenta (L.) Schott, commonly known as taro, is a starchy root crop in
tropical to temperate regions of Africa, the Mediterranean, Asia, and the Pacific
(Matthews 2006). It belongs to a monocot family Araceae (aroids), which is global in its
distribution. Within this large family, only a few genera include species that have been
domesticated as a carbohydrate source: Alocasia, Amorphophallus, Colocasia,
Cyrtosperma, and Xanthosoma (Matthews 1995). Taro is grown mainly for its edible
leaves and corms, although all parts of the plant including corms, cormels, leaves,
flowers, rhizome and stalk are edible (de Candolle 1885; Lakhanpaul et al. 2003).
According to an earlier classification, two morphotypes of taro can be recognized:
dasheen or C. esculenta var. esculenta, and eddoe or C. esculenta var. antiquorum
(Purseglove 1972). These types have also been treated as two separate species, C.
esculenta and C. antiquorum. The crop has a close association with the culture and
history of people in New Zealand and elsewhere (Best 1976; Ivancic & Lebot 2000).
Taro is regarded as among one of the oldest (Hill 1939; Segawa 1953; Kumazawa et al.
1956; Lebot 2009, p279) and widely cultivated starch crops (Matthews 2004). Yu Jing
(The Book of Taro), written by Huang Shengzheng in 1597 in China (Chu 2012;
English translation) cites use of wild taro during famine conditions 2000 years ago.
Taro was also mentioned in Historical Memoir, an ancient Chinese book of about 100
BC (Tanimono 1998).
Species in the genus Colocasia
Historically, there has been considerable confusion about the number and naming of
species within Colocasia, and varieties within C. esculenta (Plucknett 1983; Hay 1996).
This reflects both the polymorphic and plastic nature of C. esculenta, the brevity of
many descriptions, and the lack of field research on the distribution and variation of
Colocasia species generally. The number of species in this genus might be up to 20 (Li
& Boyce 2010), with some species yet to be described. The genus name Colocasia is
supposedly derived from colcus or qolqas, an ancient name for taro in Egypt (de
Candolle 1885: p 74). Hooker (1894: p 523, 524) described six species of Colocasia
from India: C. antiquorum (syn. C. esculenta), C. affinis, C. fallax, C. virosa, C. mannii,
and C. gigantea. Colocasia esculenta was reported to be widely distributed in wild and
cultivated forms in most parts of India and Sri Lanka, growing up to an altitude of 7600

3
feet in the Himalayas. Colocasia affinis, C. fallax and C. mannii were reported from
Sikkim / Assam region in India, C. virosa was reported from Bengal and lowland areas,
whereas C. gigantea was reported from southern Vietnam and Java. This largely
Himalayan, tropical Asian genus was revised later by Engler & Krause (1920) and Hill
(1939). Further species were later recognized in this genus, including C. formosana
(Hayata 1919), C. oresbia (Hay 1996), C. gaoligongensis (Li & Long 1999), C. gongii
(Long & Li 2000), C. lihengiae (Long & Liu 2001), C. bicolor (Cao & Long 2003),
C. menglaensis (Yin et al. 2004), C. tibetensis (Yin 2006), C. yunnanensis (Cai et al.
2006), C. boyceana and C. dibangensis (Gogoi & Borah 2013). Colocasia formosana
was discovered in Taiwan; C. bicolor, C. gaoligongensis, C. gongii, C. lihengiae,
C. menglaensis and C. yunnanensis were all discovered in Yunnan, southern China;
C. tibetensis was discovered in Tibet, and C. oresbia was discovered in Borneo.
Colocasia oresbia was also reported from Bangladesh (Ara & Hassan 2005). Colocasia
affinis and C. fallax are widely distributed from Nepal to China, through mainland
Southeast Asia, and are not reported as cultigens (Matthews 1991; Li & Boyce 2010),
though they are widely traded as ornamentals. Colocasia gigantea is widely cultivated
in Southeast Asia and East Asia, and is wild in mainland Southeast Asia (Matthews
1991; Li & Boyce 2010). Colocasia lihengiae, C. menglaensis and C. yunnanensis were
collected in northern Vietnam by Peter Matthews and Nguyen van Du during 2012
(samples also used in this study), while C. lihengiae was also reported in northeast India
(Gogoi & Borah 2013). The geographical distribution of these species indicates that the
genus is naturally distributed from South Asia to Southeast Asia (including southern
China to Indonesia), in lowland tropical areas as well as in the cooler conditions of the
Himalayan mountains.
Ploidy in taro
Colocasia esculenta has two karyotypes: diploid with 2n = 28 chromosomes and
triploid with 3n = 42 chromosomes (Rattenbury 1956; Yen & Wheeler 1968; Coates et
al. 1988). Tetraploids can also be observed occasionally (Isshiki et al. 1999), although
they might occur in extremely low frequencies (Matthews 2004). A basic set of 14
chromosomes has been inferred for taro (Kokubugata & Konishi 1999) as well as for
wider Colocasoid species (Cusimano et al. 2012). The majority of cultivated and wild
genotypes are diploids (Matthews 1990) and are found throughout Asia and Oceania

4
(Kawahara 1978; Matsuda & Nawata 1999). Triploids have been documented in India,
Bangladesh, Nepal, China, Japan, Philippines, Timor, New Caledonia, Australia and
New Zealand (Yen & Wheeler 1968; Coates et al. 1988; Zhang & Zhang 1990; Isshiki
et al. 1999). Earlier studies suggested that all dasheen types are diploids, and most
eddoe types are triploids (Spier 1951; Kuruvilla & Singh 1981; Irwin et al. 1998), but
more data are needed to test this suggestion (Ivancic & Lebot 2000).
Studies of chromosome numbers indicate that Indian genotypes of C. esculenta have
more genetic diversity than those from any other geographic area (Yen & Wheeler
1968). Darlington & Wylie (1955) reported that C. esculenta has two basic chromosome
numbers: x = 12 (with somatic chromosome counts of 24 and 48) in Indian varieties,
and x = 14 (with somatic chromosome counts of 28 and 42) in Indian and Japanese
varieties. Lack of uniformity in chromosome counts in taro during cell division has also
been shown; chromosome counts of 2n = 22, 26, 28, 38 and 42 have been reported in
plants collected from different locations (Onwueme 1978). Parvin et al (2009)
documented a taro variety called Ashu Kachu in Bangladesh, having 21 chromosomes.
If the species identity of this variety as C. esculenta is confirmed, this observation lends
support to an earlier assumption that the basic chromosome number is 7 instead of 14 in
taro (Sreekumari 1997). Alternatively, examples of chromosome numbers other than 28
or 42 might represent interspecific hybrids with C. esculenta as one progenitor. Both of
these explanations need stronger empirical support to be accepted.
Cytogenetic, morphological and biochemical studies suggest autopolyploid origin for
triploid taro (Bai et al. 1971; Tanimoto & Matsumoto 1986; Lebot & Aradhya 1991;
Isshiki et al. 1995, 1999). Allopolyploid origin for triploids is also possible (Okada &
Hambali 1989; Yoshino 1994, 1995; Yoshino et al. 1998).
Growth habitat and cultivation
Colocasia esculenta can be found in wild and cultivated habitats, and is cultivated for
food or as an ornamental plant. Wild taros thrive in hot and humid, lowland tropical
areas, close to or in water. The water can be flowing as in streams or river banks, or
stagnant as in seasoned ponds or pools. Taro cultivars can grow in a range of drained,
rain fed or irrigated agricultural systems in tropical, subtropical and temperate
environments. During thousands of years in cultivation, hundreds (perhaps thousands?)

5
of cultivars have been developed by farmers and scattered across the tropical to
temperate regions of the world (Plucknett 1983; Rao et al. 2010). Matthews (1995)
defined various related terms such as wild, cultivated, wildtype and domesticate. The
term ‘wild’ refers to plants in non-cultivated habitats. A ‘cultivated’ habitat refers to a
place where the vegetation or the soil has been modified to support growth of some
desired plant(s). The term ‘wildtype’ refers to a plant genotype that has not been
modified by the human activity. The term ‘domesticate’ refers to a plant genotype
which has been modified by human activity. The term ‘cultivar’ represents a particular
line or breed of a domesticated type. Most often, wildtypes are associated with wild,
whereas domesticates and cultivars are associated with the cultivated habitats. However,
occasionally a wildtype may be found growing in a cultivated habitat, or a cultivar or
domesticate may be seen growing in a wild habitat. De Candolle (1885) was among the
first scientists to emphasize the importance of observing the habitats of the plants in
order to investigate which varieties are the most ancient ones and which are a result of
human-mediated breeding.
The principal mode of propagation for taro as a crop is vegetative for which cormels,
corms and stolons are used (Nyman & Arditti 1985; Matthews 1990). Flowering is rare
in plants under cultivation (Jianchu et al. 2001), probably because most cultivated
plants are harvested prior to flower, fruit and seed maturation (Matthews 1990). There is
either no flowering, or infertile flowers are produced in conditions of heavy rainfall or
continuous rainy weather (Ivancic & Lebot 2000). Thus successive selection of plants
occurs without seed setting, particularly in sub-tropical to temperate areas with seasonal
cropping systems such as Pakistan (author’s observation). However in tropical regions,
seeds can reach maturity and germinate. Fruit and seed production have been widely
reported in the tropical parts of Asia and the Pacific, including from Bangladesh (Isshiki
et al. 1995), Myanmar (Matthews & Naing 2005), Vanuatu (Caillon et al. 2006), New
Guinea (Lebot 1999), and Australia (Hunt et al. 2013). Both self-pollination (Carson &
Okada 1982) and cross-pollination (Patel et al. 1984) have been proposed, although the
floral morphology and differential rate of development of male and female floral parts
favour cross-pollination (Jackson & Pelomo 1980). In addition to diploids, triploids
have also been shown to undergo meiosis but with unusual chromosome behaviour:
monovalents, bivalents and trivalents were observed and the chromosome count in
pollen nuclei from triploids ranged from 8 – 25 (Bai et al. 1971).

6
Figure 1 shows taro growing in different habitats in New Zealand, Vietnam and
Pakistan. Two taro morphotypes, var GP (Figure 1a) and var. RR (Figure 1b), were used
for chloroplast genome sequencing, as detailed in Chapter 2. In New Zealand, these
morphotypes and the ornamental C. esculenta var. fontanesii (Figure 1c) are not known
to produce seeds. Figure 1(d) shows taro growing in wild habitat in Hu Lien, Vietnam
(Courtesy of PJM). Figures 1(e) and 1(f) show taro crop at a juvenile stage in district
Attock, but close to its harvest in district Multan at the same time. In Pakistan, taro is
grown as a crop in both the summer and winter seasons.
Natural geographic range
The natural geographic range of a species represents the extent of spread achieved
without human mediation. A species distribution can be the outcome of innumerable
biological, ecological and geographical factors, interacting over potentially long periods
of time. Some of these factors include geography, availability of habitats, natural
barriers to dispersal, habitat preferences (e.g. concerning temperature, daylight cycles,
physiological availability of water, soil conditions, presence of pollinators, absence of
plant competitors, herbivores, pests and diseases), and the species inherent genetic
capability which enables it to respond to a multitude of ecological and physiological
stresses or signals.
The likely natural range of taro extends from India and Southeast Asia to northern
Australia and New Guinea (Figure 2). This conclusion was supported by considerations
of taxonomic, ecological, ethnobotanical and geographic factors. Taro was reported
growing in India along with five other Colocasia species (Hooker 1894). Further
Colocasia species have since been reported growing in tropical Southeast Asia,
southern China and Indonesia (Hooker 1894; Hay 1996; Long & Liu 2001; Cao & Long
2003; Yin et al. 2004; Cai et al. 2006). Pests such as insects and viruses, and pollinators
of taro might represent a coevolution spanning a time frame of thousands to millions of
years. Taro planthoppers were described in Asia and Pacific (Asche & Wilson 1989)
including those in northern Australia (Matthews 2003). Pollinating flies belonging to
the genus Colocasiomyia (formerly Drosophilella) were found on taro inflorescences in
New Guinea (Carson & Okada 1982) and Australia (Hunt et al. 2013). Together, these
observations provide circumstantial support for the natural distribution range of taro
stated above.

7
(a)
(b)

8
(c)
(d)

9
(e)
(f)
Figure 1. Taro growing in different habitats in New Zealand (NZ), Vietnam (VN)
and Pakistan (PK): (a) var. GP morphotype, an exotic wild form in New Zealand,
growing in a stream near Whangarei, NZ (October 2009); (b) var. RR morphotype, an
edible cultivar at the University of Auckland campus, NZ (June 2008); (c) C. esculenta

10
var. fontanesii, an ornamental form with an inflorescence, growing in backyard of a
house in Ohaeawai, Northland, NZ (October 2009); (d) wild taro from Hu Lien district,
VN (October 2011); (e) an undescribed cultivar growing in district Attock, PK (April
2009); (f) an undescribed cultivar in district Multan, PK (April 2009).
Figure 2. Natural and cultivated range of taro distribution across the globe.
(Redrawn from Matthews, 2006).
Geographic origin, dispersal and domestication history
Researchers including de Candolle (1885), Hooker (1894), Spier (1951), Yen &
Wheeler (1968), Matthews (1990, 1991, 1995), Lebot & Aradhya (1991), Lebot (1992,
1999) have discussed the geographic origin, domestication and dispersal of taro across
different parts of the world. However, no general consensus on these matters has been
established yet. The generally accepted view during early part of the 20th century
recognized taro origin and domestication in a region from eastern India to Southeast
Asia, from where it dispersed to other parts of the world (Yen & Wheeler 1968;
Kuruvilla & Singh 1981). The hypothesis of an Asian origin of taro and its dispersal in
the Pacific region is linked with records of prehistoric human settlements and their
cultures in the Pacific Islands (Greenwell 1947; De la Pena 1970; Cable 1984;

11
Matthews 1995). An alternate hypothesis is that taro was independently domesticated in
New Guinea (Coates et al. 1988; Yen 1991, 1993; Lebot 1999). This hypothesis has
mostly relied on the archaeological evidence of ditch systems in New Guinea, which are
considered suitable for taro cultivation, and which belong to early Holocene calibrated
as 9000 to 6000 years BP (Golson 1976, 1977; Denham et al. 2003, 2004). Fossil
evidence for taro use in the Solomon Islands (Loy et al. 1992) and New Guinea
(Fullagar et al. 2006), as well as pollen records in New Guinea (Haberle 1995) and
northern Australia (Haberle 2005) have strengthened this hypothesis. Field observations
of the presence of wild taros in New Guinea and northern Australia (Matthews 1990,
1991; Ivancic et al. 1995) are also supportive of this hypothesis, as wild taro would
need to be naturally present in New Guinea for its domestication. Molecular methods
for isozyme, RAPD, AFLP, and SSR (microsatellite) analysis that have been developed
and applied to various collections of taro in Asia and the Pacific have indicated the
presence of more-or-less two distinct regional gene pools for cultivated taro, lending
support to the possibility of domestication in different regions of Southeast Asia and
Melanesia (Lebot & Aradhya 1991; Irwin et al. 1998; Matsuda & Nawata 1999; Ochiai
et al. 2001; Lakhanpaul et al. 2003; Kreike et al. 2004; Mace et al. 2006; Singh et al.
2007). However, the hypothesis of domestication in New Guinea has not been
sufficiently tested by genetic comparisons of wild and cultivated examples of taro from
Asia and the Pacific, or by selection of appropriate molecular markers to study the
evolutionary history of the crop. These points are further elaborated in Chapter 4 of this
thesis.
Hybridization in taro
A potential role for hybridization in speciation and adaptive diversification of plants has
been considered by many researchers (Arnold 1997; Seehausen 2004; Mallet 2007). In
general, hybridization simply extends the gene pool available to populations and species
for acquiring genetic traits that contribute to phenotypes of adaptive significance
(Becker et al. 2013).
Natural hybridization between Colocasia and Alocasia has previously been suggested
(Long & Liu 2001). Artificial hybrids have been created with crosses between
C. esculenta and C. gigantea (Okada & Hambali 1989), and between C. esculenta and
Alocasia macrorrhizos (Yoshino 1994; 1995; Yoshino et al. 1998). Hybridization has

12
also been suggested for other species within the family Araceae (Long & Liu 2001;
Nauheimer 2012). However, while possible hybrids within Colocasia have been
speculated upon (Long and Liu, 2001), this hypothesis requires further empirical
evidence.
Biochemical and molecular markers used to study genetic diversity in
taro resources
Colocasia esculenta has a widespread distribution in a wide range of environmental and
ecological niches since ancient times. Its widespread distribution and different niche
preferences might reflect either plasticity or genetic variability between different
cultivars and wild forms. The genetic diversity of taro has been examined using various
types of biochemical and molecular markers. Most studies have not focused on an
investigation of phylogeographic history. However, the marker systems investigated
have some relevance to the history of the crop. A brief summary of the relevant
literature on use of the molecular markers in taro is given here.
Using restriction fragment length polymorphism (RFLP), ribosomal DNA variation in
taro accessions from New Zealand, Australia, New Guinea, tropical Polynesia, the
Philippines, Sri Lanka, Nepal, Japan and Madagascar was analyzed (Matthews 1990;
Matthews et al. 1992; Matthews & Terauchi 1994; Matthews 1995). Variation in the
large spacer region of the nuclear ribosomal DNA revealed considerable variation
within taro, but this was not amenable to phylogenetic interpretation. Matsuda &
Nawata (2002) analysed RFLPs in the rDNA locus in 227 taro accessions from Japan,
China, Vietnam and Taiwan and suggested two routes of introduction of taro in Japan:
from China and from Southeast Asia. RFLP analysis of chloroplast DNA was also used
to study phylogenetic affinities between taro and species in genus Alocasia (Yoshino
1994, 1995; Yoshino et al. 1998). These studies indicated the presence of Alocasia
chloroplast DNA in Colocasia samples, suggesting possible hybridization between the
two genera.
Lebot & Aradhya (1991) studied isozyme variation in 1417 cultivars and wild type taros
from Asia and Oceania. With seven polymorphic enzymes, 143 zymotypes were
revealed. Asian cultivars showed greater variation than the Oceanic cultivars. Maximum
variation was found for Indonesian cultivars. The Oceanic cultivars were thought to

13
originate from Indonesia. Isozyme polymorphism in taro from Southeast Asia and
Oceania was studied further by (Lebot et al. 2004b) in taro accessions from seven
countries including Malaysia, Indonesia, Vietnam, Thailand, the Philippines, Vanuatu,
and Papua New Guinea. In 2298 plant samples, 319 distinct zymotypes were found. Six
zymotypes represented more than 51% of plants, while 21 zymotypes represented more
than 70% of plants, indicating a narrow genetic base among the cultivars. At the
isozyme level, significant genetic diversity was found in the plant samples from
Malaysia (0.52) and Vietnam (0.35), while limited diversity was found in samples from
Vanuatu (0.05), Papua New Guinea (0.05) and the Philippines (0.11). Both of the above
studies indicated presence of more or less distinct gene pools in Asia and Oceania.
Irwin et al. (1998) used 73 randomly amplified polymorphic DNA (RAPD) primers to
characterize 44 taro accessions from Hawaii, Indonesia, Micronesia, Samoa, Papua New
Guinea, Philippines, Thailand, Japan and New Caledonia. Consistent with Ivancic et al.
(2004), the Indonesian accessions displayed high genetic diversity. The RAPD markers
were also useful in distinguishing accessions with respect to the country of origin and
ploidy level (diploids and triploids). Lakhanpaul et al. (2003) studied genetic diversity
in Indian taro cultivars. They used 13 RAPD primers to characterise genetic diversity in
32 plant samples, with some primers displaying 60 – 100% polymorphism. All 32 plant
samples were found to be the unique genotypes.
van Eck et al. (1998) analysed amplified fragment length polymorphism (AFLP)
markers to assess genetic diversity in a core collection of 217 taro accessions from
Southeast Asia and Oceania. Most of these samples were cultivars. Low genotypic
polymorphism was observed in all accessions except diploids and triploids from
Indonesia (0.11 and 0.14 respectively) and triploids from Vietnam (0.13). (Lebot et al.
2004b) analysed AFLPs in elite cultivars from six countries, and suggested two distinct
genepools in Southeast Asia and Oceania. Kreike et al. (2004) studied 255 taro
accessions from Indonesia, Malaysia, Vietnam, the Philippines, Thailand, Vanuatu and
Papua New Guinea. With 3 AFLP primers, they generated 465 scorable amplicons.
Wild accessions showed higher average gene diversity compared to cultivated diploid
and triploid accessions in each country. Maximum gene diversity (0.19) was found in
wild accessions from Thailand, while minimum gene diversity (0.007) was observed for
diploid cultivars from Thailand. A dendrogram used to group wild accessions and
cultivated diploid and triploid accessions resolved accessions belonging to Asia and the

14
Pacific into two distinct groups. Caillon et al. (2006) used AFLP analysis to
characterize 96 morphotypes from Vanuatu; all 96 morphotypes could be differentiated,
but intra-clonal variation was non-significant.
Mace et al. (2006) studied a core collection of 515 taro accessions taken from 10
countries in Oceania using microsatellite markers. Seven microsatellite markers
displayed 38 alleles (average of 5.4 alleles per locus). Maximum polymorphism (88%)
was found within populations, while only 12% variation was found between
populations, with accessions from one country treated as one population. Highest gene
diversity was observed for Palau (0.658), Solomon Islands (0.618) and Papua New
Guinea (0.589). Singh et al. (2007) used microsatellite analysis to form a core collection
of taro accessions from Papua New Guinea. In a subset of 151 accessions, seven
microsatellite markers displayed 30 polymorphic alleles (an average of 4.28 alleles per
locus). The average polymorphic information content (PIC) was 0.59 for these
microsatellite markers.
Single nucleotide polymorphisms (SNPs) in chloroplast DNA were studied by Tahara et
al. (1999) in 13 accessions including taro and other aroid species. Of the two loci used,
only a single locus (trnL – trnF intergenic spacer) showed polymorphism in accessions
across four genera. However, polymorphism at this locus was not enough to distinguish
between Alocasia and Colocasia accessions.
Limitations of previous studies with respect to elucidating the
evolutionary history of taro
Previous studies of the genetic variation in taro (summarized above) have largely been
focused on molecular characterisation and estimating the genetic diversity of taro
cultivars (including vegetatively propagated clones). These studies have not sufficiently
included comparison with wild taro populations, and the markers assayed are not the
ones most suitable for locating the possible genetic and geographic origins of cultivated
forms. Little attention has been given to relationships with other species of Colocasia.
With little molecular data available, it has not been possible to develop molecular tests
appropriate for inferring evolutionary and phylogeographic relationships among diverse
forms of taro.

15
Among the hundreds and possibly thousands of taro cultivars (Plucknett 1983; Rao et
al. 2010), some cultivars have been developed using modern breeding methods. Recent
breeding projects have been aimed at either generating better yielding varieties or
introducing resistance against diseases. One of the aims of the TANSAO (Taro Network
for Southeast Asia and Oceania) project which was conducted during 1998 to 2002 and
involved researchers from several countries, was to breed taro cultivars resistant to taro
leaf blight (Lebot et al. 2004a). Similar breeding projects are also currently being
supported by the International Network for Edible Aroids
(http://www.ediblearoids.org/INEANEWS.aspx/ retrieved 14th August 2013).
De Candolle (1885; p13) stated the importance of recognising and excluding modern
cultivars from comparisons involving ancient cultivars – such distinction separates the
natural history from the human history of domestication of a crop. During the last three
decades, one of my co-supervisors (PJM) has accumulated samples of wild and
cultivated taro, including presumably ancient taro cultivars, together with samples of
closely related species, from countries within the natural distribution range of taro. This
set of samples provided a valuable resource, and was used in the present work to
investigate the evolutionary origin, spread and domestication history of taro. However,
a first step was to develop molecular markers (SNPs) that might be better suited for
phylogenetic and phylogeographic analyses of taro. These are the type of markers for
which it is possible to model nucleotide substitution properties. Such markers which are
the foundation of molecular systematics and divergence time estimation (e.g. Hillis
1996; Renner 2005; Ripplinger & Sullivan 2010) were developed for Colocasia and
closely related species.
Aims of the present study
Following the discussion above, the major aims of the present study were to:
I. Develop molecular markers appropriate for phylogenetic and phylogeographic
studies of taro and closely related taxa.
II. Investigate the evolutionary history of the crop by comparing wild and
cultivated taros from across the natural range of the species, and beyond.

16
Organization of the thesis
The above aims were achieved by dividing the work into three parts, two of which have
been published. The last component constitutes work towards a manuscript, the work
for which is drawing to a completion. Thus the thesis comprises in essence of three
manuscripts, each of which is outlined as a separate thesis Chapter. Each Chapter has its
own relevant literature review, methodology, results and discussion.
Aim I has been fulfilled by completion of Chapters 2 and 3 of this thesis. Chapter 2
describes the determination and comparative analyses of chloroplast genome sequences
from two taro morphotypes. These genomes were also compared with other available
aroid chloroplast genomes to identify mutational hotspots in aroid chloroplast genomes,
and determine the extent of genome wide association between different kinds of
mutations. From the observations made, a hypothesis was put forward that the
distribution of oligonucleotide repeats in a single representative genome could be used
a priori to design molecular markers most appropriate for phylogenetic and
phylogeographic studies. To test this hypothesis, molecular markers were designed from
the chloroplast genome of taro, and their usefulness was investigated for resolving
relationships among a subset of taro and closely related species. The findings from this
analysis have been presented in Chapter 3. Aim II has been accomplished in Chapter 4,
where analyses are reported for six of these chloroplast loci on a much bigger set of
taxa, alongside analyses of two independent nuclear loci. Analyses of these data were
used to resolve relationships within and among species, in a more diverse representation
of taro and closely related species. An overall conclusion from the studies undertaken in
this project, and the future outlook for further studies constitute Chapter 5. Many
references to the literature are common among these Chapters. For this reason
references from all Chapters have been combined together in a single reference list to
avoid redundancy. The appendix section includes the Statements of Contribution
(DRC16 forms) by the present author to the published manuscripts (Chapters 2 and 3), a
reprint of the Figure 2 in Chapter 2 which was selected for the cover page of the journal
(Genome Biology and Evolution), and a license by the publisher to reuse published
materials in Chapter 3.

17
CHAPTER 2
Ibrar Ahmed, Patrick J. Biggs, Peter J. Matthews,
Lesley J. Collins, Michael D. Hendy, Peter J.
Lockhart (2012). Mutational dynamics of aroid
chloroplast genomes. Genome Biology and
Evolution 4(12): 1316-1323.
Note: This paper was selected for the cover page of Volume 5 Issue 2
(February 2013) of Genome Biology and Evolution (the cover page is
reproduced in Appendix section).

18
Abstract
A characteristic feature of eukaryote and prokaryote genomes is the co-occurrence of
nucleotide substitution and insertion/deletion (indel) mutations. While similar
observations have also been made for chloroplast DNA, genome-wide associations have
not been reported. We determined the chloroplast genome sequences for two
morphotypes of taro (Colocasia esculenta; family Araceae) and compared these to four
publicly available aroid chloroplast genomes. Here we report the extent of genome wide
association between direct and inverted repeats, indels and substitutions in these aroid
chloroplast genomes. We suggest that alternative but not mutually exclusive hypotheses
explain the mutational dynamics of chloroplast genome evolution.
Key words: Araceae, indels, phylogeny, repeats, substitution mutations, taro

19
Introduction
Comparative studies of chloroplast genome sequences have investigated divergences
spanning an enormous range of evolutionary times. These have included studies of
intraspecific variation in domesticated plants (e.g. Yamane et al. 2003), studies of early
land plant evolution (e.g. Kugita et al. 2003) and also the earliest events of oxygenic
photosynthesis (e.g. Martin et al. 2002). This range of comparisons has been possible
because of the conservative nature of chloroplast (cp) genome evolution (Palmer 1985),
which involves relatively slow rates of sequence evolution in some parts of the cp
genome (Sammut & Huttley 2011) and elevated rates in other parts (Magee et al. 2010;
Sammut & Huttley 2011).
Molecular evolution of the cp genome sequences is typically modelled as a time
reversible substitution process, in which changes at any one site are independent of
changes at any other site (Liò & Goldman 1998; Drouin et al. 2008). However,
observations have suggested more complex processes of evolution in which both
lineage-specific and non-random spatial patterns of substitution (Liò & Goldman 1998;
Lee et al. 2007; Gruenheit et al. 2008; Magee et al. 2010; Wu et al. 2011; Zhong et al.
2011). Such observations have practical significance for understanding the limitations
of cp genomes in phylogenetic analyses of highly diverged lineages (Gruenheit et al.
2008), and for understanding the mutational dynamics of ‘hotspot’ regions studied in
comparisons of closely related taxa (Shaw et al. 2007; Worberg et al. 2007).
In prokaryotes and eukaryotes, analyses of DNA sequence alignments show that indels
commonly occur in regions that are hotspots for nucleotide substitutions. Alternative
hypotheses have been proposed to explain this co-occurrence. It has been suggested that
certain genome regions are predisposed to mutational events such as substitutions and
insertion/deletions – ‘the regional difference hypothesis’ (Silva & Kondrashov 2002;
Hardison et al. 2003). A second hypothesis explaining the association between indels
and substitutions is that certain (large) indels act to induce substitutions through a DNA
repair process that recruits error prone DNA polymerases –‘the indel-induced mutation
hypothesis’ (Tian et al. 2008; Zhu et al. 2009). A third and related hypothesis is that it
is the presence of repeat sequences rather than indels per se, that actually promotes
replication fork arrest, causing the recruitment of the error-prone DNA polymerases,
and in doing so generates nucleotide substitutions (McDonald et al. 2011).

20
These hypotheses have not been explicitly investigated in cp genomes yet these
genomes are known to contain very high densities of direct and inverted oligonucleotide
repeats. Associations between repeats, indels and substitutions have previously been
reported in cp DNA (McLenachan et al. 2000; Lockhart et al. 2001 and references cited
therein). Cp genome repeats include simple sequence repeats (SSRs, also known as
microsatellites) and other moderate to long (8 – 48 bp) repeats. Contraction and
expansion of the SSR units, caused by slipped strand mispairing during DNA
replication (Levinson & Gutman 1987), frequently produces short indels at these SSR
loci (Masood et al. 2004). The moderate to long repeats have also been suggested to
cause indels (Kawata et al. 1997) and inversions (Kim & Lee 2005; Whitlock et al.
2010). Most angiosperms also contain two large inverted repeat regions, commonly
known as IRa and IRb (5 – 76 kb; Palmer 1991).
Here we report the cp genome sequences of two morphotypes of taro (Colocasia
esculenta; var. RR and var. GP; Matthews 1985) and examine the genome wide
association of repeats (excluding IRa and IRb), indels and substitutions in the cp
genomes of these taro morphotypes and four other distantly related aroids in the
duckweed (Lemnoideae) sub-family.
The Colocasia esculenta chloroplast genome
Colocasia esculenta (L.) Schott, commonly known as taro, is an ancient root crop in
sub-family Aroideae of the monocot family Araceae. This species is distributed in the
tropical to subtropical and some temperate regions of the world (Bown 1988).
Gene arrangement and other features of the C. esculenta cp genome are shown in Figure
1. Size of the cp genome was 162,546 bp (GC content: 36.1%) in var. RR, and 162,424
bp (GC content: 36.2%) in var. GP. The GC content varied from 42.4% in inverted
repeats (IR) to 34.4% in the large single copy (LSC) and only 28.4% in the small single
copy (SSC) regions of the taro cp genomes. Higher GC content in the IR regions
corresponded to the presence of the ribosomal DNA locus. Pair-wise sequence
alignment between the taro cp genomes revealed 99.5% identical sequence, 241
substitutions and 92 indels. The LSC region contained 141 (58.6%) substitutions and 65

21
Figure 1. Colocasia esculenta var. RR chloroplast genome (GenBank accession:
JN105690). Brown lines in the outer circle represent the large and small single
copy regions, cyan lines represent the inverted repeats, while inner green lines
show AT and blue lines show GC percentage throughout the cp genome.
(71%) indels, the SSC region contained 83 (34.4%) substitutions and 25 (27%) indels,
while the IRa and IRb regions collectively contained only 17 (7%) substitutions and 2
(2%) indels, indicating that the IR was the most evolutionarily stable region. Prominent
differences between the two taro cp genomes were found at the IRb-SSC boundary
(numerous indels making up a 91 bp difference in size), and at the SSC-IRa boundary (a
shift of 64 bp in the repeat boundary without causing indels). Thus the IR boundaries at
both ends of the SSC region were polymorphic at intraspecific level in taro.
Polymorphism between the two taro cp genomes included 59 substitutions in 29 protein

22
coding genes. Among these, the most polymorphic gene was ycf1 even when
normalized for its size, showing 16 substitutions between the two genomes. Some
protein coding genes (including atpH, psbM and psbZ) and tRNA genes (including
trnH, trnG and trnW) in particular showed a relatively high density of substitutions and
indels within 20 bp upstream of their respective coding regions. Whether or not this
observation has functional significance needs to be further explored. A set of 30
functional tRNA genes covering all 20 amino acids required for protein synthesis was
present in the taro cp genome.
The overall gene arrangement was similar between taro (C. esculenta) and the
duckweed (Lemna minor; Mardanov et al. 2008) cp genomes. However, notable
differences were as follows:
(a) trnH gene is reported in the LSC region in duckweed, while the 5'-end of this
gene extended into the IRa region in taro.
(b) infA gene is completely missing in duckweed, but a pseudo-copy of this gene
with internal stop codons was observed in taro.
(c) A single functional rpl2 gene spanning the IRb-LSC boundary is reported in
duckweed, whereas two functional copies of this gene were found in taro, one in
each of the IR regions.
(d) A pseudo-copy of ycf68 gene is reported in duckweed, however a functional
copy of this gene was observed in each IR region in taro.
(e) Duckweed has ycf1 and rps15 genes within its IR regions, whereas these genes
were placed within the SSC region in taro.
The infA gene is considered to be among the most mobile cp genes. Multiple
independent gene transfers from cp to nuclear genomes are thought to have occurred
during angiosperm evolution (Millen et al. 2001). The ycf68 gene is present in a range
of plant families as a functional or a pseudo-gene, and may have functional significance
even in its non-coding form (Raubeson et al. 2007). Other genes showing variation in
comparison with L. minor include trnH, rpl2, ycf1 and rps15. These are located at or
near the boundaries of inverted repeats with single copy regions. These boundaries are
well known to exhibit expansion and contraction in angiosperms (Whitlock et al. 2010)
as well as in gymnosperms (Lin et al. 2012). A comparison of the size and percentage
proportions of LSC, SSC and IR regions in taro and other aroid cp genomes is given in

23
Table 1. Characterization of these boundaries is likely to provide useful insights into the
dynamics of single copy – inverted repeat boundary shifts in Colocasia and other aroid
cp genomes.
Table 1. Comparison among total size (bp) and sizes of the large single copy (LSC),
small single copy (SSC) and two inverted repeat (IR) regions in taro and other
aroid chloroplast genomes. Percentage proportions of the LSC, SSC and IRs are
given in parenthesis.
Species GenBank I.D.
Genome size
LSC SSC IR
Colocasia esculenta var. GP
JN105689 162424 89670 (55.21)
22208 (13.67)
25273 (31.12)
C. esculenta var. RR JN105690 162546 89817 (55.26)
22075 (13.58)
25327 (31.16)
Lemna minor NC010109 165955 89906 (54.17)
13603 (8.20)
31223 (37.63)
Spirodela polyrhiza JN160603 168788 91222 (54.04)
14056 (8.33)
31755 (37.63)
Wolffiella lingulata JN160604 169337 92015 (54.34)
13956 (8.24)
31683 (37.42)
Wolffia australiana JN160605 168704 91454 (54.21)
13394 (7.94)
31930 (37.85)
Correlations among repeats, indels and substitutions in aroid cp
genomes
We have visualized the extent to which indel and substitution mutations are non-
randomly distributed between taro and other aroid cp genomes, using a Circos
(Krzywinski et al. 2009) plot as given in Figure 2. This plot shows that substitutions are
very closely correlated in their distribution with moderate (15 bp) to long (48 bp) repeat
sequences mainly found in non-coding regions. Correlation (r) and related values for
these data are given in Table 2. Correlations were highly significant in comparisons of
three types of mutations, including (a) repeats and substitutions, (b) substitutions and
indels, and (c) repeats and indels. In a pairwise comparison of the two closely related
taro genomes, the strength of correlations was greatest for ‘repeats and indels’ followed
by ‘substitutions and indels’ and then ‘repeats and substitutions’. In contrast, when

24
Figure 2. Circos plot of taro (Colocasia esculenta) var. RR showing the relationship
between short repeats within the chloroplast genome and distribution of indels and
substitutions in pairwise comparisons of taro var. RR cp genome with other aroid
cp genomes. All data in the histogram tracks are shown in non-overlapping 250 bp
bins, with the taro var. RR genome taken as a reference for the coordinate space.
Tracks from the outermost to innermost show: taro var. RR chloroplast ideogram
(large single copy in purple, small single copy in red and inverted repeats in cyan);
genome annotation on the positive and negative strand (genes in green; tRNAs in
blue and rRNAs in purple); five circular plots showing comparisons between C.
esculenta var. RR with (1) C. esculenta var. GP, (2) L. minor, (3) S. polyrhiza, (4) W.
australiana and (5) W. lingulata. For each genome comparison, the number of
indels in each 250 bp bin is shown in orange (scale of 0 to 10), and the number of

25
substitutions is shown in blue (scale of 0 to 160). Across these five plots, the light
green colouring indicates the coding regions. The figure centre shows the results of
Reputer mapping using the taro var. RR chloroplast genome. Two ends of a red
line mark the two locations of the forward (direct) repeats, while those of a green
line mark the two locations of the reverse (inverted) repeats on the genome. In this
part of the figure, the large inverted repeats are not plotted, as they would obscure
a large part of the figure. Number of repeats shown in the diagram is 667, with a
size range from 15 bp to 48 bp (average repeat size: 16 bp).
pairwise comparison was made between a taro genome and a more distantly related
aroid genome, the strength of correlations reversed. The strongest correlation was for
‘repeats and substitutions’ followed by ‘substitutions and indels’ and then ‘repeats and
indels’ (Table 2). The strongest correlation value observed was for ‘repeats and indels’
in comparison of the two taro genomes. Similar observations have previously been
reported in prokaryotes and eukaryotes (Kawata et al. 1997; McDonald et al. 2011), and
have led to a hypothesis that repeat sequences play a pivotal role in generation of indel
and substitution mutations (McDonald et al. 2011).
Since Tian et al. (2008) proposed that moderate to large sized indels induce
substitutions in their surrounding sequences, we also investigated this relationship in a
multiple sequence alignment (parental alignment) of all six aroid cp genomes. From this
parental alignment, we extracted data partitions containing distinct indel location points
(ILPs) to make mutually exclusive partitions with respect to locations of the ILPs.
Partition A contained ILPs associated with SSR indels in both coding and non-coding
regions. Partition B contained ILPs associated with large (oligonucleotide long, non-
SSR) indels in both coding and non-coding regions. Partition C contained ILPs in non-
coding regions, associated with both SSR indels and large indels. Partition D contained
ILPs in coding regions, associated with both SSR and large indels. The density of
substitutions in all partitions was highly dependent upon inverse of distance from the
ILPs (r2 ranged from 0.85 to 0.97 for all bin sizes; Supplementary Figure 1). Higher
substitution density in bins closer to the ILPs was a general trend in all five comparisons
above, including the partition in which coding regions were removed (partition C);
however in this case distance from the ILPs was relatively shorter than in the other four

26
comparisons. The indel-induced mutation hypothesis was further explored in a
comparison including the parental alignment and partitions A and B, as shown in Figure
3. From this comparison, it is evident that the partition B (containing ILPs associated
with large indels) displayed a higher density of substitutions closer to ILPs, and the
density of substitutions decreased with an increase in distance from the ILPs. In
contrast, the partition A (containing ILPs associated with SSRs) exhibited a low density
of substitutions close to ILPs, and the density of substitutions showed a net increase
with increase in distance from the ILPs. These observations are consistent with the
indel-induced mutation hypothesis suggested for diploid eukaryote (Tian et al. 2008) as
well as bacterial genomes (Zhu et al. 2009).
It is well known that certain regions of the chloroplast genome show different rates of
mutations (e.g. Lee et al. 2007; Gruenheit et al. 2008; CBOL Plant Working Group
2009; Zhong et al. 2011). These are observations consistent with a regional difference
hypothesis (Silva & Kondrashov 2002; Hardison et al. 2003) and the suggestion that
purifying selection operates at both coding and non-coding regions (e.g. Peterson et al.
2011). However, these explanations are alone insufficient to explain substitution and
indel patterns of the chloroplast genome. The extent of genome wide correlations
reported here for indels, repeats and substitution provides further support for the
hypothesis by McDonald et al. (2011) which emphasizes the evolutionary importance of
the repeats in causing mutations. In addition, our observations on substitution densities
also provide support for an indel-induced mutation hypothesis (Tian et al. 2008; Zhu et
al. 2009) and further our understanding for the sometimes poor fit between time
reversible substitution models and chloroplast sequence data. Perhaps most interestingly
the relationship between repeats, substitutions and indels implies that, if the distribution
of repeat sequences in a chloroplast genome is determined, there is a possibility to
predict the mutational hotspot regions and other sequences that are most appropriate for
population genetic, phylogeographic and phylogenetic analyses.

27
Table 2. Comparisons among the pairwise alignments (Colocasia esculenta var. RR taken as a reference) to calculate the correlations
between (a) repeats and substitutions, (b) insertion-deletions (indels) and substitutions, and (c) repeats and indels. The alignments
compared closely related (var. RR to var. GP) and distantly related (var. RR to Wolffiella lingulata, Wolffia australiana, Lemna minor
and Spirodela polyrhiza) aroid chloroplast genomes. The alignments were partitioned into 651 non-overlapping bins of 250bp size each to
calculate these correlations. All correlations were highly significant (as indicated by stars) at 0.001 α and 649 degree of freedom.
Comparison C. esculenta var. GP
W. lingulata W. australiana L. minor S. polyrhiza
Correlation between repeats and substitutions (r) Significance of correlation (t) Coefficient of determination (r2)
0.245 6.44*** 0.060
0.391 10.81*** 0.152
0.416 11.657*** 0.173
0.424 11.92*** 0.180
0.491 14.37*** 0.241
Correlation between indels and substitutions (r) Significance of correlation (t) Coefficient of determination (r2)
0.391 10.82*** 0.153
0.220 5.75*** 0.048
0.245 6.43*** 0.060
0.323 8.71*** 0.105
0.387 10.69*** 0.150
Correlation between repeats and indels (r) Significance of correlation (t) Coefficient of determination (r2)
0.640 21.20*** 0.409
0.168 4.33*** 0.028
0.178 4.59*** 0.032
0.224 5.87*** 0.050
0.212 5.51*** 0.045

28
(a) (b)
Figure 3. Results showing (a) the number of mean non-zero data points used to calculate the substitution density, and (b) the values of
substitution density in 125 bp sequence adjacent to the indel location points (ILPs) for the parental alignment as well as two of its
partitions, A and B (Partition A contains ILPs associated with SSR indels in coding & non-coding regions, while partition B contains
ILPs associated with large indels in coding & non-coding regions). Lower than 150 values for non-zero data points at >25 bp distance in
(a) represents that taking an average for 1000 random iterations, lesser than 150 ILPs are 125bp apart from each other in all three types
of comparisons.
0
20
40
60
80
100
120
140
160
0 25 50 75 100 125Mea
n no
n-ze
ro d
ata
poin
ts fo
r 150
ILP
s
Distance from an indel location point (bp)
Partition A Parental alignment Partition B
0.00
0.02
0.04
0.06
0.08
0.10
0.12
0.14
0 25 50 75 100 125
Subs
titut
ion
dens
ity
Distance from an indel location point (bp)
Partition A Parental alignment Partition B

29
Materials and methods
Taro plants (Colocasia esculenta var RR; voucher number MPN:46548, and var GP;
voucher number MPN:46549 in the Dame Ella Campbell Herbarium, Massey
University, New Zealand) were obtained from the University of Auckland campus.
Chloroplasts were enriched following procedure given in Atherton et al. (2010). DNA
was extracted using a DNeasy Plant mini Kit (Qiagen, USA) and quantified using a
Qubit® Fluorometer (Invitrogen) and Quant-iT-ds DNA HS Assay kit (Invitrogen).
Illumina sequence reads were generated using the GAIIx platform at the Massey
Genome Service, Massey University, New Zealand. IIlumina sequencing produced 33
million reads of 75 base long (16.5 million paired-end reads) for var. RR, and 26.4
million reads of 75 base long (13.2 million paired-end reads) for var. GP. The reads
were mapped to the duckweed cp genome (L. minor; Mardanov et al. 2008) using BWA
mapping tool (Li & Durbin 2009). Mapping results were visualized using Tablet (Milne
et al. 2010). The reads from var. RR were de-novo assembled into contiguous sequences
(‘contigs’) of variable lengths using Velvet (v.0.7.60; Zerbino & Birney 2008), as
described elsewhere (Collins et al. 2008). These contigs were BLAST-searched
(Altschul et al. 1997) to determine homology to the duckweed cp genome. The contigs
of cp origin were assembled in Geneious Pro (Drummond et al. 2009) to deduce the cp
genome of the taro var. RR morphotype. The two inverted repeats were distinguished by
visual inspection of the boundaries between the repeat and single copy regions. Genome
annotation was carried out using Dual Organellar GenoMe Annotator (DOGMA;
Wyman et al. 2004) and also by direct comparison to the duckweed cp genome. Contigs
were generated similarly for the var. GP morphotype. The completed var. RR cp
genome was then used as our reference genome to help assemble the var. GP cp
genome. To verify integrity of the de-novo assembly process, the original 75 base long
reads from both taro samples were mapped back to their respective, assembled cp
genomes. Summary statistics for the BWA mapping of 75 base long reads to the L.
minor cp genome, as well as to their respective assembled var. RR and var. GP genomes
are given in Table 3.
The var. RR cp genome was pairwise aligned to the var. GP cp genome, as well as to
four aroid cp genomes from the Lemnoideae sub-family, using DIALIGN alignment
(Morgenstern 2004). The four aroid cp genomes included Lemna minor (GenBank ID:

30
NC010109; Mardanov et al. 2008), Spirodela polyrhiza (GenBank ID: JN160603),
Wolffiella lingulata (GenBank ID: JN160604), and Wolffia australiana (GenBank ID:
JN160605; Wang & Messing 2011). Selecting C. esculenta var. RR cp genome as a
reference for the coordinate positions, indels and substitutions were counted in pairwise
comparisons in non-overlapping bins of 250 bp through the entire length of the aligned
cp genomes (partitioning each of the five alignments into 651 bins). For the substitution
count, indels in the var. RR cp genome were deleted from the alignments to preserve the
coordinate positions. Similar patterns of indel and substitution counts were obtained
using a MAFFT alignment (Katoh et al. 2005; results not shown). A total of 5000
forward (direct) and reverse (inverted) repeats with a minimum size of 14 bp, a
maximum size of 48 bp, and a maximum of 3 nucleotide mismatch between the two
repeat copies in the taro var. RR cp genome were calculated using Reputer (Kurtz et al.
2001). Of these 5000 repeats, 667 locations of the direct and inverted repeats in var. RR
(minimum size: 15bp; zero mismatch between the two copies), as well as polymorphic
sites (indels and substitutions) in all five pairwise comparisons with respect to the var.
RR cp genome were plotted as a circular diagram using Circos (Krzywinski et al. 2009).
Correlations (r) were calculated between numbers of (a) repeats and substitutions, (b)
substitutions and indels, and (c) repeats and indels. This was done for comparisons of
closely related (two taro genomes) and distantly related (taro with other Lemnoidea) cp
genomes. The correlation values (r) were used to determine the significance of
correlation (t) and the coefficient of determination (r2), according to Lowry (2012).

31
Table 3. Summary statistics for BWA mapping of 75 base, paired-end reads obtained from the Colocasia esculenta var. RR and var. GP
morphotypes to the Lemna minor chloroplast genome, and to their assembled chloroplast genomes. The acronyms RR1, RR2 and RPE
represent mapping with the read 1, read 2 and paired-end (reads 1 and 2 taken together) reads obtained from the var. RR morphotype.
Similarly, GR1, GR2 and GPE represent mapping with the read 1, read 2 and paired-end reads obtained from the var. GP morphotype.
Parameter L. minor C. esculenta var. RR C. esculenta var. GP RR1 RR2 RPE GR1 GR2 GPE RR1 RR2 RPE GR1 GR2 GPE
Genome coverage (percentage) 68.5 68.1 85 68.5 68.7 85.6 99.99 100 100 100 100 100
Average coverage depth 129 128 337 319 317 825 296 294 593 665 659 1338
Maximum coverage depth 674 623 1531 1984 1853 5194 641 656 1020 1940 2021 3304

32
In order to further investigate the relationships between substitutions and indels, a
multiple sequence alignment of all six aroid cp genomes was generated using DIALIGN
alignment (Morgenstern et al, 2004). Hyper variable regions causing problems in the
alignment were removed to ensure conservative estimates. This 122 kb long parental
alignment contained 457 indel location points (ILPs). This parental alignment was used
to generate mutually exclusive alignment combinations with respect to locations of the
ILPs, to include ILPs associated with coding & non-coding regions and SSR indels (171
ILPs; partition A) and coding & non-coding regions and large indels (286 ILPs;
partition B). The parental alignment was also used to generate two further mutually
exclusive alignment combinations to include ILPs associated with SSR indels and large
indels in non-coding regions (376 ILPs; partition C) and SSR indels and large indels in
coding regions (81 ILPs; partition D). Using a Perl script, we counted the number and
positions of substitutions with respect to the ILPs, and plotted the substitution density as
a function of distance from the ILPs in non-overlapping bins of 50, 100, 150, 200, and
250 bp each for the parental alignment as well as partitions A, B and D; and 10, 20, 30,
40 and 50 bp for the partition C. The effect of large indels in causing substitutions was
further explored by comparing first three alignment combinations (parental alignment
along with partitions A and B) and plotting the substitution density as a function of
distance from the ILPs in 125 bp sequence adjacent to the ILPs. For this purpose, a
jacknifing approach was used to randomly select 150 ILPs from each of these three
partitions with 1000 random iterations to count substitutions within the 125 bp distance,
divided into five non-overlapping bins of 25 bp in size. Plots showing the relationship
between substitutions and ILPs were generated using MS Excel 2010 worksheets.
Funding: Authors acknowledge financial assistance of the New Zealand Royal Society
(The New Zealand Marsden Fund and James Cook Fellowship scheme), and the Higher
Education Commission, Government of Pakistan.

33
Supplementary information
(a)
(b)
50bp bin y = 2.2836x-1.19
R² = 0.8772
100bp bin y = 2.5807x-1.117
R² = 0.9015
150bp bim y = 3.2103x-1.093
R² = 0.9047
200bp bin y = 3.8254x-1.076
R² = 0.9366
250bp bin y = 4.2458x-1.064
R² = 0.9367
0.000
0.002
0.004
0.006
0.008
0.010
0.012
0.014
0.016
0.018
0.020
0 500 1000 1500 2000 2500 3000
Subs
titut
ion
dens
ity
Distance from an indel location point (bp)
Coding & non-coding regions, SSR indels and large indels (parental alignment; number of ILPs: 457)
50bp bin y = 1.2495x-1.082
R² = 0.8742
200bp bin y = 1.8805x-1.056
R² = 0.9231
150bp bin y = 2.5037x-1.041
R² = 0.9351
100bp bin y = 3.3791x-1.044
R² = 0.9389
250bp bin y = 3.5058x-1.02
R² = 0.9466
0.000
0.002
0.004
0.006
0.008
0.010
0.012
0.014
0.016
0.018
0.020
0 500 1000 1500 2000 2500 3000
Subs
titut
ion
dens
ity
Distance from an indel location point (bp)
Coding & non-coding regions and SSR indels (partition A; number of ILPs: 171)

34
(c)
(d)
50bp bim y = 2.1076x-1.18
R² = 0.9092
100bp bin y = 3.1785x-1.152
R² = 0.9259
150bp bim y = 4.5265x-1.152
R² = 0.9224
200bp bin y = 5.5024x-1.14
R² = 0.9199
250bp bin y = 5.5888x-1.114
R² = 0.9118
0.000
0.002
0.004
0.006
0.008
0.010
0.012
0.014
0.016
0.018
0.020
0 500 1000 1500 2000 2500 3000
Subs
titut
ion
dens
ity
Distance from an indel location point (bp)
Coding & non-coding regions and large indels (partition B; number of ILPs: 286)
10bp bin y = 0.5204x-1.152
R² = 0.938
20bp bin y = 1.4283x-1.307
R² = 0.9487 30bp bin
y = 1.7337x-1.304 R² = 0.9216
40bp bin y = 8.2485x-1.594
R² = 0.9799
50bp bin y = 9.7497x-1.599
R² = 0.969
0.000
0.002
0.004
0.006
0.008
0.010
0.012
0.014
0.016
0.018
0.020
0 100 200 300 400 500 600
Subs
titut
ion
dens
ity
Distance from an indel location point (bp)
Non-coding regions, SSR indels and large indels (partition C; number of ILPs: 376)

35
(e)
Supplementary Figure 1. Density of substitution mutations decreases with increase
in distance from the indel location points (ILPs) in five partitions of the multiple
sequence alignment using aroid chloroplast genomes. Reduced bin sizes were used
in (d) because of absence of suitable number of sites as much distant from the ILPs
as in the case of all other combinations (a, b, c and e).
50bp bin y = 0.8367x-1.025
R² = 0.8637
100bp bin y = 1.1521x-0.986
R² = 0.905
150bp bin y = 1.9511x-1.008
R² = 0.8792
200bp bin y = 2.62x-1.011 R² = 0.8533
250bp bin y = 2.7926x-0.989
R² = 0.8899
0.000
0.002
0.004
0.006
0.008
0.010
0.012
0.014
0.016
0.018
0.020
0 500 1000 1500 2000 2500 3000
Subs
titut
ion
dens
ity
Distance from indel location point (bp)
Coding regions, SSR indels and large indels (partition D; number of ILPs: 81)

36
CHAPTER 3
Ibrar Ahmed, Peter J. Matthews, Patrick J. Biggs,
Muhammad Naeem, Patricia A. McLenachan, Peter
J. Lockhart (2013). Identification of chloroplast
genome loci suitable for high-resolution
phylogeographic studies of Colocasia esculenta
(L.) Schott (Araceae) and closely related taxa.
Molecular Ecology Resources 13: 927-937.

37
Abstract
Recently we reported the chloroplast genome-wide association of oligonucleotide
repeats, indels and nucleotide substitutions in aroid chloroplast genomes. We
hypothesized that the distribution of oligonucleotide repeat sequences in a single
representative genome can be used to identify mutational hotspots and loci suitable for
population genetic, phylogenetic and phylogeographic studies. Using information on the
location of oligonucleotide repeats in the chloroplast genome of taro (Colocasia
esculenta), we designed 30 primer pairs to amplify and sequence polymorphic loci. The
primers have been tested in a range of intra-specific to inter-generic comparisons,
including ten taro samples (Colocasia esculenta) from diverse geographic locations,
four other Colocasia species (C. affinis, C. fallax, C. formosana, C. gigantea), and three
other aroid genera (represented by Remusatia vivipara, Alocasia brisbanensis and
Amorphophallus konjac). Multiple sequence alignments for the intra-specific
comparison revealed nucleotide substitutions (point mutations) at all 30 loci, and
microsatellite polymorphisms at 14 loci. The primer pairs reported here reveal levels of
genetic variation suitable for high-resolution phylogeographic and evolutionary studies
of taro and other closely-related aroids. Our results confirm that information on repeat
distribution can be used to identify loci suitable for such studies, and we expect that this
approach can be used in other plant groups.
Key words: Araceae; chloroplast genome, Colocasia esculenta, point mutations,
phylogeographic study

38
Introduction
Colocasia esculenta (L.) Schott, commonly known as taro, is a starchy root crop in the
monocot family Araceae. The natural distribution range of this species extends from
northeast India to Australia and New Guinea (Matthews 1991). Archaeological studies
indicate its usage as early as 28000 years ago in the Solomon Islands (Loy et al. 1992).
Taro was among the crops used and possibly cultivated 7000 years ago in Papua New
Guinea (Denham et al. 2003). The greatest diversity of wild Colocasia species appears
to extend from northeast India to southern China, within the Himalayan region of
mainland Southeast Asia (see Matthews 1991, Li et al. 2010). China has a relatively
well-documented historical record of taro cultivation since around 2000 years ago
(Jianchu et al. 2001).
Taro has two cytotypes: diploid with 28 chromosomes and triploid with 42
chromosomes (Yen & Wheeler 1968; Ramachandran 1978; Coates et al. 1988).
Cytogenetic, morphological and biochemical studies indicate that triploids may have
originated as a result of autopolyploidy (Bai et al. 1971; Lebot & Aradhya 1991; Isshiki
et al. 1999). Wide hybridization has been reported in experimental crosses between
C. esculenta and C. gigantea (Okada & Hambali 1989), and also between C. esculenta
and Alocasia macrorrhizos (Yoshino 1994, 1995; Yoshino et al. 1998). The success of
these crosses suggests that hybridization and allopolyploidy involving taro might also
occur under natural conditions.
Despite much interest in the genetic and geographic origins, domestication, and spread
of taro (e.g. Spier 1951; Yen & Wheeler 1968; Matthews 1990, 1991), relevant
empirical evidence is still lacking. To date, most of the molecular techniques and
sampling strategies used (Irwin et al. 1998; Ochiai et al. 2001; Mace & Godwin 2002;
Matsuda & Nawata 2002; Hu et al. 2009) have been designed to investigate the extent
of genetic diversity in cultivated taro. New approaches to sampling and analysis are
needed to reveal relationships between wild and cultivated taros, and among wild
Colocasia species, in order to clarify the evolutionary and cultural history of taro. A
small number of chloroplast (cp) DNA loci have been sequenced and used in studies of
phylogeny and biogeography in the family Araceae (e.g. Renner & Zhang 2004;
Nauheimer et al. 2012b). However, these loci allow only limited phylogenetic
resolution within genus Colocasia.

39
Chloroplast DNA loci are commonly used in studies of plant population genetics,
phylogeny and phylogeography (Chase et al. 1993; Powell et al. 1995; Rothwell et al.
2004; Renner & Zhang 2004; Parks et al. 2009; Hao et al. 2010; Scarcelli et al. 2011;
Barniske et al. 2012; Nauheimer et al. 2012b). Typically an ad hoc approach has been
used in selecting the loci used: they are usually selected because they have worked well
in other related taxa. Recent reports of full genome sequences allow a more systematic
approach, one that takes into account the mutational dynamics of chloroplast genomes
(Ahmed et al. 2012).
Chloroplast genomes are rich in oligonucleotide repeat sequences. Recently we
sequenced the complete cp genomes of two morphotypes of taro, and demonstrated that
the distribution of oligonucleotide repeat sequences in aroid cp genomes is closely
linked to the distribution of insertions – deletions (indels) and nucleotide substitutions
(Ahmed et al. 2012). We also hypothesized that the distribution of repeats could be used
to predict mutational hotspots in the cp genomes. Here we investigate the mutational
properties and utility for phylogenetic analysis of many of the mutational hotspot
regions identified.
We report results for 30 cp DNA loci, most of which are associated with repeat
sequences. We demonstrate the utility of repeat loci analysed for resolving phylogenetic
relationships among diploid and triploid taros sampled from a wide geographic range,
and among closely related aroid taxa.
Materials and methods
Forward and reverse oligonucleotide repeats (14 – 48 bp) in the taro cp genome
(GenBank accession JN105690; Ahmed et al. 2012) were identified using Reputer
(Kurtz et al. 2001). The cp genomes (JN 105689 and JN 105690) of two taro
morphotypes var. RR and var. GP (Matthews 1985) were aligned to identify stable
sequences suitable for designing primers. Forward and reverse primers were designed
using Primer3 (Rozen & Skaletsky 2000) incorporated in Geneious Pro 5.5.6
(Drummond et al. 2009), for 30 loci that displayed variable density of repeats, and
polymorphism in the comparison between two taro genomes (Figure 1). These primer
pairs were used to amplify and sequence cp DNA from ten taro accessions of wide
geographic provenance, and seven other aroid taxa. Taro accessions included five from

40
Figure 1. Circos plot showing distribution of point mutations and indels in a
pairwise comparison of chloroplast genomes in C. esculenta (taro) var. GP
(GenBank accession: JN105689) and var. RR (GenBank accession: JN105690).
Outermost track shows ideogram of taro var. RR cp genome (large single-copy
region in light purple, small single-copy region in dark purple, large inverted
repeats in cyan). Next innermost track shows gene locations on positive and
negative strands (genes for rRNA in dark green, tRNA in blue, proteins in dark
orange). Histograms, in three circles, show position and number of indels (outer
circle, green colour) and point mutations (middle circle) in var. RR (relative to var.
GP). The distribution of oligonucleotide repeats in var. RR is also shown (inner
circle; calculated using Reputer, and combining the forward and reverse repeats).
The height and colour of each histogram show numbers as follows. For lower
numbers, height and number correspond directly, on scales of 0 – 5 for indels (1

41
bar = 1 unit), and 0 – 10 (1 bar = 2 units) for point mutations and repeats. Using
qualitative Brewer palettes, point mutations are divided into 9 number classes
(Set1-qual palette), and repeats into 8 number classes (Dark2-qual palette), as
shown in the central key. For point mutations and repeats, the number of events
>10 are indicated by colour (i.e. number class), with no gain in histogram height.
Numbers are shown for non-overlapping 250 bp bins across the entire cp genome.
The positions of protein-coding genes across the three plots are marked by light
orange shading. Around the innermost track, red boxes show the 30 loci analysed
in the present study. Their coordinate positions are given in Table 1. Yellow boxes
indicate 83 loci reported in a previous study of monocots (Scarcelli et al. 2011), here
mapped onto the taro chloroplast genome.
New Zealand (CESNZ01, CESNZ02, CESNZ03, CESNZ04 and CESNZ14), two from
Pakistan (CESPK03 and CESPK04), two from Australia (CESAU10 and CESAU18)
and one from Japan (CESJP01). Species other than C. esculenta included C. fallax
(CFANZ01), C. affinis (CAFAU01), C. formosana (CFOTW01), C. gigantea
(CGIJP01), Remusatia vivipara (RVIAU01), Alocasia brisbanensis (ABRAU01) and
Amorphophallus konjac (AKOJP01). Further details about these accessions are given in
Supplementary Table 1.
Plant DNA was either extracted according to Ahmed et al. (2009) from freshly grown
leaf tissues, using a DNeasy Plant mini kit (Qiagen, USA) for silica-gel dried leaf
tissues, or was obtained from a DNA archive maintained by the second author (PJM) at
the Field Sciences Laboratory, National Museum of Ethnology, Osaka (Japan). The
PCR reaction mix consisted of 10-50 ng template DNA, 0.5 μM each of forward and
reverse primers (IDT Inc. Belgium), 0.2 mM of each dNTP, 1 unit Taq polymerase
(Roche Inc. Germany) and 1x PCR buffer including 1.5 mM MgCl2 in 20 μL total
volume. Thermocycling conditions were: 94 ˚C for 7 minutes followed by 30 cycles of
94 ˚C for one minute, 50 ˚C for 30 seconds (48 ˚C for the primer pair ACECP024), 72
˚C for 45 seconds, and the final extension at 72 ˚C for 10 minutes. After amplification,
unused primers were removed from PCR products by adding 1 unit SAP (shrimp-
alkaline phosphatase; Affymetrix Inc. USA) and 5 units EXO (Exonuclease I;
Affymetrix Inc. USA) per 15 μL PCR product and keeping the reaction mix at 37 ˚C for

42
30 minutes, followed by 80 ˚C for 15 minutes in a thermocycler. The products were
then used as template for subsequent Sanger sequencing reactions using their respective
forward and reverse primers in separate reactions. The reaction mix for Sanger
sequencing consisted of 1 μL PCR product, 0.2 μM primer (forward or reverse), 1 μL
BigDye Terminator v 3.1 (Invitrogen Inc. USA) and 3 μL sequencing buffer in 20 μL
reaction volume. Thermocycling conditions for the sequencing reaction consisted of 95
˚C for 1 minute followed by 25 cycles of 95 ˚C for 10 seconds, 50 ˚C for 10 seconds
and 60 ˚C for 4 minutes. The products were sequenced using an ABI 3730 DNA
analyser at the Massey Genome Service, Massey University, Palmerston North.
The sequences obtained were visualized and edited using Sequencher 3.1 (Gene Codes
Inc. USA). Sequences were aligned using MUSCLE (Edgar 2004). Sequence
alignments for all 30 loci were used to generate trees for intra-specific comparisons.
Either the primers did not successfully amplify or the aligned sequences were too
divergent at some of the hyper-variable loci, for distantly related taxa. Accordingly, the
alignments for 24 loci were used for inter-specific analysis, and alignments for 21 loci
were used for inter-generic comparisons (see Supplementary Table 2 for particular loci).
Indels from the alignments were removed using PAUP* (Swofford 2003). Maximum
likelihood trees were generated using PhyML (Guindon & Gascuel 2003). Two types of
substitution models were employed: a) the JC69 substitution model (Jukes & Cantor
1969) for the intra-specific sequence comparisons of taro accessions, and b) the
GTR + Г substitution model (Tavare 1986) for inter-specific comparisons within genus
Colocasia and for inter-generic comparison of Colocasia, Alocasia, Remusatia and
Amorphophallus. TreeView (Page 1996) was used to edit and save trees in Phylip /
Newick format. Individual trees were concatenated and used to generate a filtered Super
Network (Whitfield et al. 2008) in SplitsTree4 program (Huson & Bryant 2006) for
each set of trees generated in intra-specific, inter-specific and inter-generic
comparisons. Since the loci used in this study were identified based upon the values of
genome-wide correlations among substitutions, indels and repeats, for designing the
primer pairs we assumed similar correlations exist at the locus level. Subsequently,
correlations between (i) repeats and point mutations, (ii) point mutations and indels, and
(iii) indels and repeats were calculated for the intra-specific, inter-specific and inter-
generic comparisons in MS Excel 2010.

43
Results
Thirty loci were sequenced in taro, 24 among these loci were sequenced in closely
related species in genus Colocasia and in related aroid genera. Table 1 describes
a) names and sequences of forward and reverse primers, b) information about the locus,
c) the coordinate positions of amplified loci on the taro var. RR cp genome (JN105690),
d) amplicon size, e) observed polymorphisms in the intra-specific sequence alignments
of taro accessions, and f) GenBank accession numbers for the amplified products
obtained from all loci. The 30 primer pairs collectively amplified a total of 19411 bp
sequence (11.94% of the taro cp genome size), and the amplified region contained 811
(25.22%) of the 3216 oligonucleotide repeats found in the C.esculenta var. RR cp
genome, having two identical copies of the repeats that were ≥14 bp in size.
The correlations in densities of oligonucleotide repeats, indels and point mutations at
the loci studied are shown in Table 2. These were determined for intra-specific (within
C. esculenta), inter-specific and inter-generic comparisons. At all levels of comparison,
correlation coefficients were significant at p < 0.05, indicating that regions containing
point mutations can be accurately predicted from the distribution of oligonucleotide
repeats. Supplementary Table 2 gives values for the individual loci which were used to
calculate the correlation coefficients given in Table 2.
Polymorphic, mononucleotide microsatellites were observed in the intra-specific
sequence alignments at 13 loci, as given in Table 1. All these loci feature
mononucleotide (poly-A or poly-T) SSRs, with two loci having two polymorphic SSR
sites in each. These loci included accD and an intergenic spacer (IGS) region flanking
psaI amplified using the primer pair ACECP027, and the IGS between ndhF and rpl32,
amplified using the primer pair ACECP041. A polymorphic, dinucleotide microsatellite
motif (poly-AT) was also observed in the intra-specific sequence alignment at the locus
trnY – intergenic spacer – trnE, amplified using the primer pair ACECP016. This motif
appeared as a simple repeat in some taro accessions, and a compound repeat in others.

44
Table 1. Thirty primer pairs developed for polymorphic loci in the taro (C. esculenta) chloroplast genome. Shown are: forward (F) and
reverse (R) primer sequences, description of locus, coordinate positions on the var. RR (JN105690) genome, size of PCR product,
polymorphisms observed in multiple sequence alignments of taro accessions and GenBank accession numbers. All primer pairs amplify
at 50 ˚C annealing temperature except ACECP024, which amplifies at 48 ˚C. Primer pairs 1 – 21 amplify from the large single copy
region, 22 from the large single copy / inverted repeat-b boundary, 23 – 28 from the small single copy region, 29 from the inverted
repeat-a / large single copy boundary, and 30 from the small single copy region.
No.
Primer pair Sequence Locus Coordinates Size Polymorphisms GenBank
1 ACECP002 F: CTTGCAGTTTTCATTGCACA R: TTCACTTTTGGTCTCAACCC
trnK intron / matK 2096 – 2890 795 1 SNP JN105358 – JN105367
2 ACECP003 F: AGATGAGTCCCTTTTGAAGC R: AGCTCATTACTTGTGAAACG
trnK intron / matK 2941 – 3665 725 3 SNP JN105368 – JN105380
3 ACECP004 F: TATTTTTGCAACCCAATCGC R: CGTCCAGACTTTTGGTAGAG
trnK intron 4054 – 4539 486 4 SNPs JN105381 – JN105394
4 ACECP005 F: AAAATGGGGTTCCTAGTGGA R: ACTCGAACTCGAAGAAATGG
rps16 intron - 5'-rps16 CDS - IGS towards trnQ
6447 – 7077 631 11 SNPs, 3 indels of 1, 8, 2 bp, polyA SSR
JN105395 – JN105409
5 ACECP006 F: CAAGCTGCTGTAAGTTTTCG R: AGCATTACACAATCTCCAAGA
psbK - IGS - psbI 8513 – 9020 508 3 SNPs, polyT SSR
JN105410 – JN105424
6 ACECP007 F: AGGCCTTAGGACTAATATCAT R: ACTCCCCCTTAATTTTCCCA
IGS between trnS & trnG
9731 – 10689
959 5 SNPs, 9 indels of 9, 13, 21, 6, 14, 14, 7, 35, 5 bp
JN105425 – JN105430
7 ACECP014 F: AGTACCAAAAGTAGATTCGGG IGS between rpoB & 29361 – 977 4 SNPs, 5 indels JN105431 –

45
R: GGGGATTACTGACGTTTGTT trnC 30337 of 10, 15, 78, 20, 5 bp, polyA SSR
JN105442
8 ACECP016 F: TTTACAGTCCGTCCCCATTA R: CATCTCTCTTTCAAGGAGGC
trnY - IGS - trnE 33667 – 33921
255 2 SNP, 5 indels of 11, 18, 2, 1, 4 bp
JN105443 – JN105457
9 ACECP017 F: TGCCTCCTTGAAAGAGAGAT R: TACCATGGCGTTACTCTACC
trnE - IGS - trnT 33901 – 34720
820 1 SNP, 4 indels of 2, 5, 27, 9 bp
JN105458 – JN105470
10 ACECP018 F: AGAGAGATCTTGTTGATATTTGT R: TAGTCATGATTCAACGGGTC
IGS between trnT & psbD
34802 – 35155
354 4 SNPs, 1 indel of 17 bp
JN105471 – JN105486
11 ACECP019 F: GATCGTGATTTGGAACCTGT R: AAAACAGCCAATTGGAAAGC
psbC, IGS - trnS - IGS - psbZ
38274 – 38904
631 3 SNPs, 1 indel of 5 bp
JN105487 – JN105501
12 ACECP021 F: ACCGTACTTGAGAGTTTCCT R: TGTCATTACGTGCGACTATC
ycf3 intron 45612 – 46388
777 2 SNP, 2 indel of 5, 7 bp
JN105502 – JN105516
13 ACECP022 F: TCCTCGGTAACGAGACATAA R: ATGGTCATCGGTTCGACT
rps4 - IGS - trnT 49354 – 49859
506 2 SNPs, 3 indels of 7, 16, 16 bp; polyA SSR
JN105517 – JN105531
14 ACECP024 F: TCGATTATGCTCCCTTTTCT R: ATCAACCGGAGGAAGTATGT
IGS between trnF & ndhJ - ndhJ
52265 – 53164
900 6 SNPS, 4 indel of 1, 1, 2, 1 bp; polyA SSR
JN105532 – JN105542
15 ACECP026 F: ACTACGGTAGAGCGGTTTAT R: AAAGTCATCTCACGTTCACC
rbcL 60237 – 60714
478 3 SNPs JN105543 – JN105558
16 ACECP027 F: GGCTTATTCGATCCAATCGT R: GAGTTCGCGACTCTAACTAA
accD - IGS between accD & psaI
63287 – 64111
825 8 SNPs, 5 indels of 13, 5, 2, 19, 1 bp. polyA and polyT SSRs
JX971448 – JX971454

46
17 ACECP028 F: GGCAATCCGAAACTTTCTTG R: TCCCTATCCACAAGTCTGTC
IGS between ycf4 & cemA - cemA - IGS between cemA & petA
66541 – 67284
744 3 SNPs, 1 indel of 14 bp
JN105559 – JN105572
18 ACECP030 F: AACGCGGTTTTGATCAGTAT R: CAATTCATTGCGCAACTTGT
IGS between psbE & petL
70141 – 70945
805 6 SNPs, 3 indels of 4, 10, 19 bp
JN105573 – JN105586
19 ACECP035 F: TGGTTAGGTATTGGAGCAAC R: GTGGACATTCTACAGAAGCA
petD - IGS - rpoA 83126 – 83461
336 5 SNPs, 3 indels of 29, 1, 1 bp; polyT SSR
JN105587 – JN105602
20 ACECP036 F: TGAAACTCGCTTGAACATGA R: CCCTGCGACATAAAAGAACT
rps11 - IGS - rpl36 - IGS - infA - IGS - rps8
84803 – 85835
1033 5 SNPs, 2 indels of 9, 8 bp, polyT SSR
JN105603 – JN105617
21 ACECP038 F: ACGGAATCTGGTTCTTTTGG R:AAAGAGTCAATATTCGCCCG
rpl 16 CDS – intron 87055 – 87550
496 3 SNPs, 3 indels of 9, 19, 2 bp
JX971455 – JX971459
22 ACECP039 F: AGTTACTCCCTTTTCCACCA R: GTAATGTTGGGGTGAACCAA
IGS between rpl22 & rps19 - rps19 - IGS - rpl2
89428 – 90106
679 5 SNPs, 1 indel of 1 bp, polyT SSR
JN105618 – JN105632
23 ACECP041 F: GTTTCCGATTCACCAACTCT R: ATAGCCCCATCTGAATCTGT
IGS between ndhF & rpl32
118286 – 118978
693 11 SNPs, 5 indels of 6, 6, 5, 1, 1 bp, 2 polyA SSRs
JN105633 – JN105647
24 ACECP043 F: AGCAGTATGGGCTAATGAGG R: CCCGTAATAGCGATTGGT
ccsA - IGS - ndhD 121060 – 121603
544 3 SNPs (5 bp inversion taken as equal to one SNP)
JX971460 – JX971470
25 ACECP045 F: CTAACCATGCTTCGACTTGT R: TCTATAATTCTTTTAGTTGCCTT
ndhE - IGS - ndhG 124576 – 125079
504 1 SNP, 3 indels of 19, 1, 2 bp.
JX971471 – JX971477

47
polyT SSR 26 ACECP046 F: TCCAGAACCGTACATGAAAC
R: CGGGTACAAAGGATCAACTG ndhA intron 127156 –
127939 784 2 SNPs, 2 indels
of 44, 1 bp. polyA SSR
JX971478 – JX971484
27 ACECP048 F: TTTCTTTGACAAATACGCCA R: AAGGCCGAAAGATATACACA
rps15 - IGS between rps15 & ycf1
130119 – 130660
542 6 SNPs, 2 indels of 1, 2 bp. polyT SSR
JX971485 – JX971491
28 ACECP051 F: AAAGATTTTCTTCGGCGGAT R: TCTCTTCCTTCTTCGAGCTT
ycf1 136299 – 137014
716 4 SNPs JN105648 – JN105659
29 ACECP052 F: AAGCTCGAAGAAGGAAGAGA R: ACTGAGCTACTGAGGAACAA
ycf1 - IGS - trnN 136995 – 137357
363 3 SNPs JN105660 – JN105674
30 ACECP055 F: TCTAACGGAAGGCTATTGGA R: TAGGCTCAGTCAACTGGAAT
5' ycf2 - IGS between ycf15 & trnL
98776 – 99349; 153015 – 153588
575 1 SNP JX971492 – JX971504

48
Table 2. Correlation values between oligonucleotide repeats, point mutations, and
insertion-deletions (indels). Intra-specific correlations (within C. esculenta) are
based upon 30 loci (28 degrees of freedom or df), inter-specific correlations (within
Colocasia) are based upon 24 loci (df: 22), whereas inter-generic comparisons
(among Colocasia, Alocasia, Remusatia and Amorphophallus) are based upon 21
loci (df: 19).
Comparisons Intra-specific Inter-specific Inter-generic
Correlation between repeats and
point mutations (r)
p value (non-directional)
0.410
0.024
0.510
0.010
0.492
0.010
Correlation between point
mutations and indels (r)
p value (non-directional)
0.443
0.014
0.584
0.003
0.766
<0.0001
Correlation between indels and
repeats (r)
p value (non-directional)
0.778
<0.0001
0.799
<0.0001
0.800
<0.0001
Figure 2 shows filtered Super Networks obtained for a) intra-specific, b), inter-specific,
and c) inter-generic comparisons, calculated using SplitsTree4 (Huson and Bryant,
2006). Figure 2a shows some poorly resolved intra-specific relationships. All taxa were
nevertheless genetically distinct. Taro cultivars from Pakistan (CESPK03 and
CESPK04) clustered with triploid cultivar var. RR from New Zealand (CESNZ02).
They formed a group distinct from wild diploid taros from Australia (CESAU10 and
CESAU18), and a range of taros present as exotic introductions in New Zealand
(CESNZ01, CESNZ03 and CESNZ04). Two diploid Australian wild taros, from
geographically separate but morphologically similar populations in Queensland, were
genetically distinct from each other (Figure 2a). Colocasia formosana from Taiwan
(CFOTW01) appeared closer to the Australian wild accessions than other taxa sampled
(Figure 2a). Relationships inferred in the inter-specific (Figure 2b) and inter-generic
(Figure 2c) comparisons were relatively tree-like. Colocasia gigantea appeared closer to
Alocasia than to other Colocasia species (Figures 2b and 2c), while Remusatia vivipara
(RVIAU01) appeared closer to Colocasia than to Alocasia (Figure 2c).

49
(a) (b) (c)
Figure 2. Filtered Super-Networks showing phylogenetic relationships at (a) intra-specific level (within C. esculenta) for 30 loci, (b) inter-
specific level (within genus Colocasia) for 24 loci, and (c) inter-generic level (among Colocasia, Alocasia, Remusatia and Amorphophallus
genera) for 21 loci. Figure (a) shows splits present in minimum of 10 trees (9 of 65 splits), (b) shows splits present in minimum of 6 trees
(2 of 7 splits), and (c) shows splits present in minimum of 6 trees (6 of 36 splits). Accession names indicate species (first three letters),
country of collection (fourth and fifth letters) according to the International Organization for Standardization (ISO), and accession
number (last two digits). Further details about these accessions are given in the Supplementary Table 1.

50
Discussion
We recently demonstrated associations between repeats, indels and substitutions in
aroid cp genomes (Ahmed et al. 2012). The association is likely to be common in most
seed plant families, since it has also been found in gymnosperms (Yi et al. 2013). Here
we demonstrate that information on the distribution of oligonucleotide repeat sequences
can be used to design high-resolution phylogenetic markers, useful in phylogeographic
studies.
Significant values of correlation coefficients at p < 0.05 for all comparisons in this study
(Table 2) as well as the values reported in previous studies (Ahmed et al. 2012; Yi et al.
2013) imply that regions in cp genomes which have the greatest number of
oligonucleotide repeat copies tend to exhibit the greatest number of point mutations.
The tree-like structure of the filtered-Super Network indicates that the present set of 30
primer pairs can be used to resolve intra-specific relationships within Colocasia
esculenta, inter-specific relationships within genus Colocasia, and inter-generic
relationships among aroids close to genus Colocasia (Fig. 2). Poor resolution of
relationships for some accessions in the intra-specific Super Network comparison (Fig.
2a) could be explained by non-mutually exclusive reasons: (i) not all accessions were
available for each of the 30 trees used to make the network (nevertheless the taxon sets
overlapped for most accessions), (ii) Parallel or convergent changes some lineages have
produced homoplasy and site pattern incompatibilities between gene loci. The latter
appears common-place in chloroplast genomes (e.g. Vogl et al. 2003; Shepherd et al.
2008).
All polymorphic chloroplast loci characterised here were easy to amplify using all 30
primer pairs in taro. All except one pair have the same annealing temperature, so
multiplex analyses can be considered in future studies. Most amplified loci sequenced
well, including those containing mononucleotide simple sequence repeats (SSRs).
Microsatellites or SSRs are abundant in non-coding chloroplast DNA, and are important
for population genetic studies (Provan et al. 2001). Mono-nucleotide SSRs are most
common and are the most widely studied SSRs in chloroplast DNA (Provan et al.
2004). Few di-nucleotide, tri-nucleotide or larger SSRs have also been reported in
monocots (Scarcelli et al. 2011). The presence of microsatellites at 14 cp loci in this

51
study makes their respective primer pairs potentially useful for future genotyping
studies of taro.
The size of PCR amplicons here was designed to be suitable for efficient single read
Sanger sequencing (average size range for all loci: 648, standard deviation (σ) 201 bp,
which is well within the range for ABI3730 sequencing protocols). Among 100 primer
pairs designed for cp DNA of monocots (Scarcelli et al. 2011), 83 primer pairs can be
mapped to the taro cp genome we previously reported (Ahmed et al. 2012), and are thus
potentially useful for studies of taro. The coordinate positions of these predicted
amplicons are also indicated in Figure 1. Sixteen of the 83 primer pairs amplify the
same loci identified in our analyses. In-silico alignments of the 83 primer pairs to the cp
genome (JN105690) showed an average amplicon size of 1063, σ 453 bp in taro,
compared to that of 648, σ 201 bp for 30 primer pairs used in the present study. As an
amplicon length of 650 bp is comfortably within the current range of 454 amplicon
resequencing protocols, our primer pairs might prove more practical for future high-
throughput sequencing and genotyping of large sample sets. As it is becoming
relatively routine to sequence whole cp genomes (e.g. Atherton et al. 2010; Zhong et al.
2011; Ahmed et al. 2012; Dong et al. 2013; Goremykin et al. 2013), our approach for
developing primer sets has the potential to be readily adapted for population genetic,
phylogenetic and phylogeographic studies in other plant groups.
Our analyses suggest a need to reconsider the current taxonomic classification of two
species: Colocasia gigantea, which appears to lie far outside the genus Colocasia, and
Colocasia formosana, which appears to lie well within the species C. esculenta.
However detailed investigation of these taxa is outside the scope of this paper.
Colocasia gigantea appears phylogenetically closer to Alocasia than to other species in
Colocasia. Mitochondrial RFLP data (Matthews 1990), and previous studies of cp DNA
variation in aroids (Yoshino 1994; Nauheimer et al. 2012b) also indicate a need to
review the classification of C. gigantea. This species was previously placed in a
monotypic genus, and was named as Leucocasia gigantea (Blume) J.D. Hooker (Li &
Boyce 2010; Nauheimer et al. 2012b).
The close relationship of C. formosana (abundant in Taiwan) with geographically
distant wild taros (C. esculenta) in Australia suggests that it could be a northern ecotype
of C. esculenta. Alternatively, it might instead represent peri-patric speciation in

52
Taiwan (where wild C. esculenta has not been reported). Further ecological,
geographical and genetic studies of wild C. esculenta and C. formosana are required to
test these alternative hypotheses.
Acknowledgements
Authors acknowledge financial assistance of the New Zealand Royal Society (The New
Zealand Marsden Fund and James Cook Fellowship scheme) to PJL, JSPS KAKENHI
Japan (grant number 23405004) funding to PJM, and the Higher Education
Commission, Government of Pakistan funding to IA.
Authors’ contributions
I.A., P.J.M. and P.J.L. conceived the idea and designed the study. I.A., P.J.M. and M.N.
carried out the field work or contributed archived DNA. I.A. and P.A.M. carried out
PCRs and sequencing. I.A., P.J.B. and P.J.L. carried out phylogenetic and
bioinformatics analyses. I.A. prepared the initial draft of the manuscript, with input
from P.J.L. and P.J.M. towards its final version. All authors approved the final version
of the manuscript.
Data Accessibility
GenBank accession numbers: JN105358 – JN105674; JX971448 – JX971504. Sequence
alignments using all 30 loci: Dryad doi:10.5061/dryad.388ds.

53
Supplementary information
Supplementary Table 1. Accessions of taro and other aroid taxa used to identify polymorphic chloroplast loci and develop PCR primers
for those loci. Collection country codes: NZ (New Zealand), PK (Pakistan), AU (Australia), JP (Japan), and TW (Taiwan). IA, PJM and
MN are the collector’s initials (authors of this paper).
No. Species Massey ID Collection site Herbarium / unique code numbers and comments 1 Colocasia esculenta CESNZ01 University of Auckland
campus, NZ Massey University herbarium number MPN:46547, Purple ornamental A, leaf coll. 25-06-08 (IA, MN)
2 C. esculenta CESNZ02 University of Auckland campus, NZ
Massey University herbarium number MPN:46548. unprovenanced, triploid ‘var. RR’, leaf coll. 25-06-08 (IA, MN)
3 C. esculenta CESNZ03 University of Auckland campus, NZ
Massey University herbarium number MPN:46549, Presumed wild origin, ‘var. GP’, leaf coll. 25-06-08 (IA, MN)
4 C. esculenta CESNZ04 University of Auckland campus, NZ
purple ornamental B, leaf coll. 25-06-08 (IA, MN)
5 C. esculenta var. fontanesii
CESNZ14 Tandara Nursery, Auckland, via Auckland Botanic Gardens, NZ
Auckland Botanic Garden ID: 20040128. Ornamental, leaf coll. 26-06-08 (IA, MN)
6 C. esculenta CESPK03 Hasan Abdal District, PK PMAS-Arid Agriculture University Rawalpindi herbarium number: 125751. Cultivar, coll. 10-05-09 (IA, MN)
7 C. esculenta CESPK04 Pakpattan District, PK PMAS-Arid Agriculture University Rawalpindi herbarium number: 125752. Cultivar, coll. 15-05-09 (IA, MN)
8 C. esculenta CESAU10 Qld, AU wild, diploid, J2C, Jiyer Cave, DNA extr. 19-01-88 (PJM)

54
9 C. esculenta CESAU18 Qld, AU wild, diploid, N1, Combo’s Crossing, DNA extr. 1988 (PJM)
10 C. esculenta CESJP01 JP cv. tono-imo, Japan. Leaf sent 23-11-05 (PJM) 11 Colocasia formosana CFOTW01 Wulu, TW wild seed coll., lab. seedling 1, leaf sent 04-08-09 (PJM) 12 Colocasia fallax CFANZ01 University of Auckland
campus, NZ Massey University herbarium number MPN:46546. Grown as campus ornamental, leaf coll. 25-06-08 (IA, MN)
13 Colocasia affinis var. jenningsii
CAFAU01 ex culti England (1974) via Royal Botanic Gardens, Sydney, to Canberra, AU
cultivar, T328, DNA extr. 1988 (PJM)
14 Remusatia vivipara RVIAU01 ex Australian National Botanic Gardens, AU
wild origin, T221, DNA extr. 02-12-86 (PJM)
15 Colocasia gigantea CGIJP01 Nara, JP cv. hasu-imo, low acridity cultivar coll. 04-08-09 (PJM) 16 Alocasia brisbanensis ABRAU01 vic. Palmerston River, Qld, AU wild, N3, DNA extr. 1988 (PJM) 17 Amorphophallus konjac AKOJP01 Osaka, JP cultivar, leaf coll. 2009 (PJM) Note. Supplementary Table 2 (Number of oligonucleotide repeats, point mutations and indels in the 30 loci marked by the primer pairs
developed for taro chloroplast genome) is not suitable for the MS Word file format, and is provided in the soft copy of the thesis.

55
CHAPTER 4
Ibrar Ahmed, Peter J. Matthews, Peter J. Lockhart
(2013). A Phylogeographic study of the origins,
domestication and dispersal of taro (Colocasia
esculenta, Araceae). In preparation

56
Abstract
Taro (Colocasia esculenta L.) is a root crop in tropical to sub-tropical and temperate
regions of the world. Despite its historical and cultural significance, very few
phylogenetic and phylogeographic studies have investigated the origin, domestication
and geographically wide distribution of this crop. To provide a phylogenetic framework
for examining these issues further, 170 wild and cultivated taro accessions from Asian
and Oceanic countries were compared using six chloroplast DNA loci and two nuclear
DNA loci. Closely related out-group species were included to root the phylogenetic
tree. Findings from these analyses were that taro as a species most likely originated in
South to Southeast Asia during the Miocene to Pliocene period, and reached Sahul
(Australia and New Guinea) separately in wild and possibly cultivated forms. Neighbor-
Net and maximum likelihood analyses of the chloroplast DNA loci revealed the
existence of three main super-clades in the wider taro germplasm. These super-clades
are: (i) a subtropical to tropical Indo-Pacific (IP) super-clade consisting of wild and
cultivated, as well as diploid and triploid taros, (ii) a temperate to subtropical
Himalayan (H) super-clade consisting of triploid cultivars, and (iii) a tropical Southeast
Asian – Australian (SEAA) super-clade consisting of wild diploid taros. Support was
not found for a prevailing hypothesis of independent taro domestication in New Guinea,
nor to previous suggestions of a Gondwana origin of taro. Comparative chloroplast and
nuclear DNA analyses suggest hybridization of taro with other sympatric species in
northern Vietnam. Our inferred phylogenetic relationships provide a framework for
future taro breeding programs.

57
Introduction
Crop history, and especially the history of staple food crops, has long been a subject of
interest to agricultural scientists, archaeologists and social historians. In the modern era
of global population expansion, rapid global transport, international trade, agricultural
industrialisation, and scientific plant breeding, a small number of starchy staple crops
including sweet potato have dominated global food production, and have also
dominated crop history research across multiple disciplines. Despite being one of the
most widely-distributed food plants in pre-modern times, the phylogeography of starchy
root crop taro, Colocasia esculenta (L.) Schott (Araceae), has been studied very little.
Taro contributed an estimated 50% of staple food energy for the people living in New
Guinea during 17th century (Bourke 2012). It is still part of the diet for hundreds of
millions of people in tropical to temperate regions (Bown 1988). In 1962, worldwide
taro production was 5.06 million tonnes, which almost doubled in 50 years to yield 9.97
million tonnes in 2012 (Food and Agricultural Organization of the United Nations;
http://faostat3.fao.org/faostat-gateway/go/to/download/Q/QC/E; retrieved 27 September
2013).
The natural distribution of taro extends from Southeast Asia to tropical northern
Australia and New Guinea (Matthews 1991). Most wild taros are diploid with 28
chromosomes (Kuruvilla & Singh 1981). They produce long stolons and small corms
with low starch content, and usually have high concentrations of acrid, calcium oxalate
crystals (Matthews 1990, 1991, 2004). Cultivated taros are either diploid with 28
chromosomes, or triploid with 42 chromosomes (Yen & Wheeler 1968; Coates et al.
1988). Taro has been categorized into dasheen and eddoe morphotypes (Onyilagha et al.
1987). Dasheen types are generally diploid and have a central large corm; eddoe types
are generally triploid and possess numerous small corms. The two types cannot be
completely differentiated on the basis of ploidy levels (Ivancic & Lebot 2000). Cultivars
with large corms are common in humid tropical to sub-tropical regions, while the
cultivars with many side-corms are common from sub-tropical to temperate regions
(Matthews 2004). Triploid taros may arise through autopolyploidy (Bai et al. 1971;
Lebot & Aradhya 1991; Isshiki et al. 1999) or allopolyploidy with species in Colocasia
and Alocasia genera (Okada & Hambali 1989; Yoshino 1994, 1995; Yoshino et al.
1998), possibly through unreduced gamete formation (Matthews 1990).

58
Despite its historical and cultural significance, only a handful of studies have focused
on origin, domestication and spread of taro across different parts of the world (e.g. Spier
1951; Yen & Wheeler 1968; Matthews 1990, 1991; Lebot & Aradhya 1991). Early
botanists recorded wild taros in India, Sri Lanka, Sumatra and Malay archipelago (de
Candolle 1885; p73 and references cited therein). Most other species in genus Colocasia
are distributed in South to Southeast Asia (Matthews 1991). One suggested origin for C.
esculenta is Northeast India (Spier 1951). However, the proposal of an Asian origin for
taro is complicated by the presence of wild taro in some Pacific countries east of the
Wallace line, including Australia, New Guinea, the Solomon Islands and New
Caledonia. Lebot (2009; p 279) speculates that taro originated elsewhere, not in India,
and that the related species reported in India originated from taro. The widespread
presence of taro from South to Southeast Asia to the Pacific countries has also been
regarded as an indication of a Gondwana origin for the species (Jones & Meehan 1989;
Ivancic & Lebot 1999; Quero-garcia et al. 2010). Alternatively, wild taros in many
regions might have originated as a result of escape from cultivation followed by
naturalization (Ivancic et al. 1995; Lakhanpaul et al. 2003) or deliberate introduction
into the disturbed or wild habitats (Matthews 1991, 1995). In summary there are
multiple hypotheses for the widespread distribution of taro.
In the early part of the 20th century, the generally accepted view was that taro was
domesticated in India, from there the cultivars dispersed eastwards to Southeast and
Eastern Asia and the Pacific Islands, and westwards to Madagascar and Africa, and
from there onwards to the Caribbean region and the Americas (Yen & Wheeler 1968;
Kuruvilla & Singh 1981). In the 1970s, the discovery of archaeological evidence for
agricultural infrastructure in the highlands of New Guinea around 9000 years before
present (BP) (Golson 1976, 1977) led to the suggestion that taro, an important crop in
Melanesia, might also have been independently domesticated in New Guinea (Yen
1980; Coates et al. 1988). Subsequent field observations of wild and apparently
wildtype populations of taro in northern Australia and New Guinea (Coates et al. 1988;
Matthews 1990, 1991), and archaeological reports of starch residues derived from taro
(Loy et al. 1992; Denham et al. 2003; Fullagar et al. 2006), led credence to the
suggested domestication of taro in New Guinea (Yen 1991, 1993; Bayliss-Smith &
Golson 1992; Lebot 1999). The hypothesis of a New Guinean domestication of taro has
become a prevalent view in recent scientific literature (Matthews 2003; Denham 2004;

59
Denham et al. 2004; Lebot et al. 2004b; Purugganan & Fuller 2009; Denham 2011; but
also see Fuller 2007 for a view on domestication in India).
However, the hypothesis of taro domestication in New Guinea remains unproven. It has
very weak empirical support from the genetic and molecular analyses. Comparisons
between wild and cultivated forms of taro are needed from throughout the likely natural
geographic range of taro to substantiate this theory. Most published biochemical,
genetic and molecular studies have focused on the genetic diversity of extant cultivars
as it pertains to crop germplasm conservation, cultivar assessment, and plant breeding
(Lebot & Aradhya 1991; Matthews et al. 1992; Isshiki et al. 1995; Irwin et al. 1998;
Matsuda & Nawata 1999, 2002a; Ochiai et al. 2001; Lakhanpaul et al. 2003; Lebot,
Prana, et al. 2004; Kreike et al. 2004; Caillon et al. 2006; Mace et al. 2006; Singh et al.
2007). Less consideration has been given to data that might be more useful for testing
phylogenetic hypotheses of relationship and origin. One of the most frequently referred
papers in support of the New Guinean domestication theory is by Lebot & Aradhya
(1991) which compares isozyme variation in Asian and Oceanic wild and cultivated
taros. It revealed a narrow genetic base of the Oceanic cultivars; these cultivars were
shown to be associated with, and possibly introduced from, Indonesia. In a subsequent
review (Lebot 1999), the Oceanic cultivars were interpreted as being introduced from
New Guinea. However, the empirical data provided little support for or against this
hypothesis. The possibility that Indonesia was part of the Sundaland during the last
glacial maxima, and therefore its flora being part of the larger Asian flora, was not
discussed when interpreting the results. Archaeological studies indicate that taro was
being used in the Solomon’s Islands 28000 years BP (Loy et al. 1992). If the
identification of starch grains reported from the Solomon’s Islands is reliable as
belonging to taro (Loy et al. 1992), the same argument can be applied to the New
Guinean scenario, where it is reasonable to assume that taro was ‘cultivated’ but not
necessarily ‘domesticated’ in New Guinea (Neumann 2003). It is possible that people in
pre-historic times might have better physiological tolerance to acridity in wild taros.
Efforts might also have been made by the pre-historic people to identify and select
lesser acrid varieties and/or some pre-processing might have been undertaken before
human consumption.

60
Recently the chloroplast genomes of two morphotypes of taro were sequenced (Chapter
2; Ahmed et al. 2012). Analyses of these genomes have been used to identify and
develop 30 polymorphic chloroplast DNA loci suitable for phylogeographic studies in
taro and closely related species (Chapter 3; Ahmed et al. 2013). Chapter 3 reports
chloroplast genomic diversity in a limited selection of wild and cultivated taro,
including closely related taxa. More extensive sampling for a subset of the loci has been
investigated here. Our phylogenetic analyses suggest the existence of three main
chloroplast super-clades in taro, and numerous sub-clades. As far as possible, the
phylogenetic relationships have been examined in relation to chromosome numbers
(ploidy level), sample provenance (area of collection), and habitat (cultivated or wild).
In addition, two nuclear loci have also been characterised for a subset of taro and three
other Colocasia species. Their inclusion allows inferences to be drawn concerning the
taro super-clades, hybridization and possible polyploid origins. In geographical,
biological, and cultural terms, there are many obvious gaps in our sample set, but we
believe that the coverage achieved is sufficient to provide significant new insight into
the origins, dispersal, and domestication of taro.
Materials and methods
A total of 222 plant samples were used, 170 of which are taro, Colocasia esculenta
L.(Schott), sampled from 20 countries (Table 1). The taro samples include wild,
cultivated and ornamental accessions, as well as known diploid and triploid taros. Table
1 also lists out-groups included in phylogenetic analyses. Among 52 out-groups, 38
samples were from species within genus Colocasia and 14 samples from other aroid
genera. Details for individual accessions regarding their dates and places of collections,
habitat (wild, cultivated, ornamental) and ploidy if it is known or can be inferred are
given in Supplementary Table 1. We devised a seven-letter coding system for all
accessions, wherein the code for each accession indicates species name (first three
letters), country of collection (fourth and fifth letters), and accession number (last two
digits). For example, CESAU01 represents Colocasia esculenta, collected from
Australia, accession number 1. Where applicable, the two-letter country codes were
selected from the list of the International Organization for Standardization
(http://www.iso.org/iso/country_codes/iso_3166_code_lists/country_names_and_code_
elements.htm; retrieved 5th December 2012).
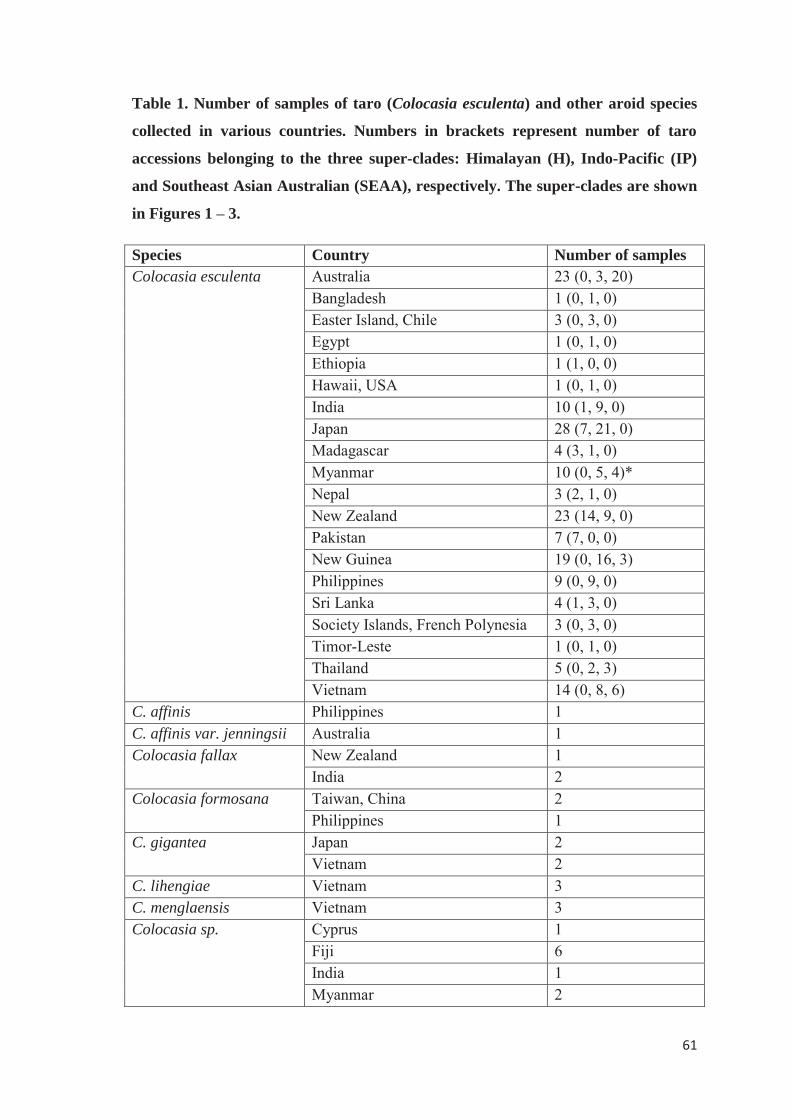
61
Table 1. Number of samples of taro (Colocasia esculenta) and other aroid species
collected in various countries. Numbers in brackets represent number of taro
accessions belonging to the three super-clades: Himalayan (H), Indo-Pacific (IP)
and Southeast Asian Australian (SEAA), respectively. The super-clades are shown
in Figures 1 – 3.
Species Country Number of samples Colocasia esculenta Australia 23 (0, 3, 20)
Bangladesh 1 (0, 1, 0) Easter Island, Chile 3 (0, 3, 0) Egypt 1 (0, 1, 0) Ethiopia 1 (1, 0, 0) Hawaii, USA 1 (0, 1, 0) India 10 (1, 9, 0) Japan 28 (7, 21, 0) Madagascar 4 (3, 1, 0) Myanmar 10 (0, 5, 4)* Nepal 3 (2, 1, 0) New Zealand 23 (14, 9, 0) Pakistan 7 (7, 0, 0) New Guinea 19 (0, 16, 3) Philippines 9 (0, 9, 0) Sri Lanka 4 (1, 3, 0) Society Islands, French Polynesia 3 (0, 3, 0) Timor-Leste 1 (0, 1, 0) Thailand 5 (0, 2, 3) Vietnam 14 (0, 8, 6)
C. affinis Philippines 1 C. affinis var. jenningsii Australia 1 Colocasia fallax New Zealand 1
India 2 Colocasia formosana Taiwan, China 2
Philippines 1 C. gigantea Japan 2
Vietnam 2 C. lihengiae Vietnam 3 C. menglaensis Vietnam 3 Colocasia sp. Cyprus 1
Fiji 6 India 1 Myanmar 2
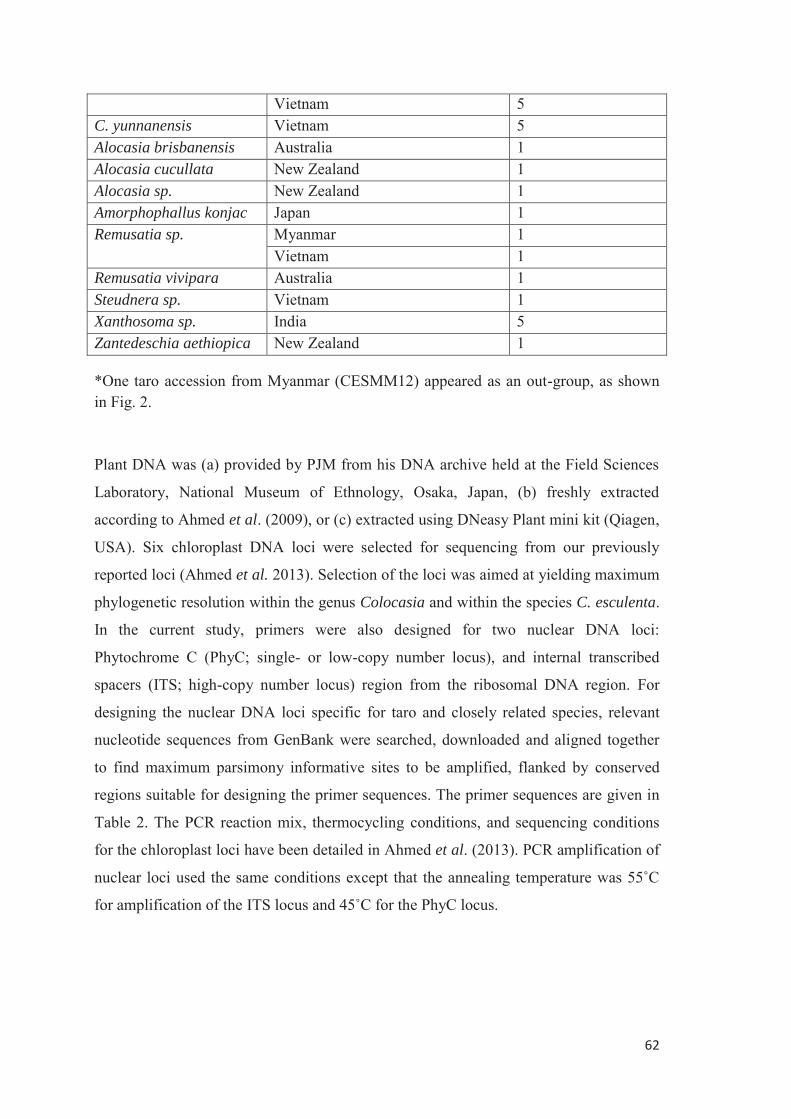
62
Vietnam 5 C. yunnanensis Vietnam 5 Alocasia brisbanensis Australia 1 Alocasia cucullata New Zealand 1 Alocasia sp. New Zealand 1 Amorphophallus konjac Japan 1 Remusatia sp. Myanmar 1
Vietnam 1 Remusatia vivipara Australia 1 Steudnera sp. Vietnam 1 Xanthosoma sp. India 5 Zantedeschia aethiopica New Zealand 1
*One taro accession from Myanmar (CESMM12) appeared as an out-group, as shown in Fig. 2.
Plant DNA was (a) provided by PJM from his DNA archive held at the Field Sciences
Laboratory, National Museum of Ethnology, Osaka, Japan, (b) freshly extracted
according to Ahmed et al. (2009), or (c) extracted using DNeasy Plant mini kit (Qiagen,
USA). Six chloroplast DNA loci were selected for sequencing from our previously
reported loci (Ahmed et al. 2013). Selection of the loci was aimed at yielding maximum
phylogenetic resolution within the genus Colocasia and within the species C. esculenta.
In the current study, primers were also designed for two nuclear DNA loci:
Phytochrome C (PhyC; single- or low-copy number locus), and internal transcribed
spacers (ITS; high-copy number locus) region from the ribosomal DNA region. For
designing the nuclear DNA loci specific for taro and closely related species, relevant
nucleotide sequences from GenBank were searched, downloaded and aligned together
to find maximum parsimony informative sites to be amplified, flanked by conserved
regions suitable for designing the primer sequences. The primer sequences are given in
Table 2. The PCR reaction mix, thermocycling conditions, and sequencing conditions
for the chloroplast loci have been detailed in Ahmed et al. (2013). PCR amplification of
nuclear loci used the same conditions except that the annealing temperature was 55˚C
for amplification of the ITS locus and 45˚C for the PhyC locus.

63
Table 2. Forward and reverse primer sequences and locus information for the chloroplast and nuclear loci used in this study. Last
column shows size (bp) in the final alignment, not for the individual sequences.
No. Primer pair
Sequence Locus GenBank Accession numbers
Size
1 ACECP005 F: AAAATGGGGTTCCTAGTGGA R: ACTCGAACTCGAAGAAATGG
rps16 intron - 5'-rps16 CDS - IGS towards trnQ KF284854 - KF285047 548
2 ACECP016 F: TTTACAGTCCGTCCCCATTA R: CATCTCTCTTTCAAGGAGGC
trnY - IGS - trnE KF285048 - KF285088 139
3 ACECP018 F: AGAGAGATCTTGTTGATATTTGT R: TAGTCATGATTCAACGGGTC
IGS between trnT & psbD KF284164 - KF284369 254
4 ACECP026 F: ACTACGGTAGAGCGGTTTAT R: AAAGTCATCTCACGTTCACC
rbcL KF284370 - KF284574 402
5 ACECP035 F: TGGTTAGGTATTGGAGCAAC R: GTGGACATTCTACAGAAGCA
petD - IGS - rpoA KF285089 - KF285278 253
6 ACECP039 F: AGTTACTCCCTTTTCCACCA R: GTAATGTTGGGGTGAACCAA
IGS between rpl22 & rps19 - rps19 - IGS - rpl2 KF284575 - KF284775 589
7 PhyC F: AAACATTTCCCTCTTGTG R: TACTTAAGCCTGTAGTAGTA
Nuclear Phytochrome C KF284811 - KF284853 769
8 ITS(colo) F: GACACACTCGCGAACGGTTGAC R: GCGTGTGCCACGGCGACGATG
Nuclear internal transcribed spacer (ITS) 1, 5.8S rDNA, ITS2
KF284776 - KF284810 563

64
The sequences from chloroplast and nuclear DNA were visualized, aligned and edited
using Geneious Pro v.6.5 (Drummond et al. 2009). Indels of varying length in the
alignments, including a hypervariable dinucleotide (AT)n microsatellite motif amplified
in the locus ACECP016, were deleted from the alignments. These sequence alignments
from six chloroplast DNA loci were concatenated using Mesquite (Maddison &
Maddison 2011) to identify putative chloroplast haplotypes. From this concatenated
alignment of 2185 nucleotides, haplotypes having identical sequence were grouped
together using SplitsTree4 (Huson & Bryant 2006). Site patterns in the alignment were
visualized as a Neighbor-Net (Bryant & Moulton 2004) constructed using SplitsTree4.
JModelTest v.2.1.3 (Darriba et al. 2012) was applied to the data to find the best model
of substitution, which happened to be the GTR+I+Г model (Tavare 1986). The
concatenated alignment was used to build an optimal maximum likelihood tree in
PhyML (Guindon & Gascuel 2003), and variation was evaluated using non-parametric
bootstrap resampling (100 bootstrap replicatess). In searching for the optimal tree, tree
space was searched using the SPR (sub-tree prune and regraft; Swofford et al. 1996)
algorithm implemented in PhyML program. FigTree v.1.4 (available at
http://tree.bio.ed.ac.uk/software/figtree/) and TreeDyn 198.3 (Chevenet et al. 2006;
available at http://www.phylogeny.fr/) were used to draw, edit and save trees.
Taking a secondary date calibration for the mean value for the split of Colocasia
esculenta from Remusatia and Steudnera (Nauheimer et al. 2012b), divergence times
were estimated for the taro super-clades using BEAST v.1.7.5 (Drummond & Rambaut
2007; Drummond et al. 2012). Divergence time estimates for the split between
Remusatia and Steudnera obtained in our study were compared with those reported by
(Nauheimer et al. 2012b) to provide an internal check on our BEAST analyses. We did
not constrain this divergence time, rather it was inferred in our runs as a tree prior.
BEAUTi v.1.7.5 (part of BEAST package) was used to generate xml files for the
BEAST input. We selected an uncorrelated lognormal relaxed clock (Drummond et al.
2006) for divergence time estimation using GTR+I+Г model of substitution, and
Coalescent constant model as tree priors. Five independent runs, each with one million
MCMC chain lengths were executed. Trees were sampled at every 1000th step. Tracer
v.1.5 (BEAST package) was used to evaluate effective sample size (ESS) in different
runs. Trees from the five runs were combined using LogCombiner v.1.7.5 (BEAST
package). A maximum clade credibility tree displaying median node heights was

65
inferred using TreeAnnotator v.1.7.5 (BEAST package), selecting burnin limit of 5000.
To study the impact of calibration dates on our inferences for the age of taro clades, we
also used calibration dates at the lower and upper ends of the 95% highest posterior
distribution (HPD) limits estimated by (Nauheimer et al. 2012b) for the split of
Colocasia esculenta from Remusatia and Steudnera.
Evidence for phylogenetic relationships and chloroplast capture suggested by the
chloroplast sequences were investigated further by analysing two nuclear loci (PhyC
and ITS) for a subset of the samples. Using the optimal GTR+I+Г model as determined
by JModelTest v.2.1.3 (Darriba et al. 2012), maximum likelihood trees were inferred
separately for these loci and then were combined to reconstruct a consensus network in
SplitsTree4 (Huson & Bryant 2006). Indels in the ITS sequence alignment were
excluded from the analyses.
Results
For six chloroplast and two nuclear DNA loci, 1285 new sequences were determined in
this study. Of these, 170 sequences were shorter than a GenBank threshold limit of 200
nt, and were not included by GenBank in their database. GenBank accession numbers
for 1115 new sequences are shown against their respective loci in Table 2. The
accession numbers assigned to individual samples for each locus are given in
Supplementary Table 2. Where applicable, we also included sequences reported
previously (Ahmed et al. 2013), as well as from the 170 sequences mentioned above, to
complement our concatenated sequence alignment. The alignments generated for the
chloroplast and nuclear loci will be submitted to Dryad. We excluded the out-groups
distant to C. esculenta from further analyses where (a) PCR primers did not amplify the
distant out-group samples at a majority of the six loci, or where (b) long-branch
attraction problems were evident in the reconstructed tree. Seventeen excluded samples
were: Zantedeschia (one), Amorphophallus (one), Colocasia sp. from Fiji (two samples,
apparently misidentified by collectors and belonging to genus Alocasia), Alocasia
(three), Colocasia gigantea (four), Colocasia fallax (one) and Xanthosoma (five). The
remaining 205 samples were included in subsequent analyses.
After concatenation of sequences from six chloroplast DNA loci, identical haplotypes
were grouped together using SplitsTree4 (Huson & Bryant 2006), which clustered 172

66
of 205 accessions into 14 distinct haplotypes. A further 13 accessions were manually
assigned to their respective haplotypes, as these accessions contained partial missing
data but no sequence polymorphism with respect to the types to which they were
assigned. Table 3 lists all accessions grouped into 14 haplotypes. Statistics of the
missing data for these 13 accessions are given in Supplementary Table 3. Including
these type groups, a total of 34 distinct haplotypes were observed for all accessions used
in this study. Figure 1 shows a Neighbor-Net reconstruction of these 34 haplotypes,
using their concatenated sequence alignment. Although the data are not strictly tree-like
due to presence of many internal splits, four main clusters were apparent in the data.
One of the clusters contained all out-groups, also including one accession from
Myanmar which was identified as C. esculenta (CESMM12). The remaining three
clusters consisted largely of Colocasia esculenta with the exception of haplotypes
TYPE1, TYPE11 and TYPE12, which were also present in at least four other Colocasia
species (Table 3). These exceptions may reflect widespread interspecific hybridization,
as discussed later.
A maximum likelihood tree built for 2185 nt long concatenated sequence alignment of
six chloroplast DNA loci is shown in Figure 2. This tree was based upon the same data
used for the Neighbor-Net analysis. In this phylogenetic reconstruction, taro (Colocasia
esculenta) was largely monophyletic, an exception being one taro accession from
Myanmar (CESMM12) which joined as an out-group. This sample, from Zi Gon in
Myanmar, was identified as wild C. esculenta at the time of collection by the collector
(PJM), and has later been reconfirmed as such from field photographs.

67
Table 3. Grouping of 185 accessions into 14 haplotypes. For each haplotype, we show the species having that type, countries of their
collection, number and identification of the accessions involved. Accessions identified in bold were manually added, as they displayed
sequences with partial missing data, but could be unequivocally assigned to the haplotypes (see Supplementary Table 3).
Type Species Country No. of accessions
Accessions
TYPE1 Colocasia esculenta Australia 3 CESAU04, CESAU07, CESAU20 Easter Island, Chile 3 CESEI01, CESEI02, CESEI03 Egypt 1 CESJP02 Hawaii, USA 1 CESHW01 India 3 CESIN03, CESIN06, CESIN09 Japan 21 CESJP01, CESJP05, CESJP09, CESJP10, CESJP11, CESJP14,
CESJP15, CESJP16, CESJP17, CESJP18, CESJP19, CESJP20, CESJP21, CESJP22, CESJP23, CESJP24, CESJP25, CESJP26, CESJP27, CESJP28, CESJP29
Madagascar 1 CESMG04 Myanmar 1 CESMM11 New Zealand 5 CESNZ01, CESNZ13, CESNZ14, CESNZ15, CESNZ20 New Guinea 16 CESPG02, CESPG03, CESPG04, CESPG05, CESPG08, CESPG09,
CESPG10, CESPG11, CESPG12, CESPG13, CESPG14, CESPG15, CESPG16, CESPG17, CESPG18, CESPG19
Philippines 6 CESPH01, CESPH02, CESPH03, CESPH04, CESPH05, CESPH09 Society Islands, French Polynesia
3 CESSI01, CESSI02, CESSI03
Thailand 2 CESTH04, CESTH05

68
Vietnam 7 CESVN01, CESVN04, CESVN05, CESVN08, CESVN09, CESVN12, CESVN14
Colocasia sp. Cyprus 1 CSPCY01 Fiji 4 CSPFJ01, CSPFJ02, CSPFJ03, CSPFJ05
C. affinis Philippines 1 CAFPH01 TYPE2 C. esculenta Australia 7 CESAU01, CESAU03, CESAU05, CESAU06, CESAU09, CESAU21,
CESAU23 New Guinea 3 CESPG01, CESPG06, CESPG07
TYPE3 C. esculenta Australia 12 CESAU08, CESAU10, CESAU11, CESAU12, CESAU13, CESAU14, CESAU15, CESAU16, CESAU17, CESAU18, CESAU19, CESAU22
TYPE4 C. esculenta Bangladesh 1 CESBD01 India 5 CESIN02, CESIN07, CESIN08, CESIN11, CESIN12 Sri Lanka 1 CESLK02 Myanmar 5 CESMM03, CESMM04, CESMM05, CESMM09, CESMM13, New Zealand 3 CESNZ03, CESNZ08, CESNZ16 Timor-Leste 1 CESTL01 Vietnam 1 CESVN06
TYPE5 C. esculenta Ethiopia 1 CESET01 Japan 7 CESJP03, CESJP04, CESJP06, CESJP07, CESJP08, CESJP12,
CESJP13 Sri Lanka 1 CESLK04 Madagascar 3 CESMG01, CESMG02, CESMG03 Nepal 1 CESNP03 New Zealand 11 CESNZ02, CESNZ05, CESNZ06, CESNZ07, CESNZ09, CESNZ11,
CESNZ12, CESNZ17, CESNZ18, CESNZ19, CESNZ21 Pakistan 2 CESPK03, CESPK04

69
TYPE6 C. esculenta Myanmar 2 CESMM02, CESMM10 TYPE7 C. esculenta Nepal 1 CESNP01
Pakistan 5 CESPK01, CESPK02, CESPK05, CESPK06, CESPK07 TYPE8 C. esculenta New Zealand 2 CESNZ22, CESNZ23 TYPE9 C. esculenta Philippines 3 CESPH06, CESPH07, CESPH08 TYPE10 C. esculenta Thailand 3 CESTH01, CESTH02, CESTH03 TYPE11 C. esculenta Vietnam 5 CESVN02, CESVN03, CESVN07, CESVN10, CESVN13
C. lihengiae Vietnam 1 CLIVN03 C. menglaensis Vietnam 1 CMEVN03 Colocasia sp. Vietnam 4 CSPVN01, CSPVN02, CSPVN03, CSPVN04 C. yunnanensis Vietnam 5 CYUVN01, CYUVN02, CYUVN03, CYUVN04, CYUVN05
TYPE12 C. esculenta Vietnam 1 CESVN11 C. lihengiae Vietnam 2 CLIVN01, CLIVN02 C. menglaensis Vietnam 2 CMEVN01, CMEVN02
TYPE13 C. formosana Taiwan, China 2 CFOTW01, CFOTW02 TYPE14 C. esculenta Myanmar 2 CESMM06, CESMM08

70
Figure 1. Neighbor-Net diagram showing clusters and splits among the samples used, based on the concatenated sequence alignment of
six chloroplast loci. Accessions grouped together as TYPES are identified in Table 3.

71
Figure 2. Maximum likelihood reconstruction based on the concatenated sequence
alignment of six chloroplast loci, showing three super-clades in taro (IP, H and
SEAA). Bootstrap values above 70 are shown. One accession of taro from
Myanmar (CESMM12) appears among the out-groups, and is likely to be a hybrid.

72
Neighbor-Net (Figure 1) and maximum likelihood tree (Figure 2) show taro accessions
clustered into three super-clades. Here we name these according to their geographic
associations as the Indo-Pacific (IP), Himalayan (H), and Southeast Asian – Australian
(SEAA) super-clades. Among these super-clades, 60% of our taro samples belonged to
the IP super-clade which is geographically the most widely distributed superclade in
sub-tropical to tropical regions. This super-clade contained wild and cultivated, as well
as diploid and triploid taros. Exact habitat status of each Indian sample in this haplotype
is not yet known, but from the available literature about the local names for different
taros in Assam, we expect these samples to be a mix of wild as well as cultivated or
escaped taros. Apart from the Indian samples, wild taros in this super-clade which did
not have the most common haplotype (TYPE1) were from Sri Lanka (CESLK03,
CESLK01) and Myanmar (CESMM07). The haplotype with the largest number of
samples in our sample set (TYPE1, with 79 accessions) belonged to this super-clade.
This haplotype contained wild as well as cultivated taros, one ornamental accession
from Philippines identified by PJM as C. affinis (CAFPH01), and five accessions
belonging to genus Colocasia but unidentified at species level. Wild taros exhibiting
this haplotype were from Myanmar, Vietnam, southern Japan, northwest Australia, and
New Guinea. Cultivars in this type ranged from Cyprus and Egypt in the Eastern
Mediterranean to Madagascar, South Asia, Southeast Asia, New Guinea, and remote
Oceania (Hawaii, Society Islands and Easter Island), as shown in Table 3.
The second super-clade, H, has been named so to reflect the likely distribution and
origin of this cool adapted super-clade in the Himalayan ranges. Among accessions
belonging to this super-clade, all those for which ploidy have been determined
(Supplementary Table 1) are triploids. The accessions for which ploidy is yet unknown
may include diploids as well as triploids. The known triploids are distributed in
temperate to sub-tropical regions from India to Ethiopia and Madagascar in the west and
New Zealand in the east. No examples of this super-clade were found in Australia or
New Guinea, areas where triploids have also not been found in previous cytological
surveys (Yen & Wheeler 1968; Coates et al. 1988; Matthews 1990). All accessions in
this super-clade are cultivars.
The third super-clade, SEAA, contained only accessions that are wild, and which were
collected from breeding taro populations. This super-clade is distributed in tropical

73
regions from Southeast Asia (Vietnam, Thailand, Myanmar) to New Guinea and
northern Australia, but is not currently found in India. Colocasia formosana, which is a
close wild relative of C. esculenta and endemic to Taiwan and Philippines, appears as a
distinct sub-clade within this super-clade. Two haplotypes from Vietnam (TYPE11 and
TYPE12) in this super-clade were also found in accessions from three species, namely
Colocasia lihengiae, C. menglaensis, and C. yunnanensis.
Estimates for the divergence times of the three taro lineages extend from late Miocene
to Pliocene, while most of the crown group representatives in the tree diverged during
the Pleistocene (Figure 3). CESNZ04, an ornamental taro accession from New Zealand
which appeared to be a fast evolving outlier (Figure 2) was excluded from the analyses
for divergence times estimates. These estimates are based upon the secondary time
calibration of 10.84 Million years ago (Ma) for the split between C. esculenta and
Remusatia / Steudnera (Nauheimer et al. 2012b). Our observation of a median value of
time of split of C. esculenta from Remusatia / Steudnera was 10.65 Ma, with median
lower and upper 95% HPD values of 4.90 Ma and 16.90 Ma, respectively. Using tree
priors, the median value of time of split between Remusatia and Steudnera calculated in
our study was 7.4 Ma, close to that of 7.75 Ma calculated by (Nauheimer et al. 2012b).
The estimated times of split for each numbered node (Figure 3) in all BEAST runs are
given in Supplementary Table 4. The lower 95% HPD values in time estimates indicate
that TYPE1 diverged from its nearest type no later than the late Pleistocene to
Holocene. The wide range of this haplotype is clearly a result of human mediated
dispersal, most likely after primary domestication of taro had taken place somewhere in
mainland Asia (India to Southeast Asia) during the early Holocene.
A consensus network of the maximum likelihood trees for a subset of taro and closely
related species, reconstructed using the nuclear loci (ITS and PhyC) is shown in Figure
4. The consensus network shows that C. esculenta does not follow grouping into three
distinct super-clades which are evident in the chloroplast DNA analyses. Representative
triploids from the Himalayan super-clade clustered together, but triploids from the IP
super-clade clustered randomly (Figure 4a). Wild species in northern Vietnam having
TYPE11 and TYPE12 chloroplast haplotype (C. esculenta, C. menglaensis,
C. lihengiae, and C. yunnanensis) were distinct from each other, while C. lihengiae
appeared very close to C. esculenta (Figure 4b).

74
Figure 3. Bayesian estimates of divergence times in the taro super-clades. The estimates for node 1 (the root) are based on mean value
for the split of Colocasia esculenta from Remusatia and Steudnera, estimated in (Nauheimer et al. 2012b). Blue bars at the nodes represent
95% Highest Posterior Distribution (HPD) range. Scale shows time in millions of years (Ma) and geological epochs where Holocene is
shown by red, Pleistocene by brown, Pliocene by purple and Miocene by cyan colours. Estimates of the divergence times at each
numbered node are given in Supplementary Table 4.

75
(a) (b)
Figure 4. Consensus network based on the maximum likelihood trees inferred for the ITS and PhyC trees loci: (a) wild and cultivated,
diploid and triploid taros sampled across the three chloroplast super-clades, (b) Colocasia species from Vietnam displaying the
chloroplast haplotypes, TYPE11 and TYPE12.

76
Discussion
Chloroplast DNA has been the most widely used source of genetic data used in plant
phylogenetic, phylogeographic and population genetic studies (e.g. Palmer 1985; Chase
et al. 1993; Powell et al. 1995; Small et al. 2004; Renner & Zhang 2004; Pleines et al.
2009; Vachon & Freeland 2011; Barniske et al. 2012; Nauheimer et al. 2012a,b). It was
thus an obvious choice in the search to find molecular markers most suited to
investigations of the evolutionary history of taro. We designed primer sets for the loci
specifically useful in yielding phylogenetic resolution at the intraspecific level in
C. esculenta (Ahmed et al. 2013), targeting mutational hotspots in taro chloroplast
genome (Ahmed et al. 2012). The present study is based upon a selection of loci from
those we previously reported.
Natural history
Our phylogenetic reconstruction (Figure 2) and divergence time estimates (Figure 3)
suggest a number of hypotheses. Specifically evident is a late Miocene to Pliocene
origin for C. esculenta. The previous suggestion of a Gondwanaland origin for taro
(Jones & Meehan 1989; Ivancic & Lebot 1999; Lebot 1999; Quero-garcia et al. 2010) is
not supported by our analyses. Our results suggest that taro reached Australia and New
Guinea from mainland Asia (Figure 2; Figure 3) by natural dispersal of a wild form
(SEAA super-clade) and also as a cultivated form (IP super-clade). Taro may have
reached tropical regions of northern Australia and New Guinea during glacial periods in
the Pleistocene (Figure 3), when sea levels were considerably lower than today (Heanay
1991). About 40,000 years ago when humans first colonized Sahul, its landmass
(today’s New Guinea, Australia and Tasmania) was connected (Bellwood 1979). A
distance of around 100 km across open ocean had to be crossed to reach Sahul from
Sundaland (Lebot 1999). Before human-mediated dispersal, birds might have played an
important role in spread of wild taro seeds between the two super-continents of
Sundaland and Sahul. In Vanuatu, the purple swamphen (Porphyrio porphyrio) has
been reported to disperse taro seeds (Caillon et al. 2006). Several subspecies of the
swamphen are distributed in Africa, Asia, Australia and New Zealand (Doss et al.
2009). The swamphen (known as Pukeko in New Zealand) has a dispersal range that
includes the Kermadec and Kempbell Islands (McLintock 1966). These are islands that
are hundreds of kilometres away from their nearest islands. As both taro and swamphen

77
prefer marshy, semi-aquatic habitats, swamphen is a good candidate agent for the long-
distance spread of taro between Sundaland and Sahul.
Despite uncertainty in estimates of times of divergence, particularly when relying on
secondary estimates rather than direct fossil calibrations (Graur & Martin 2004; Sauquet
et al. 2012), secondary estimates of times of divergence might still be useful when
results are not over interpreted (e.g. Schaefer et al. 2009; Michalak et al. 2010; de Paz
et al. 2011; Wicker et al. 2013). We have used the secondary time estimates to
approximate the times of divergence of taro lineages. The three distinct super-clades
suggested from the chloroplast DNA analysis in taro reported in this study most likely
originated early in the history of this species, during late Miocene to Pliocene (Figure
3). Such divergence time estimates have assumed that the split between C. esculenta
and Remusatia occurred within the 95% highest posterior probability range of 3.95 –
19.34 Ma, as(Nauheimer et al. 2012b).
While chloroplast DNA analyses revealed three main lineages in our taro sample set,
these lineages were not observed for the nuclear DNA loci (Figure 4a). This might
reflect differences in lineage sorting between linked chloroplast markers and nuclear
markers. Alternatively, it might be due to a more complex history of relationship for
biparental inheritance of nuclear markers and higher rates of mutations in nuclear DNA
compared to those in chloroplast DNA (Drouin et al. 2008). Breeding taro populations
belonging to the IP and SEAA super-clades and growing in sympatry are likely to have
mixed to yield new gene combinations in the nuclear genomes of wild breeding
populations.
Incongruence between gene trees inferred from nuclear DNA and organelle DNA
analyses can be indicative of hybridization (McBreen & Lockhart 2006; Joly et al.
2009; Hayakawa et al. 2011). However, phylogenetic incongruence can also result from
incomplete lineage sorting, and this needs to be considered as an alternative explanation
and rejected before accepting hybridization as the most likely explanation for the data
(Joly et al. 2009). In our findings, four Colocasia species (C. esculenta, C. lihengiae,
C. menglaensis and C. yunnanensis) along with putative morphological hybrids between
C. esculenta and C. yunnanensis accessions (Supplementary Table 1) clustered together
in chloroplast DNA analyses as haplotypes TYPE11 and TYPE12 (Table 3). The two
haplotypes were highly similar, being separated only by a single point mutation. In

78
contrast, the nuclear DNA sequences from these species are genetically very distinct.
While these observations need more rigorous testing, the findings are consistent with
chloroplast capture and hybridization among these species. In principle, the statistical
test of Joly et al. (2009) could be used to distinguish hybridization from incomplete
lineage sorting in this case. However, sequences from more nuclear loci are first needed
to reconstruct a robust, multi-locus species tree of Colocasia to apply this statistical test.
Short of applying this test, a comparative measure of the differences in nuclear and
chloroplast phylogenetic diversity (PD) among taxa might be informative. PD is defined
as the minimum combined length of all the phylogenetic branches necessary to span a
given set of taxa on the phylogenetic tree (Faith 1992b). In essence, larger PD values
correspond to greater diversity among the taxa (Faith 1992a). PD values can be readily
calculated in SplitsTree4 (Huson & Bryant 2006). We have compared the PD of
Colocasia species from northern Vietnam to the PD of C. esculenta accessions from
northern Vietnam. This was done for both nuclear and chloroplast DNA loci (Table 4).
The individual accessions studied are shown in Figure 4b. If sequence variation is best
explained by divergence and incomplete lineage sorting, relative PD values (Colocasia
species PD / C. esculenta PD) for the same taxon sets should be similar for nuclear and
chloroplast DNA loci That is, in the absence of hybridization, and even if rates of
evolution differ between nuclear and chloroplast genomes, we would still expect to see
similar relative amounts of phylogenetic diversity when comparing the same sets of
taxa. However, the results in Table 4 are inconsistent with this expectation. The ratio of
PD values for Colocasia species with respect to C. esculenta differs greatly for the
chloroplast and nuclear DNA loci. For the chloroplast DNA loci, this ratio is a fraction
of 1 (0.08). However for the nuclear DNA loci, this ratio is almost three times larger
than 1 (2.91). This observation indicates that there is much less chloroplast genetic
variation among sympatric species in northern Vietnam than there is nuclear genetic
variation. This observation is consistent with regional introgression and loss of
chloroplast diversity as a result of chloroplast capture during hybridization between
Colocasia species in Northern Vietnam.
This interpretation is also consistent with previous reports which indicate hybridization
involving C. esculenta. Okada & Hambali (1989) reported an experimental cross
between C. esculenta and C. gigantea. Yoshino (1994) reported a diploid C. esculenta
plant sample having RFLP results from chloroplast DNA similar to an Alocasia

79
macrorrhizos plant sample; both plants were growing in sympatry at low altitudes in
Nepal. The taro plant was found to be sterile, presumably reflecting genomic
incompatibility between the two species, since the ancestors of these two species
diverged more than 40 Ma (Nauheimer et al. 2012a). Intergeneric hybrids subsequently
produced by Yoshino et al. (1998) also suggest the possibility of interspecific
hybridization in Colocasia. The extent of reproductive compatibility among the putative
Colocasia hybrid plants in Northern Vietnam reported in this study has not yet been
investigated. Of particular interest would be in determining what pollinators might be
important in formation of natural interspecific hybrids. Drosophilid flies in the genus
Colocasiomyia are known pollinators of aroid plants, including Alocasia and Colocasia
(Sultana et al. 2006). Though generally considered to be host-specific, some species of
these flies are known to pollinate multiple host species (Miyake & Yafuso 2005;
Sultana et al. 2006; Toda & Lakim 2011), which could facilitate interspecific
hybridization.
Table 4. Values and ratios of Phylogenetic Diversity (PD) between Colocasia
species versus C. esculenta collected from northern Vietnam. All PD calculations
for both chloroplast and nuclear DNA loci are based upon phylogeny data for the
accessions represented in Figure 4b.
DNA *Colocasia species **C. esculenta Ratio
Chloroplast 0.000458 0.00542 0.08
Nuclear 0.1149 0.0395 2.91
*Colocasia accessions having chloroplast haplotypes TYPE11 and TYPE12.
**C. esculenta accessions having chloroplast haplotypes TYPE1, TYPE4, TYPE11 and
TYPE12.
The evidence of hybridization between C. esculenta and other aroid species leads to the
speculation that triploids in the H super-clade have arisen through interspecific
hybridizations, in which unreduced gametes were most likely contributed by
C. esculenta as a maternal parent. Presence of ambiguous codons in some of the nuclear
sequences reported in the present study might be indicative of hybridization (e.g.

80
Wagstaff et al. 2010). For example, at position 706 in the PhyC alignment, ‘R’ was
observed in the sequence chromatograms, indicating presence of both ‘A’ and ‘G’
nucleotides at this nucleotide position for all triploids in the H super-clade. In all other
accessions including the out-groups, ‘G’ was observed at this position. An allele with
‘G’ at this position codes for Glycine, but an allele with ‘A’ at this position codes for
Glutamic Acid in the translated Phytochrome C protein. The ‘A’ allele at this position
might have been contributed by yet an unknown species (not included in our sample set)
to which taro hybridized to produce triploids. Examples of hybrid triploids where the
unreduced gametes have been provided by C. esculenta acting as a maternal parent are
documented by Okada & Hambali (1989) and Yoshino et al. (2000). Yoshino (1994)
also found a triploid taro for which the unreduced gamete was supposedly contributed
by Alocasia macrorrhizos, raising the possibility that C. esculenta can act as both a
maternal as well as paternal donor of unreduced gametes. In our analysis, the taro
accession CESMM12 from Myanmar is the only example of C. esculenta not grouping
within any of the three super-clades of taro. It is possible that this accession might also
be a hybrid, having C. esculenta as the paternal parent.
Cold stress has been shown to enhance the chances of diploid gamete production in
Arabidopsis (De Storme et al. 2012). The greater prevalence of triploid taros at higher
altitudes (Kuruvilla & Singh 1981; Zhang & Zhang 1990) might also indicate that some
triploid taros have physiologies better suited for cold tolerance. Triploids in the IP
super-clade seem to have originated independent of triploids in the IP super-clade, and
may involve auto- or allopolyploidy. Autopolyploidy in taro has been well documented
(e.g. Bai et al. 1971; Tanimoto & Matsumoto 1986; Lebot & Aradhya 1991; Isshiki et
al. 1995, 1999), primarily due to occasional non-reduced gamete formation.
Domestication history
The most common chloroplast haplotype (TYPE1) is cosmopolitan in its distribution as
a cultivated lineage across continents and islands. The widespread occurrence of this
haplotype is certainly the result of human dispersal of cultivars during the Holocene.
We speculate that domestication occurred in South to Southeast Asia (most likely in
north-eastern to eastern parts of India, also suggested by Fuller 2007) for warm-adapted
cultivars in the IP super-clade, and in the eastern Himalayan region (most likely in
Southeast Asia to southern China) for cool-adapted triploid cultivars in the H super-

81
clade. The grouping of all cultivars and some wild taros from New Guinea in TYPE1 is
inconsistent with the hypothesis of New Guinea being an independent centre of primary
domestication of taro. However, secondary domestication might have taken place in
New Guinea, as a result of breeding among local wild and exotic cultivated taros. The
suggested cultivation of taro at Kuk, New Guinea 9000 – 10000 years ago might reflect
primitive ‘cultivation’ but not domestication (Neumann 2003), or a use of wild taros
similar to that suggested for the Solomon’s Islands about 28000 years ago (Loy et al.
1992). Taro starch residues from Kuk highlands belonging to above time period could
not be distinguished into cultivated or wild forms (Fullagar et al. 2006). Fullagar et al.
(2006) argue that during 6950 to 6440 years before present (BP), taro became integrated
into the New Guinean cultivation system. This remains a possibility, but earlier use of
New Guinean wild taros or local domesticates might have ceased if more elite and
successful cultivars were introduced from Asia before or after the Austronesian
expansion, 4000-3000 years ago (Spriggs 2011). The proposed Colocasian revolution
during phase 4 of Kuk highlands, after 1200 years BP (Bayliss-Smith & Golson 1992)
might actually have followed the introduction of Asian cultivars. This argument arises
from the fact that not a single cultivar from lowland or highland New Guinea appears
outside of the widely distributed haplotype (TYPE1) in our dataset. Indigenous New
Guinean cultivars with the SEAA chloroplast genome might still exist, but might be
rare. The presence in New Guinea of wild taros having TYPE1 haplotype is most easily
interpreted as (i) a result of chloroplast capture by local wild taro populations (which
otherwise have TYPE2 haplotype of the SEAA super-clade), (ii) naturalization of
TYPE1 cultivars, with or without reversion to a wildtype phenotype, or (iii) deliberate
introduction of TYPE1 wildtype taros, perhaps as pig fodder or as a food plant.
Apparently wildtype taros from Okinawa island in Japan all displayed the TYPE1
haplotype, and are likely to have been introduced for use as a pig fodder or food plant.
Historically, the use of wild taros as a pig fodder has been promoted in Vietnam, and is
still a common practice (Matsuda & Nawata 2002b). Use of wild taros in Okinawa and
the Philippines as a fodder and a famine food has also been documented previously
(Matthews 1991; Matthews et al. 2012).

82
Supplementary information
Note: Supplementary Table 1 (Information about the individual Accessions used in
this study) and Supplementary Table 2 (GenBank accession numbers of the
individual sequences generated during this study) are not suitable for the MS
Word file format, and are provided in the soft copy of the thesis.
Supplementary Table 3. Number and percentage of the missing sites for 13
accessions manually assigned to their respective haplotypes. Number of missing
sites is based on a concatenated, 2185 nucleotides long alignment. Average
percentage of the missing data is 12.58, and standard deviation is 13.11 for all 13
accessions taken together.
No. Accession I.D. Type assigned No. of missing sites Percent of missing sites
1 CESEI03 TYPE1 289 13.23 2 CESHW01 TYPE1 29 1.33 3 CESIN09 TYPE1 853 39.04 4 CESMM11 TYPE1 593 27.14 5 CESPG04 TYPE1 6 0.27 6 CESPG18 TYPE1 139 6.36 7 CSPFJ05 TYPE1 32 1.46 8 CESAU06 TYPE2 62 2.84 9 CESAU09 TYPE2 62 2.84 10 CESAU21 TYPE2 62 2.84 11 CESJP07 TYPE5 593 27.14 12 CESTH02 TYPE10 260 11.90 13 CESMM06 TYPE14 593 27.14

83
Supplementary Table 4. Bayesian estimates of divergence times in the three taro
super-clades inferred from the concatenated alignment of six chloroplast DNA loci.
Age estimates for root: 10.84 ± 1 Ma are shown in Figure 3; age estimates for root:
5.00 ± 0.5 and root: 17.00 ± 1 Ma show estimates towards lower and upper 95%
highest posterior distribution (HPD) estimates in Nauheimer et al. (2012b). Node
numbers are shown in Figure 3.
Node Root: 5.00 ± 0.5 Ma Root: 10.84 ± 1 Ma Root: 17.00 ± 1 Ma Age 95% HPD Age 95% HPD Age 95% HPD
1 4.90 3.91 – 5.86 10.65 6.65 – 12.60 16.90 14.95 – 18.90 2 3.39 1.64 – 5.06 7.40 3.78 – 11.40 11.72 6.24 – 17.05 3 4.06 2.65 – 5.44 8.88 5.78 – 11.70 13.95 9.63 – 17.92 4 3.31 1.9 – 4.68 7.15 4.14 – 10.10 11.40 6.95 – 15.72 5 0.45 0.02 – 1.02 0.80 0.05 – 2.20 1.15 0.11 – 3.55 6 1.77 0.73 – 2.95 3.66 5.53 – 6.33 6.09 2.45 – 9.80 7 0.60 0.10 – 1.29 1.15 0.17 – 2.80 2.09 0.27 – 4.44 8 1.08 0.37 – 1.88 2.20 0.85 – 4.10 3.73 1.42 – 6.60 9 0.48 0.12 – 0.96 0.97 0.23 – 2.10 1.67 0.35 – 3.25 10 0.32 0.04 – 0.68 0.62 0.10 – 1.45 1.10 0.13 – 2.28 11 0.20 0 – 0.47 0.35 0 – 1.30 0.68 0 – 1.60 12 1.37 0.49 – 2.46 2.80 0.97 – 5.18 4.65 1.70 – 8.05 13 0.53 0.10 – 1.03 1.20 0.22 – 2.23 1.75 0.04 – 3.50 14 0.16 0 – 0.40 0.51 0.08 – 1.25 0.54 0 – 1.29 15 0.26 0 – 0.59 0.28 0 – 0.85 0.90 0.10 – 1.95 16 0.86 0.20 – 1.72 1.74 0.37 – 3.68 3.0 0.67 – 5.80 17 1.81 0.80 – 2.92 3.80 1.77 – 6.20 6.23 2.90 – 9.90 18 0.46 0.08 – 0.94 0.88 0.17 – 2.40 1.57 0.29 – 3.25 19 0.24 0 – 0.57 0.43 0 – 1.24 0.82 0 – 1.96 20 1.14 0.44 – 1.95 2.35 0.97 – 4.17 3.90 1.60 – 6.40 21 0.58 0.13 – 1.15 1.18 0.25 – 2.51 2.05 0.46 – 3.90 22 0.87 0.27 – 1.52 1.75 0.63 – 3.29 2.95 1.03 – 5.10 23 0.34 0 – 0.77 0.59 0.02 – 1.68 1.11 0.03 – 2.62 24 0.40 0.05 – 0.86 0.75 0.13 – 1.85 1.38 0.21 – 2.95 25 0.16 0 – 0.41 0.27 0 – 0.87 0.53 0 – 1.36

84
CHAPTER 5
Conclusions and future outlook

85
Important conclusions of the study and future work directions
This study was aimed at (i) developing suitable molecular markers for investigating
phylogenetic and phylogeographic history of taro and closely related species, and
(ii) investigating the evolutionary relationships of a range of wild and cultivated taros,
collected from across the natural and cultivated geographic range of the species. These
aims have been met, and in so doing the work undertaken has provided a body of new
information that is significant in a number of respects.
For the sequencing of taro chloroplast genomes, two morphotypes (var. RR and var.
GP) were selected because of their distinct phenotypes and their status as historically
documented varieties in New Zealand (Matthews 1985). Subsequent chloroplast DNA
analyses assigned these two morphotypes to two of the three major super-clades within
taro. The two morphotypes have been sampled from outside of the natural geographical
range of taro. These are thought to have been introduced to New Zealand and Africa
from Asia. Some present day taro cultivars in Africa are either morphologically similar
to var. RR or to var. GP morphotypes (Ilaria Grimaldi; personal communication).
Mutational dynamics
The development of chloroplast markers for taro necessitated inquiry into the
mutational dynamics of aroid chloroplast genomes. The findings from this study
corroborate earlier observations reported for other plant groups concerning expansion
and contraction of single copy – inverted repeat boundaries and the translocation of
genes across these boundaries. The study also provided some new insights into the
overall mutational dynamics of aroid chloroplast genomes.
The two sequenced taro chloroplast genomes differed from each other in exhibiting
numerous point mutations and insertion – deletion mutations (indels). These point
mutations and indels were more densely clustered at the junctions of the small single
copy region (SSC) and inverted repeat-b (IRb).
In general, IR and SSC boundaries are very plastic in nature and known to frequently
expand or contract in angiosperms (Wang et al. 2008; Whitlock et al. 2010) and
gymnosperms (Lin et al. 2012). The polymorphic SSC – IRa boundary (also called JSA
to represent the junction of small single copy and inverted repeat-a; Lockhart et al.

86
2001) contains a variable length gene, yeast cadmium factor 1 (ycf1). This gene has
been shown important in conferring tolerance in plants against salt and metal ion
stresses (Li et al. 1997; Song et al. 2004; Koh et al. 2006). It is located inside the
inverted repeats in Lemnoidea chloroplast genomes, but is transferred to the SSC region
in taro. Since the two large inverted repeats (IRa and IRb) are slow evolving regions in
comparison to the SSC region, ycf1 when transferred into the inverted repeat regions is
expected to display less polymorphism than in the SSC region. This has also been found
in ferns where the psbA – trnH region has been translocated from the LSC into the IR
(Li et al. 2011). The evolutionary significance of such translocations is unclear. In the
case of taro, while ycf1 is located at one end of the SSC region (SSC – IRa boundary),
the NADH dehydrogenase F (ndhF) gene is located at the other (IRb – SSC boundary).
Both genes have been thought to confer tolerance to cold stress in plants (Kupsch et al.
2012). It is interesting to speculate whether or not the genomic location and rapid
evolution has any adaptive significance. Analyses of the boundary region dynamics in
other aroid taxa might be informative in this respect. With more chloroplast genomes
being currently sequenced from representative aroid taxa at the Missouri Botanical
Garden (Claudia Henriquez; personal communication), further data on the locations of
these genes are expected in the near future. In addition, comparisons of the ycf1 and
ndhF gene sequences in taro samples from different geographic regions might also
reveal the importance of distinct haplotypes in relation to abiotic conditions and stresses
in such geographic regions.
A correlation between point mutation density and indel location points has previously
been demonstrated in eukaryotic and prokaryotic nuclear genomes (Tian et al. 2008;
Zhu et al. 2009). A further association between these mutational events and
oligonucleotide was also more recently demonstrated in prokaryotic and eukaryotic
nuclear genomes (McDonald et al. 2011). The present study demonstrated and
visualised for the first time the extent of such correlations in chloroplast genomes
(Chapter 2; Ahmed et al. 2012). Since our findings were published, a subsequent study
also demonstrated a similar correlation in gymnosperm chloroplast genomes (Yi et al.
2013). If such correlations are a very general phenomenon in plant chloroplast genomes,
then there are significant theoretical and practical implications. These correlations are
unexpected under the independently and identically distributed (i.i.d.) assumption of
molecular evolution, a basic assumption for most model-based methods of phylogenetic

87
analyses. Such models include the General Time-Reversible (GTR; Tavare 1986) family
of models. Interestingly, the translocation of genes between the inverted repeat region
and single copy regions is also likely to represent another significant departure from
model based assumptions of phylogenetic analysis. A standard assumption for such
analyses is that the sequences compared in a phylogenetic analysis are under the same
evolutionary pressures. If the mutational pressure on sequence evolution differs between
the SSC and IR regions then this could amount to a type of asymmetric covarion
process currently not modelled in phylogenetic analyses (Lockhart & Steel 2005;
Gruenheit et al. 2008).
Novel chloroplast DNA markers for taro and related species
A genome-wide correlation between the locations of oligonucleotide repeats and point
mutations also suggests that knowledge of the distribution of oligonucleotide repeats
will be informative for designing molecular markers appropriate for phylogenetic and
phylogeographic studies (Chapter 2; Ahmed et al. 2012). This hypothesis was evaluated
and confirmed in the case of taro and closely related taxa (Chapter 3; Ahmed et al.
2013). This study shows that loci with a high density of oligonucleotide repeats
identified marker regions most suitable for comparing very closely related taxa, while
regions with a lower repeat density identified markers for more distantly related taxa.
These findings are highly encouraging for the development of future markers targeted at
different levels of required phylogenetic resolution in other plant taxa also. In the past,
it has been more common to simply use one locus at multiple phylogenetic levels. For
example, the chloroplast trnL – trnF region has been used to study relationships within
species (Wang et al. 2011), within a genus (Nauheimer et al. 2012a), among close
genera (Renner & Zhang 2004), within a family (Cabrera et al. 2008), among families
(Rothwell et al. 2004), and even at the basal angiosperm levels (Borsch et al. 2003).
The findings from the present study offer an alternative approach for identifying loci,
suitable to the kind of study being undertaken.
Distinct chloroplast DNA super-clades and domestication of taro
Genus Colocasia has been reported to be polyphyletic, on the basis of chloroplast as
well as nuclear DNA analyses (Nauheimer et al. 2012a). However our chloroplast DNA
analyses (Chapter 3; Ahmed et al. 2013) indicated monophyly for Colocasia with an

88
exception of C. gigantea. New species in this genus have been described in recent years
and remain genetically uncharacterised. A comprehensive investigation representing as
many species as possible is needed to clarify the monophyly or polyphyly of Colocasia.
Colocasia gigantea has been reported as an out-group to genus Colocasia in multiple
studies (Matthews 1990; Yoshino 1994; Li & Boyce 2010; Nauheimer et al. 2012b;
Ahmed et al. 2013). Consequently, its previous classification as member of a monotypic
genus, Leucocasia gigantea (Li & Boyce 2010; Nauheimer et al. 2012b) seems more
appropriate.
This is the first study to report the existence of three main super-clades in taro, based
upon chloroplast DNA analyses. The initial field sampling of the taro accessions used in
this study did not aim to include or exclude any of these super-clades, as these super-
clades were previously unknown. Figure 2(a) in Chapter 3 and Figure 2 in Chapter 4
represent contrasting associations of the taro super-clades with the out-groups, with the
former figure showing the resolution achieved with a lesser number of taro samples (10)
and more loci (30), while the latter figure showing the resolution with more taro
samples (170) and fewer loci (6). Figure 2(a) in Chapter 3 suggests that the SEAA
super-clade might be close to the out-group taxa, but figure 2 in Chapter 4 suggests that
the IP super-clade is close to the out-groups. For logistical reasons, only six loci were
selected for the wider comparisons in taro (Chapter 4). The three super-clades have very
short internal branches (Figure 1, Chapter 4); their current relationships might need to
be reconsidered with further targeted sampling from each of the three super-clades, and
complementing our dataset with more loci from chloroplast DNA. Figure 2(a) in
Chapter 3 also shows that the two wild taro accessions from Australia (CESAU10 and
CESAU18) are distinct from each other, whereas these share haplotype TYPE3 in
subsequent analyses (Table 3, Chapter 4). In investigating this anomaly, it was revealed
that sequences for both accessions were available at 10 of the 30 loci, for either one or
the other accession at 16 loci, while sequences were unavailable at the remaining four
loci for both accessions in data used to generate Figure 2(a) in Chapter 3. At the 10 loci
for which sequences were available for both accessions, a careful investigation of the
sequence chromatograms did not reveal any sequence polymorphism between the two
accessions. Hence the two accessions appear distinct (Figure 2a, Chapter 3) because of
comparisons at majority of alternate loci. In fact, both have the same haplotype, TYPE3,
as shown in Table 3 in Chapter 4.

89
Perhaps the most significant contribution in understanding the history of this crop is the
evidence suggesting a primary domestication in mainland Asia and not in New Guinea.
The prevailing hypothesis of taro domestication in New Guinea is mainly supported by
the archaeological studies and field observations of wild taros in New Guinea, as
discussed in Chapter 4. Wild and cultivated taros from New Guinea used in this study
were sampled from both, the archaeologically important highlands around Kuk, as well
as from lowlands. All cultivated samples from New Guinea belonged to the most widely
distributed haplotype TYPE1, which mainly includes cultivars. Thus New Guinean
cultivars have affinities with Asian cultivars, which probably reached the upland
societies of New Guinea and most of the tropical and subtropical regions of the world as
a result of human mediated dispersal in the Holocene time period. Domestication,
however, occurred separately for taros in the IP and H super-clades. As far as the ploidy
is known for cultivars in the H super-clade, these are all triploids (independent from the
triploid cultivars in the IP super-clade). Further targeted field exploration is required to
identify the wild diploid progenitors of the H super-clade triploids and the natural
geographic range of each of the three super-clades.
Molecular indications of interspecific hybridization, involving C. esculenta,
C. lihengiae, C. menglaensis, C. yunnanensis (Chapter 4), are the first such observations
for Colocasia in northern Vietnam. With the recent report of C. lihengiae in South Asia
(Gogoi & Borah 2013), it is possible that hybridization has taken place in an extended
region along the Himilayas, from India to China. Further wild taro populations as well
as new Colocasia species may exist in isolated valleys of the eastern and western
Himalayan foothills. This vast region, spanning from southern China to South Asia,
Southeast Asia and northern Pakistan, requires further exploration in order to define the
natural geographic range of Colocasia.
Our findings have implications for future taro breeding programs. In the past, taro from
Thailand (CESTH01 accession in our study) was used to incorporate resistance to the
fungus Phytophthora colocasiae in the Pacific taro germplasm. This multi-year
breeding program (Okpul et al. 1996; Singh & Okpul 2000) attained limited success due
to the difficulty of removing acridity and other undesirable wild characteristics in the
offspring generations (Singh et al. 2010). Our results show that the wild progenitor used
in that breeding program (CESTH01) belongs to SEAA super-clade, while the Pacific
90
cultivars are evidently derived from the IP super-clade. Resistance to P. colocasiae has
been reported in many existing Indian taro cultivars (Misra et al. 2008 for a review). It
is likely that those cultivars belong to the IP super-clade, and their resistance may have
been derived from the wild taro populations of the IP super-clade present in South Asia.
Looking for resistance in taros belonging to the IP super-clade and using these in the
future breeding programs might significantly increase the success of introducing fungal
resistance into the Pacific taro cultivars.

91
REFERENCES

92
References
Ahmed I, Biggs PJ, Matthews PJ et al. (2012) Mutational dynamics of aroid chloroplast genomes. Genome Biology and Evolution, 4, 1316–1323.
Ahmed I, Islam M, Arshad W et al. (2009) High-quality plant DNA extraction for PCR: an easy approach. Journal of Applied Genetics, 50, 105–107.
Ahmed I, Matthews PJ, Biggs PJ et al. (2013) Identification of chloroplast genome loci suitable for high-resolution phylogeographic studies of Colocasia esculenta (L.) Schott (Araceae) and closely related taxa. Molecular Ecology Resources, 13, 929–937.
Altschul SF, Madden TL, Schäffer AA et al. (1997) Gapped BLAST and PSI-BLAST: a new generation of protein database search programs. Nucleic Acids Research, 25, 3389–402.
Ara H, Hassan MA (2005) New records of three aroids from Bangladesh. Bangladesh Journal of Plant Taxonomy, 12, 25–32.
Arnold ML (1997) Natural Hybridization and Evolution. Oxford University Press, Oxford.
Asche M, Wilson MR (1989) The three taro planthoppers: species recognition in Tarophagus (Hemiptera: Delphacidae). Bulletin of Entomological Research, 79, 285–298.
Atherton RA, McComish BJ, Shepherd LD et al. (2010) Whole genome sequencing of enriched chloroplast DNA using the Illumina GAII platform. Plant Methods, 6, 22.
Bai KV, Magoon ML, Krishnan R (1971) Meiosis and pollen mitosis in diploid and triploid Colocasia antiquorum Schott. Genetica, 42, 187–198.
Barniske A-M, Borsch T, Müller K et al. (2012) Phylogenetics of early branching eudicots: comparing phylogenetic signal across plastid introns, spacers, and genes. Journal of Systematics and Evolution, 50, 85–108.
Bayliss-Smith T, Golson J (1992) A Colocasian revolution in the New Guinea Highlands? Insights from Phase 4 at Kuk. Archaeology in Oceania, 27, 1–21.
Becker M, Gruenheit N, Steel MA et al. (2013) Hybridization may facilitate in situ survival of endemic species through periods of climate change. Nature Climate Change, 3, 1039–1043.
Bellwood PS (1979) Man’s Conquest of the Pacific: the Prehistory of Southeast Asia and Oceania. Oxford University Press, New York.
Best E (1976) Māori Agriculture. Te Papa Press, Wellington.

93
Borsch T, Hilu KW, Quandt D et al. (2003) Noncoding plastid trnT-trnF sequences reveal a well resolved phylogeny of basal angiosperms. Journal of Evolutionary Biology, 16, 558–576.
Bourke RM (2012) The decline of taro and taro irrigation in Papua New Guinea. In: Senri Ethnological Studies 78: Irrigated taro (Colocasia esculenta) in the Indo-Pacific. (eds Spriggs M, Addison D, Matthews PJ), pp. 255–264. National Museum of ethnology, Osaka, Japan.
Bown D (1988) Aroids: Plants of the Arum Family. Century Hutchinson Ltd., London.
Bryant D, Moulton V (2004) Neighbor-Net: an agglomerative method for the construction of phylogenetic networks. Molecular Biology and Evolution, 21, 255–65.
Cable WJ (1984) The spread of taro (Colocasia sp.) in the Pacific. In: Edible Aroids (ed Chandra S), pp. 28–31. Clarendon Press, Oxford.
Cabrera LI, Salazar GA, Chase MW et al. (2008) Phylogenetic relationships of aroids and duckweeds (Araceae) inferred from coding and noncoding plastid DNA. American Journal of Botany, 95, 1153–1165.
Cai X-Z, Long C-L, Liu K-M (2006) Colocasia yunnanensis (Araceae), a new species from Yunnan, China. Annales Botanici Fennici, 43, 139–142.
Caillon S, Quero-Garcia J, Lescure JP, Lebot V (2006) Nature of taro (Colocasia esculenta (L.) Schott) genetic diversity prevalent in a Pacific Ocean island, Vanua Lava, Vanuatu. Genetic Resources and Crop Evolution, 53, 1273–1289.
De Candolle A (1885) Origin of Cultivated Plants. D. Appleton and Company, New York.
Cao L-M, Long C-L (2003) Colocasia bicolor (Araceae), a new species from Yunnan, China. Annales Botanici Fennici, 40, 283–286.
Carson HL, Okada T (1982) Ecology and evolution of flower-breeding pomace flies of New-Guinea (Diptera, Drosophilidae). Entomologia Generalis, 8, 13–16.
CBOL Plant Working Group (2009) A DNA barcode for land plants. Proceedings of the National Academy of Sciences of the United States of America, 106, 12794–12797.
Chase MW, Soltis DE, Olmstead RG et al. (1993) Phylogenetics of seed plants: an analysis of nucleotide sequences from the plastid gene rbcL. Annals of the Missouri Botanical Garden, 80, 528–580.
Chevenet F, Brun C, Bañuls A-L, Jacq B, Christen R (2006) TreeDyn: towards dynamic graphics and annotations for analyses of trees. BMC Bioinformatics, 7, 439.

94
Chu JY (2012) Yu Jing (The Book of Taro). In: Irrigated Taro (Colocasia esculenta) in the Indo-Pacific (eds Spriggs M, Addison D, Matthews PJ), pp. 45–51. National Museum of Ethnology, Osaka, Japan.
Coates DJ, Yen DE, Gaffey PM (1988) Chromosome variation in taro, Colocasia esculenta: implications for origin in the Pacific. Cytologia, 53, 551–560.
Collins LJ, Biggs PJ, Voelckel C (2008) An approach to transcriptome analysis of non-model organisms using short-read sequences. Genome Informatics, 21, 3–14.
Cusimano N, Sousa A, Renner SS (2012) Maximum likelihood inference implies a high, not a low, ancestral haploid chromosome number in Araceae, with a critique of the bias introduced by “x”. Annals of Botany, 109, 681–692.
Darlington CD, Wylie AP (1955) Chromosome Atlas of Flowering Plants. Allen and Unwin, London.
Darriba D, Taboada GL, Doallo R, Posada D (2012) jModelTest 2: more models, new heuristics and parallel computing. Nature methods, 9, 772.
Denham T (2004) The roots of agriculture and arboriculture in New Guinea: Looking beyond Austronesian expansion, Neolithic packages and indigenous origins. World Archaeology, 36, 610–620.
Denham T (2011) Early agriculture and plant domestication in New Guinea and Island Southeast Asia. Current Anthropology, 52, S379–S395.
Denham TP, Haberle SG, Lentfer C et al. (2003) Origins of agriculture at Kuk Swamp in the highlands of New Guinea. Science, 301, 189–93.
Denham T, Haberle S, Lentfer CJ (2004) New evidence and revised interpretations of early agriculture in Highland New Guinea. Antiquity, 78, 839–857.
Doss DPS, Gopukumar N, Sripathi K (2009) Breeding biology of purple swamphen (Porphyrio porphyrio) at Tirunelveli, South India. The Wilson Journal of Ornithology, 121, 796–800.
Drouin G, Daoud H, Xia J (2008) Relative rates of synonymous substitutions in the mitochondrial, chloroplast and nuclear genomes of seed plants. Molecular Phylogenetics and Evolution, 49, 827–31.
Drummond AJ, Ashton B, Cheung M et al. (2009) Geneious. Available from http://www.geneious.com/
Drummond AJ, Ho SYW, Phillips MJ, Rambaut A (2006) Relaxed phylogenetics and dating with confidence. PLoS Biology, 4, e88.
Drummond AJ, Rambaut A (2007) BEAST: Bayesian evolutionary analysis by sampling trees. BMC Evolutionary Biology, 7, 214.

95
Drummond AJ, Suchard MA, Xie D, Rambaut A (2012) Bayesian phylogenetics with BEAUti and the BEAST 1.7. Molecular Biology and Evolution, 29, 1969–1973.
Van Eck HJ, Han T, Jacobsen E (1998) Evaluation of the genetic diversity in taro (Colocasia esculenta) using AFLP fingerprinting. In: TANSAO 1998 Annual Report , pp. 78–82. CIRAD, Port Vila, Vanuatu.
Edgar RC (2004) MUSCLE: multiple sequence alignment with high accuracy and high throughput. Nucleic Acids Research, 32, 1792–7.
Engler A, Krause K (1920) Araceae - Colocasioideae. Wilhelm Engelmann, Leipzig.
Faith DP (1992a) Systematics and conservation: on predicting the feature diversity of subsets of taxa. Cladistics, 8, 361–373.
Faith DP (1992b) Conservation evaluation and phylogenetic diversity. Biological Conservation, 61, 1–10.
Fullagar R, Field J, Denham T, Lentfer C (2006) Early and mid Holocene tool-use and processing of taro (Colocasia esculenta), yam (Dioscorea sp.) and other plants at Kuk Swamp in the highlands of Papua New Guinea. Journal of Archaeological Science, 33, 595–614.
Fuller DQ (2007) Non-human genetics, agriculture origins and historical linguistics in South Asia. In: The Evolution and History of Human Populations in South Asia (eds Petraglia MD, Allchin B), pp. 393–443. Springer, Dordrecht, The Netherlands.
Gogoi R, Borah S (2013) Two new species and a new record for Colocasia (Araceae : Colocasieae) from Arunachal Pradesh, Northeast India. Garden’s Bulletin Singapore, 65, 27–37.
Golson (1976) Archaeology and Agricultural History in the New Guinea Highlands. In: Problems in Economic and Social Archaeology (eds Sieveking G de G, Longworth IH, Wilson KE), pp. 201–220. Duckworth, London.
Golson J (1977) No room at the top: agricultural intensification in the New Guinea Highlands. In: Sunda and Sahul: Prehistoric studies in Southeast Asia, Melanesia and Australia (eds Allen J, Golson J, Jones R), pp. 601–638. Academic Press, London.
Goremykin V V, Nikiforova S V, Biggs PJ et al. (2013) The evolutionary root of flowering plants. Systematic Biology, 62, 50–61.
Graur D, Martin W (2004) Reading the entrails of chickens: molecular timescales of evolution and the illusion of precision. Trends in Genetics, 20, 80–86.
Greenwell ABH (1947) Taro: with special reference to its culture and uses in Hawaii. Economic Botany, 1, 276–289.

96
Gruenheit N, Lockhart PJ, Steel M, Martin W (2008) Difficulties in testing for covarion-like properties of sequences under the confounding influence of changing proportions of variable sites. Molecular Biology and Evolution, 25, 1512–1520.
Guindon S, Gascuel O (2003) A simple, fast, and accurate algorithm to estimate large phylogenies by maximum likelihood. Systematic Biology, 52, 696–704.
Haberle SG (1995) Identification of cultivated Pandanus and Colocasia in pollen records and the implications for the study of early agriculture in New Guinea. Vegetation History and Archaeobotany, 4, 195–210.
Haberle SG (2005) A 23,000-yr pollen record from Lake Euramoo, Wet Tropics of NE Queensland, Australia. Quaternary Research, 64, 343–356.
Hao DC, Chen SL, Xiao PG (2010) Molecular evolution and positive Darwinian selection of the chloroplast maturase matK. Journal of Plant Research, 123, 241–247.
Hardison RC, Roskin KM, Yang S et al. (2003) Covariation in frequencies of substitution, deletion, transposition, and recombination during eutherian evolution. Genome Research, 13, 13–26.
Hay A (1996) A new Bornean species of Colocasia Schott (Araceae: Colocasieae) with a synopsis of the genus in Malesia and Australia. Sandakania, 7, 31–48.
Hayakawa H, Hamachi H, Matsuyama K et al. (2011) Interspecific hybridization between Arisaema sikokianum and A. serratum (Araceae) confirmed through nuclear and chloroplast DNA comparisons. American Journal of Plant Sciences, 02, 521–526.
Hayata B (1919) Colocasia formosana. In: Icon. Pl. Formosan. , pp. 133–134.
Heanay LR (1991) A synopsis of climate and vegetational change in Southeast Asia. Climate Change, 19, 53–61.
Hill AF (1939) The nomenclature of the taro and its varieties. Botanical Museum Leaflets, Harvard University, 7, 113–118.
Hillis DM (1996) Inferring complex phylogenies. Nature, 383, 130–131.
Hooker JD (1894) Flora of British India. L. Reeve & Co., London.
Hu K, Huang XF, Ke WD, Ding Y (2009) Characterization of 11 new microsatellite loci in taro (Colocasia esculenta). Molecular Ecology Resources, 9, 582–584.
Hunt H V., Moots HM, Matthews PJ (2013) Genetic data confirms field evidence for natural breeding in a wild taro population (Colocasia esculenta) in northern Queensland, Australia. Genetic Resources and Crop Evolution, 60, 1695–1707.

97
Huson DH, Bryant D (2006) Application of phylogenetic networks in evolutionary studies. Molecular Biology and Evolution, 23, 254–267.
Irwin S V, Kaufusi P, Banks K, Pe R De, Cho JJ (1998) Molecular characterization of taro (Colocasia esculenta) using RAPD markers. Euphytica, 99, 183–189.
Isshiki S, Nakada M, Nakamura N, Tashiro Y, Miyazaki S (1995) Genetic systems and variations of isozymes in wild taro (Colocasia esculenta Schott) from Bangladesh. Journal of the Japanese Society for Horticultural Science, 64, 113–9.
Isshiki S, Otsuka K, Tashiro Y, Miyazaki S (1999) A probable origin of triploids in taro. Journal of the Japanese Society for Horticultural Science, 68, 774–779.
Ivancic A, Lebot V (1999) Botany and genetics of New Caledonian wild taro, Colocasia esculenta. Pacific Science, 53, 273–285.
Ivancic A, Lebot V (2000) The Genetics and Breeding of Taro. CIRAD.
Ivancic A, Lebot V, Roupsard O, Garcia JQ, Opkul T (2004) Thermogenic flowering of taro (Colocasia esculenta, Araceae). Canadian Journal of Botany, 82, 1557–1565.
Ivancic A, Okpul T, Ososo EK (1995) Wild taro, Colocasia esculenta (L.) Schott, populations in Papua New guinea. Papua New Guinea Journal of Agriculture Forestry and Fisheries, 38, 31–45.
Jackson GVH, Pelomo PM (1980) Breeding for resistance to diseases of taro, Colocasia esculenta, in Solomon Islands. In: International Symposium on Taro and Cocoyam, Visayas State College of Agriculture, Baybay, Leyte , pp. Provisional Report No 5, 287–298. International Foundation for Science, Stockholm.
Jianchu X, Yongping Y, Yingdong P, Ayad WG, Eyzaguirre PB (2001) Genetic diversity in taro (Colocasia esculenta Schott, Araceae) in China: an ethnobotanical and genetic approach. Economic Botany, 55, 14–31.
Joly S, McLenachan PA, Lockhart PJ (2009) A statistical approach for distinguishing hybridization and incomplete lineage sorting. The American Naturalist, 174, E54–70.
Jones R, Meehan B (1989) Plant foods of the Gidjingali: Ethnographic and archaeological perspectives from northern Australia. In: Foraging and Farming: The Evolution of Plant Exploitation. (eds Harris DR, Hillman GC), pp. 120–135. Unwin Hyman, London.
Jukes T, Cantor C (1969) Evolution of protein molecules. In: Mammalian Protein Metabolism (ed Munro H), pp. 21–132. Academic Press, New York.
Katoh K, Kuma K, Toh H, Miyata T (2005) MAFFT version 5: improvement in accuracy of multiple sequence alignment. Nucleic Acids Research, 33, 511–8.

98
Kawahara T (1978) Chromosome numbers of taros in Nepal and India. Chromosome Information Service, 24, 4–5.
Kawata M, Harada T, Shimamoto Y, Oono K, Takaiwa F (1997) Short inverted repeats function as hotspots of intermolecular recombination giving rise to oligomers of deleted plastid DNAs (ptDNAs). Current Genetics, 31, 179–84.
Kim K-J, Lee H-L (2005) Widespread occurrence of small inversions in the chloroplast genomes of land plants. Molecules and Cells, 19, 104–113.
Koh E-J, Song W-Y, Lee Y et al. (2006) Expression of yeast cadmium factor 1 (YCF1) confers salt tolerance to Arabidopsis thaliana. Plant Science, 170, 534–541.
Kokubugata G, Konishi T (1999) Implication of a basic chromosome number of x=14 in seven cultivars of two varieties of Colocasia esculenta by fluorescent in situ hybridization using rDNA probe. Cytologia, 64, 77–83.
Kreike CM, Van Eck HJ, Lebot V (2004) Genetic diversity of taro, Colocasia esculenta (L.) Schott, in Southeast Asia and the Pacific. Theoretical and Applied Genetics, 109, 761–8.
Krzywinski M, Schein J, Birol I et al. (2009) Circos: an information aesthetic for comparative genomics. Genome Research, 19, 1639–45.
Kugita M, Kaneko A, Yamamoto Y et al. (2003) The complete nucleotide sequence of the hornwort (Anthoceros formosae) chloroplast genome: insight into the earliest land plants. Nucleic Acids Research, 31, 716–721.
Kumazawa S, Niuchi K, Honda F (1956) Classification of the taro varieties in Japan. Journal of the Japanese Society for Horticultural Science, 25, 1–10.
Kupsch C, Ruwe H, Gusewski S et al. (2012) Arabidopsis chloroplast RNA binding proteins CP31A and CP29A associate with large transcript pools and confer cold stress tolerance by influencing multiple chloroplast RNA processing steps. The Plant Cell, 24, 4266–4280.
Kurtz S, Choudhuri J V, Ohlebusch E et al. (2001) REPuter: the manifold applications of repeat analysis on a genomic scale. Nucleic Acids Research, 29, 4633–42.
Kuruvilla KM, Singh A (1981) Karyotypic and electrophoretic studies on taro and its origin. Euphytica, 30, 405–413.
De la Pena RS (1970) The edible aroids in the Asian-Pacific area. In: Proceedings of the Second International Symposium on Tropical Root and Tuber Crop , pp. 136–140. University of Hawaii, Honolulu.
Lakhanpaul S, Velayudhan KC, Bhat K V (2003) Analysis of genetic diversity in Indian taro [Colocasia esculenta (L.) Schott] using random amplified polymorphic DNA (RAPD) markers. Genetic Resources and Crop Evolution, 50, 603–609.

99
Lebot V (1992) Genetic vulnerability of Oceanias traditional crops. Experimental Agriculture, 28, 309–323.
Lebot V (1999) Biomolecular evidence for plant domestication in Sahul. Genetic Resources and Crop Evolution, 46, 619–628.
Lebot V (2009) Tropical Root and Tuber Crops: Cassava, Sweet Potato, Yams and Aroids. CAB International, Oxfordshire, UK.
Lebot V, Aradhya KM (1991) Isozyme variation in taro (Colocasia esculenta (L.) Schott) from Asia and Oceania. Euphytica, 56, 55–66.
Lebot V, Garcia JQ, Ivancic A (2004a) Networking with taro: a review of TANSAO achievements. In: 3rd Taro Symposium (eds Guarino L, Taylor M, Osborn T), pp. 52–57. Secretariat of the Pacific Community, Suva, Fiji.
Lebot V, Prana MS, Kreike N et al. (2004b) Characterisation of taro (Colocasia esculenta (L.) Schott) genetic resources in Southeast Asia and Oceania. Genetic Resources and Crop Evolution, 51, 381–392.
Lee H-L, Jansen RK, Chumley TW, Kim K-J (2007) Gene relocations within chloroplast genomes of Jasminum and Menodora (Oleaceae) are due to multiple, overlapping inversions. Molecular Biology and Evolution, 24, 1161–80.
Levinson G, Gutman G (1987) Slipped-strand mispairing: a major mechanism for DNA sequence evolution. Molecular Biology and Evolution, 4, 203–221.
Li H, Boyce PC (2010) Colocasia. In: Flora of China, Text Volume 23, Acoraceae through Cyperaceae (eds Zhengyi W, Raven PH, Deyuan H), pp. 73–75. Science Press and Missouri Botanical Garden Press, Beijing and St. Louis.
Li H, Durbin R (2009) Fast and accurate short read alignment with Burrows-Wheeler transform. Bioinformatics, 25, 1754–60.
Li F-W, Kuo L-Y, Rothfels CJ et al. (2011) rbcL and matK earn two thumbs up as the core DNA barcode for ferns. PloS One, 6, e26597.
Li H, Long C-L (1999) A new species of Colocasia (Araceae) from Mts. Gaoligong, China. Feddes Repertorium, 110, 423–424.
Li Z-S, Lu Y-P, Zhen R-G et al. (1997) A new pathway for vacuolar cadmium sequestration in Saccharomyces cerevisiae: YCF1-catalyzed transport of bis(glutathionato)cadmium. Proceedings of the National Academy of Sciences of the United States of America, 94, 42–47.
Lin C-P, Wu C-S, Huang Y-Y, Chaw S-M (2012) The complete chloroplast genome of Ginkgo biloba reveals the mechanism of inverted repeat contraction. Genome Biology and Evolution, 4, 374–381.

100
Liò P, Goldman N (1998) Models of molecular evolution and phylogeny. Genome Research, 8, 1233–1244.
Lockhart PJ, Mclenachan PA, Havell D et al. (2001) Phylogeny, radiation, and transoceanic dispersal of New Zealand alpine buttercups: molecular evidence under split decomposition. Annals of the Missouri Botanical Garden, 88, 458–477.
Lockhart P, Steel M (2005) A tale of two processes. Systematic Biology, 54, 948–951.
Long CI, Li H (2000) Colocasia gongii (Araceae), a new species from Yunnan , China. Feddes Repertorium, 111, 559–560.
Long C, Liu K (2001) Colocasia lihengiae (Araceae: Colocasieae), a new species from Yunnan , China. Botanical Bulletin of Academia Sinica, 42, 313–317.
Lowry R (2012) Concepts & Applications of Inferential Statistics. Vassar College, Poughkeepsie, NY.
Loy TH, Spriggs M, Wicklet S (1992) Direct evidence for human use of plants 28,000 years ago: starch residues on stone artefacts from the northern Solomon Islands. Antiquity, 66, 898–912.
Mace ES, Godwin ID (2002) Development and characterization of polymorphic microsatellite markers in taro (Colocasia esculenta). Genome, 45, 823–832.
Mace ES, Mathur PN, Izquierdo L et al. (2006) Rationalization of taro germplasm collections in the Pacific Island region using simple sequence repeat (SSR) markers. Plant Genetic Resources, 4, 210–220.
Maddison WP, Maddison DR (2011) Mesquite: a modular system for evolutionary analysis.
Magee AM, Aspinall S, Rice DW et al. (2010) Localized hypermutation and associated gene losses in legume chloroplast genomes. Genome Research, 20, 1700–1710.
Mallet J (2007) Hybrid speciation. Nature, 446, 279–83.
Mardanov A V, Ravin N V, Kuznetsov BB et al. (2008) Complete sequence of the duckweed (Lemna minor) chloroplast genome: structural organization and phylogenetic relationships to other angiosperms. Journal of Molecular Evolution, 66, 555–64.
Martin W, Rujan T, Richly E et al. (2002) Evolutionary analysis of Arabidopsis, cyanobacterial, and chloroplast genomes reveals plastid phylogeny and thousands of cyanobacterial genes in the nucleus. Proceedings of the National Academic of Sciences of the United States of America, 99, 12246–51.
Masood MS, Nishikawa T, Fukuoka S-I et al. (2004) The complete nucleotide sequence of wild rice (Oryza nivara) chloroplast genome: first genome wide comparative sequence analysis of wild and cultivated rice. Gene, 340, 133–9.
101
Matsuda M, Nawata E (1999) Isozymes variation in taro, Colocasia esculenta. Tropics, 8, 397–407.
Matsuda M, Nawata E (2002a) Geographical distribution of ribosomal DNA variation in taro, Colocasia esculenta ( L.) Schott, in eastern Asia. Euphytica, 128, 165–172.
Matsuda M, Nawata E (2002b) Taro in Northern Vietnam: Its uses, cultivation, and genetic variation. Japanese Journal of Tropical Agriculture, 46, 247–258.
Matthews P (1985) Nga taro o Aotearoa. Journal of the Polynesian Society, 94, 253–272.
Matthews PJ (1990) The Origin, Dispersal and Domestication of Taro. Australian National University, Canberra.
Matthews PJ (1991) A possible tropical wildtype taro: Colocasia esculenta var. aquatilis. Indo-Pacific Prehistory Association Bulletin, 11, 69–81.
Matthews PJ (1995) Aroids and the Austronesians. Tropics, 4, 105–126.
Matthews PJ (2003) Taro planthoppers (Tarophagus spp.) in Australia and the origins of taro (Colocasia esculenta) in Oceania. Archaeology in Oceania, 38, 192–202.
Matthews PJ (2004) Genetic diversity in taro, and the preservation of culinary knowledge. Ethnobotany Research & Applications, 2, 55–71.
Matthews PJ (2006) Written records of taro in the Eastern Mediterranean. In: Proceedings of the IVth International Congress of Ethnobotany (ICEB 2005) (ed Ertug ZF), pp. 419–426. Yeditepe University, Istanbul Turkey.
Matthews PJ, Agoo EMG, Tandang DN, Madulid DA (2012) Ethnobotany and ecology of wild taro (Colocasia esculenta) in the Philippines: implications for domestication and dispersal. In: Senri Ethnological Studies 78: Irrigated taro (Colocasia esculenta) in the Indo-Pacific. (eds Spriggs M, Addison D, Matthews PJ), pp. 307–340. National Museum of Ethnology, Osaka, Japan.
Matthews P, Matsushita Y, Sato T, Hirai M (1992) Ribosomal and mitochondrial DNA variation in Japanese taro (Colocasia esculenta L. Schott). Japanese Journal of Breeding, 42, 825–833.
Matthews PJ, Naing KW (2005) Notes on the provenance and providence of wildtype taros (Colocasia esculenta) in Myanmar. Bulletin of the National Museum of Ethnology, 29, 587–615.
Matthews PJ, Terauchi R (1994) The genetics of agriculture: DNA variation in taro and yam. In: Tropical Archaeobotany: Applications and New Developments (ed Hather JG), pp. 251–270. Routledge, London and New York.
McBreen K, Lockhart PJ (2006) Reconstructing reticulate evolutionary histories of plants. Trends in Plant Science, 11, 398–404.

102
McDonald MJ, Wang W-C, Huang H-D, Leu J-Y (2011) Clusters of nucleotide substitutions and insertion/deletion mutations are associated with repeat sequences. PLoS Biology, 9, e1000622.
McLenachan PA, Stöckler K, Winkworth RC et al. (2000) Markers derived from amplified fragment length polymorphism gels for plant ecology and evolution studies. Molecular Ecology, 9, 1899–903.
McLintock AH (1966) Pukeko. An Encyclopaedia of New Zealand.
Michalak I, Zhang L-B, Renner SS (2010) Trans-Atlantic, trans-Pacific and trans-Indian Ocean dispersal in the small Gondwanan Laurales family Hernandiaceae. Journal of Biogeography, 37, 1214–1226.
Millen RS, Olmstead RG, Adams KL et al. (2001) Many parallel losses of infA from chloroplast DNA during angiosperm evolution with multiple independent transfers to the nucleus. Plant Cell, 13, 645–58.
Milne I, Bayer M, Cardle L et al. (2010) Tablet - next generation sequence assembly visualization. Bioinformatics, 26, 401–2.
Misra RS, Sharma K, Mishra AK (2008) Phytophthora leaf blight of taro (Colocasia esculenta) – a review. The Asian and Australasian Journal of Plant Science and Biotechnology, 2, 55–63.
Miyake T, Yafuso M (2005) Pollination of Alocasia cucullata (Araceae) by two Colocasiomyia flies known to be specific pollinators for Alocasia odora. Plant Species Biology, 20, 201–208.
Morgenstern B (2004) DIALIGN: multiple DNA and protein sequence alignment at BiBiServ. Nucleic Acids Research, 32, W33–6.
Nauheimer L (2012) Molecular Systematics and Historical Biogeography of Araceae at a Worldwide Scaleand in Southeast Asia. Ludwig Maximilian University of Munich.
Nauheimer L, Boyce PC, Renner SS (2012a) Giant taro and its relatives: a phylogeny of the large genus Alocasia (Araceae) sheds light on Miocene floristic exchange in the Malesian region. Molecular Phylogenetics and Evolution, 63, 43–51.
Nauheimer L, Metzler D, Renner SS (2012b) Global history of the ancient monocot family Araceae inferred with models accounting for past continental positions and previous ranges based on fossils. The New Phytologist, 195, 938–950.
Neumann K (2003) New Guinea: a cradle of agriculture. Science, 301, 180–181.
Nyman LP, Arditti J (1985) Germination of taro seeds. Aroideana, 8, 83–88.

103
Ochiai T, Nguyen VX, Tahara M, Yoshino H (2001) Geographical differentiation of Asian taro, Colacasia esculenta (L.) Schott, detected by RAPD and isozyme analyses. Euphytica, 122, 219–234.
Okada H, Hambali GG (1989) Chromosome behaviors in meiosis of the inter-specific hybrids between Colocasia esculenta (L.) Schott and C. gigantea Hook. f . Cytologia, 54, 389–393.
Okpul T, Ivancic A, Simin A (1996) Evaluation of leaf blight resistant taro (Colocasia esculenta) varieties for Bubia, Morobe Province, Papua New Guinea. Papua New Guinea Journal of Agriculture, Forestry and Fisheries, 40, 13–18.
Onwueme IC (1978) The Tropical Tuber Crops. John Wiley & Sons, Inc., New York.
Onyilagha JC, Omenyi AS, Illoh HC, Lowe J (1987) Colocasia esculenta (L.) Schott, Colocasia antiquorum Schott, how many species? 1. A preliminary investigation. Euphytica, 36, 687–692.
Page RDM (1996) TreeView: an application to display phylogenetic trees on personal computers. Computer Applications in the Biosciences, 12, 357–358.
Palmer JD (1985) Chloroplast DNA and molecular phylogeny. Bioessays, 2, 263–267.
Palmer JD (1991) Plastid chromosomes: structure and evolution. In: Cell Culture and Somatic Cell Genetics in Plants, Vol 7A, The Molecular Biology of Plastids (eds Vasil IK, Bogorad L), pp. 5–53. Academic Press Inc, San Diego.
Parks M, Cronn R, Liston A (2009) Increasing phylogenetic resolution at low taxonomic levels using massively parallel sequencing of chloroplast genomes. BMC Biology, 7, 84.
Parvin S, Kabir G, Ud-Deen MM, Sarker JK (2009) Karyotype analysis of seven varieties of taro Colocasia esculenta (L.) Schott. from Bangladesh. Journal of Bio-Science, 16, 15–18.
Patel MZ, Saelea J, Jackson GVH (1984) Breeding strategies for controlling disease of taro in Solomon Islands. In: Proceedings of the International Society for Tropical Root Crops , pp. 143–149. International Potato Centre CIP, Lima.
De Paz GA, Cubas P, Divakar PK, Lumbsch HT, Crespo A (2011) Origin and diversification of major clades in Parmelioid lichens (Parmeliaceae, Ascomycota) during the Paleogene inferred by bayesian analysis. Plos One, 6, e28161.
Pleines T, Jakob SS, Blattner FR (2009) Application of non-coding DNA regions in intraspecific analyses. Plant Systematics and Evolution, 282, 281–294.
Plucknett DL (1983) Taxonomy of the genus Colocasia. In: Taro: A Review of Colocasia esculenta and its Potentials (ed Wang J-K), pp. 14–33. University of Hawaii Press, Honolulu.

104
Plucknett DL (1984) Edible aroids. In: Evolution of Crop Plants (ed Simmonds NW), pp. 10–12. Longman, London.
Powell W, Morgante M, McDevitt R, Vendramin GG, Rafalski JA (1995) Polymorphic simple sequence repeat regions in chloroplast genomes: applications to the population genetics of pines. Proceedings of the National Academy of Sciences of the United States of America, 92, 7759–7763.
Provan J, Biss PM, McMeel D, Mathews S (2004) Universal primers for the amplification of chloroplast microsatellites in grasses (Poaceae). Molecular Ecology Notes, 4, 262–264.
Provan J, Powell W, Hollingsworth PM (2001) Chloroplast microsatellites: new tools for studies in plant ecology and evolution. Trends in Ecology & Evolution, 16, 142–147.
Purseglove JW (1972) Tropical crops: monocotyledons. Longman Press, London.
Purugganan MD, Fuller DQ (2009) The nature of selection during plant domestication. Nature, 457, 843–8.
Quero-garcia J, Ivancic A, Lebot V (2010) Taro and cocoyam. In: Root and Tuber Crops, Handbook of Plant Breeding. Vol. 7 (ed Bradshaw JE), pp. 149–172. Springer New York, New York, NY.
Ramachandran K (1978) Cytological studies on South Indian Araceae. Cytologia, 43, 289–303.
Rao VR, Hunter D, Eyzaguirre PB, Matthews PJ (2010) Ethnobotany and global diversity of taro. In: The Global Diversity of Taro: Ethnobotany and Conservation (eds Rao VR, Matthews PJ, Eyzaguirre PB, Hunter D), pp. 1–5. Bioversity International, Rome, Italy.
Rattenbury JA (1956) Cytotaxonomy and the migration of primitive peoples. Nature, 178, 545–546.
Raubeson LA, Peery R, Chumley TW et al. (2007) Comparative chloroplast genomics: analyses including new sequences from the angiosperms Nuphar advena and Ranunculus macranthus. BMC Genomics, 8, 174.
Renner SS (2005) Relaxed molecular clocks for dating historical plant dispersal events. Trends in Plant Science, 10, 550–558.
Renner S, Zhang L-B (2004) Biogeography of the Pistia clade (Araceae): Based on chloroplast and mitochondrial DNA sequences and Bayesian divergence time inference. Systematic Biology, 53, 422–432.
Ripplinger J, Sullivan J (2010) Assessment of substitution model adequacy using frequentist and Bayesian methods. Molecular Biology and Evolution, 27, 2790–2803.

105
Rothwell GW, Atta MR Van, Ballard Jr HE, Stockey RA (2004) Molecular phylogenetic relationships among Lemnaceae and Araceae using the chloroplast trnL–trnF intergenic spacer. Molecular Phylogenetics and Evolution, 30, 378–385.
Rozen S, Skaletsky H (2000) Primer3 on the WWW for general users and for biologist programmers. In: Bioinformatics Methods and Protocols: Methods in Molecular Biology (eds Misener S, Krawetz SA), pp. 365–86. Humana Press, Totowa, NJ.
Sammut R, Huttley G (2011) Regional context in the alignment of biological sequence pairs. Journal of Molecular Evolution, 72, 147–59.
Sauquet H, Ho SYW, Gandolfo MA et al. (2012) Testing the impact of calibration on molecular divergence times using a fossil-rich group: the case of Nothofagus (Fagales). Systematic Biology, 61, 289–313.
Scarcelli N, Barnaud A, Eiserhardt W et al. (2011) A set of 100 chloroplast DNA primer pairs to study population genetics and phylogeny in monocotyledons. PloS One, 6, e19954.
Schaefer H, Heibl C, Renner SS (2009) Gourds afloat: a dated phylogeny reveals an Asian origin of the gourd family (Cucurbitaceae) and numerous oversea dispersal events. Proceedings of the Royal Society B-Biological sciences, 276, 843–51.
Seehausen O (2004) Hybridization and adaptive radiation. Trends in Ecology and Evolution, 19, 198–207.
Segawa K (1953) The means of subsistence among the Formosan aborigines. The Japanese Journal of Ethnology, 18, 49–66.
Shaw J, Lickey EB, Schilling EE, Small RL (2007) Comparison of whole chloroplast genome sequences to choose noncoding regions for phylogenetic studies in angiosperms: the tortoise and the hare III. American Journal of Botany, 94, 275–288.
Silva JC, Kondrashov AS (2002) Patterns in spontaneous mutation revealed by human-baboon sequence comparison. Trends in Genetics, 18, 544–7.
Singh D, Hunter D, Iosefa T et al. (2010) Improving taro production in the South Pacific through breeding and selection. In: The Global Diversity of Taro: Ethnobotany and Conservation (eds Rao R V., Matthews PJ, Eyzaguirre PB, Hunter D), pp. 168–184. Bioversity International, Rome, Italy.
Singh D, Mace ES, Godwin ID et al. (2007) Assessment and rationalization of genetic diversity of Papua New Guinea taro (Colocasia esculenta) using SSR DNA fingerprinting. Genetic Resources and Crop Evolution, 55, 811–822.
Singh D, Okpul T (2000) Evaluation of 12 taro (Colocasia esculenta (L.) Schott) leaf blight-resistant clones for yield and eating quality in Papua New Guinea. SABRAO Journal of Breeding and Genetics, 32, 39–45.

106
Small RL, Cronn RC, Wendel JF (2004) Use of nuclear genes for phylogeny reconstruction in plants. Australian Systematic Botany, 17, 145–170.
Song W, Martinoia E, Lee J et al. (2004) A novel family of Cys-rich membrane proteins mediates Cadmium resistance in Arabidopsis. Plant Physiology, 135, 1027–1039.
Spier RFG (1951) Some notes on the origin of taro. Southwestern Journal of Anthropology, 7, 69–76.
Spriggs M (2011) Archaeology and the Austronesian expansion: where are we now? Antiquity, 85, 510–528.
Sreekumari MT (1997) Cytological studies in taro – a review. Journal of Root Crops, 23, 1–7.
De Storme N, Copenhaver GP, Geelen D (2012) Production of diploid male gametes in Arabidopsis by cold-induced destabilization of postmeiotic radial microtubule arrays. Plant Physiology, 160, 1808–1826.
Sultana F, Hu Y, Toda MJ, Takenaka K, Yafuso M (2006) Phylogeny and classification of Colocasiomyia (Diptera, Drosophilidae), and its evolution of pollination mutualism with aroid plants. Systematic Entomology, 31, 684–702.
Swofford DL (2003) Phylogenetic Analysis Using Parsimony (*and Other Methods). Sinauer Associates, Sunderland, Massachusetts.
Swofford D, Olsen G, Waddell P, Hillis D (1996) Phylogenetic inference. In: Molecular Systematics (eds Hillis DM, Moritz C, Mable BK), pp. 407 – 514. Sinauer Associates, Sunderland, Massachusetts.
Tahara M, Suefuji S, Ochiai T, Yoshino H (1999) Phylogenetic relationships of taro, Colocasia esculenta (L.) Schott and related taxa by non-coding chloroplast DNA sequence analysis. Aroideana, 22, 79–89.
Tanimono T (1998) Classification and dispersal of Japanese taro. Technol. Cult. Agric. (Nokou no Gijutsu to Bunka), 21, 71–98.
Tanimoto T, Matsumoto T (1986) Variations of morphological characters and isozyme patterns in Japanese cultivars of Colocasia esculenta Schott and C. gigantea Hook. Japanese Journal of Breeding, 36, 100–111.
Tavare S (1986) Some probabilistic and statistical problems in the analysis of DNA sequences. In: Lectures on Mathematics in the Life Sciences1 (ed Miura RM), pp. 57–86. American Mathematical Society, Providence.
Tian D, Wang Q, Zhang P et al. (2008) Single-nucleotide mutation rate increases close to insertions/deletions in eukaryotes. Nature, 455, 105–8.

107
Toda MJ, Lakim MB (2011) Genus Colocasiomyia (Drosophilidae: Diptera) in Sabah, Bornean Malaysia: High species diversity and use of host aroid inflorescences. Entomological Science, 14, 262–270.
Vachon N, Freeland JR (2011) Phylogeographic inferences from chloroplast DNA: quantifying the effects of mutations in repetitive and non-repetitive sequences. Molecular Ecology Resources, 11, 279–85.
Wagstaff SJ, Molloy BPJ, Tate JA (2010) Evolutionary significance of long-distance dispersal and hybridisation in the New Zealand endemic genus Hoheria (Malvaceae). Australian Systematic Botany, 23, 112–130.
Wang R-J, Cheng C-L, Chang C-C et al. (2008) Dynamics and evolution of the inverted repeat-large single copy junctions in the chloroplast genomes of monocots. BMC Evolutionary Biology, 8, 36.
Wang W, Messing J (2011) High-throughput sequencing of three Lemnoideae (duckweeds) chloroplast genomes from total DNA (JH Badger, Ed,). PLoS ONE, 6, e24670.
Wang L, Wu Z-Q, Bystriakova N et al. (2011) Phylogeography of the Sino-Himalayan fern Lepisorus clathratus on “the roof of the world”. PloS One, 6, e25896.
Whitfield JB, Cameron SA, Huson DH, Steel MA (2008) Filtered Z-closure supernetworks for extracting and visualizing recurrent signal from incongruent gene trees. Systematic Biology, 57, 939–47.
Whitlock BA, Hale AM, Groff PA (2010) Intraspecific inversions pose a challenge for the trnH-psbA plant DNA barcode. PLoS ONE, 5, e11533.
Wicker T, Oberhaensli S, Parlange F et al. (2013) The wheat powdery mildew genome shows the unique evolution of an obligate biotroph. Nature Genetics.
Worberg A, Quandt D, Barniske A-M et al. (2007) Phylogeny of basal eudicots: Insights from non-coding and rapidly evolving DNA. Organisms Diversity and Evolution, 7, 55–77.
Wu C-S, Wang Y-N, Hsu C-Y, Lin C-P, Chaw S-M (2011) Loss of different inverted repeat copies from the chloroplast genomes of Pinaceae and cupressophytes and influence of heterotachy on the evaluation of gymnosperm phylogeny. Genome Biology and Evolution, 3, 1284–1295.
Wyman SK, Jansen RK, Boore JL (2004) Automatic annotation of organellar genomes with DOGMA. Bioinformatics, 20, 3252–5.
Yamane K, Yasui Y, Ohnishi O (2003) Intraspecific cpDNA variations of diploid and tetraploid perennial buckwheat, Fagopyrum cymosum (Polygonaceae). American Journal of Botany, 90, 339–46.

108
Yen D (1980) The Southeast Asian foundations of oceanic agriculture: a reassessment. Journal de la Société des océanistes, 36, 140–147.
Yen DE (1991) Domestication: The lessons from New Guinea. In: Man and a Half (ed Pawley A), pp. 558–570. Polynesian Society, Auckland.
Yen DE (1993) The origins of subsistence agriculture in Oceania and the potentials for future tropical food crops. Economic Botany, 47, 3–14.
Yen DE, Wheeler JM (1968) Introduction of taro into the Pacific: The indications of the chromosome numbers. Ethnology, 7, 259–267.
Yi X, Gao L, Wang B, Su Y-J, Wang T (2013) The complete chloroplast genome sequence of Cephalotaxus oliveri (Cephalotaxaceae): evolutionary comparison of Cephalotaxus chloroplast DNAs and insights into the loss of inverted repeat copies in Gymnosperms. Genome Biology and Evolution, 5, 688–698.
Yin J (2006) Colocasia tibetensis (Araceae, Colocasieae), a new species from southeast Tibet, China. Annales Botanici Fennici, 43, 53–56.
Yin J, Li H, Xu Z (2004) Colocasia menglaensis (Araceae), a new species from southern Yunnan , China. Annales Botanici Fennici, 41, 223–226.
Yoshino H (1994) Studies on phylogenetic differentiation in taro, Colocasia esculenta (L.) Schott. Kyoto University, Japan.
Yoshino H (1995) Some species of genus Colocasia having chloroplast DNA of Alocasia macrorrhiza var. variegata. In: Proceedings of the VI International Aroid Conference (ed Li H). Editorial Department of Acta Botanica Yunnanica, Kunming.
Yoshino H, Ochiai T, Tahara M (1998) An artificial inter-generic hybrid between Colocasia esculenta (L.) Schott and Alocasia macrorrhiza G. Don. In: Proceeding of the Monocots II and Grass III , p. 340. Sydney.
Yoshino H, Ochiai T, Tahara M (2000) Phylogenetic relationship between Colocasia and Alocasia based on molecular techniques. In: Ethnobotany and Genetic Diversity of asian Taro: Focus on China (eds Zhu D, Eyzaguirre PB, Zhou M, Sears L, Lie G), pp. 66–73. International Plant Genetic Resources Institute, Laiyang.
Zerbino DR, Birney E (2008) Velvet: algorithms for de novo short read assembly using de Bruijn graphs. Genome Research, 18, 821–9.
Zhang G, Zhang D (1990) The relationship between geographic distribution and ploidy level of taro, Colocasia esculenta. Euphytica, 47, 25–27.
Zhong B, Deusch O, Goremykin V V et al. (2011) Systematic error in seed plant phylogenomics. Genome Biology and Evolution, 3, 1340–1348.

109
Zhu L, Wang Q, Tang P, Araki H, Tian D (2009) Genomewide association between insertions/deletions and the nucleotide diversity in bacteria. Molecular Biology and Evolution, 26, 2353–61.

110
APPENDIX


JOHN WILEY AND SONS LICENSETERMS AND CONDITIONS
Aug 29, 2013
This is a License Agreement between Ibrar Ahmed ("You") and John Wiley and Sons ("John Wiley and Sons") provided byCopyright Clearance Center ("CCC"). The license consists of your order details, the terms and conditions provided by JohnWiley and Sons, and the payment terms and conditions.
All payments must be made in full to CCC. For payment instructions, please see information listed at the bottom ofthis form.
License Number 3176891199251
License date Jun 27, 2013
Licensed contentpublisher
John Wiley and Sons
Licensed contentpublication
Molecular Ecology Resources
Licensed content title Identification of chloroplast genome loci suitable for high-resolution phylogeographic studies ofColocasia esculenta (L.) Schott (Araceae) and closely related taxa
Licensed copyright line © 2013 John Wiley & Sons Ltd
Licensed content author Ibrar Ahmed,Peter J. Matthews,Patrick J. Biggs,Muhammad Naeem,Patricia A.McLenachan,Peter J. Lockhart
Licensed content date May 30, 2013
Start page n/a
End page n/a
Type of use Dissertation/Thesis
Requestor type Author of this Wiley article
Format Print and electronic
Portion Full article
Will you be translating? No
Total 0.00 USDTerms and Conditions
TERMS AND CONDITIONSThis copyrighted material is owned by or exclusively licensed to John Wiley & Sons, Inc. or one of its group companies (eacha "Wiley Company") or a society for whom a Wiley Company has exclusive publishing rights in relation to a particular journal(collectively "WILEY"). By clicking "accept" in connection with completing this licensing transaction, you agree that thefollowing terms and conditions apply to this transaction (along with the billing and payment terms and conditions establishedby the Copyright Clearance Center Inc., ("CCC's Billing and Payment terms and conditions"), at the time that you opened yourRightsLink account (these are available at any time at http://myaccount.copyright.com).
Terms and Conditions1. The materials you have requested permission to reproduce (the "Materials") are protected by copyright.2.You are hereby granted a personal, non-exclusive, non-sublicensable, non-transferable, worldwide, limited license toreproduce the Materials for the purpose specified in the licensing process. This license is for a one-time use only with amaximum distribution equal to the number that you identified in the licensing process. Any form of republication granted bythis license must be completed within two years of the date of the grant of this license (although copies prepared before maybe distributed thereafter). The Materials shall not be used in any other manner or for any other purpose. Permission isgranted subject to an appropriate acknowledgement given to the author, title of the material/book/journal and the publisher.You shall also duplicate the copyright notice that appears in the Wiley publication in your use of the Material. Permission isalso granted on the understanding that nowhere in the text is a previously published source acknowledged for all or part ofthis Material. Any third party material is expressly excluded from this permission.3. With respect to the Materials, all rights are reserved. Except as expressly granted by the terms of the license, no part of theMaterials may be copied, modified, adapted (except for minor reformatting required by the new Publication), translated,reproduced, transferred or distributed, in any form or by any means, and no derivative works may be made based on theMaterials without the prior permission of the respective copyright owner. You may not alter, remove or suppress in any
RightsLink - Your Account https://s100.copyright.com/MyAccount/viewPrintableLicenseDetails?r...
1 of 4 30/08/2013 8:41 a.m.

manner any copyright, trademark or other notices displayed by the Materials. You may not license, rent, sell, loan, lease,pledge, offer as security, transfer or assign the Materials, or any of the rights granted to you hereunder to any other person.4. The Materials and all of the intellectual property rights therein shall at all times remain the exclusive property of John Wiley& Sons Inc or one of its related companies (WILEY) or their respective licensors, and your interest therein is only that ofhaving possession of and the right to reproduce the Materials pursuant to Section 2 herein during the continuance of thisAgreement. You agree that you own no right, title or interest in or to the Materials or any of the intellectual property rightstherein. You shall have no rights hereunder other than the license as provided for above in Section 2. No right, license orinterest to any trademark, trade name, service mark or other branding ("Marks") of WILEY or its licensors is grantedhereunder, and you agree that you shall not assert any such right, license or interest with respect thereto.5. NEITHER WILEY NOR ITS LICENSORS MAKES ANY WARRANTY OR REPRESENTATION OF ANY KIND TO YOU ORANY THIRD PARTY, EXPRESS, IMPLIED OR STATUTORY, WITH RESPECT TO THE MATERIALS OR THE ACCURACYOF ANY INFORMATION CONTAINED IN THE MATERIALS, INCLUDING, WITHOUT LIMITATION, ANY IMPLIEDWARRANTY OF MERCHANTABILITY, ACCURACY, SATISFACTORY QUALITY, FITNESS FOR A PARTICULAR PURPOSE,USABILITY, INTEGRATION OR NON-INFRINGEMENT AND ALL SUCH WARRANTIES ARE HEREBY EXCLUDED BYWILEY AND ITS LICENSORS AND WAIVED BY YOU.6. WILEY shall have the right to terminate this Agreement immediately upon breach of this Agreement by you.7. You shall indemnify, defend and hold harmless WILEY, its Licensors and their respective directors, officers, agents andemployees, from and against any actual or threatened claims, demands, causes of action or proceedings arising from anybreach of this Agreement by you.8. IN NO EVENT SHALL WILEY OR ITS LICENSORS BE LIABLE TO YOU OR ANY OTHER PARTY OR ANY OTHERPERSON OR ENTITY FOR ANY SPECIAL, CONSEQUENTIAL, INCIDENTAL, INDIRECT, EXEMPLARY OR PUNITIVEDAMAGES, HOWEVER CAUSED, ARISING OUT OF OR IN CONNECTION WITH THE DOWNLOADING, PROVISIONING,VIEWING OR USE OF THE MATERIALS REGARDLESS OF THE FORM OF ACTION, WHETHER FOR BREACH OFCONTRACT, BREACH OF WARRANTY, TORT, NEGLIGENCE, INFRINGEMENT OR OTHERWISE (INCLUDING,WITHOUT LIMITATION, DAMAGES BASED ON LOSS OF PROFITS, DATA, FILES, USE, BUSINESS OPPORTUNITY ORCLAIMS OF THIRD PARTIES), AND WHETHER OR NOT THE PARTY HAS BEEN ADVISED OF THE POSSIBILITY OFSUCH DAMAGES. THIS LIMITATION SHALL APPLY NOTWITHSTANDING ANY FAILURE OF ESSENTIAL PURPOSE OFANY LIMITED REMEDY PROVIDED HEREIN.9. Should any provision of this Agreement be held by a court of competent jurisdiction to be illegal, invalid, or unenforceable,that provision shall be deemed amended to achieve as nearly as possible the same economic effect as the original provision,and the legality, validity and enforceability of the remaining provisions of this Agreement shall not be affected or impairedthereby.10. The failure of either party to enforce any term or condition of this Agreement shall not constitute a waiver of either party'sright to enforce each and every term and condition of this Agreement. No breach under this agreement shall be deemedwaived or excused by either party unless such waiver or consent is in writing signed by the party granting such waiver orconsent. The waiver by or consent of a party to a breach of any provision of this Agreement shall not operate or be construedas a waiver of or consent to any other or subsequent breach by such other party.11. This Agreement may not be assigned (including by operation of law or otherwise) by you without WILEY's prior writtenconsent.12. Any fee required for this permission shall be non-refundable after thirty (30) days from receipt13. These terms and conditions together with CCC's Billing and Payment terms and conditions (which are incorporatedherein) form the entire agreement between you and WILEY concerning this licensing transaction and (in the absence offraud) supersedes all prior agreements and representations of the parties, oral or written. This Agreement may not beamended except in writing signed by both parties. This Agreement shall be binding upon and inure to the benefit of theparties' successors, legal representatives, and authorized assigns.14. In the event of any conflict between your obligations established by these terms and conditions and those established byCCC's Billing and Payment terms and conditions, these terms and conditions shall prevail.15. WILEY expressly reserves all rights not specifically granted in the combination of (i) the license details provided by youand accepted in the course of this licensing transaction, (ii) these terms and conditions and (iii) CCC's Billing and Paymentterms and conditions.16. This Agreement will be void if the Type of Use, Format, Circulation, or Requestor Type was misrepresented during thelicensing process.17. This Agreement shall be governed by and construed in accordance with the laws of the State of New York, USA, withoutregards to such state's conflict of law rules. Any legal action, suit or proceeding arising out of or relating to these Terms andConditions or the breach thereof shall be instituted in a court of competent jurisdiction in New York County in the State ofNew York in the United States of America and each party hereby consents and submits to the personal jurisdiction of suchcourt, waives any objection to venue in such court and consents to service of process by registered or certified mail, returnreceipt requested, at the last known address of such party.Wiley Open Access Terms and ConditionsWiley publishes Open Access articles in both its Wiley Open Access Journals program [http://www.wileyopenaccess.com/view/index.html] and as Online Open articles in its subscription journals. The majority of Wiley Open Access Journals haveadopted the Creative Commons Attribution License (CC BY) which permits the unrestricted use, distribution, reproduction,adaptation and commercial exploitation of the article in any medium. No permission is required to use the article in this way
RightsLink - Your Account https://s100.copyright.com/MyAccount/viewPrintableLicenseDetails?r...
2 of 4 30/08/2013 8:41 a.m.

provided that the article is properly cited and other license terms are observed. A small number of Wiley Open Accessjournals have retained the Creative Commons Attribution Non Commercial License (CC BY-NC), which permits use,distribution and reproduction in any medium, provided the original work is properly cited and is not used for commercialpurposes.Online Open articles - Authors selecting Online Open are, unless particular exceptions apply, offered a choice of CreativeCommons licenses. They may therefore select from the CC BY, the CC BY-NC and the Attribution-NoDerivatives (CCBY-NC-ND). The CC BY-NC-ND is more restrictive than the CC BY-NC as it does not permit adaptations or modificationswithout rights holder consent.Wiley Open Access articles are protected by copyright and are posted to repositories and websites in accordance with theterms of the applicable Creative Commons license referenced on the article. At the time of deposit, Wiley Open Accessarticles include all changes made during peer review, copyediting, and publishing. Repositories and websites that host thearticle are responsible for incorporating any publisher-supplied amendments or retractions issued subsequently.Wiley Open Access articles are also available without charge on Wiley's publishing platform, Wiley Online Library or anysuccessor sites.Conditions applicable to all Wiley Open Access articles:
The authors' moral rights must not be compromised. These rights include the right of "paternity" (also known as"attribution" - the right for the author to be identified as such) and "integrity" (the right for the author not to have thework altered in such a way that the author's reputation or integrity may be damaged).
Where content in the article is identified as belonging to a third party, it is the obligation of the user to ensure that anyreuse complies with the copyright policies of the owner of that content.
If article content is copied, downloaded or otherwise reused for research and other purposes as permitted, a link tothe appropriate bibliographic citation (authors, journal, article title, volume, issue, page numbers, DOI and the link tothe definitive published version on Wiley Online Library) should be maintained. Copyright notices and disclaimersmust not be deleted.
Creative Commons licenses are copyright licenses and do not confer any other rights, including but not limitedto trademark or patent rights.
Any translations, for which a prior translation agreement with Wiley has not been agreed, must prominently display thestatement: "This is an unofficial translation of an article that appeared in a Wiley publication. The publisher has notendorsed this translation."
Conditions applicable to non-commercial licenses (CC BY-NC and CC BY-NC-ND)For non-commercial and non-promotional purposes individual non-commercial users may access, download, copy,display and redistribute to colleagues Wiley Open Access articles. In addition, articles adopting the CC BY-NC may beadapted, translated, and text- and data-mined subject to the conditions above.Use by commercial "for-profit" organizationsUse of non-commercial Wiley Open Access articles for commercial, promotional, or marketing purposes requiresfurther explicit permission from Wiley and will be subject to a fee. Commercial purposes include:
Copying or downloading of articles, or linking to such articles for further redistribution, sale or licensing;
Copying, downloading or posting by a site or service that incorporates advertising with such content;
The inclusion or incorporation of article content in other works or services (other than normal quotations withan appropriate citation) that is then available for sale or licensing, for a fee (for example, a compilationproduced for marketing purposes, inclusion in a sales pack)
Use of article content (other than normal quotations with appropriate citation) by for-profit organizations forpromotional purposes
Linking to article content in e-mails redistributed for promotional, marketing or educational purposes;
Use for the purposes of monetary reward by means of sale, resale, license, loan, transfer or other form ofcommercial exploitation such as marketing products
Print reprints of Wiley Open Access articles can be purchased from: [email protected]
The modification or adaptation for any purpose of an article referencing the CC BY-NC-ND License requiresconsent which can be requested from [email protected] .
RightsLink - Your Account https://s100.copyright.com/MyAccount/viewPrintableLicenseDetails?r...
3 of 4 30/08/2013 8:41 a.m.

Other Terms and Conditions:
BY CLICKING ON THE "I AGREE..." BOX, YOU ACKNOWLEDGE THAT YOU HAVE READ AND FULLYUNDERSTAND EACH OF THE SECTIONS OF AND PROVISIONS SET FORTH IN THIS AGREEMENT ANDTHAT YOU ARE IN AGREEMENT WITH AND ARE WILLING TO ACCEPT ALL OF YOUR OBLIGATIONS ASSET FORTH IN THIS AGREEMENT.
v1.8
If you would like to pay for this license now, please remit this license along with your payment made payable to"COPYRIGHT CLEARANCE CENTER" otherwise you will be invoiced within 48 hours of the license date. Paymentshould be in the form of a check or money order referencing your account number and this invoice numberRLNK501052645.Once you receive your invoice for this order, you may pay your invoice by credit card. Please follow instructionsprovided at that time.
Make Payment To:Copyright Clearance CenterDept 001P.O. Box 843006Boston, MA 02284-3006
For suggestions or comments regarding this order, contact RightsLink Customer Support:[email protected] or +1-877-622-5543 (toll free in the US) or +1-978-646-2777.
Gratis licenses (referencing $0 in the Total field) are free. Please retain this printable license for your reference. Nopayment is required.
RightsLink - Your Account https://s100.copyright.com/MyAccount/viewPrintableLicenseDetails?r...
4 of 4 30/08/2013 8:41 a.m.

ISSN 1759-6653
GENOME BIOLOGY AND EVOLUTION
GBE
GBE-sample-cover1(Feb-2013).indd 1GBE-sample-cover1(Feb-2013).indd 1 23-01-2013 17:10:4623-01-2013 17:10:46