copyright © allyn & bacon (2007) statistical analysis of data graziano and raulin research...
TRANSCRIPT

Copyright © Allyn & Bacon (2007)Copyright © Allyn & Bacon (2007)
Statistical Analysis of Statistical Analysis of DataData
Graziano and RaulinGraziano and RaulinResearch Methods: Chapter 5Research Methods: Chapter 5This multimedia product and its contents are protected under copyright law. The following are This multimedia product and its contents are protected under copyright law. The following are prohibited by law: (1) Any public performance or display, including transmission of any image prohibited by law: (1) Any public performance or display, including transmission of any image over a network; (2) Preparation of any derivative work, including the extraction, in whole or in over a network; (2) Preparation of any derivative work, including the extraction, in whole or in part, of any images; (3) Any rental, lease, or lending of the program.part, of any images; (3) Any rental, lease, or lending of the program.

Copyright © Allyn & Bacon (2007)Copyright © Allyn & Bacon (2007)
Individual DifferencesIndividual Differences
A fact of lifeA fact of life– People differ from one anotherPeople differ from one another– People differ from one occasion to anotherPeople differ from one occasion to another
Most psychological variables have Most psychological variables have small effects compared to individual small effects compared to individual differencesdifferences
Statistics give us a way to detect such Statistics give us a way to detect such subtle effectssubtle effects

Copyright © Allyn & Bacon (2007)Copyright © Allyn & Bacon (2007)
Descriptive StatisticsDescriptive Statistics
Are used to describe the dataAre used to describe the data Many types of descriptive statisticsMany types of descriptive statistics
– Frequency distributionsFrequency distributions– Summary measuresSummary measures– Graphical representations of the dataGraphical representations of the data
A way to visualize the data A way to visualize the data The first step in any statistical The first step in any statistical
analysisanalysis

Copyright © Allyn & Bacon (2007)Copyright © Allyn & Bacon (2007)
Frequency Frequency DistributionsDistributions First step in organization of dataFirst step in organization of data
– Can see how the scores are Can see how the scores are distributeddistributed
Used with all types of dataUsed with all types of data Illustrate relationships between Illustrate relationships between
variables in a variables in a cross-tabulationcross-tabulation Simplify distributions by using a Simplify distributions by using a
grouped frequency distributiongrouped frequency distribution

Copyright © Allyn & Bacon (2007)Copyright © Allyn & Bacon (2007)
Creating Frequency Creating Frequency DistributionsDistributions Create a column Create a column
with all possible with all possible scoresscores
Count the number Count the number of people that fall of people that fall into each scoreinto each score– Some frequencies Some frequencies
may be zero (no may be zero (no one had that score)one had that score)
Can only do a Can only do a frequency frequency distribution if:distribution if:– The scores are The scores are
not continuousnot continuous– The range of The range of
scores is not too scores is not too large (becomes large (becomes unwieldy) unwieldy)
Copyright © Allyn & Bacon (2007)Copyright © Allyn & Bacon (2007)
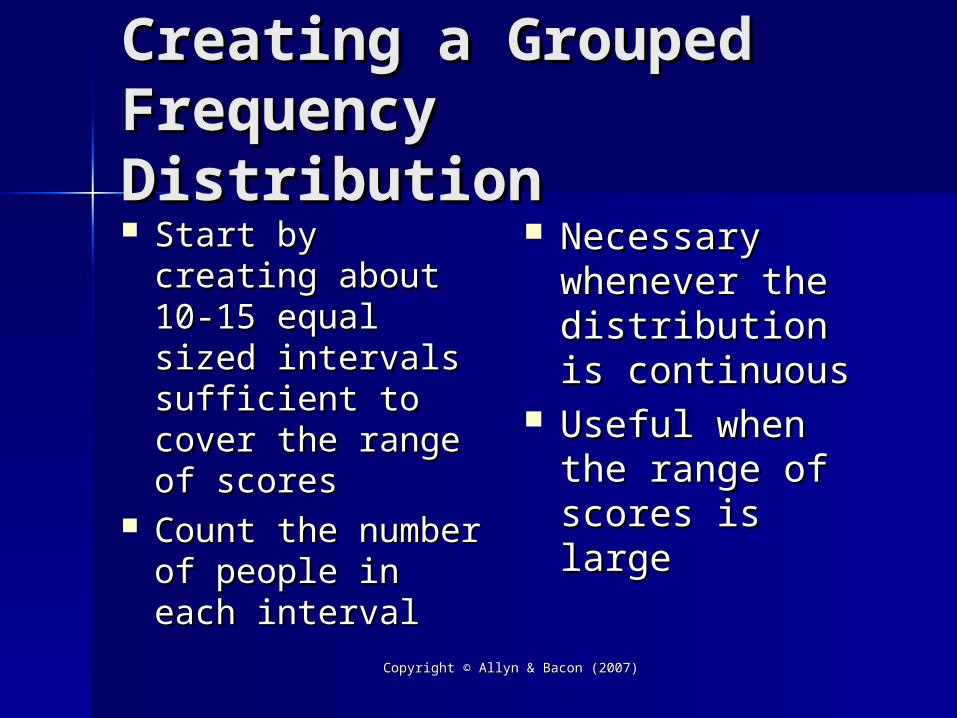
Creating a Grouped Creating a Grouped Frequency DistributionFrequency Distribution Start by creating Start by creating
about 10-15 equal about 10-15 equal sized intervals sized intervals sufficient to cover sufficient to cover the range of the range of scoresscores
Count the number Count the number of people in each of people in each intervalinterval
Necessary Necessary whenever the whenever the distribution is distribution is continuouscontinuous
Useful when the Useful when the range of scores is range of scores is largelarge

Copyright © Allyn & Bacon (2007)Copyright © Allyn & Bacon (2007)
Cross-TabulationCross-Tabulation
A way to see the relationship A way to see the relationship between two nominal or ordinal between two nominal or ordinal variables variables – When done with score data, it is usually When done with score data, it is usually
done as a scatter plot (covered later)done as a scatter plot (covered later) Create a set of cells by listing the Create a set of cells by listing the
values of one variable as columns values of one variable as columns and the values of the other as rowsand the values of the other as rows

Copyright © Allyn & Bacon (2007)Copyright © Allyn & Bacon (2007)
Cross-Tabulation Cross-Tabulation ExampleExample
MalesMales FemalesFemales TotalTotal
DemocratsDemocrats 44 55 99
RepublicanRepublicanss
66 11 77
OtherOther 77 11 88
TotalTotal 1717 77 2424
Copyright © Allyn & Bacon (2007)Copyright © Allyn & Bacon (2007)
Graphing DataGraphing Data
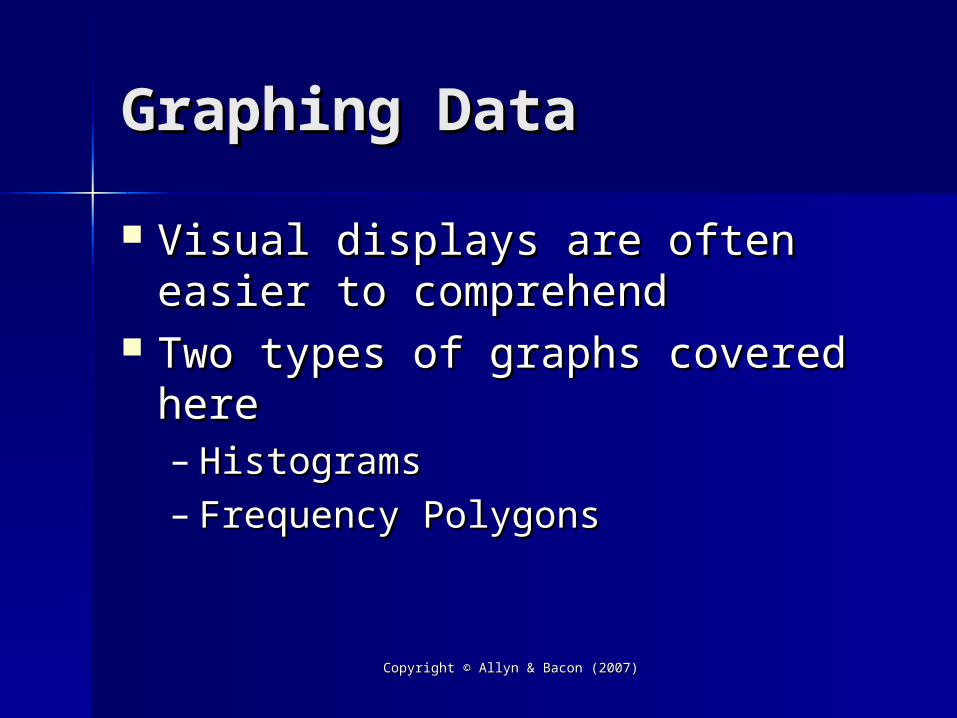
Visual displays are often easier to Visual displays are often easier to comprehendcomprehend
Two types of graphs covered hereTwo types of graphs covered here– HistogramsHistograms– Frequency PolygonsFrequency Polygons

Copyright © Allyn & Bacon (2007)Copyright © Allyn & Bacon (2007)
HistogramsHistograms
A bar graph, as A bar graph, as shown at the rightshown at the right
Can be used to Can be used to graph either graph either – Data representing Data representing
discrete categoriesdiscrete categories– Data representing Data representing
scores from a scores from a continuous variablecontinuous variable 0
10
20
30
40
50
60
Freq
1 2 3 4 5 6
Scores
Sample Histogram

Copyright © Allyn & Bacon (2007)Copyright © Allyn & Bacon (2007)
Graphing 2 Graphing 2 DistributionsDistributions Possible to graph Possible to graph
two or more two or more distributions to distributions to see how they see how they comparecompare
Note that one of Note that one of the two groups in the two groups in this histogram this histogram was the same was the same group graphed group graphed previouslypreviously
01020304050607080
Freq
1 2 3 4 5 6
Scores
Sample Histogram

Copyright © Allyn & Bacon (2007)Copyright © Allyn & Bacon (2007)
Frequency PolygonFrequency Polygon
Like a histogram Like a histogram except that the except that the frequency is frequency is shown with a dot, shown with a dot, with the dots with the dots connected connected
Frequency Polygon
0
10
20
30
40
50
60
1 2 3 4 5 6
Scores
Fre
qu
en
cy

Copyright © Allyn & Bacon (2007)Copyright © Allyn & Bacon (2007)
Two Frequency Two Frequency PolygonsPolygons Can compare two Can compare two
of more of more frequency frequency polygons on the polygons on the same scale same scale
Easier to compare Easier to compare groups because groups because the graph appears the graph appears less cluttered less cluttered than multiple than multiple histogramshistograms
Frequency Polygons
0
10
20
30
40
50
60
70
80
1 2 3 4 5 6
Scores
Fre
qu
en
cy

Copyright © Allyn & Bacon (2007)Copyright © Allyn & Bacon (2007)
Shapes of Shapes of DistributionsDistributions
Many Many psychological psychological variables are variables are distributed distributed normallynormally
The distribution The distribution is skewed if is skewed if scores bunch up scores bunch up at one end at one end

Copyright © Allyn & Bacon (2007)Copyright © Allyn & Bacon (2007)
Measures of Central Measures of Central TendencyTendency ModeMode: the most frequently occurring score: the most frequently occurring score
– Easy to compute from frequency distributionEasy to compute from frequency distribution MedianMedian: the middle score in a distribution: the middle score in a distribution
– Less affected than the mean by a few deviant Less affected than the mean by a few deviant scoresscores
MeanMean: the arithmetic average: the arithmetic average– Most commonly used central tendency measureMost commonly used central tendency measure– Used in later inferential statisticsUsed in later inferential statistics

Copyright © Allyn & Bacon (2007)Copyright © Allyn & Bacon (2007)
Finding the ModeFinding the Mode
Easiest way to find the mode is to Easiest way to find the mode is to construct a frequency distribution construct a frequency distribution firstfirst
Find the score with the largest Find the score with the largest frequencyfrequency
If there are two or more scores If there are two or more scores that are tied for the largest that are tied for the largest frequency, report each of themfrequency, report each of them

Copyright © Allyn & Bacon (2007)Copyright © Allyn & Bacon (2007)
Computing the MedianComputing the Median
Order the scores from smallest to Order the scores from smallest to largestlargest
Determine the middle score Determine the middle score [(N+1)/2] [(N+1)/2] – If 7 scores, the middle is the fourth If 7 scores, the middle is the fourth
score [(7+1)/2]=4score [(7+1)/2]=4– If 10 scores, the middle score is half If 10 scores, the middle score is half
way between the 5way between the 5thth and 6 and 6thth scores scores [(10+1)/2]=5.5[(10+1)/2]=5.5

Copyright © Allyn & Bacon (2007)Copyright © Allyn & Bacon (2007)
Computing the MeanComputing the Mean
Compute the mean Compute the mean of 3, 4, 2, 5, 7, & 5of 3, 4, 2, 5, 7, & 5
Sum the numbers Sum the numbers (26)(26)
Count the numbersCount the numbers(6)(6)
Plug these values Plug these values into the equationsinto the equations
N
XX
X 26
64 33.

Copyright © Allyn & Bacon (2007)Copyright © Allyn & Bacon (2007)
Measuring VariabilityMeasuring Variability
RangeRange: lowest to highest score: lowest to highest score Average DeviationAverage Deviation: average : average
distance from the meandistance from the mean VarianceVariance: average squared : average squared
distance from the meandistance from the mean– Used in later inferential statisticsUsed in later inferential statistics
Standard DeviationStandard Deviation: square : square root of varianceroot of variance

Copyright © Allyn & Bacon (2007)Copyright © Allyn & Bacon (2007)
The RangeThe Range
Computing the RangeComputing the Range– Find the lowest scoreFind the lowest score– Find the highest scoreFind the highest score– Subtract the lowest from the highest Subtract the lowest from the highest
scorescore Easy to compute, but unstable Easy to compute, but unstable
because it relies on only two because it relies on only two scoresscores

Copyright © Allyn & Bacon (2007)Copyright © Allyn & Bacon (2007)
The Average DeviationThe Average Deviation
Computing the average deviationComputing the average deviation– Compute the meanCompute the mean– Compute the distance of each score from Compute the distance of each score from
the mean (absolute distance, ignore sign)the mean (absolute distance, ignore sign)– Sum those distances and divide by the Sum those distances and divide by the
number of scoresnumber of scores Easy to understand conceptually, but Easy to understand conceptually, but
rarely used because it does not have rarely used because it does not have good statistical propertiesgood statistical properties

Copyright © Allyn & Bacon (2007)Copyright © Allyn & Bacon (2007)
The VarianceThe Variance
Computing the VarianceComputing the Variance– Compute the meanCompute the mean– Compute the distance of each score from Compute the distance of each score from
the meanthe mean– Square those distanceSquare those distance– Sum those squared distances and divide Sum those squared distances and divide
by the degrees of freedom (by the degrees of freedom (N N - 1)- 1) Good statistical properties, but this Good statistical properties, but this
measure of variability is in squared measure of variability is in squared unitsunits

Copyright © Allyn & Bacon (2007)Copyright © Allyn & Bacon (2007)
The Standard The Standard DeviationDeviation Computing the Standard Computing the Standard
DeviationDeviation– Compute the varianceCompute the variance– Take the square root of the varianceTake the square root of the variance
This measure, like the variance, This measure, like the variance, has good statistical properties has good statistical properties and is measured in the same and is measured in the same units as the meanunits as the mean

Copyright © Allyn & Bacon (2007)Copyright © Allyn & Bacon (2007)
Measures of Measures of RelationshipRelationship Pearson product-moment correlationPearson product-moment correlation
– Used with interval or ratio dataUsed with interval or ratio data Spearman rank-order correlationSpearman rank-order correlation
– Used when one variable is ordinal and the Used when one variable is ordinal and the second is at least ordinalsecond is at least ordinal
Scatter plotsScatter plots– Visual representation of a correlationVisual representation of a correlation– Helps to identify nonlinear relationshipsHelps to identify nonlinear relationships

Copyright © Allyn & Bacon (2007)Copyright © Allyn & Bacon (2007)
CorrelationsCorrelations
Range from –1.00 to +1.00Range from –1.00 to +1.00– A -1.00 means a perfect negative A -1.00 means a perfect negative
relationship relationship (as one score decreases, the (as one score decreases, the other increases a predictable amount)other increases a predictable amount)
– +1.00 means a perfect positive +1.00 means a perfect positive relationshiprelationship
– 0.00 means that there is no 0.00 means that there is no relationshiprelationship

Copyright © Allyn & Bacon (2007)Copyright © Allyn & Bacon (2007)
Linear RelationshipsLinear Relationships
Correlation coefficients are sensitive Correlation coefficients are sensitive only to linear relationshipsonly to linear relationships
Linear relationships mean that the Linear relationships mean that the points of a scatter plot cluster around points of a scatter plot cluster around a straight linea straight line
Should always look at the scatter plot Should always look at the scatter plot to see whether the correlation to see whether the correlation coefficient is appropriatecoefficient is appropriate

Copyright © Allyn & Bacon (2007)Copyright © Allyn & Bacon (2007)
RegressionRegression
Using a correlation to predict one Using a correlation to predict one variable from knowing the score variable from knowing the score on the other variableon the other variable
Usually a linear regression Usually a linear regression (finding (finding the best fitting straight line for the data)the best fitting straight line for the data)
Best illustrated in a scatter plot Best illustrated in a scatter plot with the regression line also with the regression line also plotted plotted (see Figure 5.6)(see Figure 5.6)

Copyright © Allyn & Bacon (2007)Copyright © Allyn & Bacon (2007)
Reliability IndicesReliability Indices
Test-retest reliability and Test-retest reliability and interrater reliability are indexed interrater reliability are indexed with a Pearson product-moment with a Pearson product-moment correlationcorrelation
Internal consistency reliability is Internal consistency reliability is indexed with coefficient alphaindexed with coefficient alpha
Details on these computations are Details on these computations are included on the included on the Student Resource Student Resource WebsiteWebsite

Copyright © Allyn & Bacon (2007)Copyright © Allyn & Bacon (2007)
Standard ScoresStandard Scores((ZZ-scores)-scores) A way to put scores on a common scaleA way to put scores on a common scale Computed by subtracting the mean Computed by subtracting the mean
from the score and dividing by the from the score and dividing by the standard deviationstandard deviation
Interpreting the Interpreting the ZZ-score-score– Positive Positive ZZ-scores are above the mean; -scores are above the mean;
negative negative ZZ-scores are below the mean-scores are below the mean– The larger the absolute value of the The larger the absolute value of the ZZ--
score, the further the score is from the score, the further the score is from the meanmean

Copyright © Allyn & Bacon (2007)Copyright © Allyn & Bacon (2007)
Inferential StatisticsInferential Statistics
Used to draw inferences about Used to draw inferences about populations on the basis of populations on the basis of samplessamples
Sometimes called “statistical Sometimes called “statistical tests”tests”
Provide an objective way of Provide an objective way of quantifying the strength of the quantifying the strength of the evidence for a hypothesisevidence for a hypothesis

Copyright © Allyn & Bacon (2007)Copyright © Allyn & Bacon (2007)
Populations and Populations and SamplesSamples PopulationPopulation: the larger groups of : the larger groups of
all participants of interest all participants of interest SampleSample: a subset of the population: a subset of the population Samples almost never represent Samples almost never represent
populations perfectly populations perfectly (sampling error)(sampling error)
– Not really an errorNot really an error– Just the natural variability that you can Just the natural variability that you can
expect from one sample to anotherexpect from one sample to another

Copyright © Allyn & Bacon (2007)Copyright © Allyn & Bacon (2007)
The Null HypothesisThe Null Hypothesis
States that there is NO difference States that there is NO difference between the population meansbetween the population means
Compare sample means to test the null Compare sample means to test the null hypothesis hypothesis
Population parameters & sample Population parameters & sample statisticsstatistics– Population parameterPopulation parameter: descriptive : descriptive
statistic computed from everyone in the statistic computed from everyone in the populationpopulation
– Sample statisticsSample statistics: a descriptive statistic : a descriptive statistic computed from everyone in your samplecomputed from everyone in your sample

Copyright © Allyn & Bacon (2007)Copyright © Allyn & Bacon (2007)
Statistical DecisionsStatistical Decisions
Either Reject or Fail to Reject the null Either Reject or Fail to Reject the null hypothesishypothesis– Rejecting the null hypothesis suggests that there is Rejecting the null hypothesis suggests that there is
a difference in the populations sampleda difference in the populations sampled– Failing to reject suggests that no difference existsFailing to reject suggests that no difference exists– Decision is based on probability Decision is based on probability – AlphaAlpha: the statistical decision criteria used in : the statistical decision criteria used in
testing the null hypothesistesting the null hypothesis– Traditionally, alpha is set to small values (.05 Traditionally, alpha is set to small values (.05
or .01)or .01)
Always a chance for error in our Always a chance for error in our decisiondecision

Copyright © Allyn & Bacon (2007)Copyright © Allyn & Bacon (2007)
Statistical Decision Statistical Decision ProcessProcess
Reject Null Reject Null HypothesisHypothesis
Retain Null Retain Null HypothesisHypothesis
Null Null Hypothesis is Hypothesis is
TrueTrue
Type IType IErrorError
CorrectCorrectDecisionDecision
Null Null Hypothesis is Hypothesis is
FalseFalse
CorrectCorrectDecisionDecision
Type IIType IIErrorError

Copyright © Allyn & Bacon (2007)Copyright © Allyn & Bacon (2007)
Testing for Mean Testing for Mean DifferencesDifferences tt-test for independent groups-test for independent groups: :
tests mean difference of two tests mean difference of two independent groups independent groups
Correlated Correlated tt-test-test: tests mean : tests mean difference of two correlated groups difference of two correlated groups
Analysis of VarianceAnalysis of Variance: tests mean : tests mean differences in two or more groups differences in two or more groups – Groups may or may not be independentGroups may or may not be independent– Also capable of evaluating factorial designsAlso capable of evaluating factorial designs

Copyright © Allyn & Bacon (2007)Copyright © Allyn & Bacon (2007)
Power of a Statistical Power of a Statistical TestTest Sensitivity of the procedure to detect Sensitivity of the procedure to detect
real differences between populationsreal differences between populations A function of both the statistical test A function of both the statistical test
and the precision of the research and the precision of the research designdesign
Increasing the sample size increases Increasing the sample size increases the powerthe power– Larger samples estimate the population Larger samples estimate the population
parameters more preciselyparameters more precisely

Copyright © Allyn & Bacon (2007)Copyright © Allyn & Bacon (2007)
Effect SizeEffect Size
Indication the size of the group Indication the size of the group differencesdifferences
Unlike the statistical test, the Unlike the statistical test, the effect size is NOT affected by the effect size is NOT affected by the size of the samplesize of the sample
More details on effect size More details on effect size – In Chapter 15In Chapter 15– On the On the Student Resource WebsiteStudent Resource Website

Copyright © Allyn & Bacon (2007)Copyright © Allyn & Bacon (2007)
Statistical versus Statistical versus Practical SignificancePractical Significance Statistical significance: Is the observed Statistical significance: Is the observed
group difference unlikely to be due to group difference unlikely to be due to sampling errorsampling error– Can get statistical significance, even with very Can get statistical significance, even with very
small population differences if the sample size is small population differences if the sample size is large enoughlarge enough
Practical significance looks at whether Practical significance looks at whether the difference is large enough to be of the difference is large enough to be of value in a practical sensevalue in a practical sense– More concerned with the effect sizeMore concerned with the effect size

Copyright © Allyn & Bacon (2007)Copyright © Allyn & Bacon (2007)
Meta-AnalysisMeta-Analysis
Relatively new statistical Relatively new statistical techniquetechnique
Allows researchers to statistically Allows researchers to statistically combine the results of several combine the results of several studies to get a sense of how studies to get a sense of how powerful the effect ispowerful the effect is– Discussed in more detail in Chapter Discussed in more detail in Chapter
1515

Copyright © Allyn & Bacon (2007)Copyright © Allyn & Bacon (2007)
SummarySummary
Statistics allow us to detect and Statistics allow us to detect and evaluate group differences that are evaluate group differences that are small compared to individual differencessmall compared to individual differences
Descriptive versus inferential statisticsDescriptive versus inferential statistics– Descriptive statistics describe the dataDescriptive statistics describe the data– Inferential statistics are used to draw inferences Inferential statistics are used to draw inferences
about population parameters on the basis of sample about population parameters on the basis of sample statisticsstatistics
Statistics objectify evaluations, but do Statistics objectify evaluations, but do not guarantee correct decisionsnot guarantee correct decisions