copyright 2012, tracy crawford 1
TRANSCRIPT

2Copyright 2012, Tracy Crawford http://www.raineight.com
Table of Contents
Objective & Structure 4Objective 4Structure 5
Introduction 6The Power of “No” 6Art and Science 8
Strategy Typology 9History 9Core Competency 10System of Activities 12Strategy Highlights 14
The Goal Of Strategy 16Perspective - Cost, Price, Volume, Continuity 16
Cost 17Price 18Volume 18Continuity 19Summary 19
Strategic Elements 20Strategic Objectives 20Planning Strategy vs. Learning Strategy 20Change, Complexity and Creativity 21Market Share Considerations 22Vision, Values & Beliefs, Mission 23
Vision 23Values & Beliefs 23Mission 23
Segmentation, Portfolio Evaluation and Targeting 23Segmentation 23Portfolio Evaluation 23Targeting - Four Classic Market Strategies 26
Exit Strategy 26
3Copyright 2012, Tracy Crawford http://www.raineight.com
Harvest Strategy 26Growth Strategy 26Invest Strategy 26
Differentiation 27Testing Differentiation 27Common Differentiation Mistakes 30Gating Attributes 30
Brand Positioning and Brand Value 31Classic Growth Strategies 32Competency Testing 32SWOT 33Marketing Plan 33Implementation Plan 33Control Plan 34
Methodology 35Overview 35Analytical/Developmental Methods 37
Managing Data Overload 37Strengths/Weaknesses Analytic Method 38Opportunities Analytic Method 38Threats Analytic Method 39Competitive Brand Positions Analytic Method 39Company Core Competency Analytic Method 40Segmentation Analytic Method 40GE Matrix – Industry Attractiveness/Business Strengths Analytic Method 40Required Competency/Capability Test Analytic Method 44Targeting 44Strategic Typology 45Strategic Objectives 45Marketing Plans/MarCom (Optional) 45Implementation Plans 45Control Plan 46
Appendix 1 - Graphical Methodology Overview 47
Appendix 2 - Marketing Considerations 52
4Copyright 2012, Tracy Crawford http://www.raineight.com
OBJECTIVE & STRUCTURE
Objective
My objective in this paper is to layout a straightforward methodology – a process - for developing, implementing and con-trolling strategy. The approach is based on tools developed by academics and business people over many decades and proven repeatedly in real-world applica-tions in business and many other types of organizations.
Overlaying the proven tools is a hierarchi-cal system defining how and in what order they are applied and extension of the tools to create actionable outcomes.
Depending upon the depth and intensity with which the tools are applied, the num-
ber of actionable outcomes can be in the hundreds or thousands. A list of hundreds or thousands of actions is of course un-wieldy and impractical, so I have addition-ally applied a simple quantified system for ranking and prioritizing actions so that the most important and relevant activities emerge with priority and are categorized under specific strategic objectives.
There have been in the last 60 years or so quite a significant number of formal pub-lications, books and writings on strategy. These proposals are often quite errone-ously viewed as competitive or mutually exclusive when in point of fact threads of tremendous synergy can be observed run-ning through the works. Confrontations in concept are actually rare and, when present, are straightforward and easy to
OBJECTIVE& STRUCTURE

5Copyright 2012, Tracy Crawford http://www.raineight.com
assess.This methodology draws exclusively on published accounts and proposals but seeks to coalesce the strengths and in-sights of each into an executable, straight-forward approach. I additionally seek to drive high-level strategic conclusions that a team may reach in their strategy de-velopment work down to detailed action plans affecting all or most of the day-to-day activities conducted by a firm.
I am not aware of any documented de-tailed methodology that is appropriate for all possible scenarios and likewise am sure that this methodology will not be ideal for every possible scenario. I do feel however that this approach is highly useful for the vast majority of situations. In most cases it can be executed without deviation to ex-cellent results. In a few cases it may serve as a useful foundational approach upon which deviations may be applied in order to achieve a final result.
Structure
This paper is structured to provide an introduction and overview including his-torical highlights of strategy, followed by a strategy primer covering a variety of the most relevant subjects. The strategy devel-opment methodology follows as the final section.

6Copyright 2012, Tracy Crawford http://www.raineight.com
INTRODUCTION
Strategy is the art and science of creating success. But “success” can be arbitrarily defined within certain circumstances and may or may not be realistic; therefore it is better to think of strategy as the founda-tional tool for “optimizing performance.”
Strategy may be applied to any endeavor. Strategy is most often associated with large businesses, but any organization and any individual seeking to accomplish a mission may make good use of strategy.
Most of the available literature and ac-cessible significant research has been developed in the context of business per-formance optimization, thus much of the terminology derives from the world of
business. I’ll use this terminology in this paper since it is reasonably well known and, in some cases, well understood by many people, but will expand on the meanings to create more applicability to situations that may be other than for-prof-it-business-oriented.
the POwer Of “NO”At core, strategy is all about making choic-es. Making choices is among the first steps toward implementing strategy after a strategy has been developed. Most impor-tant (and most difficult for many organiza-tions and individuals) is deciding what to not do.
Most organizations are, at any given point in time, doing far too many different things not well aligned to strategic goals
INTRODUCTION
7Copyright 2012, Tracy Crawford http://www.raineight.com
or even not related at all to strategic goals. Organizations are often large, spread out geographically, complex, have individu-als wishing to pursue certain directions, and are difficult to control. And it likewise seems a human trait to spread out one’s activities over too many objectives than is advisable to achieve optimum perfor-mance. For strategy to be successful, focus is the critical first-order principle. As an exam-ple, think of world-class athletes. They are most often singular in focus.
World-class swimmers focus on building aerobic endurance, stroke-strength, mas-tering form, eating to promote fitness, and resting to support recovery and increased physical capability. World-class swimmers are unlikely to be engaged in a wide array of activities that do not support their goal of being the best swimmer they can be. It is precisely the singularity of focus that is at the root of world-class athletes’ success.
The forces of divergence are, however, indeed powerful. Most people or teams en-gaging a strategy development process are tempted to dream of a precisely developed strategy with tightly focused efforts aimed exclusively and at all times on achieving strategic objectives – a well-oiled stra-tegic machine firing on all cylinders, 24 hours a day, top-to-bottom throughout the organization across all geographies. But
while this result can be achieved, it is most helpful for most people and organizations in the beginning to focus on the “power of no,” because the converse is quite often the greatest enemy of strategy.
This is because every activity engaged means another activity not engaged. Every minute in which an activity is engaged that is not supportive of strategic objectives is a minute in which strategic activity, energy and focus is lost.
Our swimmer says “no” to a thousand distractions so he can say “yes” to training, developing form, eating and resting.
Spending time getting oneself and organi-zation members into the mindset of “no,” can therefore be very useful for setting the tone and developing the discipline neces-sary to execute strategy. Every proposal should have an automatic “no” as the default answer until such time as the pro-posal is couched and justified in terms of its fit to strategic objectives.
Only after an organization becomes, by default, a “no” organization can it become a powerful “yes” organization whose ap-proved activities are fully and always supportive of strategy. Only under these circumstances can an organization achieve great goals and, by performance, become great indeed.

8Copyright 2012, Tracy Crawford http://www.raineight.com
Choice is where to apply limited resources for best results. Choice is how to apply limited resources for best results. But first, choice is where to not apply limited re-sources – again, to achieve best results.
A thousand “no’s” create the space for a few “yes’s” to thrive.
Art ANd ScieNce
Strategy is an iterative balancing of art and science. I refer to the art of strategy as being related to the softer, more creative aspects. It is the insights, ideas, and crea-tivity that flow into and emerge from any strategic exercise. The art of strategy usu-ally comes in small pieces from the people on the strategy development team.
The science of strategy comes from both the structured methodology for develop-ing, implementing and controlling strategy and from the analytical tools deployed.
Systemic strategic methodologies have been well known for a long time but only to selected few individuals (working most-ly for large consultancies), and there are few easily accessible published accounts of full methodologies that can be applied in a straightforward manner to developing, implementing and controlling strategy.
The analytical tools I reference, on the other hand, are “stock” – that is they are
well documented in literature and well proven by extensive academic research and real-world application in a wide array of environments.
Strategy is not magic. It is on the contrary quite straightforward and can be accom-plished by virtually anyone.
9Copyright 2012, Tracy Crawford http://www.raineight.com
STRATEGY TYPOLOGY
hiStOry
Modern strategic management theory dates to about the 1950’s when research-ers, primarily in the US, significantly be-gan contributing to the pool of literature based on serious study of strategic man-agement. It is not my purpose to docu-ment the history of strategy theory, but let us at least note a few of the standout contributors as the methodology proposed herein traces its roots to these contribu-tors and in many was coalesces many of their approaches and elements.
Alfred Chandler noted the importance of all managerial activity being coordinated and aligned under a comprehensive corpo-rate strategy.
Igor Ansoff developed systems for analyz-ing market penetration, product develop-ment, market expansion, developed a set of terminology used by strategists and developed systems for evaluating differ-ent corporate structures such as horizontal integration, vertical integration and diver-sification models.
Philip Selznick proposed the concept of matching a company’s internal factors with external factors observable in the business and regulatory environment. This concept is the foundation of the in-dispensible SWOT (Strengths, Weakness-es, Opportunities, Threats) analytical tool credited to Albert Humphrey and others.
Peter Drucker proposed that corpora-
STRATEGYTYPOLOGY
10Copyright 2012, Tracy Crawford http://www.raineight.com
tions should be run according to the goal of achieving certain objectives – referred to as Management by Objective (MBO) and that this system should run through all levels, functions and activities within a corporation.
CK Prahalad and Gary Hamel published significantly on the subject of the core competence of corporations as a source of competitive advantage.
Michael Porter proposed two generic, mu-tually exclusive strategy types: cost leader-ship and differentiation, with a potential modification of either referred to as focus in which a company chooses to compete in a mass market or in a focused, tightly defined market segment. Porter subse-quently argued that Operational Effective-ness, a significant element of cost leader-ship, could not in fact be a strategy as it is too easily copied.
Porter also suggested an approach based on a system of interrelated activities called system of activities to create competitive advantage.
W. Chan Kim and Renée Mauborgne, in their book Blue Ocean Strategy (2005) argue that under certain circumstances companies can achieve competitive ad-vantage by pursuing both a cost leader-ship approach and simultaneously a dif-
ferentiation approach. They believe this approach is most feasible when companies can create new demand in uncontested market spaces (blue oceans) rather than competing head-to-head with established firms. This premise was first suggested by Charles W. L. Hill in 1988 who proposed that Porter’s mutual exclusivity of cost leadership and differentiation approaches was flawed and that companies in certain circumstances could accomplish both dif-ferentiation and low cost suggesting that differentiation may in fact be a source of low cost.
There are currently two broad schools of thought related to strategy that are worthy of special attention. Core Competency and System of Activities. When companies are thinking about the creation of differenti-ated offers to meets needs of specific seg-ments, they need to think about the ap-proach that allows them to best create the offer and to gain competitive advantage.
cOre cOmPeteNcy
Core Competency strategy typology was first proposed by CK Prahalad, and Gary Hamel around 1990. The foundation of core competency strategy is that:
• Competencies are the source of user-value
• Competencies are difficult to develop

11Copyright 2012, Tracy Crawford http://www.raineight.com
and thus difficult for competitors to emulate
• Competencies are macro-level ad-vanced capabilities that can serve a wide range of user needs
The logic of core competency strategy is that the value created derives from a core competency. An example may be a firm who possesses a pro-prietary new technology. In this case a firm may seek to protect their knowl-edge and advance their skill in application of the tech-nology to levels that a competi-tor may not be able to easily replicate.
To qualify as a core com-petency a capability must meet the following rigorous test:
• Provides value to a relatively large number of segments
• Contributes significant customer-per-ceived value
• Difficult to imitate
• Company maintains best-in-class expertise
As may be imagined, most companies maintain very few true core competencies.
Many firms have relied extensively and successfully on core compe-
tency as the basis of their com-petitive advantage. A com-
mon hazard of exclusive or excessive focus on
core competency however is that
alternative approaches
or substi-tutes may
develop. Another haz-
ard is that firms may focus too ex-
tensively on their in-ternal competencies at the
expense of truly and deeply understanding customers’ needs.

12Copyright 2012, Tracy Crawford http://www.raineight.com
SyStem Of ActivitieS
Michael Porter, in his What is Strategy? paper, published in Harvard Business Review in 1996 argues that complex inter-related systems of activities create more competitive advantage and are more sus-tainable than individual activities or indi-vidual core competencies. The activities referenced in such a system may be re-ferred to as capabilities as they rarely meet the rigorous requirements to qualify as a core competency.
Systems of activities often have very high behind-the-scenes complexity. Porter argues that it is the complexity itself of the systems of activities that contributes to competitive advantage by allowing firms to construct offers that are indeed more difficult to replicate. Complexity also often means that offers can be more finely tuned to precisely meet needs more fully than competitive offers.
Indeed it has been argued that while core competencies are difficult to copy, patient, persistent, determined, and well-funded competitors can in fact, copy them. Ad-ditionally “replacement” competencies increasingly emerge to threaten older established core competencies. Sony, once the unchallenged leader in CRT-based tel-evisions, is an example that comes to mind that was summarily dispatched by several
emerging flat-screen technologies.
Likewise, Southwest Airlines has long been referenced as the poster-child of system of activities strategy. But alas to-day we see an array of knock-off low-cost point-to-point carriers creating plenty of concern for Southwest Airlines and giving lie to any notion that system of activities is a panacea, especially in the face of new market entrants unencumbered with leg-acy customer expectations and unwieldy corporate structures.
The approaches of core competency and system of activities are not, in my view, exclusionary at all. In fact both remain powerful concepts that I feel have syner-gies and especially so in combination with other powerful strategic approaches.
For reference the system of activities maps for Southwest airlines and IKEA furniture company are shown on the following page for reference.

14Copyright 2012, Tracy Crawford http://www.raineight.com
StrAtegy highlightS
Ellen-Earle Chaffee in 1985 created a shortlist of the highlights of strategy that had been created by the end of the 1970’s. Drawing from her list and adding the most recent developments we arrive at the fol-lowing key and generally widely accepted points:
• Organizations (changeable) usually must adapt to their business environ-ments (largely unchangeable by an individual firm).
• In contrast to the point above, blue ocean approach holds that in some cases corporations relying on highly innovative cultures can create new demand.
• SWOT analysis allows organizations to understand the fit between their in-ternal company environment and the external business environment.
• Gap analysis is a concept that charac-terizes gaps between existing capabil-ity and capability required to be suc-cessful in a particular environment so that companies may develop activities to close critical gaps.
• Segmentation is a powerful concept for subdividing markets into manage-able pieces allowing for both analysis and focused efforts creating oppor-tunity for firms to create unbeatable
(within the segment) competitive advantage.
• Effective strategy requires acknowl-edgement that change is steady, requiring strategies to be adapted accordingly often involving unique non-repetitive responses.
• Differentiation seeks to create more highly valued offers and is a central tenant of most strategies.
• All strategies involve tradeoffs. In fact the more tradeoffs made, quite often the stronger is the resulting strategy. All activities have the opportunity cost of other activities that must be neglected or shortchanged. Deciding what not to do is probably more im-portant than deciding what to do.
• Strategy works best when it impacts an entire organization by providing general direction and/or detailed plans that must be implemented by multiple functions.
• Strategy involves strategy develop-ment as well as implementation.
• Strategy may be highly planned (planning strategy approach) or only partially planned initially (learning strategy approach) with adaptations or major changes incorporated as ex-perience and learning dictate.
• Strategy may be implemented at mul-tiple levels – corporate, divisional, business unit, market, region etc.
15Copyright 2012, Tracy Crawford http://www.raineight.com
• Strategy development includes crea-tive/conceptual activities as well as analytical activities.
• Portfolio analysis allows construction of desirable and focused portfolios that can maximize profitability and reduce dispersion of effort.
• The concept of strategic objectives provides clear goals that can be fol-lowed by an entire organization.
• Brand positioning refers to how the brand is perceived by customers or potential customers. Brand position may have significant value (if well constructed and managed over time), and this value (referred to as Brand Value) is a significant portion of many corporate financial valuations.
• The value of a particular strategy de-clines over time due to changes within the firm, changes within the market and due to competitive activity.
16Copyright 2012, Tracy Crawford http://www.raineight.com
THE GOAL OF STRATEGYThe goal of strategy as I’ve stated is “opti-mizing performance.”
Let’s start in the business world where the source of optimized performance is widely known as “competitive advantage” then broaden the definition of competitive advantage to cover other, “non-business” endeavors.
In the business world we always drive strategy to sustainable superior “finan-cial” performance. Sustainable superior financial performance, at the highest level, is related to four factors: sustainability, volume, cost and price. The strategic math is simple:
High Price – Low Cost = Profitability
Volume x Profitability = Superior Finan-cial Performance
Sustainability x Superior Financial Perfor-mance = Sustainable Superior Financial Performance
So (in the business world) we only need to concern ourselves with four factors:
• Cost• Price• Volume• Continuity
PerSPective - cOSt, Price, vOl-ume, cONtiNuity
Broadening the definition of these four factors so that we may apply these busi-
THE GOAL OF STRATEGY
17Copyright 2012, Tracy Crawford http://www.raineight.com
ness-derived principles to other endeavors as well and also putting these factors into relative perspective we can see the follow-ing:
CostFirst, let’s equate cost to efficiency so that the concept can be broadly applied. Effi-ciency is affected by complex interactions of factors like capitalization, automation, smart use of labor, IT and physical infra-structure, flow and pull, visual systems, communication, collaboration, speed of problem solving and speed of improve-ment, location, logistics, cost of raw-ma-terials, etc. Most people know this, and it is not the main point of this paper. If you don’t know these things or would like a little food for thought now and again, start here: http://www.evolvingexcellence.com/. You can subscribe and learn a little every day.
Some will surely disagree, but I am not go-ing to treat efficiency as a major strategic subject. Efficiency (cost), in my personal view, is a critically important tactical day-to-day activity – sort of like turning on the lights in the morning. In some cases where efficiency is a glaring weakness or otherwise success-critical factor requir-ing special attention, it may be treated as a supporting strategic element but in no case should become a pillar of strategy.
My reason (and the reason shared by many strategists) is that efficiency, while being highly involved, is straightforward to understand and to replicate. Indeed Porter states categorically that, “Opera-tional effectiveness is not strategy.”
You can hire consultants to teach you about cost reduction and efficiency im-provement. LEAN, 6 Sigma, Continuous Improvement, Muda, Kaizen, TPS (the Toyota Production System), 5S, 6S, etc. are all cost-reduction/efficiency-enhanc-ing disciplines. They are very important. Most companies are well advised to en-gage them. Consultants will teach you good things about efficiency if your ears and eyes are open. You will pay consult-ants very well to do this, and they are well worth the money.
But your competitors pay them as well. Consultants will learn good things while teaching you good things. They (or others like them) will sell what they know to your competitors. Efficiency can therefore, you see, be replicated.
Efficiency also has a limit. The limit you may approach for the cost of most things is zero. But the closer to zero one ap-proaches; the more difficult are the gains.
We can think of efficiency as a race with our competitors. We are usually either a
18Copyright 2012, Tracy Crawford http://www.raineight.com
step ahead or a step behind, but the differ-ential is usually quite small in both direc-tions, relatively easy to gain or lose, and certainly not the basis of sustainable com-petitive advantage in most cases.
Efficiency (low cost) is necessary but not sufficient.
PricePrice equates to value. Whether we speak of business or non-business endeavors, value is a much better word to use. Value is, from a strategic perspective, a much richer subject than efficiency (or cost) and is the underlying reason for purchase deci-sions.
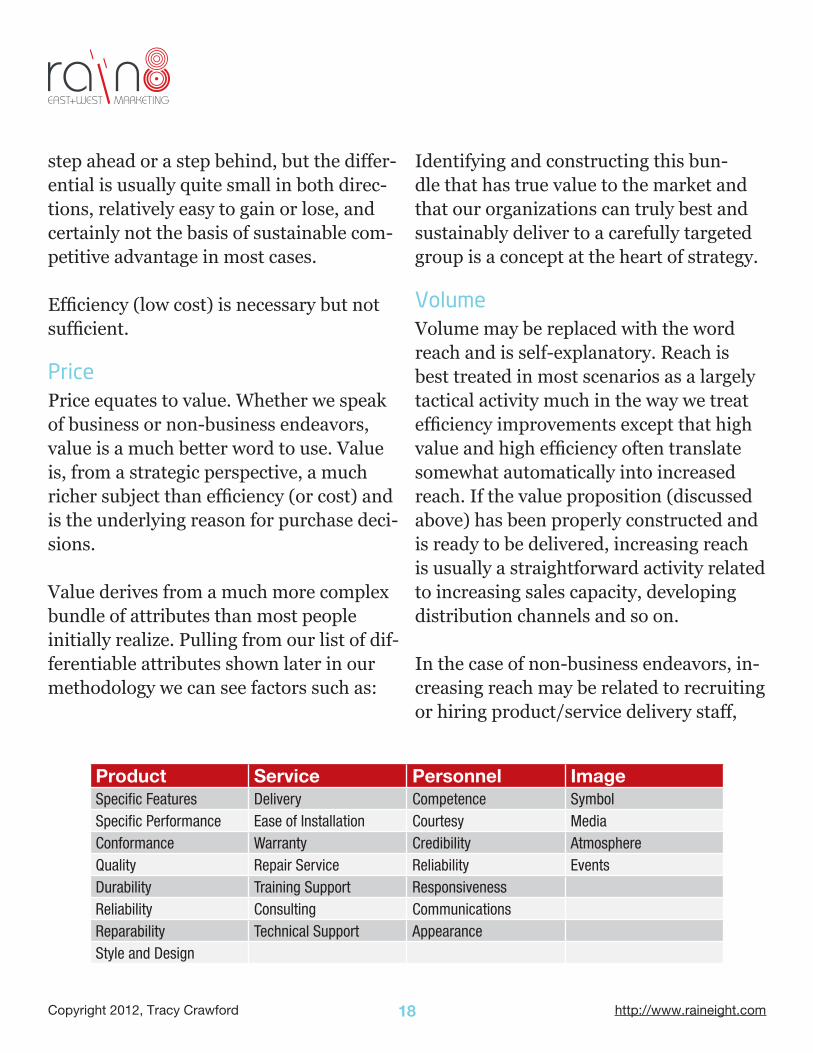
Value derives from a much more complex bundle of attributes than most people initially realize. Pulling from our list of dif-ferentiable attributes shown later in our methodology we can see factors such as:
Identifying and constructing this bun-dle that has true value to the market and that our organizations can truly best and sustainably deliver to a carefully targeted group is a concept at the heart of strategy.
VolumeVolume may be replaced with the word reach and is self-explanatory. Reach is best treated in most scenarios as a largely tactical activity much in the way we treat efficiency improvements except that high value and high efficiency often translate somewhat automatically into increased reach. If the value proposition (discussed above) has been properly constructed and is ready to be delivered, increasing reach is usually a straightforward activity related to increasing sales capacity, developing distribution channels and so on.
In the case of non-business endeavors, in-creasing reach may be related to recruiting or hiring product/service delivery staff,
Product Service Personnel ImageSpecific Features Delivery Competence Symbol Specific Performance Ease of Installation Courtesy Media Conformance Warranty Credibility Atmosphere Quality Repair Service Reliability EventsDurability Training Support Responsiveness Reliability Consulting Communications Reparability Technical Support Appearance Style and Design

19Copyright 2012, Tracy Crawford http://www.raineight.com
training and so on. Increasing volume is generally to be treat-ed as tactical or supporting-strategic but normally not as a strategic pillar.
ContinuityContinuity may be replaced with sustain-ability and is usually tightly tied to value mentioned above. Delivering value re-quires the patient and steady development of competency. Focusing on maintaining and expanding the competencies underly-ing the value proposition usually meets much of the sustainability requirement.
We are in a period of tremendous flux, particularly socially and technologically that spills over into the business world quite significantly. A great strategy today may not maintain greatness for long into the future. Thus, relative to strategy, fre-quent review, especially with a creative and innovative approach, is likely critical to sustainability.
SummaryUsing our more generic terms we can see the following four factors as leading to superior performance:
1. Value2. Efficiency3. Reach4. Sustainability (including creativity
and innovation)
In many ways strategy is becoming the best we can become in delivering an ideal value-bundle to a carefully selected target. Becoming the best entails:
• Carefully identifying the value attrib-utes that are most desired
• Eliminating or minimizing focus on the less important value-attributes
• Eliminating or maintaining thresh-old-only capability in lower-impor-tance value-attributes
• Maintaining efficiency and reach im-provement capability at appropriate levels
• Cultivating creativity and innovation
20Copyright 2012, Tracy Crawford http://www.raineight.com
STRATEGIC ELEMENTS
In this section we’ll discuss a range of stra-tegic concepts and tools that set the stage for and/or are addressed in the methodol-ogy.
StrAtegic ObjectiveS
Most modern strategy development pro-cesses (this one included) rely heavily on the goal of creating a set of strategic ob-jectives that become the critical summary driving actions to implement strategy.
Throughout this process of strategy devel-opment and at nearly every stage findings are converted to actionable items. Since the volume of potential action items is large and often duplicative, duplicates or near duplicates are unified and each item
is rated using a system to measure the value and importance of the action item. I refer to the raw volume of items as drivers – meaning that they have the potential to become key drivers that are used to create strategic objectives and may later become parts of implementation plans and tracked by the control plan.
PlANNiNg StrAtegy vS. leArN-iNg StrAtegy
Two common approaches to development and implementation of strategy are plan-ning and learning.
Planning strategy is used where firms have access to high quality information, data and/or expertise (most commonly in the form of their own experienced staffs). In
STRATEGIC ELEMENTS
21Copyright 2012, Tracy Crawford http://www.raineight.com
planning strategy, development intensity is high and may be quite involved as the firm evaluates large quantities of valu-able data and information. During imple-mentation of planning strategy, the need for frequent or substantial adaptation is reduced as the firm has had the oppor-tunity and time for detailed analysis and has normally reached sound and powerful conclusions.
The learning strategy approach is used where firms do not have access to lots of data, information and/or expertise. In this approach, strategy development proceeds rather more rapidly but with the under-standing that conclusions may not be as trustworthy or that significant information is missing from the analysis and develop-ment process. Learning strategy requires frequent reassessments and, quite often, substantial adjustments as the strategy is essentially being developed “on-the-fly.” Learning strategy will ideally follow the same rigorous structure of a well-execut-ed planning strategy so that the proper framework is established but may be ex-ecuted with less intensity at each step.
The planning approach is generally pre-ferred where companies have access to information, data and expertise, but both approaches (and approaches in between) have been used successfully.
chANge, cOmPlexity ANd creA-tivity
IBM recently (2010 completed a study of approximately 1500 CEO’s from a range of countries around the world. Three key findings of this study were:
1. Complexity is increasing2. Most firms are not well armed to
adapt to this increasing complexity3. Creativity is the leading attribute
CEO’s feel they need in executive leadership staff – both relative to strategic planning and to general strategic thinking
Max McKeown, an accomplished writer, researcher and consultant working with Warwick Business School warns that a particular rigid prescription for strategy may be dangerous and that a mix of crea-tivity and analysis characterize strategy development.
Change is indeed always present and, in-tuitively, seems to be escalating.
Thus, while I advocate for a systematic approach based on proven tools, I likewise warn against overly rigid thinking. What seems manifestly clear is that what may work extremely well at present, may not work nearly as well in the future.
22Copyright 2012, Tracy Crawford http://www.raineight.com
I encourage all strategy development ef-forts be approached with:
1. A rigorous (but not rigid) process2. Significant space and encourage-
ment for creativity3. A proper level of analysis
mArket ShAre cONSiderAtiONS
In the 1960’s a study entitled Profit Im-pact of Marketing Strategy (PIMS) was started by Sidney Schoeffler for GE in an effort to understand factors causing some business units to be more profitable than others. PIMS evolved into a longitudinal study and was expanded outside of GE to include over 200 companies and nearly 4,000 business units (presently continu-ing).
PIMS produced of course many findings, and a significant one that began emerging early was the impact of market share on profitability. The study found that, some-what paradoxically, firms with the largest market share experienced high profitabil-ity, as did firms with the lowest market share, while firms in the middle suffered. Further analysis led researchers to con-clude that high share firms may benefit from larger scale economies as well as higher experience learning curve effects. Low share firms, on the other hand, may benefit from offering only highly differ-entiated specialty products or services or
from “cherry-picking” only ideal smaller opportunities. Middle share firms suffered from lower expertise and lower scale econ-omies while trying to match full-service offers of larger share competitors.
These findings in part contributed to increased interest in the 1970’s in tech-niques to increase market share such as mergers and acquisitions.
Many firms concluded as a result of these findings that they must attain position one or two in terms of market share, to be-come a niche supplier only or to consider exiting a segment.
Many firms pursuing an M&A strategy met with marginal success (in terms of profita-bility) likely due to not understanding ful-ly the challenges of integration, resolving cultural conflicts, streamlining the merged or acquired unit, obtaining true cost re-ductions (often erroneously referred to as “synergies”), rationalizing overlapping product lines (often resisted by custom-ers not wishing to be forced to themselves change and bear costs of change), finding the scale economies (due to differing pro-cesses and capital equipment, differing bills of material etc.)
While the findings relative to market share are undoubtedly valid, a deeper look in-dicates that the method by which market
23Copyright 2012, Tracy Crawford http://www.raineight.com
share is attained is important and that, if M&A is to be the method, firms need to account for the challenges, costs and time required to achieve true integration.
viSiON, vAlueS & beliefS, miS-SiON
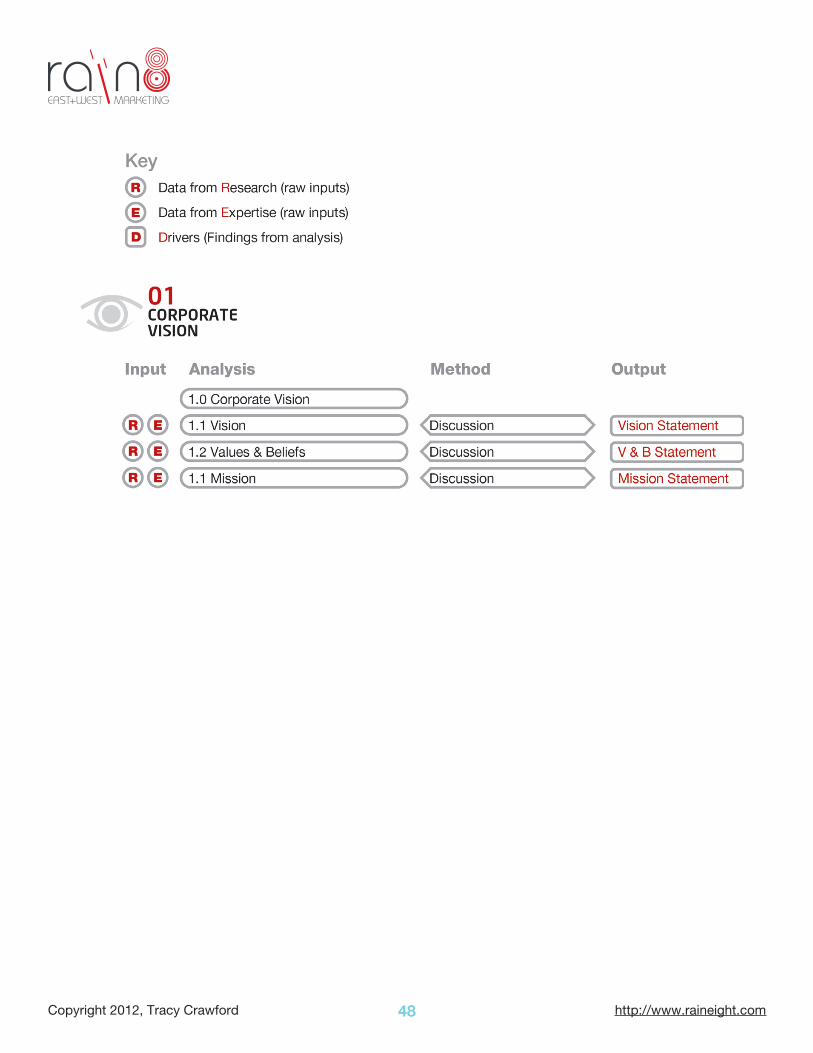
Vision, Values & Beliefs, and Mission are generally well-understood strategic foun-dational concepts and thus don’t require a lot of elaboration here.
Simple common definitions are:
VisionA description of future conditions we wish to create or help create over very long pe-riods of time.
Values & BeliefsGuiding concepts, values, beliefs and prin-ciples of the organization.
MissionA specific goal that is planned to be ac-complished. Many companies treat Mis-sion as a relatively near-term (5 years for example) specific goal that the organiza-tion sets about to accomplish.
SegmeNtAtiON, POrtfOliO evAl-uAtiON ANd tArgetiNg
Segmentation
Clearly no company can provide all goods and services to the entire market. The con-cept of segmentation was thus developed to allow firms to divide the global market into manageable pieces allowing for de-tailed analysis and development of focused marketing approaches. By defining a por-tion of the market companies are in better position to conduct detailed research into the segment’s overall attractiveness (what is called industry attractiveness) and how those segments’ needs fit with existing business strengths.
Portfolio Evaluation A key concept in all strategy is that firms should develop product/service portfolios that create a mix of profitability, growth and a degree of “future-proofing.” For the sake of discussion and ease of analysis we may think of the portfolio elements as market segments (or industries) with an assumed or known underlying product/service need required (though the exact product/service may also be further ana-lyzed if required).
24Copyright 2012, Tracy Crawford http://www.raineight.com
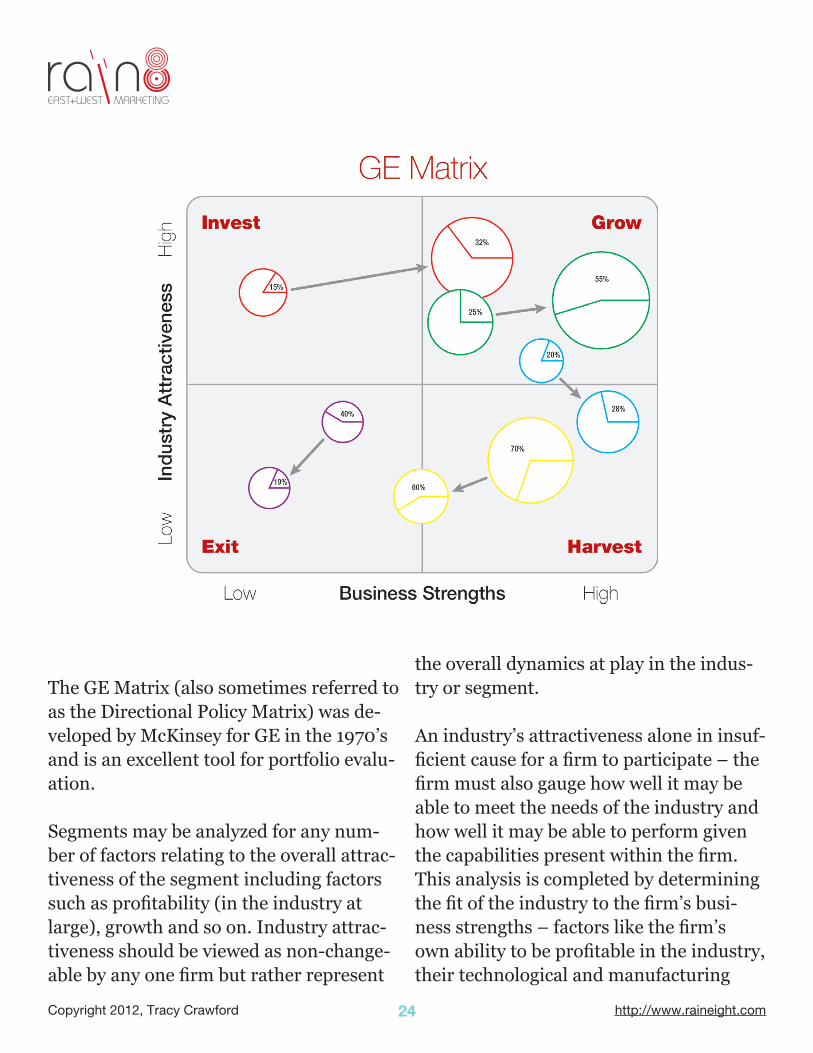
The GE Matrix (also sometimes referred to as the Directional Policy Matrix) was de-veloped by McKinsey for GE in the 1970’s and is an excellent tool for portfolio evalu-ation.
Segments may be analyzed for any num-ber of factors relating to the overall attrac-tiveness of the segment including factors such as profitability (in the industry at large), growth and so on. Industry attrac-tiveness should be viewed as non-change-able by any one firm but rather represent
the overall dynamics at play in the indus-try or segment.
An industry’s attractiveness alone in insuf-ficient cause for a firm to participate – the firm must also gauge how well it may be able to meet the needs of the industry and how well it may be able to perform given the capabilities present within the firm. This analysis is completed by determining the fit of the industry to the firm’s busi-ness strengths – factors like the firm’s own ability to be profitable in the industry, their technological and manufacturing
25Copyright 2012, Tracy Crawford http://www.raineight.com
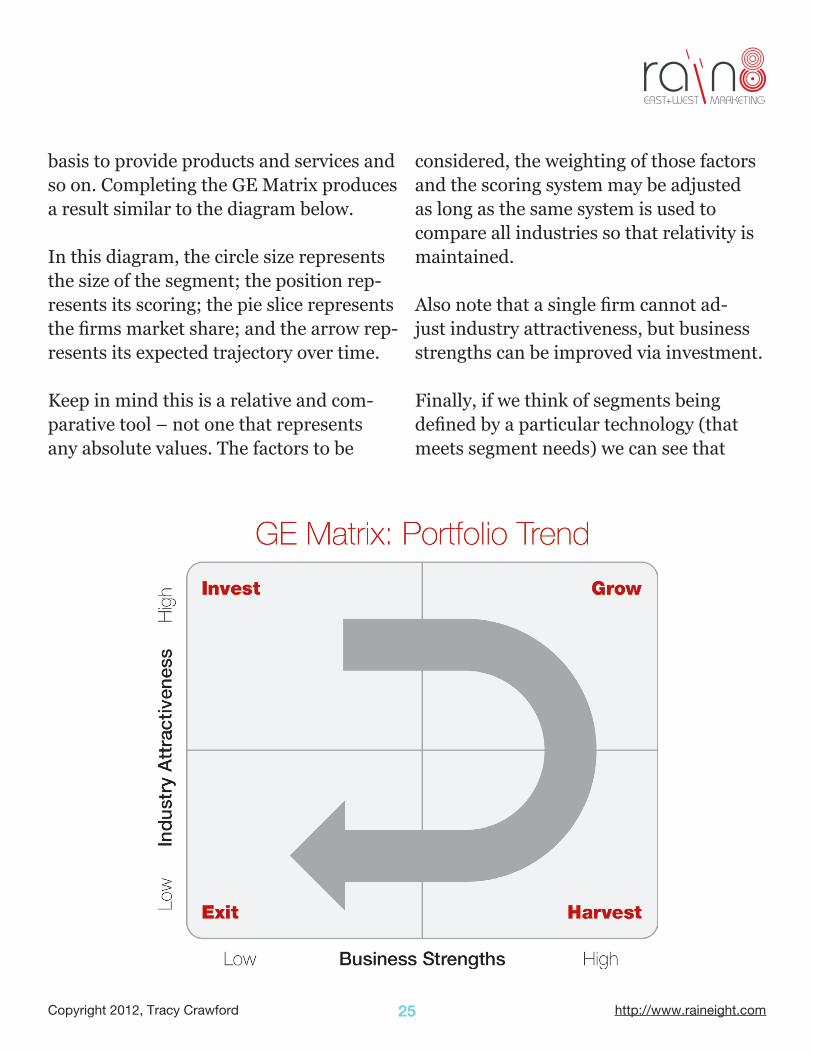
basis to provide products and services and so on. Completing the GE Matrix produces a result similar to the diagram below.
In this diagram, the circle size represents the size of the segment; the position rep-resents its scoring; the pie slice represents the firms market share; and the arrow rep-resents its expected trajectory over time.
Keep in mind this is a relative and com-parative tool – not one that represents any absolute values. The factors to be
considered, the weighting of those factors and the scoring system may be adjusted as long as the same system is used to compare all industries so that relativity is maintained.
Also note that a single firm cannot ad-just industry attractiveness, but business strengths can be improved via investment.
Finally, if we think of segments being defined by a particular technology (that meets segment needs) we can see that

26Copyright 2012, Tracy Crawford http://www.raineight.com
technology life cycles often follow around in a clockwise direction on this chart as shown below – further argument for clear-eyed portfolio management not only of segments but of technologies used in those segments. A typical portfolio lifecycle is illustrated below on the GE Matrix.
Targeting - Four Classic Market Strat-
egies
There are four well-known classic market-targeting strategies that generally charac-terize company activities related to par-ticular market segments.
Exit Strategy
For opportunities having poor market dy-namics and poor fit to Company-capability an Exit strategy is often the best course. Exiting a segment may prevent highly competitive, non-profitable endeavors form siphoning off valuable Engineering, Manufacturing or Sales resources that could be better utilized elsewhere. Exit-segments are in poor markets and often demand excessive Engineering or Manu-facturing resources and have unacceptable profitability.
Harvest Strategy
Opportunities in markets with poor overall dynamics but which fit well with an existing company-capability may be managed with a Harvest strategy. In a
Harvest strategy resources are cut-off or minimized and revenue is taken opportun-istically. Existing customers may be sup-ported minimally, but new business is not aggressively pursued and new engineering or manufacturing resources are strictly limited. Harvest-opportunities often yield moderate to very good incremental profit-ability and can be an important part of an overall company-strategy where scale is important and where the resultant low-cost position can be applied to other high-ly profitable markets.
Growth Strategy
Opportunities with good market dynamics and with good fit with company-capability are candidates for Growth strategy. In this strategy investments are made in usu-ally near-term activities that are intended to directly expand revenue. Examples include hiring Sales people, developing brochures or catalogues, developing prod-uct extensions and product customizations and expanding value-add activities moder-ately within existing company-capabilities, etc. Growth opportunities may be ex-pected to yield the highest net income due to good market dynamics and minimal strategic-resource requirements.
Invest Strategy
Opportunities in large and growing seg-ments with good profitability and rela-tively low competitive intensity but for

27Copyright 2012, Tracy Crawford http://www.raineight.com
which the company may lack a particular capability may be good candidates for an Invest strategy. An example may be an opportunity with good market dynam-ics but for which the company possesses two of three required capabilities. In this case investment in added capability such as new plant capacity, a new technology (e.g. hiring design experts, purchasing test and analysis equipment, etc.) may be the advisable approach. Invest strategies are usually (but not always) somewhat longer term and are characterized by higher risk due to higher investment levels and the longer time frame. Successful investment strategies will move the opportunity to the right in the matrix over time, and ideally, well into the Growth quadrant.
Placing all opportunities in the context of the Industry Attractiveness/Business Strengths matrix levels the playing field and allows managers to focus on Growth-opportunities, to streamline and Exit where appropriate, and to manage activi-ties in Harvest and Invest-opportunities.
Opportunities are often observed to mi-grate from Invest in a clockwise direc-tion into Growth as capability improves and into Harvest over time as market
dynamics deteriorate (for example due to increased competition, decreased perfor-mance requirements, etc.). If companies divest required capability, e.g. capabil-ity suitable only to markets that are now unattractive, the opportunity may migrate to the Exit quadrant and the company may exit.
differeNtiAtiON
Differentiation of an offer is of course at the very core of strategy. “Different” does not equal “differentiated” however. The word differentiation is widely used and misused in strategy and business. For an offer to be differentiated it needs to sub-stantially meet a rigorous test. Differenti-ated attributes should be uniquely mean-ingful to customers and create lasting value for the firm.
Testing DifferentiationA good test to determine which attributes are truly differentiated is the following 8-point test:
1. Important - highly valued by most customers
2. Unique - not currently offered & cannot be easily copied
3. Profitable - the company can make a profit
4. Superior - provides better benefit

28Copyright 2012, Tracy Crawford http://www.raineight.com
5. Communicable - can be perceived by customers
6. Affordable - customer are able and willing to pay
7. Realistic - consistent with current or planned internal strengths
8. Credible - customers will believe
Differentiable attributes are those aspects of an offer that create the core value for customers and represent the reason they make buy and repeat-buy decisions for the brands products/services.
In many strategic approaches, good differ-entiation minimizes the number of differ-entiated attributes (typically 1 to 4), which allows the company to maintain internal focus and to structure itself to establish or maintain superiority of differentiated at-
tributes. This approach follows closely the philosophies behind the core competency approach to strategy in which differenti-able attributes rely heavily on core compe-tencies.

29Copyright 2012, Tracy Crawford http://www.raineight.com
Systems of activities approach to strategy however may involve many “capabilities” as discussed previously. We may think of these capabilities as “lesser competencies” but with no particular need to be best-in-class in any given one since the value comes from the system as a whole with all pieces functioning adequately (but not necessarily best-in-class).
The best approach to differentiation is to think carefully and spend adequate time with research, client interviews etc. to come to deeply understand the true un-derlying needs of customers. Only with depth of understanding is it possible to de-velop differentiated offers that maximize competitive advantage.
After a clear view of what constitutes the differentiated offer, the issue of core com-petency vs. system of activities becomes much more straightforward to evaluate. Whether a firm chooses to more closely follow a core competency approach or a
system of activities approach (or some blend of the approaches) is a decision that will be clearly dictated by the description of the differentiated offer and what a firm must undertake in order to best deliver the differentiated offer.
A partial list of possible differentiable at-tributes is shown below.
A company’s offer should be differenti-ated from competitive offers. Otherwise, ‘Why would a customer purchase from us?’ Good differentiation is identifying and developing differences to distinguish the offer from competitive offers. Internal resources are focused on differentiated attributes, and threshold-performance is maintained on other important attributes. Finally, some portion of the brand posi-tion (discussed in the following section) is aggressively communicated to customers.
A successful brand position compels tar-geted customers to make buy and repeat-
Product Service Personnel ImageSpecific Features Delivery Competence Symbol Specific Performance Ease of Installation Courtesy Media Conformance Warranty Credibility Atmosphere Quality Repair Service Reliability EventsDurability Training Support Responsiveness Reliability Consulting Communications Reparability Technical Support Appearance Style and Design

30Copyright 2012, Tracy Crawford http://www.raineight.com
buy decisions, because it appeals to their most important needs in a category and the firm is perceived as best in delivering the offer.
For the purpose of developing brand posi-tion goals, price is generally not recom-mended as a differentiable attribute since most companies seek to optimize price. Good differentiation however does provide a bonus that may allow the company to charge a price premium, maintain market-share or enter new markets dominated by entrenched competitors.
Common Differentiation MistakesCommon differentiation mistakes include selecting attributes that are not important to customers and selecting brand posi-tions that are the same or too close to a leading competitor’s position. It is okay and in many cases advisable to have offer-attributes that are identical to competi-tors. Many attributes are simply required, particularly in industrial/commercial mar-kets.
Gating AttributesFor example, attributes such as meet-ing certain minimum quality standards, reliability standards, conformance to in-dustry standards, and delivery standards are often required for a company to be considered a viable supplier. These items are referred to as “gating” items. Many
gating items are set at sufficiently high levels such that incrementally increased performance doesn’t yield substantial increased utility to the customer. Here the principle of decreasing marginal utility is at work. An obvious example is that an improvement in delivery performance of two or three minutes may have little util-ity to many customers. It is generally un-workable to attempt to differentiate gating items. These may be important attributes, and, if so, the company will seek to main-tain required performance, but will not waste resources increasing performance above the levels rewarded by customers. These attributes are part of the position but are not differentiated and are neither the subject of heavy promotion to the cus-tomer nor the subject of excessive focus by the company.
An ideal brand position is one that is based on areas in which the company already thoroughly excels. This is rare however. In the usual case where an ideal brand position differs from the company’s current actual brand position, the com-pany adopts a brand position goal. The brand position goal identifies key attrib-utes of the product or service offer that the company will seek to attain and perfect. The logic follows that if unique attributes, important to customers have been select-ed, realized, attained and effectively com-
31Copyright 2012, Tracy Crawford http://www.raineight.com
municated, then customers will buy.
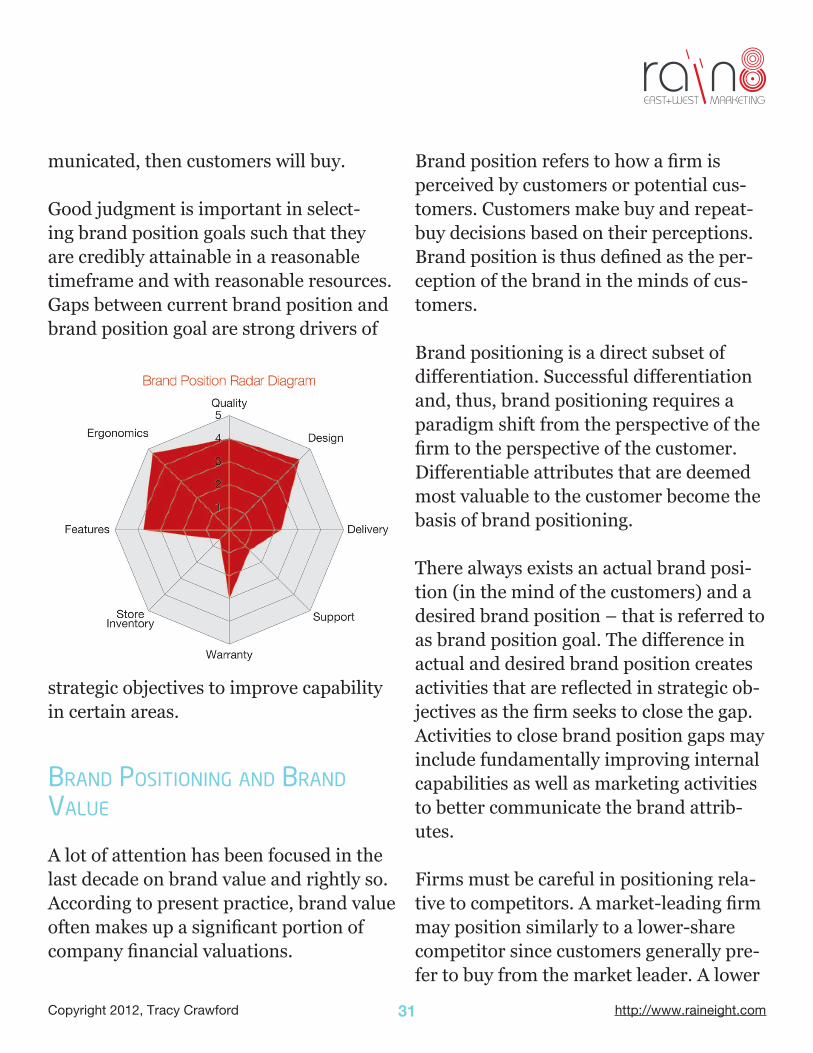
Good judgment is important in select-ing brand position goals such that they are credibly attainable in a reasonable timeframe and with reasonable resources. Gaps between current brand position and brand position goal are strong drivers of
strategic objectives to improve capability in certain areas.
brANd POSitiONiNg ANd brANd vAlue
A lot of attention has been focused in the last decade on brand value and rightly so. According to present practice, brand value often makes up a significant portion of company financial valuations.
Brand position refers to how a firm is perceived by customers or potential cus-tomers. Customers make buy and repeat-buy decisions based on their perceptions. Brand position is thus defined as the per-ception of the brand in the minds of cus-tomers.
Brand positioning is a direct subset of differentiation. Successful differentiation and, thus, brand positioning requires a paradigm shift from the perspective of the firm to the perspective of the customer. Differentiable attributes that are deemed most valuable to the customer become the basis of brand positioning.
There always exists an actual brand posi-tion (in the mind of the customers) and a desired brand position – that is referred to as brand position goal. The difference in actual and desired brand position creates activities that are reflected in strategic ob-jectives as the firm seeks to close the gap. Activities to close brand position gaps may include fundamentally improving internal capabilities as well as marketing activities to better communicate the brand attrib-utes.
Firms must be careful in positioning rela-tive to competitors. A market-leading firm may position similarly to a lower-share competitor since customers generally pre-fer to buy from the market leader. A lower

32Copyright 2012, Tracy Crawford http://www.raineight.com
share firm should not however position similarly to a leader to the same reasons.
Firms are well advised to carefully ana-lyze the positioning and differentiation of competitors in the process of constructing their own differentiation and positioning.
clASSic grOwth StrAtegieS
Companies find many ways to grow, and most falls into one of the following de-scriptions:
Growth strategies are of course often a combination of these methods.
cOmPeteNcy teStiNg
Competency testing is a simple analysis that identifies competencies required for specific product/service offers and rates the firms capability in each competency.
Required competencies with low ratings for capability are flagged such that plans can be made to compensate such as im-prove competency, outsource, and so on.
33Copyright 2012, Tracy Crawford http://www.raineight.com
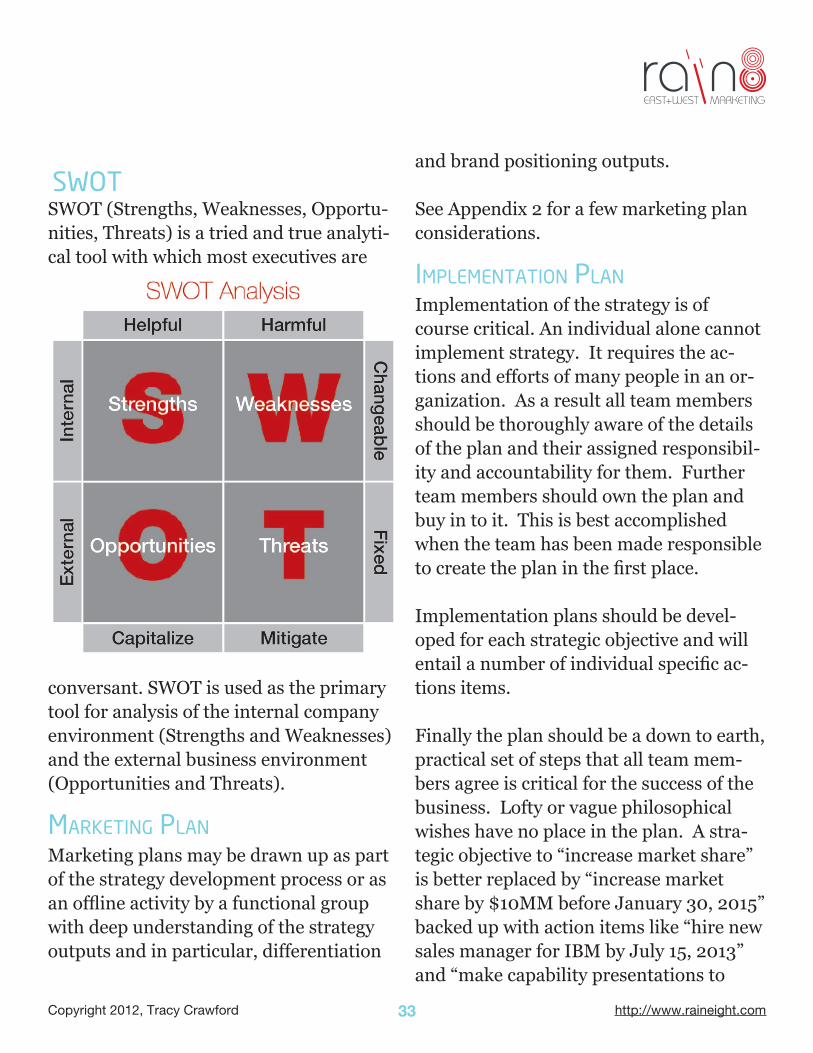
SwOtSWOT (Strengths, Weaknesses, Opportu-nities, Threats) is a tried and true analyti-cal tool with which most executives are
conversant. SWOT is used as the primary tool for analysis of the internal company environment (Strengths and Weaknesses) and the external business environment (Opportunities and Threats).
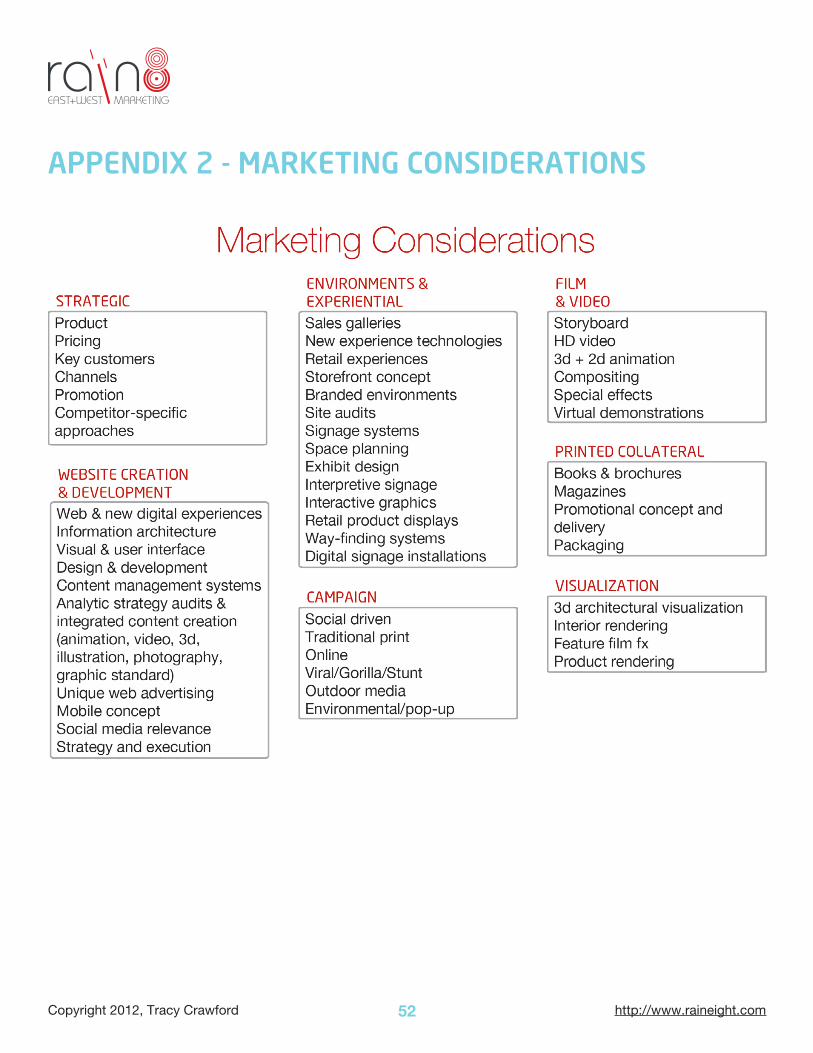
mArketiNg PlAN
Marketing plans may be drawn up as part of the strategy development process or as an offline activity by a functional group with deep understanding of the strategy outputs and in particular, differentiation
and brand positioning outputs.
See Appendix 2 for a few marketing plan considerations.
imPlemeNtAtiON PlAN
Implementation of the strategy is of course critical. An individual alone cannot implement strategy. It requires the ac-tions and efforts of many people in an or-ganization. As a result all team members should be thoroughly aware of the details of the plan and their assigned responsibil-ity and accountability for them. Further team members should own the plan and buy in to it. This is best accomplished when the team has been made responsible to create the plan in the first place.
Implementation plans should be devel-oped for each strategic objective and will entail a number of individual specific ac-tions items.
Finally the plan should be a down to earth, practical set of steps that all team mem-bers agree is critical for the success of the business. Lofty or vague philosophical wishes have no place in the plan. A stra-tegic objective to “increase market share” is better replaced by “increase market share by $10MM before January 30, 2015” backed up with action items like “hire new sales manager for IBM by July 15, 2013” and “make capability presentations to
34Copyright 2012, Tracy Crawford http://www.raineight.com
IBM, Motorola, Honeywell etc. by Febru-ary 15, 2012” The plan should be a hard-nosed business tool central to the running of the business.
The implementation plan consists of:
1. Actions and Assignments2. Timeline and Milestones 3. Resources and Organization
For each strategic objective, actions are assigned to individuals, a timeline with key milestones identified and, if required, resources and organizations are adjusted.
cONtrOl PlAN
To ensure timely completion of actions, a management review process is put in place along with key metrics. The control pro-cess also accounts for new data and chang-ing environments and allows for periodic plan revision and redeployment.
The control process should be made up of the following three components:
1. A regular management and team review process
2. Key metrics3. Periodic plan revision and rede-
ployment
35Copyright 2012, Tracy Crawford http://www.raineight.com
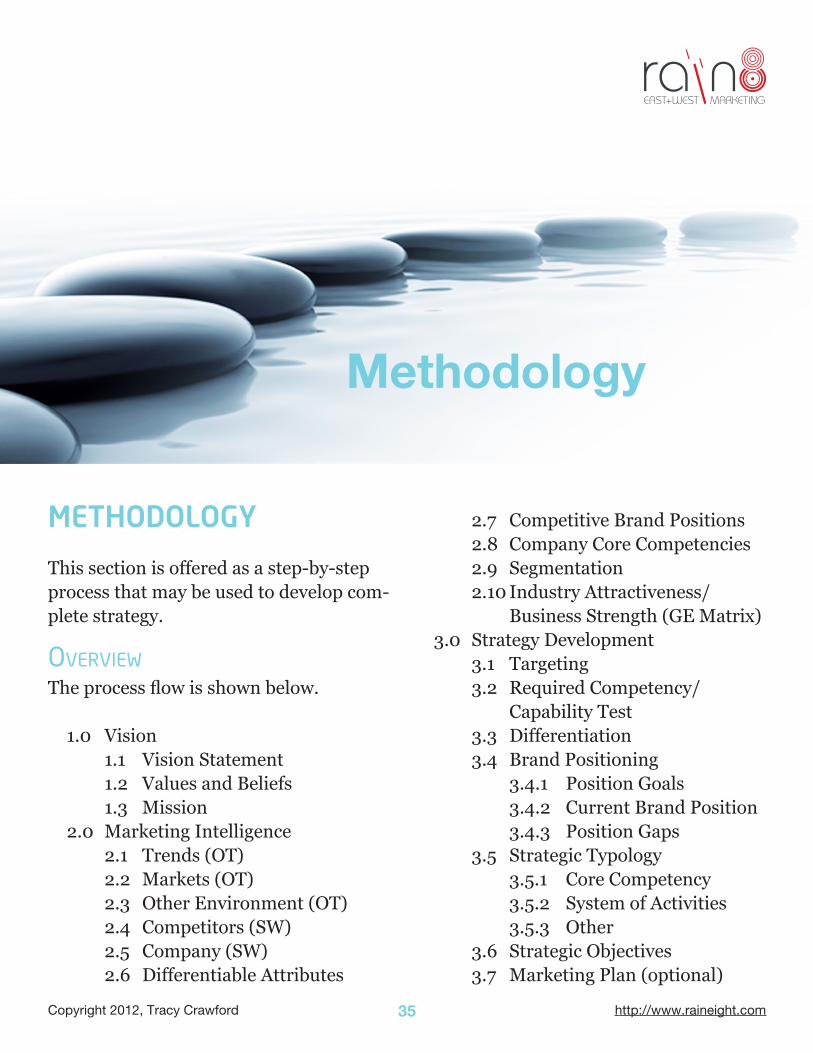
METHODOLOGY
This section is offered as a step-by-step process that may be used to develop com-plete strategy.
Overview
The process flow is shown below.
1.0 Vision 1.1 Vision Statement 1.2 Values and Beliefs 1.3 Mission2.0 Marketing Intelligence 2.1 Trends (OT) 2.2 Markets (OT) 2.3 Other Environment (OT) 2.4 Competitors (SW) 2.5 Company (SW) 2.6 Differentiable Attributes
2.7 Competitive Brand Positions 2.8 Company Core Competencies 2.9 Segmentation 2.10 Industry Attractiveness/ Business Strength (GE Matrix)3.0 Strategy Development 3.1 Targeting 3.2 Required Competency/ Capability Test 3.3 Differentiation 3.4 Brand Positioning 3.4.1 Position Goals 3.4.2 Current Brand Position 3.4.3 Position Gaps 3.5 Strategic Typology 3.5.1 Core Competency 3.5.2 System of Activities 3.5.3 Other 3.6 Strategic Objectives 3.7 Marketing Plan (optional)
Methodology
36Copyright 2012, Tracy Crawford http://www.raineight.com
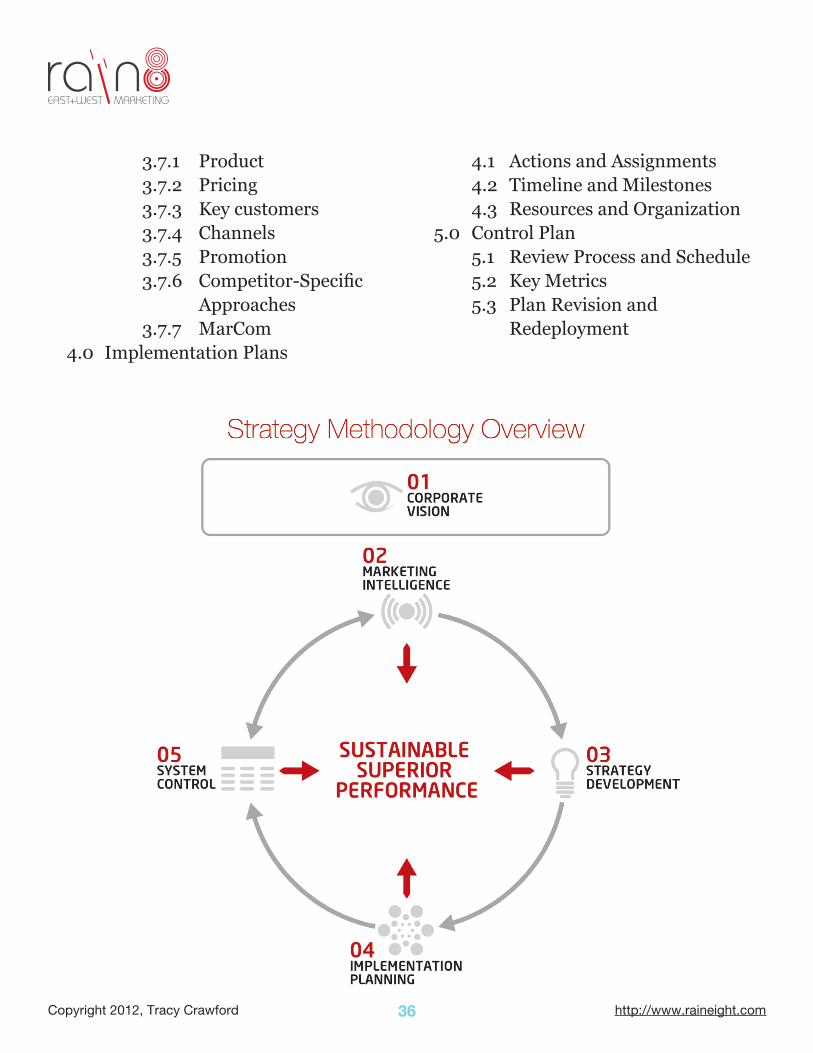
3.7.1 Product 3.7.2 Pricing 3.7.3 Key customers 3.7.4 Channels 3.7.5 Promotion 3.7.6 Competitor-Specific Approaches 3.7.7 MarCom4.0 Implementation Plans
4.1 Actions and Assignments 4.2 Timeline and Milestones 4.3 Resources and Organization5.0 Control Plan 5.1 Review Process and Schedule 5.2 Key Metrics 5.3 Plan Revision and Redeployment
37Copyright 2012, Tracy Crawford http://www.raineight.com
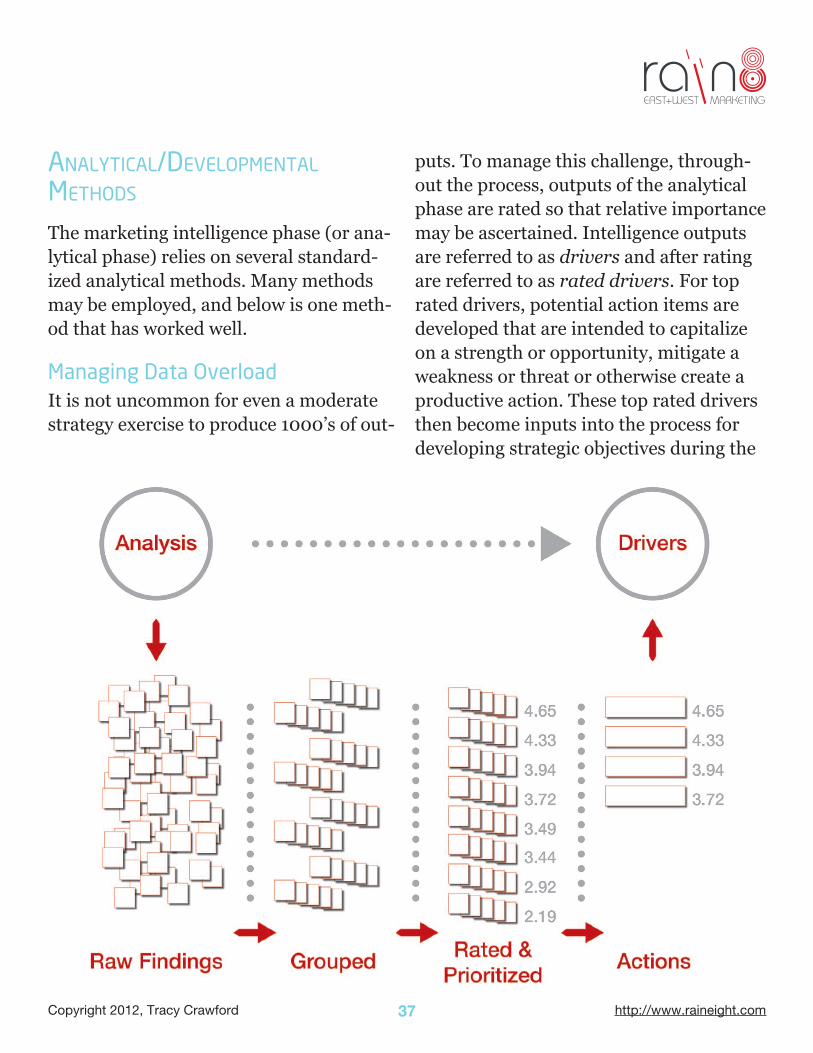
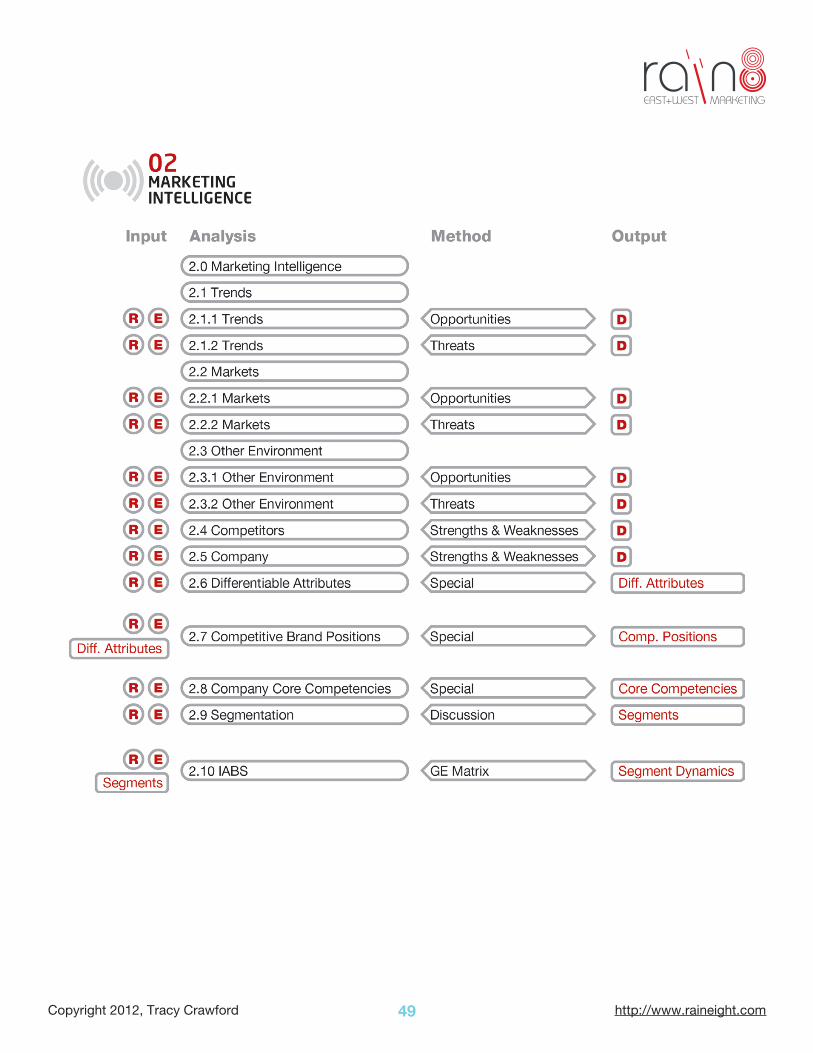
ANAlyticAl/develOPmeNtAl methOdS
The marketing intelligence phase (or ana-lytical phase) relies on several standard-ized analytical methods. Many methods may be employed, and below is one meth-od that has worked well.
Managing Data OverloadIt is not uncommon for even a moderate strategy exercise to produce 1000’s of out-
puts. To manage this challenge, through-out the process, outputs of the analytical phase are rated so that relative importance may be ascertained. Intelligence outputs are referred to as drivers and after rating are referred to as rated drivers. For top rated drivers, potential action items are developed that are intended to capitalize on a strength or opportunity, mitigate a weakness or threat or otherwise create a productive action. These top rated drivers then become inputs into the process for developing strategic objectives during the

38Copyright 2012, Tracy Crawford http://www.raineight.com
strategy development phase. An attractive method for generation of drivers during the marketing intelligence phase is:
1. Each team member creates a list;2. Member lists are posted and con-
solidated (because there are usually many duplicates, similar or related items).
3. Items are rated to create priority of relative importance
4. Actionable items are created for items of high importance.
The method rating and details are:
Strengths/Weaknesses Analytic
Method
Strengths/weaknesses analysis is used multiple times at different points in the process. Method:
1. Capabilities (whether strength or weak-ness) are to be listed and consolidated.
2. Capabilities are rated for strength as: a. Very Weak Capability (Score: 1) b. Weak Capability (Score: 2) c. Moderate Capability (Score: 3) d. Strong Capability (Score: 4) e. Very Strong Capability (Score: 5)3. Capabilities are rated for impact as: a. Very Low Importance in Sustaining or Increasing Profits (Score: 1)
b. Low Importance in Sustaining or Increasing Profits (Score: 2) c. Moderate Importance in Sustaining or Increasing Profits (Score: 3) d. High Importance in Sustaining or Increasing Profits (Score: 4) e. Very High Importance in Sustaining or Increasing Profits (Score: 5)4. A key action item is created for each
high-impact capability.
Scores may be created individually by team members then averaged to obtain the recorded score.
Opportunities Analytic MethodOpportunities analysis is used multiple times at different points in the process. Method:
1. Opportunities are to be listed and con-solidated.
2. Opportunities are rated for attractive-ness as:
a. Very Low Attractiveness (Score: 1) b. Low Attractiveness (Score: 2) c. Moderate Attractiveness (Score: 3) d. High Attractiveness (Score: 4) e. Very High Attractiveness (Score: 5)3. Opportunities are rated for probability
of success as: a. Very Low Probability of Success (Score: 1) b. Low Probability of Success (Score: 2) c. Moderate Probability of Success
39Copyright 2012, Tracy Crawford http://www.raineight.com
(Score: 3) d. High Probability of Success (Score: 4) e. Very High Probability of Success (Score: 5)4. Attractiveness and probability of suc-
cess scores are multiplied to create an impact rating.
5. A key action item is created for each high-impact opportunity.
Threats Analytic MethodThreats analysis is used multiple times at different points in the process. Method:
1. Threats are to be listed and consolidated.2. Threats are rated for probability of occurrence as: a. Very Low Probability of Occurrence (Score: 1) b. Low Probability of Occurrence (Score: 2) c. Moderate Probability of Occurrence (Score: 3) d. High Probability of Occurrence (Score: 4) e. Very High Probability of Occurrence (Score: 5)3. Threats are rated for severity of impact
as: a. Very Low Severity of Impact (Score: 1) b. Low Severity of Impact (Score: 2) c. Moderate Severity of Impact (Score: 3)
d. High Severity of Impact (Score: 4) e. Very High Severity of Impact (Score: 5)4. Probability of occurrence and severity
of impact scores are multiplied to create an impact rating.
5. A key action item is created for each high-impact threat.
Differentiable Attributes Analytic MethodFor this exercise, differentiable attributes are those aspects of an offer that are val-ued by customers. Differentiable attrib-utes will be used later in the process.
1. Customer need attributes are to be listed and consolidated.2. Attributes are rated for importance to
customers as: a. Very Low Importance (Score: 1) b. Low Importance (Score: 2) c. Moderate Importance (Score: 3) d. High Importance (Score: 4) e. Very High Importance (Score: 5)3. The list is prioritized by importance.
Competitive Brand Positions Analytic
Method
From the list of differentiable attributes, the team should agree and select the top 5-10 attributes (in terms of rated impor-tance to customers) and rate the perfor-mance of the company and of competitors in each category. The result is the compet-itive brands positions and may be visual-
40Copyright 2012, Tracy Crawford http://www.raineight.com
ized using a radar diagram. Method:
1. Create list of top competitors.2. Rate each competitor in terms of perfor-
mance against each of the selected top differentiable attributes.
3. (Optional). Drivers may be created and rated for importance at this stage for any “standout” positions that create spe-cial concern.
Company Core Competency Analytic
Method
This analysis identifies any core com-petencies that a company may possess. Method:
1. Create a list of potential core competencies.2. For each of the core competencies, rate
the company performance in each of the following four areas:
a. Provides value to a relatively large number of segments b. Contributes significant customer- perceived value c. Difficult to imitate d. Company maintains best-in-class expertise3. Rating system for each area: a. Very Low Agreement (Score: 1) b. Low Agreement (Score: 2) c. Moderate Agreement (Score: 3) d. High Agreement (Score: 4)
e. Very High Agreement (Score: 5)4. For any core competencies identified,
create drivers to leverage the compe-tency, ensure its maintenance and/or to strengthen it.
Note – many teams find their companies do not possess core competencies and that they operate in an approach that is similar to system of activities.
Segmentation Analytic MethodDefine market segments. Generally a nu-merical methodology is not required for this step and a process of brainstorm, discussion and debate suffices. There are no drivers emergent from segmentation as segments are to be used in next steps.
GE Matrix – Industry Attractiveness/
Business Strengths Analytic Method
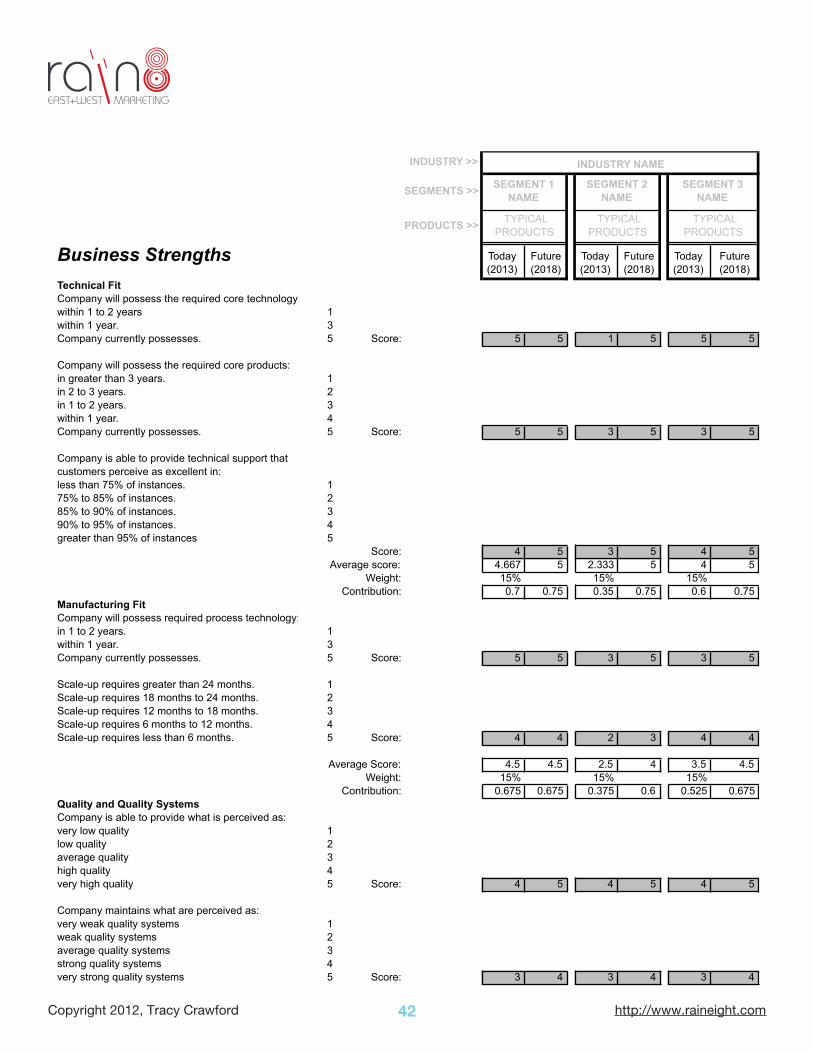
This analysis creates a view of segment dy-namics and fit to company capabilities so that a segment portfolio (targeting) may be created along with guidance regarding marketing strategy (Invest, Grow, Har-vest, Exit). This analysis is involved but straightforward. Method:
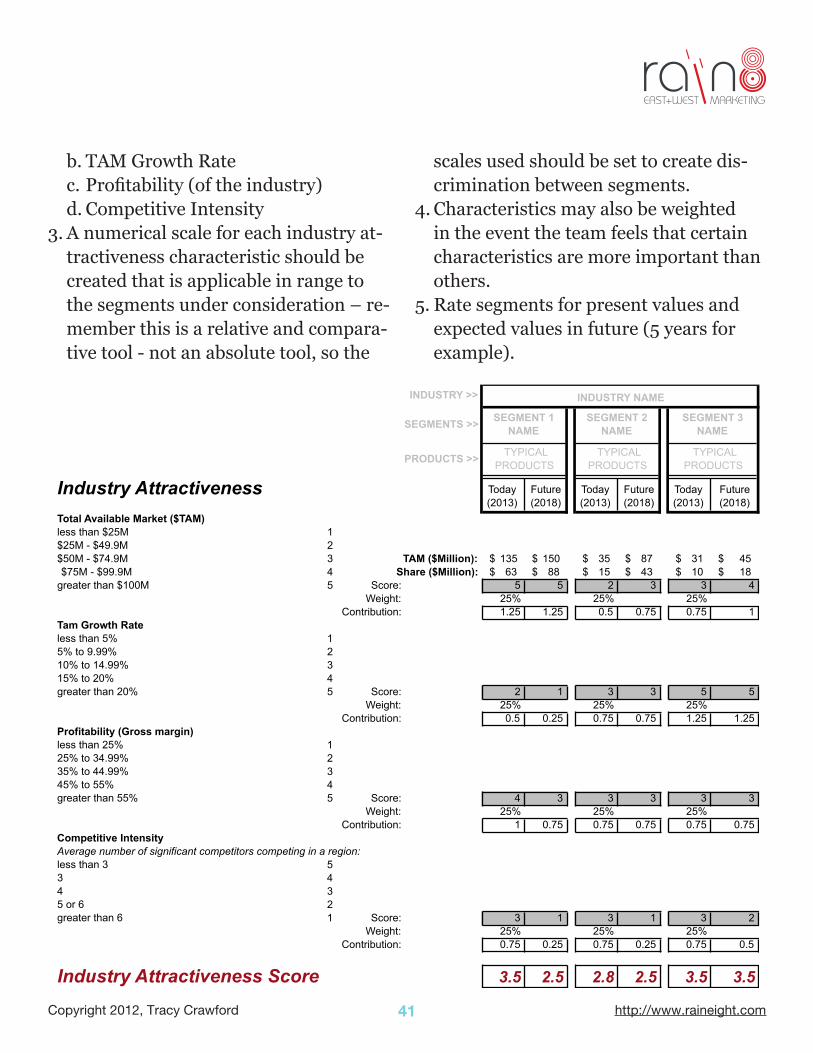
1. For each segment, rate industry attrac-tiveness and business strengths.
2. Typical characteristics used for industry attractiveness include:
a. Total Available Market (TAM)
41Copyright 2012, Tracy Crawford http://www.raineight.com
b. TAM Growth Rate c. Profitability (of the industry) d. Competitive Intensity3. A numerical scale for each industry at-
tractiveness characteristic should be created that is applicable in range to the segments under consideration – re-member this is a relative and compara-tive tool - not an absolute tool, so the
scales used should be set to create dis-crimination between segments.
4. Characteristics may also be weighted in the event the team feels that certain characteristics are more important than others.
5. Rate segments for present values and expected values in future (5 years for example).
INDUSTRY >>
SEGMENTS >>
PRODUCTS >>
Industry Attractiveness Today(2013)
Future(2018)
Today(2013)
Future(2018)
Today(2013)
Future(2018)
Total Available Market ($TAM)123 TAM ($Million): 135$ 150$ 35$ 87$ 31$ 45$ 4 Share ($Million): 63$ 88$ 15$ 43$ 10$ 18$ 5 Score: 5 5 2 3 3 4
Weight: 25% 25% 25%Contribution: 1.25 1.25 0.5 0.75 0.75 1
Tam Growth Rate12345 Score: 2 1 3 3 5 5
Weight: 25% 25% 25%Contribution: 0.5 0.25 0.75 0.75 1.25 1.25
Profitability (Gross margin)12345 Score: 4 3 3 3 3 3
Weight: 25% 25% 25%Contribution: 1 0.75 0.75 0.75 0.75 0.75
Competitive IntensityAverage number of significant competitors competing in a region:
54321 Score: 3 1 3 1 3 2
Weight: 25% 25% 25%Contribution: 0.75 0.25 0.75 0.25 0.75 0.5
Industry Attractiveness Score 3.5 2.5 2.8 2.5 3.5 3.5
SEGMENT 1 NAME
SEGMENT 2 NAME
SEGMENT 3 NAME
TYPICAL PRODUCTS
TYPICAL PRODUCTS
TYPICAL PRODUCTS
less than $25M$25M - $49.9M$50M - $74.9M$75M - $99.9M
greater than $100M
less than 5% 5% to 9.99%10% to 14.99%15% to 20%greater than 20%
less than 25%25% to 34.99%35% to 44.99%45% to 55%greater than 55%
less than 3345 or 6greater than 6
INDUSTRY NAME
42Copyright 2012, Tracy Crawford http://www.raineight.com
INDUSTRY >>
SEGMENTS >>
PRODUCTS >>
Business Strengths Today(2013)
Future(2018)
Today(2013)
Future(2018)
Today(2013)
Future(2018)
Technical Fit
within 1 to 2 years 1within 1 year. 3
5 Score: 5 5 1 5 5 5
in greater than 3 years. 12345 Score: 5 5 3 5 3 5
12345
Score: 4 5 3 5 4 5Average score: 4.667 5 2.333 5 4 5
Weight: 15% 15% 15%Contribution: 0.7 0.75 0.35 0.75 0.6 0.75
Manufacturing Fit
in 1 to 2 years. 135 Score: 5 5 3 5 3 5
12345 Score: 4 4 2 3 4 4
Average Score: 4.5 4.5 2.5 4 3.5 4.5Weight: 15% 15% 15%
Contribution: 0.675 0.675 0.375 0.6 0.525 0.675Quality and Quality Systems
very low quality 12345 Score: 4 5 4 5 4 5
very weak quality systems 12345 Score: 3 4 3 4 3 4
less than 75% of instances.
Company is able to provide technical support that customers perceive as excellent in:
75% to 85% of instances.
TYPICAL PRODUCTS
TYPICAL PRODUCTS
TYPICAL PRODUCTS
INDUSTRY NAME
SEGMENT 1 NAME
SEGMENT 2 NAME
SEGMENT 3 NAME
Company will possess the required core technology:
Company currently possesses.
Company will possess the required core products:
in 2 to 3 years.in 1 to 2 years.within 1 year.Company currently possesses.
85% to 90% of instances.
Company will possess required process technology:
within 1 year.Company currently possesses.
90% to 95% of instances.greater than 95% of instances
Scale-up requires greater than 24 months.Scale-up requires 18 months to 24 months.Scale-up requires 12 months to 18 months.Scale-up requires 6 months to 12 months.Scale-up requires less than 6 months.
Company is able to provide what is perceived as:
low qualityaverage qualityhigh qualityvery high quality
Company maintains what are perceived as:
weak quality systemsaverage quality systemsstrong quality systemsvery strong quality systems

43Copyright 2012, Tracy Crawford http://www.raineight.com
INDUSTRY >>
SEGMENTS >>
PRODUCTS >>
Industry Attractiveness Today(2013)
Future(2018)
Today(2013)
Future(2018)
Today(2013)
Future(2018)
very weak quality systems 12345 Score: 4 4 4 4 4 4Average Score: 3.667 4.333 3.667 4.333 3.667 4.3333
Weight: 15% 15% 15%Contribution: 0.6 0.65 0.6 0.65 0.6 0.65
ProfitabilityOperating margin %
12345 Score: 5 4 4 3 4 4
Weight: 25% 25% 25%Contribution: 1.25 1 1 0.75 1 1
Marketing/Sales Channels Fit12345 Score: 4 5 3 4 4 5
12345 Score: 2 4 2 4 2 4
12345 Score: 3 4 3 4 3 4Average Score: 3 4.333 2.667 4 3 4.3333
Weight: 15% 15% 15%Contribution: 0.45 0.65 0.4 0.6 0.45 0.65
Strategic Fit12345 Score: 4 4 3 3 2 3
Weight: 15% 15% 15%Contribution: 0.6 0.6 0.45 0.45 0.3 0.45
Business Strength Score 4.3 4.3 3.2 3.8 3.5 4.18
TYPICAL PRODUCTS
TYPICAL PRODUCTS
TYPICAL PRODUCTS
SEGMENT 2 NAME
SEGMENT 3 NAME
INDUSTRY NAME
SEGMENT 1 NAME
Company maintains what are perceived as:
weak quality systemsaverage quality systemsstrong quality systemsvery strong quality systems
Less than 5%5% to 10%10% to 15%15% to 20%Greater than 20%
Company has a very poor reputationCompany has a poor reputationCompany has a average reputationCompany has a good reputationCompany has a very good reputation
Sales channel network is very weak.Sales channel network is weak.Sales channel network is average.Sales channel network is strong.Sales channel network is very strong.
Sales support capability very weak.Sales support capability weak.Sales support capability average.Sales support capability strong.Sales support capability very strong.
Current market share is less than 20%.Current market share is 20% to 30%.Current market share is 30% to 40%.Current market share is 40% to 50%.Current market share is greater than 50%.
Business Strengths worksheet continued...
44Copyright 2012, Tracy Crawford http://www.raineight.com
Required Competency/Capability
Test Analytic Method
Segments require certain competencies or capabilities. In this analysis required com-petencies/capabilities are listed and com-pany performance is rated. Method:
1. List required competencies/capabilities2. Competencies/capabilities are rated for
strength as: a. Very Weak Capability (Score: 1) b. Weak Capability (Score: 2) c. Moderate Capability (Score: 3) d. Strong Capability (Score: 4) e. Very Strong Capability (Score: 5)3. Competencies/capabilities are rated for
impact as: a. Very Low Importance in Sustaining or Increasing Profits (Score: 1) b. Low Importance in Sustaining or Increasing Profits (Score: 2) c. Moderate Importance in Sustaining or Increasing Profits (Score: 3) d. High Importance in Sustaining or Increasing Profits (Score: 4) e. Very High Importance in Sustaining or Increasing Profits (Score: 5)4. A key action item is created for each
high-impact capability.
TargetingBased upon the outputs of Segmentation and the GE Matrix, select segments for targeted efforts and assign appropriate
marketing strategies (Invest, Grow, Har-vest, Exit).DifferentiationBased upon the outputs of Differentiable Attributes and Competitor Brand Posi-tions, select the attributes around which the company will differentiate its offers.
For each differentiable attribute selected to be the basis of the company’s differ-entiation, perform a strengths/weakness analysis to create rated drivers.Brand PositioningFrom the list created in the Differentia-tion exercise and by careful comparison to competitor positions select differentiable attributes to become the definition of the company brand position. These attribute are subject to the highest level of attention and become part of the marketing com-munications program.
For each of the differentiable attributes selected define desired performance (us-ing the scales from the Competitor Brand Positioning Analytic Method)
For each attribute where there is a gap (position gaps) between current and de-sired performance, ensure that proper, rated drivers have been adequately cre-ated, or create them.
45Copyright 2012, Tracy Crawford http://www.raineight.com
Strategic Typology At this stage the team should review dif-ferentiable attributes selected during Dif-ferentiation along with position gaps and discuss the appropriate view of the strate-gic typology that may best allow the com-pany to deliver the differentiated offer.
The conclusion of this exercise may be that the company is best served by the core competency strategic typology, the systems of activities strategic typology, something in between or some other de-scription.
The team should ensure that adequate rated drivers have been created to support the summary of the strategic typology – or should now create them.
Strategic ObjectivesAll high rated drivers should at this stage be pooled. It will be observed that these drivers naturally fall into “groups” hav-ing similar themes. By grouping and further consolidating key strategic objec-tives emerge. The themes underlying each grouping are the strategic objectives.
After these strategic objectives are created, the team should adopt a high-level view in order to “reality check” these key strategic objectives to ascertain if key objectives may have been missed.
Marketing Plans/MarCom (Optional)Some teams prefer to include marketing plans as part of their strategic develop-ment exercises. If desired marketing plans by segment or as an overall approach should be documented.
See Appendix 2 for a few marketing plan considerations.
Implementation PlansImplementation of the Strategic Market-ing Plan is critical. Effective implemen-tation of the Strategic Marketing Plan is usually best accomplished when an indi-vidual owns it responsible for business performance in the targeted segments. Usually this will be a person carrying the title of Product Manager, Program Man-ager, Business Manager, Market Manager or the like.
An individual alone cannot implement a Strategic Marketing Plan. It requires the actions and efforts of many people in an organization. As a result all team mem-bers should be thoroughly aware of the details of the plan and their assigned re-sponsibility and accountability for them. Further team members should own the plan and buy in to it. This is best accom-plished when the team has been made responsible to create the plan in the first place.

46Copyright 2012, Tracy Crawford http://www.raineight.com
Finally the plan should be a down to earth, practical set of steps that all team mem-bers agree is critical for the success of the business. Lofty or vague philosophical Strategic Objectives have no place in the plan. A Strategic Objective to “increase market share” is better replaced by “in-crease market share by $10MM before January 30, 2002” backed up with Ac-tion Items like “hire new sales manager for IBM by July 15, 2001” and “make ca-pability presentations to IBM, Motorola, Honeywell etc. by February 15, 2001” The plan should be a hard-nosed business tool central to the running of the business.
The implementation phase consists of:
1. Actions and Assignments2. Timeline and Milestones 3. Resources and Organization
For each Strategic Objective and for each key element of the Marketing Plan, actions are assigned to individuals, a timeline with key milestones is identified and, if required, resources and organizations are adjusted.
Control PlanTo ensure timely completion of implemen-tation, a management review process is put in place with key metrics. The control process also accounts for new data and changing environments and allows for
periodic plan revision and redeployment (perhaps twice annually depending upon business conditions).
The control process should be made up of the following three components:
1. A regular management and team review process
2. Key metrics3. Periodic plan revision and rede-
ployment
See Appendix 1 for a graphical overview of the methodology.

47Copyright 2012, Tracy Crawford http://www.raineight.com
APPENDIX 1 - GRAPHICAL METHODOLOGY OVERVIEW


52Copyright 2012, Tracy Crawford http://www.raineight.com
APPENDIX 2 - MARKETING CONSIDERATIONS
53Copyright 2012, Tracy Crawford http://www.raineight.com
Tracy Crawford has over 25 years of business experience in Engineering, Sales and Marketing including over 15 years in establishing and growing businesses in China, Korea, Japan, Thailand, India, Philippines, Hong Kong, and Australia. He has been employeed by two Fortune 500 companies and has led top firms through global and regional strategy development and execution.
Tracy has been living and working in Shanghai, PR China for seven years.
Contact Tracy: [email protected]