copyright © 2004 by the mcgraw-hill companies, inc. all rights reserved. mcgraw-hill/irwin slide...
TRANSCRIPT

Copyright © 2004 by The McGraw-Hill Companies, Inc. All rights reserved. McGraw-Hill/Irwin
Slide3-1
Chapter ThreeChapter ThreeThe Balance Sheet
and Financial Disclosures
Copyright © 2004 by The McGraw-Hill Companies, Inc. All rights reserved. McGraw-Hill/Irwin
Slide3-2
Balance Sheet
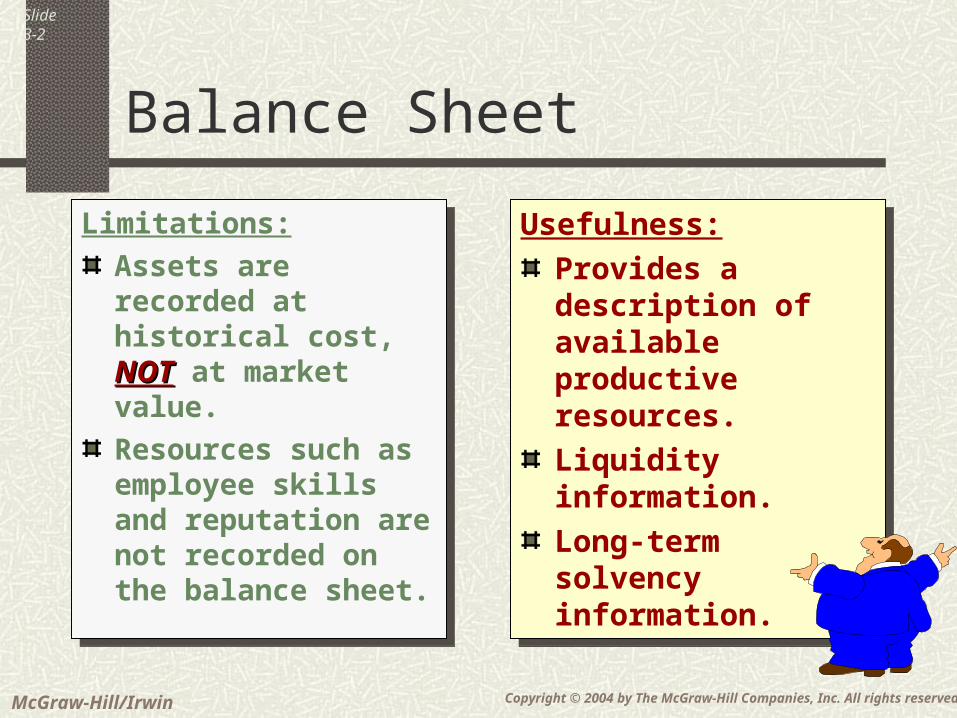
Limitations:
Assets are recorded at historical cost, NOTNOT at market value.
Resources such as employee skills and reputation are not recorded on the balance sheet.
Limitations:
Assets are recorded at historical cost, NOTNOT at market value.
Resources such as employee skills and reputation are not recorded on the balance sheet.
Usefulness:
Provides a description of available productive resources.
Liquidity information.
Long-term solvency information.
Usefulness:
Provides a description of available productive resources.
Liquidity information.
Long-term solvency information.

Copyright © 2004 by The McGraw-Hill Companies, Inc. All rights reserved. McGraw-Hill/Irwin
Slide3-3
Resources (Assets)
Resources (Assets)
Claims against resources (Liabilities)
Claims against resources (Liabilities)
Remaining claims accruing to owners
(Owners’ Equity)
Remaining claims accruing to owners
(Owners’ Equity)
Balance Sheet

Copyright © 2004 by The McGraw-Hill Companies, Inc. All rights reserved. McGraw-Hill/Irwin
Slide3-4
2001 2000Assets:Current assets: Cash and cash equivalents 121,302$ 67,959$ Receivables, less allowances 2,506,044 2,547,043 Spare parts, supplies, and fuel 269,269 255,291 Deferred income taxes 435,406 317,784 Prepaid expenses and other 117,040 96,667 Total current assets 3,449,061$ 3,284,744$ Property and equipment, at cost: Flight equipment 5,312,853$ 4,960,204$ Package handling & ground support equipment and vehicles 4,620,894 4,203,927 Computer & electronic equipment 2,637,350 2,416,666 Other 3,840,899 3,161,746
16,411,996 14,742,543 Less accumulated depreciation 8,311,941 7,659,016 Net property and equipment 8,100,055 7,083,527 Other assets: Goodwill 1,082,223 500,547 Equipment deposits and other assets 708,673 658,293 Total Assets 13,340,012 11,527,111
FedEx CorporationBalance Sheet
31-May
Assets are probable
future economic benefits
obtained or controlled by a particular entity as a
result of past transactions or events.
Assets are probable
future economic benefits
obtained or controlled by a particular entity as a
result of past transactions or events.

Copyright © 2004 by The McGraw-Hill Companies, Inc. All rights reserved. McGraw-Hill/Irwin
Slide3-5
AssetsCashCash
ReceivablesReceivablesInventoriesInventories
PrepaymentsPrepayments
CashCashReceivablesReceivablesInventoriesInventories
PrepaymentsPrepayments
Will be converted Will be converted to cash or to cash or
consumed within consumed within one year or the one year or the operating cycle, operating cycle,
whichever is whichever is longer.longer.
Will be converted Will be converted to cash or to cash or
consumed within consumed within one year or the one year or the operating cycle, operating cycle,
whichever is whichever is longer.longer.
Current Current AssetsAssets
Current Current AssetsAssets
Copyright © 2004 by The McGraw-Hill Companies, Inc. All rights reserved. McGraw-Hill/Irwin
Slide3-6
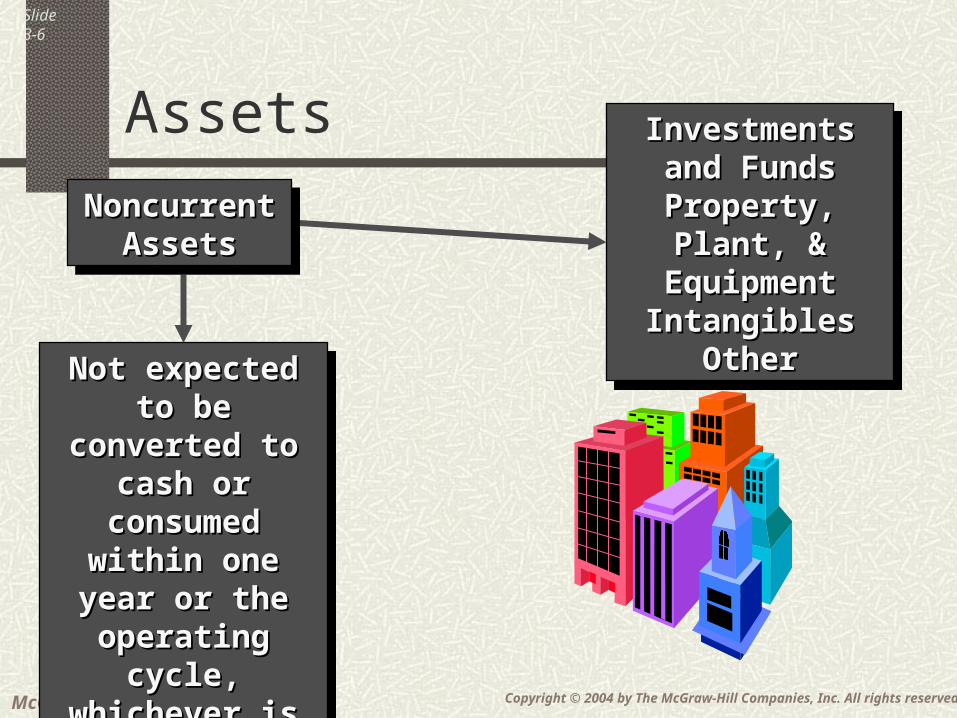
Assets Investments and Investments and FundsFunds
Property, Plant, & Property, Plant, & EquipmentEquipmentIntangiblesIntangibles
OtherOther
Investments and Investments and FundsFunds
Property, Plant, & Property, Plant, & EquipmentEquipmentIntangiblesIntangibles
OtherOther
Not expected to Not expected to be converted to be converted to
cash or cash or consumed within consumed within one year or the one year or the operating cycle, operating cycle,
whichever is whichever is longerlonger
Not expected to Not expected to be converted to be converted to
cash or cash or consumed within consumed within one year or the one year or the operating cycle, operating cycle,
whichever is whichever is longerlonger
Noncurrent Noncurrent AssetsAssets
Noncurrent Noncurrent AssetsAssets

Copyright © 2004 by The McGraw-Hill Companies, Inc. All rights reserved. McGraw-Hill/Irwin
Slide3-7
2001 2000Liabilities:Current liabilities: Current portion of long-term debt 221,392$ 6,537$ Accrued salaries & employee benefits 699,906 755,747 Accounts payable 1,255,298 1,120,855 Accrued expenses 1,072,920 1,007,887 Total current liabilities 3,249,516 2,891,026 Long-term debt, less current portion 1,900,119 1,776,253 Deferred income taxes 455,591 344,613 Other liabilities 1,834,366 1,729,976 Total liabilities 7,439,592 6,741,868
FedEx CorporationBalance Sheet
31-May
Liabilities are probable future sacrifices of economic benefits arising from present obligations of a particular
entity to transfer assets or provide services to other entities as a result of past transactions or events.
Liabilities are probable future sacrifices of economic benefits arising from present obligations of a particular
entity to transfer assets or provide services to other entities as a result of past transactions or events.
Copyright © 2004 by The McGraw-Hill Companies, Inc. All rights reserved. McGraw-Hill/Irwin
Slide3-8
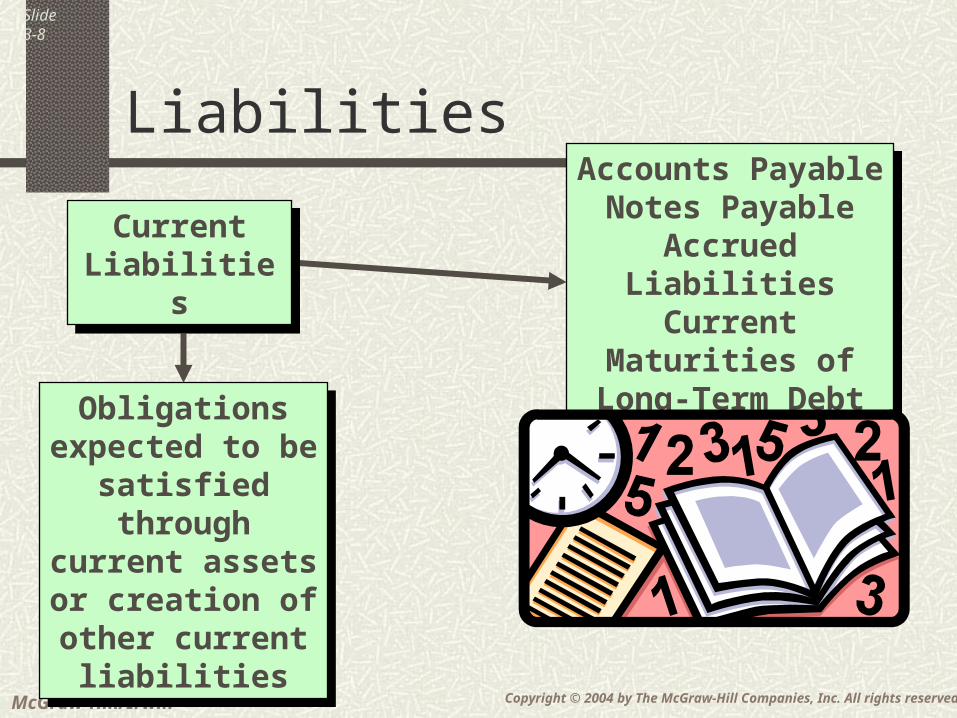
LiabilitiesAccounts Payable
Notes PayableAccrued LiabilitiesCurrent Maturities of Long-Term Debt
Accounts PayableNotes Payable
Accrued LiabilitiesCurrent Maturities of Long-Term Debt
Obligations expected to be
satisfied through current assets or creation of other current liabilities
Obligations expected to be
satisfied through current assets or creation of other current liabilities
Current Liabilities
Current Liabilities

Copyright © 2004 by The McGraw-Hill Companies, Inc. All rights reserved. McGraw-Hill/Irwin
Slide3-9
LiabilitiesCapital LeasesBonds Payable
Long-Term Notes Payable
Pension Liabilities
Capital LeasesBonds Payable
Long-Term Notes Payable
Pension Liabilities
Obligations that will not be
satisfied within one year or
operating cycle, whichever is
longer
Obligations that will not be
satisfied within one year or
operating cycle, whichever is
longer
Long-Term Liabilities
Long-Term Liabilities

Copyright © 2004 by The McGraw-Hill Companies, Inc. All rights reserved. McGraw-Hill/Irwin
Slide3-10
2001 2000Common Stockholders' Investment:Common Stock, $.10 par value, 800,000,000 share authorized, 298,573,387 shares issued 29,857$ 29,857$ Additional paid-in capital 1,120,627 1,079,462 Retained earnings 4,879,647 4,295,041 Accumulated other comprehensive income (55,833) (36,074)
5,974,298 5,368,286 Less treasury stock at cost, and deferred compensation 73,878 583,043 Total shareholders' equity 5,900,420 4,785,243 Total liabilities and shareholders' equity 13,340,012 11,527,111
FedEx CorporationBalance Sheet
31-May
Equity is the residual interest in the assets of an entity that remains after its liabilities are deducted. Equity is the residual interest in the assets of an
entity that remains after its liabilities are deducted.

Copyright © 2004 by The McGraw-Hill Companies, Inc. All rights reserved. McGraw-Hill/Irwin
Slide3-11
Shareholders’ Equity
Capital Stock
Capital Stock
Retained Earnings
Retained Earnings
Treasury Stock
Treasury Stock
Other Contributed
Capital
Other Contributed
Capital
Accumulated Other Comprehensive IncomeAccumulated Other Comprehensive Income

Copyright © 2004 by The McGraw-Hill Companies, Inc. All rights reserved. McGraw-Hill/Irwin
Slide3-12
Now, let’s Now, let’s move on to move on to a new topic.a new topic.

Copyright © 2004 by The McGraw-Hill Companies, Inc. All rights reserved. McGraw-Hill/Irwin
Slide3-13
Disclosure Notes
Summary of Significant Accounting Policies
Subsequent Events
Noteworthy Events and Transactions
Copyright © 2004 by The McGraw-Hill Companies, Inc. All rights reserved. McGraw-Hill/Irwin
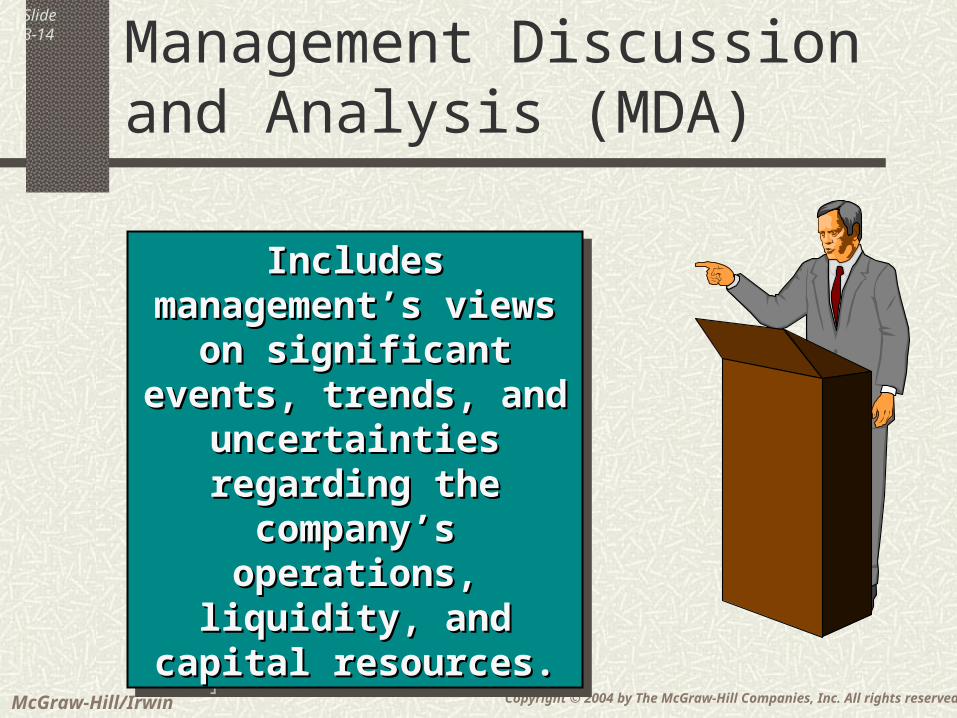
Slide3-14 Management Discussion and
Analysis (MDA)
Includes management’s Includes management’s views on significant views on significant events, trends, and events, trends, and
uncertainties regarding uncertainties regarding the company’s the company’s
operations, liquidity, operations, liquidity, and capital resources.and capital resources.
Includes management’s Includes management’s views on significant views on significant events, trends, and events, trends, and
uncertainties regarding uncertainties regarding the company’s the company’s
operations, liquidity, operations, liquidity, and capital resources.and capital resources.

Copyright © 2004 by The McGraw-Hill Companies, Inc. All rights reserved. McGraw-Hill/Irwin
Slide3-15
Management’s Responsibilities
Preparing the financial statements.
Preparing other information in the annual report.
Maintaining the system of internal control.

Copyright © 2004 by The McGraw-Hill Companies, Inc. All rights reserved. McGraw-Hill/Irwin
Slide3-16
Auditors’ Report
Expresses the auditors’ opinion as to the fairness of presentation of the financial statements.
The auditor can render one of four opinions: Unqualified. Qualified. Adverse. Disclaimer.
Copyright © 2004 by The McGraw-Hill Companies, Inc. All rights reserved. McGraw-Hill/Irwin
Slide3-17
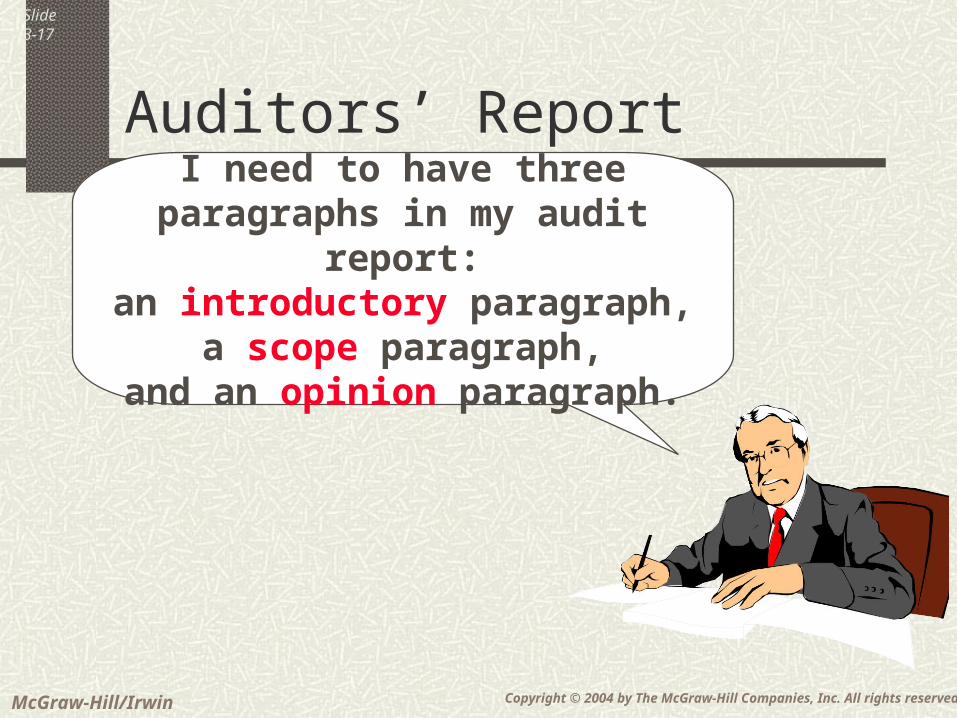
I need to have three paragraphs in my audit report:
an introductory paragraph,a scope paragraph,
and an opinion paragraph.
Auditors’ Report
Copyright © 2004 by The McGraw-Hill Companies, Inc. All rights reserved. McGraw-Hill/Irwin
Slide3-18 Compensation of Directors &
Top Executives
Proxy Statement Information
Summary compensation table
Table of options granted
Table of options holdings

Copyright © 2004 by The McGraw-Hill Companies, Inc. All rights reserved. McGraw-Hill/Irwin
Slide3-19
Now, let’s look at some ratios!

Copyright © 2004 by The McGraw-Hill Companies, Inc. All rights reserved. McGraw-Hill/Irwin
Slide3-20
Liquidity Ratios
=Current ratioCurrent assets
Current liabilities
Measures a company’s ability to satisfy its short-term liabilities
=Acid-test ratioQuick assets
Current liabilities
Provides a more stringent indication of a company’s ability to pay its current
liabilities

Copyright © 2004 by The McGraw-Hill Companies, Inc. All rights reserved. McGraw-Hill/Irwin
Slide3-21
Liquidity Ratios
=1.06$3,449,061
$3,249,516
Current ratio
=.81$2,627,346
$3,249,516
Acid-test ratio

Copyright © 2004 by The McGraw-Hill Companies, Inc. All rights reserved. McGraw-Hill/Irwin
Slide3-22
Financing Ratios
=Debt to equity ratio
Total liabilities
Shareholders’ equity
Indicates the extent of reliance on creditors, rather than owners, in providing
resources
=Times interest earned ratio
Net income + Interest expense + Taxes
Interest expense
Indicates the margin of safety provided to creditors
Copyright © 2004 by The McGraw-Hill Companies, Inc. All rights reserved. McGraw-Hill/Irwin
Slide3-23
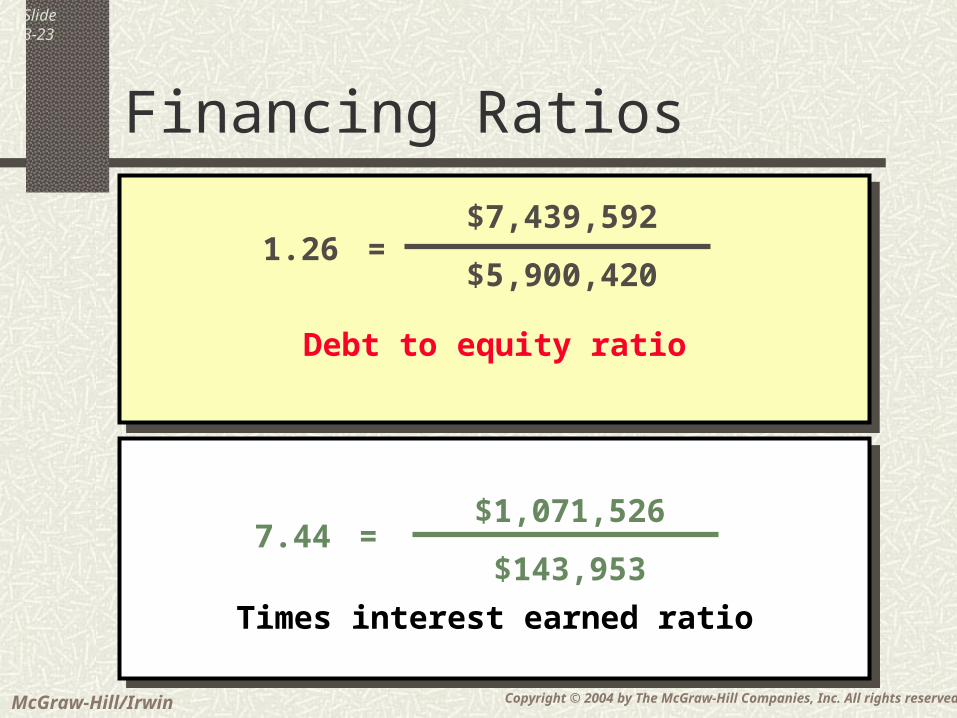
Financing Ratios
=1.26$7,439,592
$5,900,420
Debt to equity ratio
=7.44$1,071,526
$143,953
Times interest earned ratio

Copyright © 2004 by The McGraw-Hill Companies, Inc. All rights reserved. McGraw-Hill/Irwin
Slide3-24
End of Chapter 3