copyright 2003 prentice hall publishing1 acquisitions/payment: inventory and liabilities chapter 6
TRANSCRIPT

Copyright 2003 Prentice Hall Publishing
1
Acquisitions/Payment: Acquisitions/Payment: Inventory and LiabilitiesInventory and Liabilities
Chapter 6Chapter 6

Copyright 2003 Prentice Hall Publishing
2
Questions we will answer Questions we will answer in this chapterin this chapter
How does a firm account for inventory? How are financial statements affected by the
purchase of merchandise inventory? What kinds of liabilities result from the
acquisition of inventory and other resources? How does a firm account for payroll?

Copyright 2003 Prentice Hall Publishing
3
Inventory is recorded at the price paid for it.
Inventory CostInventory Cost

Copyright 2003 Prentice Hall Publishing
4
The amount recorded for inventory should include: Invoice price, freight charges, inspection
costs, and preparation costs.
Inventory may be tracked with either a periodic or a perpetual inventory system.
Inventory CostInventory Cost

Copyright 2003 Prentice Hall Publishing
5
Beginning inventory
Add: Purchases (net)
Goods available for sale
Deduct: Ending inventory
Cost of goods soldCost of goods sold
Cost of Goods SoldCost of Goods Sold

Copyright 2003 Prentice Hall Publishing
6
InventoryInventory Inventory is tangible property that is held
for resale or will be used in producing goods or services.
Inventory is reported on the balance sheet as a current asset.
Types of inventory: Merchandise inventory Raw materials inventory These 3 will Work in process inventory be studied Finished goods inventory in managerial
accounting.

Copyright 2003 Prentice Hall Publishing
7
Shipping TermsShipping Terms(Sales & Purchases)(Sales & Purchases)
F.O.B. shipping point or destination tells who pays shipping
F.O.B shipping indicates that the title to the goods changes hands at shipping.
F.O.B. destination indicates that the title to the goods changes hands at destination.

Copyright 2003 Prentice Hall Publishing
8
Whoever owns the goods while they are in-transit pays for the shipping.
Shipping costs to get the inventory IN are included as part of the cost of the inventory.
Shipping costs for a sale are part of operating expenses.
Shipping CostsShipping Costs

Copyright 2003 Prentice Hall Publishing
9
Alternative Inventory Alternative Inventory Cost FlowCost Flow Methods Methods
FIFOFIFO LIFOLIFO
WeightedWeightedAverageAverage
SpecificSpecificIdentification
Identification

Copyright 2003 Prentice Hall Publishing
10
Inventory Cost Flow MethodsInventory Cost Flow Methods
These four inventory costing methods are used to assign the total dollar amount of goods available for sale between ending inventory and cost of goods sold.
Endinginventoryor CGS??

Copyright 2003 Prentice Hall Publishing
11
The cost of the oldest inventory items are charged to cost of goods sold when goods are sold.
The cost of the newest inventory items remain in ending inventory.
The actual physical flow of inventory items may differ from the FIFO cost flow assumptions.
First-In, First-OutFirst-In, First-Out

Copyright 2003 Prentice Hall Publishing
12
The cost of the newest inventory items are charged to cost of goods sold when goods are sold.
The cost of the oldest inventory items remain in ending inventory.
The actual physical flow of inventory items may differ from the LIFO cost flow assumptions.
Last-In, First-OutLast-In, First-Out
Copyright 2003 Prentice Hall Publishing
13
Weighted-AverageWeighted-Average
Take the average cost of all goods available for sale to value both CGS and Ending Inventory.
BE SURE IT’S WEIGHTED!

Copyright 2003 Prentice Hall Publishing
14
SpecificSpecific IdentificationIdentification
Specific cost of each inventory item is known.
Used with small volume, high dollar inventory.

Copyright 2003 Prentice Hall Publishing
15
ExampleExample
Date Event Units Price Total
3/1 Beg. Inv. 10 $ 6 $ 60
3/10 Purchase 12 7 84
3/15 Purchase 11 8 88
3/27 Sale 18 15 270

Copyright 2003 Prentice Hall Publishing
16
FIFOFIFO Cost of Goods Sold:
From Units Price Cost
Ending Inventory:From Units Price Cost

Copyright 2003 Prentice Hall Publishing
17
Cost of Goods Sold:
From Units Price Cost
3/1 10 $ 6 $ 60
3/10 8 7 56
Totals 18$116 Ending Inventory:From Units Price Cost
3/10 4 $ 7 $ 28
3/15 11 8 88
Totals 15 $116
FIFOFIFO

Copyright 2003 Prentice Hall Publishing
18
Cost of Goods Sold:
From Units Price Cost
Ending Inventory:
From Units Price Cost
LIFOLIFO

Copyright 2003 Prentice Hall Publishing
19
Cost of Goods Sold:
From Units Price Cost
3/15 11 $ 8 $ 88
3/10 7 7 49
Totals 18 $137 Ending Inventory:
From Units Price Cost
3/10 5 $ 7 $ 35
3/1 10 6 60
Totals 15 $ 95
LIFOLIFO

Copyright 2003 Prentice Hall Publishing
20
Average cost per unit:
Cost of GAFS
# of units GAFS
Weighted AverageWeighted Average

Copyright 2003 Prentice Hall Publishing
21
Average cost per unit:
Cost of GAFS $ 232
# of units GAFS 33
Cost of Goods Sold:
Ending Inventory:
= $7.03= $7.03
Weighted AverageWeighted Average
Copyright 2003 Prentice Hall Publishing
22
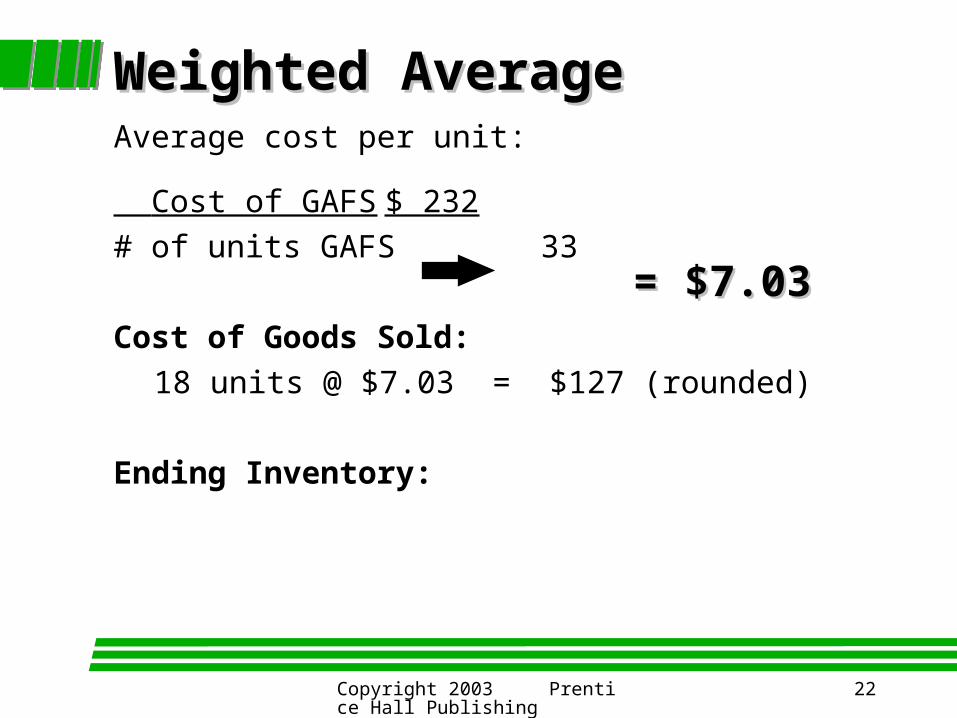
Average cost per unit:
Cost of GAFS $ 232
# of units GAFS 33
Cost of Goods Sold:
18 units @ $7.03 = $127 (rounded)
Ending Inventory:
= $7.03= $7.03
Weighted AverageWeighted Average

Copyright 2003 Prentice Hall Publishing
23
Average cost per unit:
Cost of GAFS $ 232
# of units GAFS 33
Cost of Goods Sold:
18 units @ $7.03 = $127 (rounded)
Ending Inventory:
15 units @ $7.03 = $105 (rounded)
= $7.03= $7.03
Weighted AverageWeighted Average

Copyright 2003 Prentice Hall Publishing
24
IncomeIncome Statements Statements
FIFOFIFO LIFOLIFO Wt. Wt. Avg.Avg.
SalesSales
CGSCGS
GMGM
Oper. exp.Oper. exp.
Pretax inc.Pretax inc.
Taxes (40%)Taxes (40%)
Net IncomeNet Income
[Given operating expenses of $50 and a 40% tax rate][Given operating expenses of $50 and a 40% tax rate]

Copyright 2003 Prentice Hall Publishing
25
FIFO LIFO Wt. Avg.
Sales $270 $270 $ 270
CGS 116 137 127
GM 154 133 143
Oper. exp. 50 50 50
Pretax inc. 104 83 93
Taxes (40%) 42 33 37
Net Income $ 62 $ 50 $ 56
Income StatementsIncome Statements[Given operating expenses of $50 and a 40% tax rate][Given operating expenses of $50 and a 40% tax rate]

Copyright 2003 Prentice Hall Publishing
26
FIFO LIFO Wt. Avg.
Inflows:
Sales $270 $270 $270
Outflows:
Purchases 172 172 172
Oper. exp. 50 50 50
Taxes (40%) 42 33 37
Net cash flow $ 6 $ 15 $ 11
Cash Flow from OperationsCash Flow from Operations

Copyright 2003 Prentice Hall Publishing
27
Summary: Summary: Effects of Cost Flow AssumptionsEffects of Cost Flow Assumptions
Effects on financial statements cost of goods sold & gross profit taxes net earnings inventory
Effects on cash flows cash flows are affected only because of
taxes

Copyright 2003 Prentice Hall Publishing
28
Comparison of MethodsComparison of Methods Each of the four methods is acceptable,
and an argument can be made for using each.
The choice of an inventory method will depend on management’s incentives, the tax laws, and the reporting company’s particular economic circumstances.
Copyright 2003 Prentice Hall Publishing
29
ConsistencyConsistency PrinciplePrinciple
Because the choice of an inventory method can significantly affect the financial statements, a company might be inclined to select a new method each year that would result in the most favorable financial statements. However . . .

Copyright 2003 Prentice Hall Publishing
30
. . . the consistency principleconsistency principle requires that companies use the same accounting methods period after period so the financial statements of succeeding periods will be comparablecomparable.
Consistency PrincipleConsistency Principle

Copyright 2003 Prentice Hall Publishing
31
Alternative Inventory Costing Alternative Inventory Costing Methods in PracticeMethods in Practice
The LIFO conformity rule states that if LIFO is used for taxes, then LIFO must also be used for financial reporting.
LIFO for books
LIFO for taxes

Copyright 2003 Prentice Hall Publishing
32
2/10, n/30 (for example) 2% discount if invoice paid in ten days tells when and how much must be paid high interest cost of not taking purchase
discounts
Terms of Sale and PurchasesTerms of Sale and Purchases

Copyright 2003 Prentice Hall Publishing
Revenues
Expenses
Net Income
Sales
Cost of Goods Sold
Gross marginOperating Expenses
Income before taxes
Income Taxes
Net income
Multistep Income Statement
Income StatementsIncome Statements

Copyright 2003 Prentice Hall Publishing
Cost of goods sold is calculated as the number of units sold during the period multiplied by their unit costs.
Cost of goods sold is a major expense item for most nonservice businesses.
The measurement of cost of goods sold is an excellent example of the application of the matching principle.
Costs of Goods SoldCosts of Goods Sold

Copyright 2003 Prentice Hall Publishing
The inventory account is continuously updated for the following items: Purchases Returns & Allowances Sales
Detailed record-keeping has become much easier with current technology.
A physical count of the inventory is still required at the end of the accounting period to assure accurate inventory records in case of errors or theft.
Perpetual Inventory SystemsPerpetual Inventory Systems

Copyright 2003 Prentice Hall Publishing
The ending inventory is determined at the end of the period by taking a physical count of the goods remaining on hand.
Cost of goods sold is calculated at the end of the accounting period using the ending inventory count.
Periodic Inventory SystemsPeriodic Inventory Systems

Copyright 2003 Prentice Hall Publishing
Because entries are not made to the inventory account during the accounting period, the amount of inventory is not known until the end of the period, when the inventory count is done.
This system is being used less and less due to advancements in technology.
Periodic Inventory SystemsPeriodic Inventory Systems

Copyright 2003 Prentice Hall Publishing
The accounting system plays three roles in inventory management:
Provides accurate information for financial statements and tax reports.
Provides up-to-date information on inventory quantities and cost.
Provides information necessary to protect inventory from theft and misuse.
Accounting and Inventory Accounting and Inventory ManagementManagement

Copyright 2003 Prentice Hall Publishing
Inventory Turnover
Cost of Goods Sold = Average Inventory
Inventory Turnover
This ratio is often used to This ratio is often used to measure the liquidity (nearness measure the liquidity (nearness
to cash) of the inventory.to cash) of the inventory.
Financial Statement AnalysisFinancial Statement Analysis

Copyright 2003 Prentice Hall Publishing
Provides an estimate Not acceptable for GAAP When to use
for interim reporting purposes when physical inventory not possible
Gross Profit Method of Gross Profit Method of Estimating InventoryEstimating Inventory

Copyright 2003 Prentice Hall Publishing
Given the following:
Beginning Inventory $ 1,000 (cost)
Purchases 9,000 (cost)
Sales 12,000 (retail)
Historically, gross margin has been 40% of sales. Estimate the cost of inventory and CGS for the period.
ExampleExample

Copyright 2003 Prentice Hall Publishing
First estimate cost of goods sold:
Sales have been $12,000,
and the gross margin
has been 40%. If the gross
margin is $4,800 (40% of $12,000),
then the cost of goods sold
must be the remainder, $7,200.

Copyright 2003 Prentice Hall Publishing
Next estimate ending inventory:
Goods avail. (1,000 + 9,000)
- Cost of goods sold
Ending inventory
$10,000 minus $7,200 =
$2,800

Copyright 2003 Prentice Hall Publishing
First estimate cost of goods sold:
Sales 12,000
x CGS % (1.0 - GM %) 60%
Estimated CGS 7,200
Next estimate ending inventory:
Goods avail. (1,000 + 9,000) 10,000
- Cost of goods sold 7,200
Estimated ending inventory 2,800
RecapRecap

Copyright 2003 Prentice Hall Publishing
Ending inventory is reported at the lower of cost or market (LCM).
Market refers to the replacement cost of the merchandise.
This practice is in keeping with the generally accepted accounting principle of conservatism.
Lower of Cost or MarketLower of Cost or Market
Copyright 2003 Prentice Hall Publishing
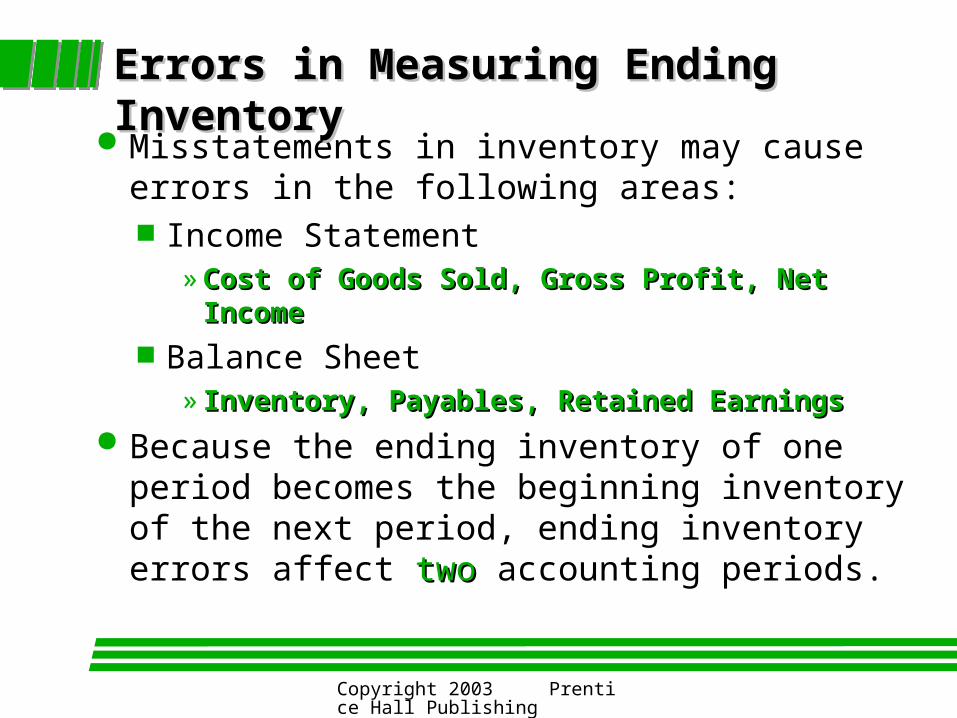
Misstatements in inventory may cause errors in the following areas: Income Statement
» Cost of Goods Sold, Gross Profit, Net IncomeCost of Goods Sold, Gross Profit, Net Income Balance Sheet
» Inventory, Payables, Retained EarningsInventory, Payables, Retained Earnings
Because the ending inventory of one period becomes the beginning inventory of the next period, ending inventory errors affect two two accounting periods.
Errors in Measuring Ending InventoryErrors in Measuring Ending Inventory

Copyright 2003 Prentice Hall Publishing
Inventory ErrorsInventory Errors
The ending inventory for CBCR Co. was overstated by $2000 for the year 2002. What effect did the error have on Beginning inventory 2002: Purchases in 2002: Goods available for sale in 2002: Cost of Goods Sold in 2002: Gross margin in 2002: Net income in 2002:
Copyright 2003 Prentice Hall Publishing
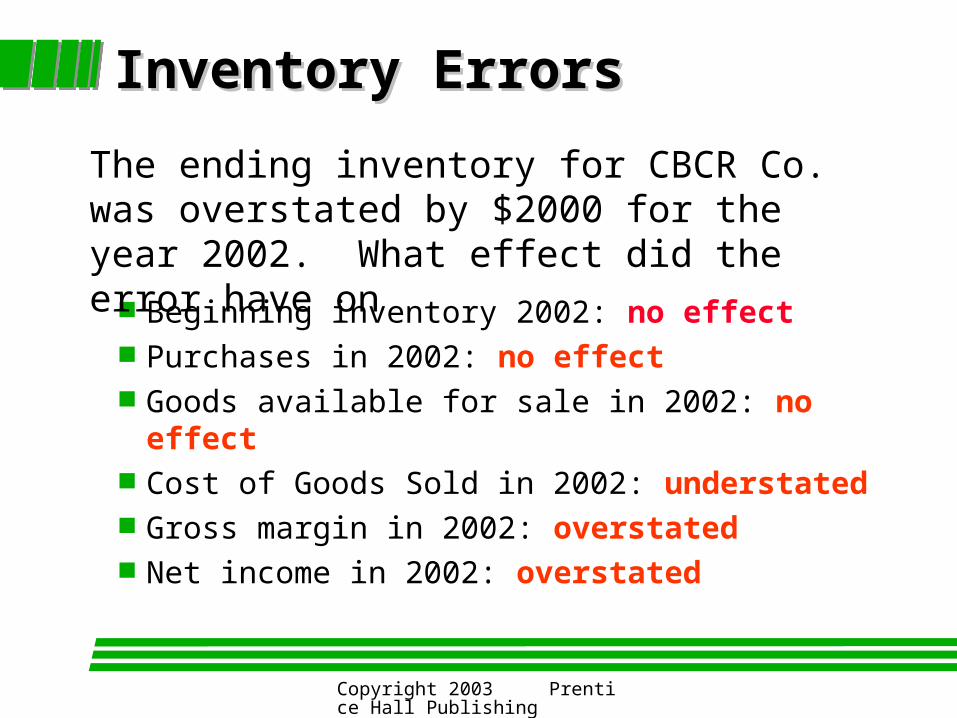
Inventory ErrorsInventory Errors
Beginning inventory 2002: no effect Purchases in 2002: no effect Goods available for sale in 2002: no effect Cost of Goods Sold in 2002: understated Gross margin in 2002: overstated Net income in 2002: overstated
The ending inventory for CBCR Co. was overstated by $2000 for the year 2002. What effect did the error have on

Copyright 2003 Prentice Hall Publishing
Beginning inventory 2003: Purchases for 2003: Goods available for sale in 2003: Cost of Goods Sold for 2003: Gross margin for 2003: Net income for 2003:
The Next YearThe Next Year

Copyright 2003 Prentice Hall Publishing
Beginning inventory 2003: overstated Purchases for 2003: no effect Goods available for sale in 2003: overstated Cost of Goods Sold for 2003: overstated Gross margin for 2003: understated Net income for 2003: understated
The Next YearThe Next Year
Copyright 2003 Prentice Hall Publishing
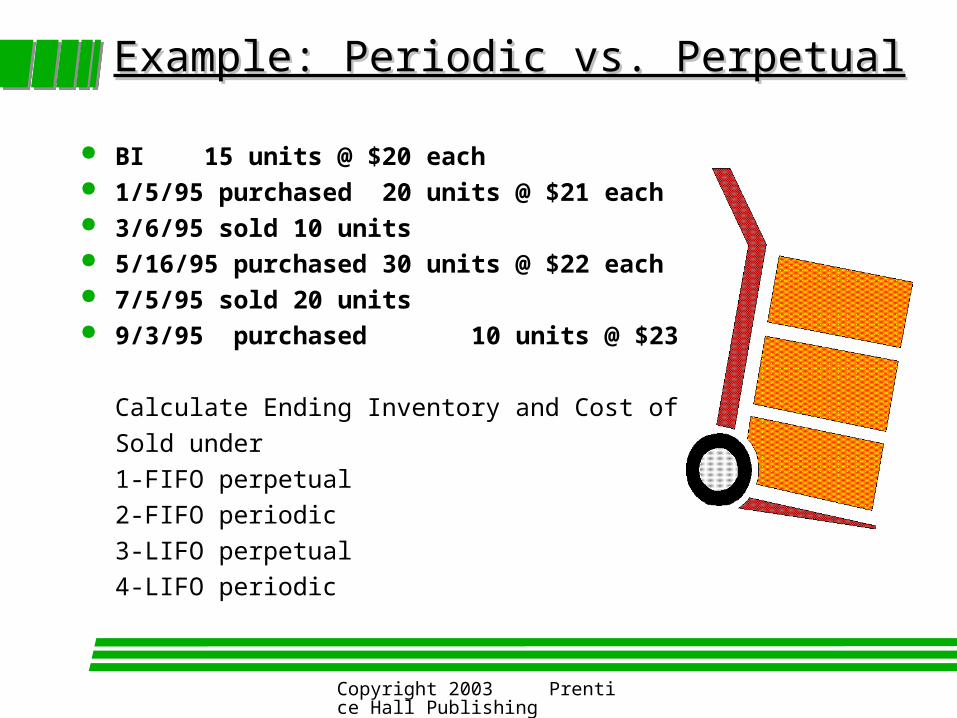
Example: Periodic vs. PerpetualExample: Periodic vs. Perpetual
BI 15 units @ $20 each 1/5/95 purchased 20 units @ $21 each 3/6/95 sold 10 units 5/16/95 purchased 30 units @ $22 each 7/5/95 sold 20 units 9/3/95 purchased 10 units @ $23 each
Calculate Ending Inventory and Cost of Goods
Sold under
1-FIFO perpetual
2-FIFO periodic
3-LIFO perpetual
4-LIFO periodic

Copyright 2003 Prentice Hall Publishing
Goods Available for SaleGoods Available for Sale
15 @ $20 = $300 20 @ $21 = $420 30 @ $22 = $660 10 @ $23 = $230
$1610
FORFOR
SALESALE

Copyright 2003 Prentice Hall Publishing
FIFO--PerpetualFIFO--Perpetual
Sale on 3/6 of 10 units comes from BI @ $20 each Sale on 7/5 of 20 units comes from BI (5 units @
$20) and from 1/5 purchase (15 units @ $21) Total CGS = $200 + $100 + $315 = $615 Ending Inv. = 1/5/95 5 @ $21 = 105
5/16/95 30 @ $22 = 660 $995
9/3/95 10 @ $23 = 230

Copyright 2003 Prentice Hall Publishing
FIFO--PeriodicFIFO--Periodic
Total sales of 30 units Start with the oldest for CGS:
15 units from BI = $300
15 units from 1/5/95 purchase = $315
Total CGS = $615
Ending Inv. = 1/5/95 5 @ $21 = 105
5/16/95 30 @ $22 = 660 $995
9/3/95 10 @ $23 = 230
Copyright 2003 Prentice Hall Publishing
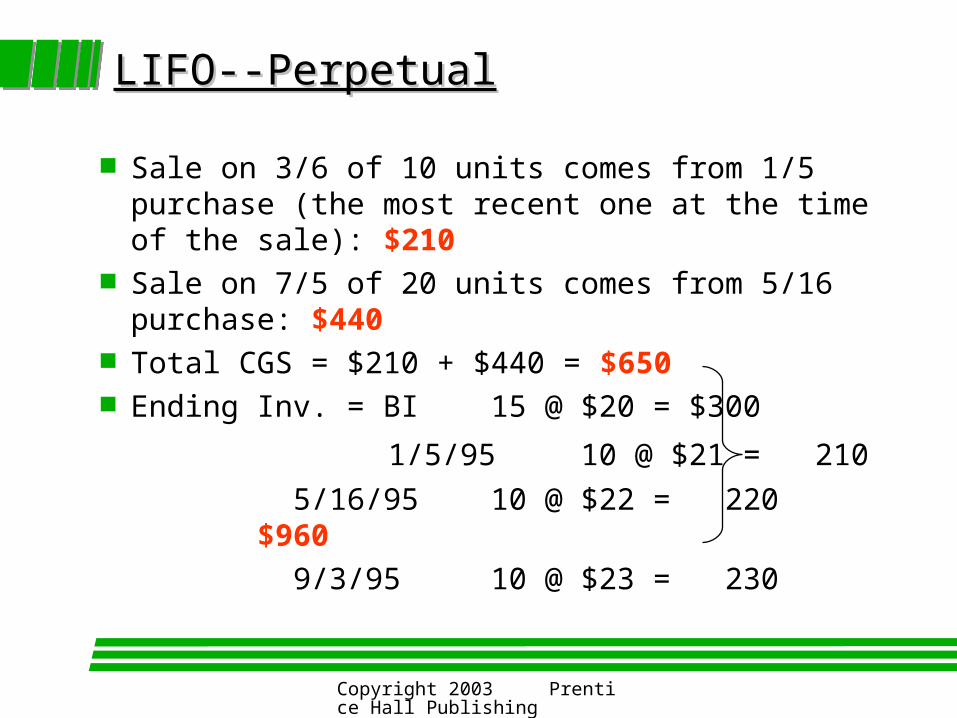
LIFO--PerpetualLIFO--Perpetual
Sale on 3/6 of 10 units comes from 1/5 purchase (the most recent one at the time of the sale): $210
Sale on 7/5 of 20 units comes from 5/16 purchase: $440
Total CGS = $210 + $440 = $650 Ending Inv. = BI 15 @ $20 = $300
1/5/95 10 @ $21 = 210
5/16/95 10 @ $22 = 220 $960
9/3/95 10 @ $23 = 230

Copyright 2003 Prentice Hall Publishing
LIFO--PeriodicLIFO--Periodic Total sales of 30 units
Start with the latest purchases for CGS:
10 units from 9/3/95 purchase = $230
20 units from 5/16/95 purchase = $440
Total CGS = $670
Ending Inv. =BI 15 @ $20 = $300
1/5/95 20 @ $21 = $420
5/16/95 10 @ $22 =$220
$940

Gross margin %:
gross margin as a percent of sales
Net sales - CGS (=gross margin)
Net sales
Ratios: Gross Margin PercentageRatios: Gross Margin Percentage

Return on sales =
Net income
Net sales
Revenues - expenses
Net sales
Ratios: Return on SalesRatios: Return on Sales

Net Income Assets
Return on Assets =
Ratios: Return on AssetsRatios: Return on Assets