copyright 1999- a. s. cebenoyan1 money, banking, and financial markets professor a. sinan cebenoyan...
TRANSCRIPT

Copyright 1999- A. S. Cebenoyan 1
Money, Banking, and Financial Markets
Professor A. Sinan Cebenoyan
Stern School of Business - NYU
Set 2

Copyright 1999- A. S. Cebenoyan 2
Interest Rate RiskThe Repricing Model
• Also called the funding gap model.
• A book value accounting cash flow analysis of the repricing gap between the interest revenue earned on an FI’s assets and the interest paid on its liabilities over some particular period.
• Repricing Gap:The difference between those assets whose interest rates will be repriced or changed over some future period (Rate sensitive assets) and liabilities whose interest rates will be repriced or changed over some future period (Rate sensitive liabilities).

Copyright 1999- A. S. Cebenoyan 3
Assets Liabilities Gaps
______________________________________________
1 day $20 $30 $-10
1day-3mos 30 40 -10
3mos-6mos 70 85 -15
6mos-12mos 90 70 +20
1yr-5yrs 40 30 +10
over 5yrs 10 5 +5
_______ ____________
$260 $260 0
The above breakdown in maturities has been required by the Fed from all banks in the form of repricing gaps.

Copyright 1999- A. S. Cebenoyan 4
• Bank calculates the gaps in each bucket, by looking at rate sensitivity of each asset and liability (time to repricing).
NIIi = (GAPi) Ri = (RSAi - RSLi ) Ri
• The above applies to any i bucket.
• This can also be extended to incorporate cumulative gaps
• Look at cumulative gap for the one-year repricing gap
CGAP= -10 + -10 + -15 + 20 = -$15
If the interest rates that apply to this bucket rise by 1 percent
NII 1-yr = (-$15million)(.01) = -$150,000

Copyright 1999- A. S. Cebenoyan 5
Assets Liabilities
_________________________________________________
ST consumer loans $50 Equity Capital $20
(1-yr mat.)
LT consumer loans 25 Demand deposits 40
(2-yr mat.)
3 mos. T-bills 30 Passbook svngs 30
6 mos T notes 35 3 mos CDs 40
3yr T bonds 70 3 mos BA’s 20
10yr,fixed-rt mtgs 20 6 mos Comm.P. 60
30yr floating-rt mtgs 40 1yr Time deps 20
(rate adj. Every 9mos) 2yr time deps 40
-------- ------
$270 $270

Copyright 1999- A. S. Cebenoyan 6
• Rate Sensitive Assets----One year– ST consumer loans $50
– 3 month T-bills 30
– 6 month T-notes 35
– 30 year floating mtgs 40
$155
• Rate sensitive Liabilities----One year– 3 month CDs $40
– 3 month BA’s 20
– 6 month Comm. Paper 60
– 1 year Time deps. 20
$140
• CGAP =RSA - RSL = 155-140 =$15 million
• If the rates rise by 1 percent >>>NII=15(.01)=$150,000

Copyright 1999- A. S. Cebenoyan 7
• Arguments against inclusion of DD:
– explicit interest rate on DD is zero
– transaction accounts (NOW), rates sticky
– Many DD are core deps, meaning longterm
• Arguments for inclusion of DD:
– implicit interest rates (not charging fully for checks)
– if rates rise, deposits are drawn down, forcing bank to replace them with higher-yield rate-sensitive funds
• Similar arguments for passbook savings accounts
• Gap Ratio = (CGAP / A) = 15/270 = .056 = 5.6%
– Tells us the direction of interest rate exposure (+ or -)
– the scale of the exposure

Copyright 1999- A. S. Cebenoyan 8
•Weaknesses of The Repricing Model•Market Value effects (true exposure not captured)•Overaggregation (mismatches within buckets) liabilities may be repriced at different times than assets in the same bucket.•Runoffs : are periodic cash flows of interest and principal amortization payments on long-term assets such as conventional mortgages that can be reinvested at market rates. Assets Runoffs Liabilities Runoffs
_________________<1yr >1 yr______________________<1yr____>1yr______ST consumer loans $50 Equity Capital $20LT consumer loans 5 20 Demand deposits 30 103 mos. T-bills 30 Passbook svngs 15 156 mos T notes 35 3 mos CDs 403yr T bonds 10 60 3 mos BA’s 2010yr,fixed-rt mtgs 2 18 6 mos Comm.P. 6030yr floating-rt mtgs 40 1yr Time deps 20 2yr time deps 20 20
-------- -------- ------ ------ $172 98$ $205 $65

Copyright 1999- A. S. Cebenoyan 9
Interest Rate RiskThe Maturity Model
• Market Value Accounting: The assets and liabilities of the FI are revalued according to the current level of interest rates.
• Examples:– How interest rate changes affect bond value:
• 1 year bond, 10% coupon, $100 face value, R=10%
– Sells at par, $100
– if interest rates go up, R=11%, sells at 99.10
– capital loss (P1) = $0.90 per $100 value
– (PR)< 0
– Rising interest rates generally lower the market values of both assets and liabilities of an FI.

Copyright 1999- A. S. Cebenoyan 10
• Show the effect of the same interest rate change if the bond is a two-year bond, all else equal.– At R=10%, still sells at par
– At R=11%, P2 = $98.29
– But P2 = 98.29 - 100 = -1.71%
– Thus, the longer the maturity of a fixed-income asset or liability, the greater its fall in price and market value for any given increase in the level of market interest rates. But, this increase in the fall of value happens at a diminishing rate as time to maturity goes up.
• Maturity Model with a Portfolio of Assets & Liabilities
– MA or ML designates the weighted average of assets and
liabilities.
– If bank has $100 in 3 year, 10% coupon bonds, and had raised $90 with 1-year deposits paying 10%, Show effects of a 1% rise in R.
– Show effects of a 7% rise

Copyright 1999- A. S. Cebenoyan 11
• Original B/S
___A________L______A=100 L=90 (1 year)
(3 year) E=10
• 1% rise in Int. rates
___A________L______
A=97.56L=89.19
E=8.37
EL
-1.63 = (-2.44) - (-0.81)
• 7% rise in Int. rates
___A________L______
A=84.53L=84.62
E=-0.09
EL
-10.09 = -15.47 - (-5.38)
Bank is insolvent.
The situation is tragic if bank has extreme Asset Liability mismatch

Copyright 1999- A. S. Cebenoyan 12
• In the case of Deep Discount (zero coupon) Bonds, the problem is extreme, and the implications are disastrous.– Show the effect on the same balance sheet, if the assets were 30-
year deep-discount bonds.
• A 1% increase in interest rates, reduces the value of the 30-yr bond by -23.73% per $100. Thus the bank will have net worth of -12.92 completely and massively insolvent.
• Maturity matching, by setting MA = ML , and having a maturity gap of 0, seems like might help. Let’s see:
• Maturity Matching and Interest Rate Risk Exposure– Won’t work. Example:
– Bank issues a one-year CD to a depositor, with a face value of $100, and 15% interest. So, $115 is due the depositor at year 1.
– Same bank lends to borrower $100 for one year at 15%, But requires half to be repaid in six months, the other half at end of year (plus interest, of course).

Copyright 1999- A. S. Cebenoyan 13
• Maturities are matched, and if interest rates remain at 15% throughout the year:– at half-year, bank receives $50 + $7.5 in interest (100 x .5 x .15),
$57.5
– at end-of-year, bank receives $50 + $3.75 in interest (50 x .5 x .15) plus the reinvestment income from the $57.5 received at half-year, (57.5 x .5 x .15), $4.3125, for a total of $58.06.
– Bank pays off the CD at $115, and has made $0.5625
• BUT, if interest rates fell to 12% in the middle of the year, this would not affect the 15% on the loan, nor the 15% on the CD, but reinvestment of the $57.5 will have to be at 12%, THUS:– at half-year bank still gets $57.50
– at end of year, bank receives $53.75 from loan, but $3.45 from reinvestment of the $57.50 (57.5 x .5 x .12), a total of $114.7.
– Bank pays off CD at $115, and loses $0.3, despite maturity matching of assets and liabilities. DURATION next.

Copyright 1999- A. S. Cebenoyan 14
Interest Rate RiskThe Duration Model
• Duration and duration gap are more accurate measures of an FI’s interest rate risk exposure
• Interest elasticity - Interest sensitivity of an asset or liability’s value
• More complete measure as it takes into account time of arrival of all cash flows as well as maturity of asset or liability

Copyright 1999- A. S. Cebenoyan 15
Same loan example as before: $57.5 at half-year, and $53.75 at 1-yr.
Taking present values at 15%:
PV at half-year = 57.5 / (1.075) = 53.49
PV at one-year = 53.75 / (1.075)2 = 46.51
Notice Present Values add up to $100.
Duration is the weighted-average time to maturity using the relative present values of the cash flows as weights.
Relative present value at half year = 53.49 /100 = .5349
Relative present value at one-year = 46.51 /100 = .4651
DLoan = .5349 (1/2) + .4651 (1) = .7326
If financed by the one-year CD, DCD= 1, Negative Duration Gap!!!

Copyright 1999- A. S. Cebenoyan 16
General Formula for Duration
N
tt
N
tt
N
ttt
N
ttt
PV
tPV
DFCF
tDFCFD
1
1
1
1
Examples:• Duration of a Six-Year Eurobond. Show 4.993 years•Duration of a 2-year Treasury Bond. Show 1.88 years•Duration of Zero-coupons. Always equal to maturity.•Duration of a Perpetuity = 1 + (1/R)

Copyright 1999- A. S. Cebenoyan 17
Features of Duration:
•Maturity
0 02
2
M
D
M
D
•Yield0
R
D
•Coupon Interest0
C
D

Copyright 1999- A. S. Cebenoyan 18
•The Economic Meaning of Duration
•Start with price of a coupon-bond:
NR
FC
R
C
R
CP
)1(...
)1()1( 2
We are after a measure of interest rate sensitivity, So:
N
N
R
FCN
R
C
R
C
RdR
dP
R
FCN
R
C
R
C
dR
dP
)1(
)(...
)1(
2
)1(1
1
termsrearrange We
)1(
)(...
)1(
2
)1(
2
132

Copyright 1999- A. S. Cebenoyan 19
Remember the concept of elasticity from economics, such as income elasticity of demand:
II
xxx /
/
Remember also our definition of Duration:
N
N
RFC
RC
RC
RFC
NR
CR
C
D
)1()(
...)1()1(
)1()(
...)1(
2)1(
1
2
2
PRFC
NR
CR
C
DN)1()(
...)1(
2)1(
1 2
Notice that the denominator is just the price of the bond,

Copyright 1999- A. S. Cebenoyan 20
NR
FCN
R
C
R
CDP
)1(
)(...
)1(2
)1(1
2
Notice that the right hand side is identical to the term in brackets in the last equation on slide number 11. So substitute DP into that equation, we get:
D
RdRP
dP
or
PDRdR
dP
)1(
,1
1
Interest elasticity of price?

Copyright 1999- A. S. Cebenoyan 21
A further rearrangement allows us to measure price changes as a function of duration:
R
dRD
P
dP
1Applications:
•The 6-year Eurobond with an 8% coupon and 8% yield, had a duration of D = 4.99 years. If yields rose 1 basis point, then:
dP/P = -(4.99) [.0001/1.08] = -.000462 or -0.0462%
To calculate the dollar change in value, rewrite the equation above
R
dRDPdP
1))((
= (1,000)(-4.99)(.0001/1.08)= $0.462
The bond price falls to $999.538 after a one basis point increase in yields.

Copyright 1999- A. S. Cebenoyan 22
Obviously the higher the duration the higher will be the proportionate drop in prices as interest rates rise.
A note on semiannual coupon adjustment to the duration - price relationship:
R
dRD
P
dP
2/11
Duration and Immunization
•FI needs to make a guaranteed payment to an investor in five years (in 2004) an amount of $1,469. If It invests in the market and hopes that the rates will not fall in the next five years it would be very risky (and stupid), after all the payment is guaranteed! What to do? Two alternatives:
•Buy five-year maturity Discount (Zero coupon) Bonds
•Buy five-year duration coupon bond

Copyright 1999- A. S. Cebenoyan 23
•If interest rates are 8%, $1,000 would be worth $1,469 in five years.
Buy 1.469 five-year zeros at $680.58 for 1 bond, paying $1,000, and you are guaranteed $1,469 in five years. Duration and maturity are matched, no reinvestment risk. All OK.
•If on the other hand, FI buys the six-year maturity 8% coupon, 8% yield Eurobond with duration of 4.99 years, AND:
•Interest rates remain at 8%: Cash Flows:
Coupons, 5x80 $400
Reinvestment (80xFVAF)-400 69
Proceeds from sale of bond, end of year 5 1,000
$1,469

Copyright 1999- A. S. Cebenoyan 24
•If interest rates instantaneously fall to 7%
Coupons $400
Reinvestment Income 60
Proceeds from sale of bond 1,009
$1,469
•If interest rates instantaneously rise to 9%
Coupons $400
Reinvestment 78
Bond sale 991
$1,469
Matching the duration of any fixed income instrument to the FI’s investment horizon immunizes it against instantaneous interest rate shocks.

Copyright 1999- A. S. Cebenoyan 25
•Duration Gap for a Financial Institution
Let DA be the weighted average duration of the asset portfolio of the FI, and DL be the weighted average duration of the liabilities portfolio, Then
R
RADA A 1
R
RLDL L 1
And since E = A - L ,
R
RLDADE LA 1
][
Multiply both sides with 1/A, we get

Copyright 1999- A. S. Cebenoyan 26
R
RAkDDE LA 1
][
Where k = L / A ,a measure of FI’s leverage.
The above equation gives us the effect of interest rate changes on the market value of an FI’s equity or net worth, and it breaks down into three effects:
1. The leverage adjusted duration gap = [DA-DLk]
the larger this gap in absolute terms, the more exposure
2. The size of the FI. The larger the scale of the FI the larger
the dollar size of net worth exposure
3. Size of the interest rate shock. The larger the shock, the greater the exposure.

Copyright 1999- A. S. Cebenoyan 27
Example:
Suppose DA= 5 years, and DL= 3 years. For an FI with $100 million in assets and $90 million in liabilities (with a net worth of $10 million), the impact of an immediate 1 percent ( R = .01) increase in interest rates from a base of 10% on the equity of the FI would be:
E = -(5-(.9)(3)) x $100 million x .01/1.1 = -$2.09 million
This is the reduction in equity : from $10 million to $7.91 million. Obviously assets and liabilities go down according to the duration formula (check the numbers please). As you can see the lower the leverage ratio, and/or the lower the duration of the liabilities, and/or the higher the duration of assets the higher the impact on equity.
What to do?
Get the leverage adjusted duration gap as close to 0 (zero) as possible.

Copyright 1999- A. S. Cebenoyan 28
•Some Difficulties in the Application of Duration Models
•Immunization is a dynamic problem
Over time even if interest rates do not change, duration changes and not at the same rate as calendar time.
The 6 year eurobond with 4.99 year duration (about the same as the investment horizon -five years), a year later will have a duration of 4.31 years. Remember you were only immunized for immediate interest rate changes. Now, a year later, you are facing a duration of 4.31 years with a 4 year horizon. Any interest rate changes now will no longer be applying to an immunized portfolio. Need to rebalance the portfolio ideally continuously, frequently in practice.
•Convexity
What if interest rate changes are large? Duration assumes a linear relationship between bond price changes and interest rate changes.

Copyright 1999- A. S. Cebenoyan 29
The actual price-yield relationship is nonlinear. See graph 7-6.
Convexity is the degree of curvature of the price-yield curve around some interest rate level.
A nice feature of convexity is that for rate increases the capital loss effect is smaller than the capital gain effect for rate decreases. Higher convexity generates a higher insurance effect against interest rate risk.
•Measuring convexity and offsetting errors in duration model
After a Taylor’s series expansion and dropping the terms with third and higher order, we get:
2)(2
1)( RCXRMD
P
P
Where, MD is modified duration, D/(1+R). CX reflects the degree of curvature in the price-yield curve at the current yield level.

Copyright 1999- A. S. Cebenoyan 30
fallpoint
basis-1a from
gain capital The
risepoint
basis-1a from
loss capital The
FactorScalingCX
The sum of the terms in the brackets gives us the degree to which the positive effect dominates the negative effect. The scaling factor normalizes this difference. A commonly used scaling factor is 108.
Example: Convexity of the 8%, 6-year Eurobond:
CX = 108 [{(999.53785-1000)/1000} + {(1000.46243-1000)/1000}] = 28
2)(282
1)( RRMD
P
P
For a 2% rise in R, from 8% to 10%
The relative change in price will be:
P/P = - [4.99/1.08] .02 + (1/2)(28)(.02)2 = -.0924 + .0056 =-.0868 or 8.68%. Notice how convexity corrects for the overestimation of duration

Copyright 1999- A. S. Cebenoyan 31
Market Risk
• Market Risk (Value at Risk, VAR): dollar exposure amount (uncertainty in earnings) resulting from changes in market conditions such as the price of an asset, interest rates, market volatility, and market liquidity.
• The five reasons for market risk management:– Management information (senior management sees exposure)
– Setting Limits(limits per trader)
– Resource Allocation (identify greatest potential returns per risk)
– Performance Evaluation (return-risk per trader Bonus)- Regulation (provide private sector benchmarks)

Copyright 1999- A. S. Cebenoyan 32
JPM’s RiskMetrics Model• Large commercial banks, investment banks, insurance
companies, and mutual funds have all developed market risk models (internal models). Three major approaches to these internal models:– JPM Riskmetrics– Historic or back-simulation– Monte Carlo simulation
• We focus on JPM Riskmetrics to measure the market risk exposure on a daily basis for a major FI.
• How much the FI can potentially lose should market conditions move adversely:
Market Risk = Estimated potential loss under adverse
circumstances

Copyright 1999- A. S. Cebenoyan 33
Daily earnings at risk= ($ market value of position) x (Price volatility)where,Price volatility = (Price Sensitivity) x (Adverse daily yield move)
We next look at how JPM Riskmetrics model calculates DEaR in three trading areas: Fixed income, Foreign exchange, and Equities,and how the aggregate risk is estimated.
Market Risk of Fixed Income SecuritiesSuppose FI has a $1 million market value position in 7-yr zero coupons with a facevalue of $1,631,483.00 and current annual yield is 7.243 .
Daily Price volatility = )()(1
RMDRR
D
P
dP
527.6)07243.1(
7
1
R
DMDThe modified duration =
for this bond

Copyright 1999- A. S. Cebenoyan 34
If we make the (strong and unrealistic) assumption of normality in yield changes, and we wish to focus on bad outcomes, i.e., not justany change in yields, BUT an increase in yields that will only bepossible with a probability, i.e., a yield increase that has a chanceof 5%, or 10%, or 1%…(We decide how likely an increase we wishto be worried about). Suppose we pick 5 %, i.e., there is 1 in 20chance that the next day’s yield change will exceed this adverse move.If we can fit a normal distribution to recent yield changes and get a mean of 0 and standard deviation of 10 basis points (0.001), and we remember that 90% of the areaunder the normal distribution is found within +/- 1.65 standard deviations, thenwe are looking at 1.65 as 16.5 basis points. Our adverse yield move.
Price Volatility = -MD (R) = (-6.527) (.00165) = -.01077DEaR = DEAR = ($ market value of position) (Price Volatility)
= ($1,000,000) (.01077) dropping the minus sign = $10,770 The potential daily loss with 5% chance
For multiple N days, DEAR should be treated like , and VAR computed as:NDEARVAR

Copyright 1999- A. S. Cebenoyan 35
Foreign Exchange
Suppose FI has SWF 1.6 million trading position in spot Swiss francs. What is the
DEAR from this?
•First calculate the $ amount of the position
•$ amount of position = (FX position) x ($/SWF)
= (SWF 1.6million) x (.625) = $ 1 million
If the standard deviation () in the recent past was 56.5 basis points, AND
we are interested in adverse moves that will not be exceeded more than 5%
of the time, or 1.65:
FX volatility = 1.65(56.5) 93.2 basis points THUS,
DEAR = ($ amount of position) x (FX volatility)
= ( $1million) x (.00932)
= $9,320

Copyright 1999- A. S. Cebenoyan 36
Equities
Remember your CAPM:
Total Risk = Systematic risk + Unsystematic risk
2222
eitmtitit
If the FI’s trading portfolio is well diversified, then its beta will be close to 1, and
the unsystematic risk will be diversified away….leaving behind the market risk.
Suppose the FI holds $1million in stocks that reflect a US market index, Then
DEAR = ($ value of position) x (Stock market return volatility)
= ($1,000,000) (1.65 m)
If the standard deviation of daily stock returns on the market in the recent past
was 2 percent, then 1.65( m)= 3.3 percent
DEAR = ($1,000,000) (0.033) = $33,000
Copyright 1999- A. S. Cebenoyan 37
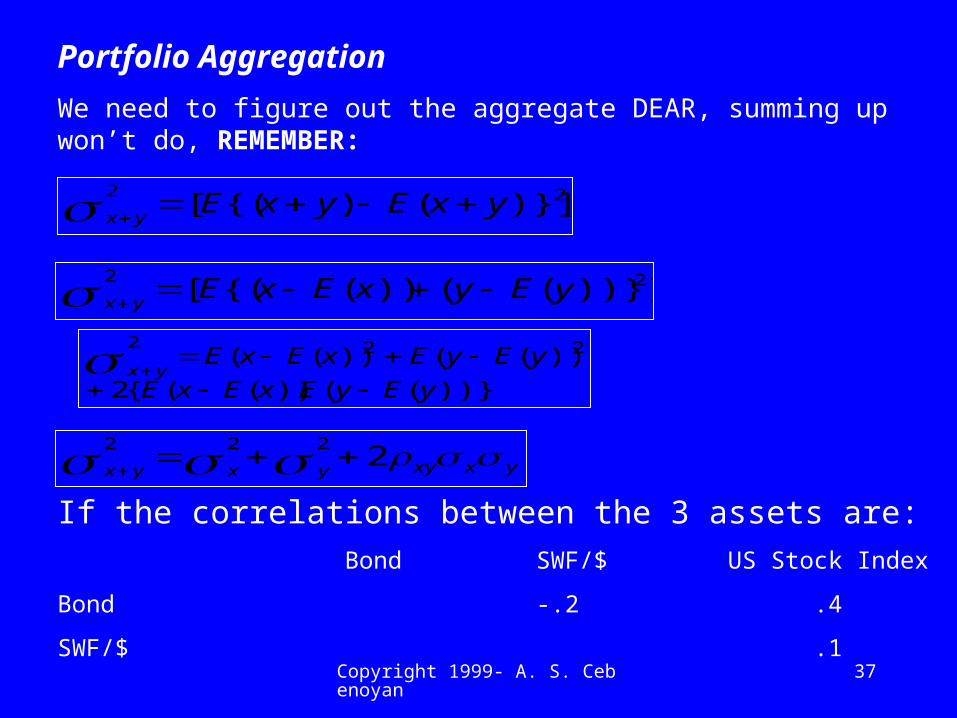
Portfolio Aggregation
We need to figure out the aggregate DEAR, summing up won’t do, REMEMBER:
22)}](){([ yxEyxE
yx
22
))}](())({([ yEyxExEyx
))}(())(({2
))(())(( 222
yEyExExE
yEyExExEyx
yxxyyxyx 2
222
If the correlations between the 3 assets are:
Bond SWF/$ US Stock Index
Bond -.2 .4
SWF/$ .1

Copyright 1999- A. S. Cebenoyan 38
Then the risk of the whole portfolio, DEAR treated like , will be2/1
.
.
.2
22
2
2
2
DEARDEARDEARDEARDEARDEARDEAR
DEARDEAR
swf
usswfusus
busbswf
bswfbus
swfb
portfolioDEAR
Substituting the values we have:2/1222
)33)(32.9)(1(.2)33)(77.10)(4(.2
)32.9)(77.10)(2.(2)33()32.9()77.10(
portfolioDEAR = $39,969
Copyright 1999- A. S. Cebenoyan 39
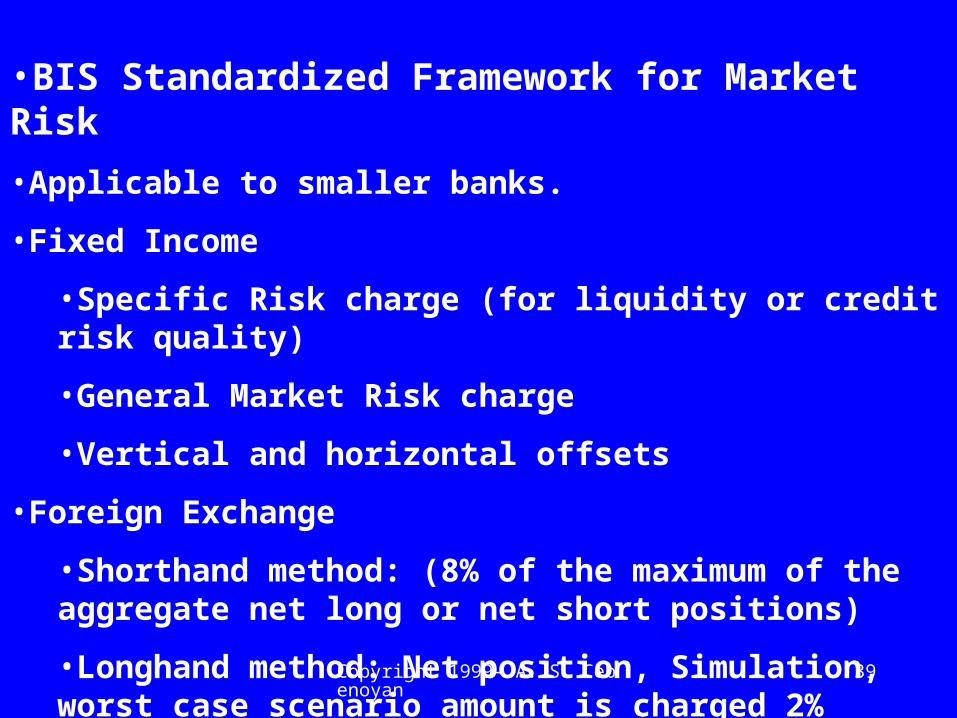
•BIS Standardized Framework for Market Risk
•Applicable to smaller banks.
•Fixed Income
•Specific Risk charge (for liquidity or credit risk quality)
•General Market Risk charge
•Vertical and horizontal offsets
•Foreign Exchange
•Shorthand method: (8% of the maximum of the aggregate net long or net short positions)
•Longhand method: Net position, Simulation, worst case scenario amount is charged 2%

Copyright 1999- A. S. Cebenoyan 40
•Equities
•Unsystematic risk charge (x-factor): 4% against the gross position
•Systematic risk charge (y-factor): 8% against the net position
•Large Bank Internal models
•BIS standardized framework was criticized for crude risk measurements + lack of correlations + incompatability with internal systems.
•BIS in 1995 allowed internal model usage by large banks with conditions:
•Adverse change is defined as 99th percentile - Minimum holding period is 10 days - correlations allowed broadly
•Proposed capital charge will be the higher of the previous day’s VAR, or the average daily VAR over the last 60 days times a factor (at least 3). Tier 2 and 3 allowed up to 250% of Tier 1.