copy - nasa€¦ · renewed interest in the pitch-up and/or stall characteristics of configurations...
TRANSCRIPT

e :- C O P Y
N A S A T E C H N I C A L NOTE N A S A TN D-3370
0 h CU) CU) I
n z I-
4 m 4 z
A PARAMETRIC STUDY OF FACTORS INFLUENCING THE DEEP-STALL PITCH-UP CHARACTERISTICS OF T-TAIL TRANSPORT AIRCRAFT
by Bruce G. Powers
Flight Research Center Edwards, CdliJ:
N A T I O N A L A E R O N A U T I C S A N D SPACE A D M I N I S T R A T I O N W A S H I N G T O N , D. C. A U G U S T 1966
https://ntrs.nasa.gov/search.jsp?R=19660023036 2020-07-24T13:13:49+00:00Z

NASA TN D-3370
A PARAMETRIC STUDY O F FACTORS INFLUENCING THE DEEP-STALL
PITCH-UP CHARACTERISTICS OF T-TAIL TRANSPORT AIRCRAFT
By Bruce G. Powers
Flight Research Center Edwards, Calif.
N A T I O N A L AERONAUTICS AND SPACE ADMINISTRATION
For sale by the Clearinghouse for Federal Scientific and Technical Information Springfield, Virginia 22151 - Price $2.00

A PARAMETRIC STUDY OF FACTORS INFLUENCING THE DEEP-STALL
PITCH-UP CHARACTERISTICS OF T-TAIL TRANSPORT AIRCRAFT
By Bruce G. Powers NASA Flight Research Center
SUMMARY
An analog-computer program was conducted to study the factors influencing the deep-stall pitch-up characteristics representative of T-tail trans port aircraft in a clean configuration with an aft center of gravity. Six pitching-moment curves were used and included variations of deep-stall as well a s initial-stall pitching-moment characteristics. A stall maneuver with specified control rates was used, with'decel- eration rates into the stall of 1, 3, and 5 knots per second. The effects of gusts in causing pitch-up were also investigated. The study was limited to the three longitudi- nal degrees of freedom.
During a stall maneuver, the time available for a pilot to initiate an acceptable recovery was significantly reduced as the severity of the pitch-up in the deep-stall region was increased. A region of increased stability at the initial stall increased the time available before the pitch-up region was encountered and also provided an addi- tional margin to prevent pitch-up due to gust penetration. If recovery from a stall maneuver was initiated as a function of angle of attack, the shape of the pitching- moment curve had only small effects on altitude losses during recovery.
INTRODUCTION
With the recent introduction of several T-tail transport airplanes, there has been renewed interest in the pitch-up and/or stall characteristics of configurations with high horizontal tails. pitched-up condition and the associated problem of avoiding the pitch-up region. Studies of longitudinal performance (refs. 1 to 3) have been concerned primarily with fighter-type aircraft in the transonic region. In these cases, the pitch-up usually occurred below the maximum lift coefficient, and the major concern was to avoid the pitch-up region in order to limit the angle of attack and, therefore, load factor. With the current T-tail transport configurations, the primary area of concern is the recovery from the pitch-up condition in the low-speed, high-angle-of-attack, or deep- stall, region. The limitation of angle of attack is not generally necessary from load considerations, since the loads are not increasing during a pitch-up in the stall region, with the possible exception of buffet loads.
One aspect of the pitch-up problem is that of recovery from a

As part of the NASA study (refs. 4 to 8) of various aspects of the deep-stall pitch- up problem, an analog-computer program was conducted at the NASA Flight Research Center, Edwards, Calif. This paper presents the results of the program, in which the relative effects of several parameters on the pitch-up characteristics of T-tail transport-type aircraft were investigated. A series of stall maneuvers was made with deceleration rates into the stall of 1, 3, and 5 knots per second, with recovery initi- ated over a range of angle of attack. The relative effects of the shape of the pitching- moment curves in the deep-stall region as well as in the initial-stall region were determined in terms of angle-of -attack overshoot and altitude losses during recovery. A series of stall maneuvers was also made with a deceleration rate of 3 knots per second to define the control moment required to recover from the deep-stall region at various levels of damping. preventing pitch-up due to gusts was investigated by using sine-wave gusts and recordings of continuous thunderstorm gusts.
The effect of the shape of the pitching-moment curve in
SYMBOLS
normal acceleration, g
drag coefficient, Drag i s
lift coefficient, Lift qs
Pitching moment pitching-moment coefficient , i S C
incremental pitching-moment coefficient
, per degree acm elevator control effectiveness, - *e
mean aerodynamic chord, feet
acceleration due to gravity, feet per second2
altitude, feet
altitude loss, feet
2

IY
q
s S
T
t
td
tr
V
Ve
VS
W
wg
a!
Aa!
g a!
a!r
Y
6e
e P
moment of inertia about the Y-axis, slug-foot2
pitching velocity, radians per second
dynamic pressure, pounds per square foot
wing area, square feet
thrust, pounds
time, seconds
delay time, time from a! = 15" to ar, seconds
recovery time, time from ar to a! = 15", seconds
true velocity, feet per second
equivalent velocity, knots
equivalent stall speed based on maximum CL, knots
airplane weight, pounds
vertical gust velocity, feet per second
angle of attack, degrees
incremental angle of attack, degrees
incremental angle of attack due to gust velocity, degrees
maximum angle of attack attained during the stall maneuver, degrees
recovery angle of attack, degrees
flight -path angle, degrees
elevator deflection, degrees
pitch angle, degrees
a i r density, slugs per cubic foot
A dotted quantity indicates a derivative with respect to time.
3
TEST SETUP
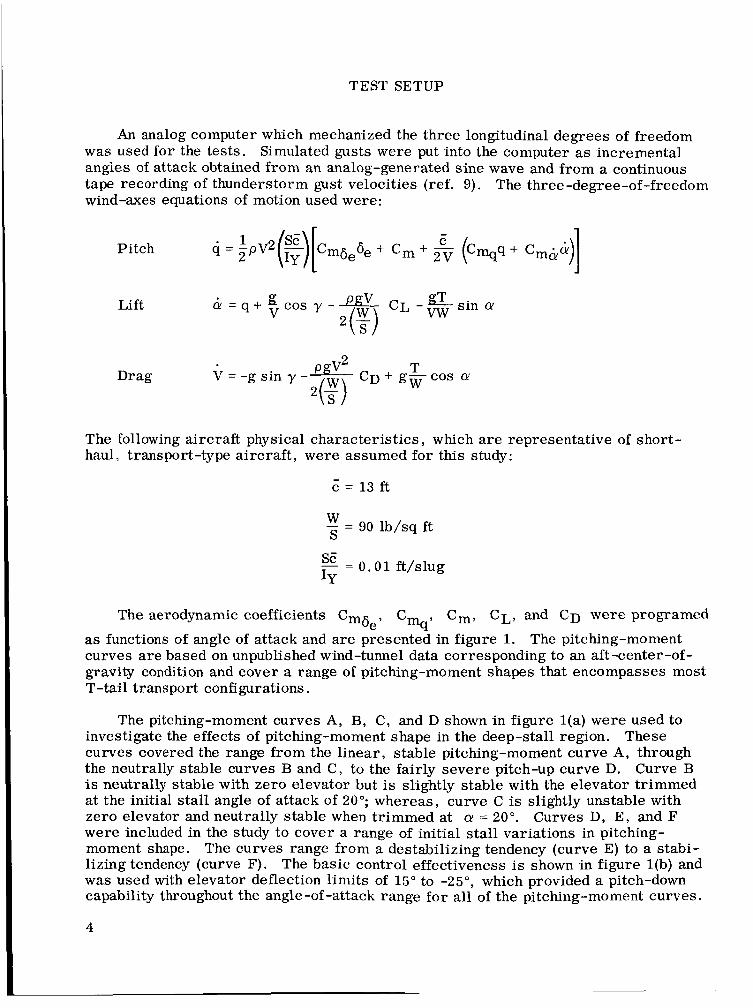
An analog computer which mechanized the three longitudinal degrees of freedom was used for the tests. Simulated gusts were put into the computer as incremental angles of attack obtained from an analog-generated sine wave and from a continuous tape recording of thunderstorm gust velocities (ref. 9). wind-axes equations of motion used were:
The three-degree-of-freedom
Pitch
Lift
Drag
The following aircraft physical characteristics, which are representative of short- haul, transport-type aircraft, were assumed for this study:
= 90 lb/sq f t S
SE - = 0 . 0 1 ft/slug IY
Cm, CL, and CD were programed "q ,
The aerodynamic coefficients Cm6e, C
as functions of angle of attack and are presented in figure 1. curves a re based on unpublished wind-tunnel data corresponding to an aft-center-of- gravity condition and cover a range of pitching-moment shapes that encompasses most T-tail transport configurations.
The pitching-moment
The pitching-moment curves A, B, C, and D shown in figure l(a) were used to investigate the effects of pitching-moment shape in the deep-stall region. curves covered the range from the linear, stable pitching-moment curve A, through the neutrally stable curves B and C , to the fairly severe pitch-up curve D. Curve B is neutrally stable with zero elevator but is slightly stable with the elevator trimmed at the initial stall angle of attack of 20"; whereas, curve C is slightly unstable with zero elevator and neutrally stable when trimmed at Q = 20". Curves D, E , and F were included in the study to cover a range of initial stall variations in pitching- moment shape. The curves range from a destabilizing tendency (curve E) to a stabi- lizing tendency (curve F). The basic control effectiveness is shown in figure l(b) and was used with elevator deflection limits of 15" to -25", which provided a pitch-down capability throughout the angle-of -attack range fo r all of the pitching-moment curves.
These
4

Variations of the basic control effectiveness were used to determine the pitching- moment requirements for recovery from the deep-stall region. variations and the total pitch down C, available for the various values of control effectiveness.
Figure l(c) shows the
*2 r Deep-stall variations
Cm / 0
/ I I I I I
s 2 r Initial-stall variations
-.4 0 10 20 3 0 40 5 0 60
a, d e g
(a) Pitching-moment characteristics; 8, = 0".
-- - , Cm& I
0 10 20 3 0 40 5 0 60
a, dag
(b) Lift, drag, control, and damping characteristics.
Cm
. 2 -
- . 2 -
0.05 __ -- -.6 I I I I I - _ J
0 10 20 3 0 40 5 0 60
(c) Control-effectiveness characteristks used for de-
Figure 1.- Aerodynamic characteristics.
termining recovery pitching-moment requirements.
5

TEST MANEUVERS
The basic test maneuver was a conventional stall-demonstration maneuver. Typi- cal time histories of the test maneuver are shown in figures 2(a) and 2(b). To provide a precise comparison of the various pitching-moment characteristics , a well-defined maneuver based on flight experience was used. The maneuver consisted of a zero- thrust deceleration at either 1, 3, or 5 knots per second from a speed of 175 knots. The elevator control rate was varied to maintain the desired deceleration and was ap- proximately constant until recovery was initiated at a predetermined angle of attack. For recoveries initiated at angles of attack above that for the initial stall, the control rate was held constant at the value existing at the initial stall. ("Initial stall , 'I as used herein, refers to the first point of maximum CL at a! = Z O O . ) Thrust was applied at recovery initiation with a 3-second engine time constant to give a thrust-to-weight ratio of 0.25. To minimize the angle-of-attack undershoot when returning to the t r im condi- tion, the recovery control input was maintained until zero pitch angle was reached. At that point, the recovery control input was reduced until zero pitch rate was obtained, which usually occurred at a pitch angle of -10" to -20". Trim speed was then regained and a pullup to level flight was performed using a 2.5 load-factor limit. Recovery was considered to be complete when level flight was achieved. The control rates used in
entry portion, which ranged from 0 . 1 degree per second to 0.5 degree per second, depending on the deceleration rate.
I the maneuver were approximately 5 degrees per second with the exception of the stall
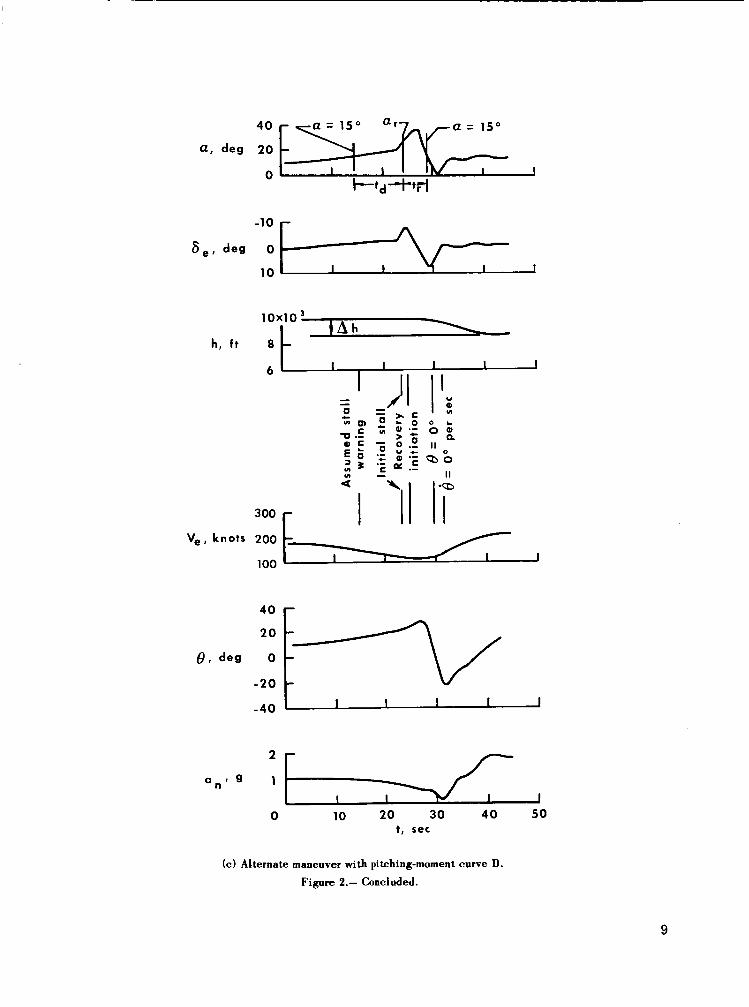
The basic stall maneuver is characteristic of a flight situation in which the pilot does not recognize the stall condition until he is into the deep-stall region. An alternate situation could also exist in which the pilot misinterprets the stall condition, for example, noting a decrease in normal acceleration and then pulling up farther into the stall in an attempt to regain l g flight. This situation was represented by a stall maneuver with a deceleration rate of 3 knots per second and a rapid pitch-up control input of 5 degrees per second at the initial stall (a! = 20") , which was continued until recovery initiation. The recovery remained the same as for the basic maneuver. A typical time history of this alternate maneuver is shown in figure 2(c).
In evaluating the stall maneuver, the following parameters , which are illustrated in figure 2 , were found to be useful. The delay time td is defined as the time from
a! = 15" to a!,. The te rm represents the amount of time that the recovery initiation
was delayed past an assumed stall warning at a! = 15". The recovery time tr is the time required to return to a! = 15" from recovery initiation and is an indication of the length of time spent in the stall region. Altitude loss Ah is the total altitude lost from the start of the maneuver to the completion of the recovery (level flight). The maximum angle of attack attained during the maneuver amax is a measure of the
overshoot (amax - Crr) and may also be indicative of possible problems with lateral-
directional stability and buffet loads.
~
I
6

h, f t
6 I I I I I I I I l l
3 0 0 r I I I l l
knots 200v 100
-40 I I I I I I
an' 9
0 10 20 30 40 50
t, sec
(a) Basic test maneuver with pitching-moment curve D. Figure 2.- Typical time histories of stall maneuver.
7

I I I I 1
10~10~
h, ft 8 1 4h
4
I I 300 r I 1 ' ; "
knots 2oo/ 100
1, sec
(b) Basic maneuver with pitching-moment curve A.
Figure 2.- Continued.
8
40~[ a = 15" , a, d e g 20
0
10x10 4 h , f t 8 1
300 r I \lI r Vel knots 200
100
e ' deg - 2 0 O t: V
1 1 - = , , 0 10 20 30 40 5 0
t, sec
(e) Alternate maneuver with pitching-moment curve D. Figure 2.- Concluded.
9
RESULTS AND DISCUSSION
Basic Data
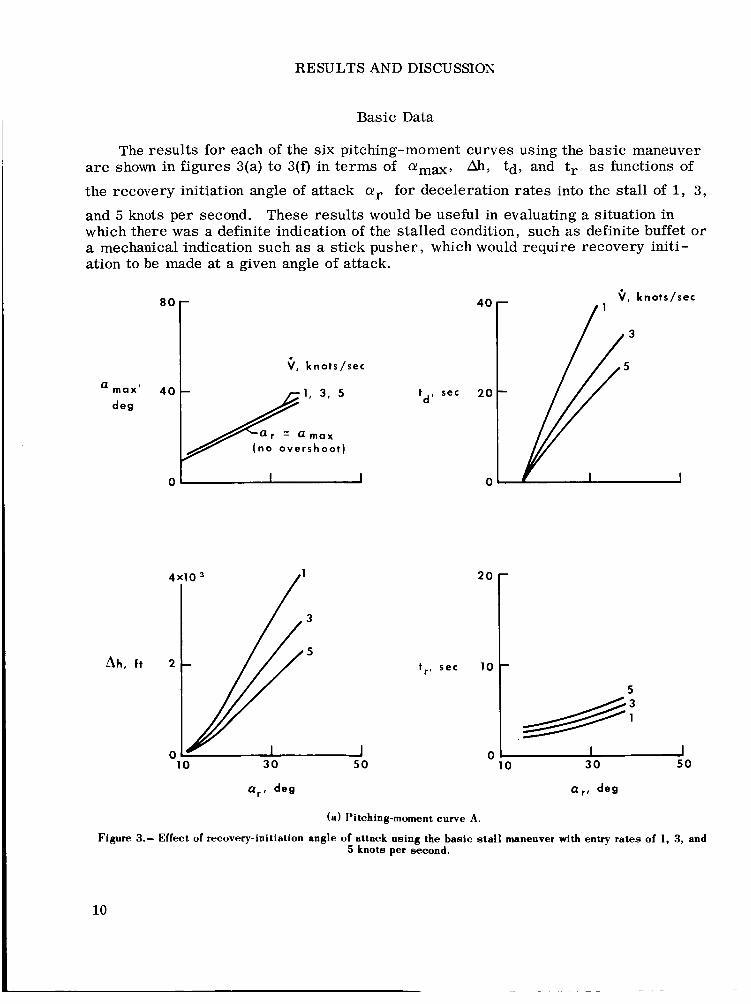
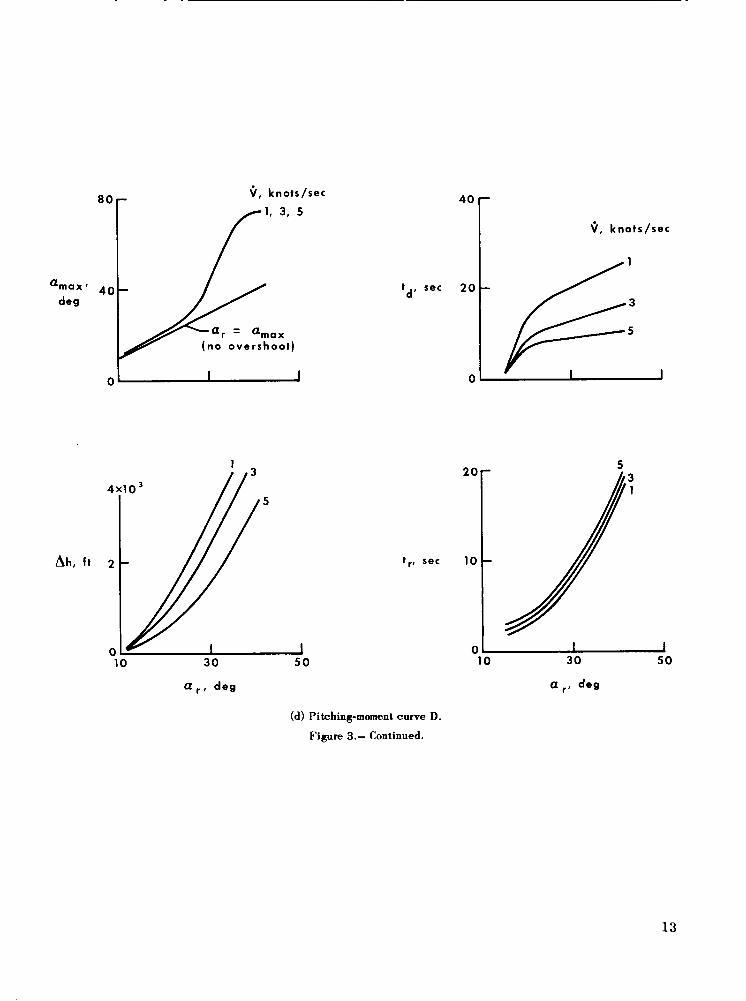
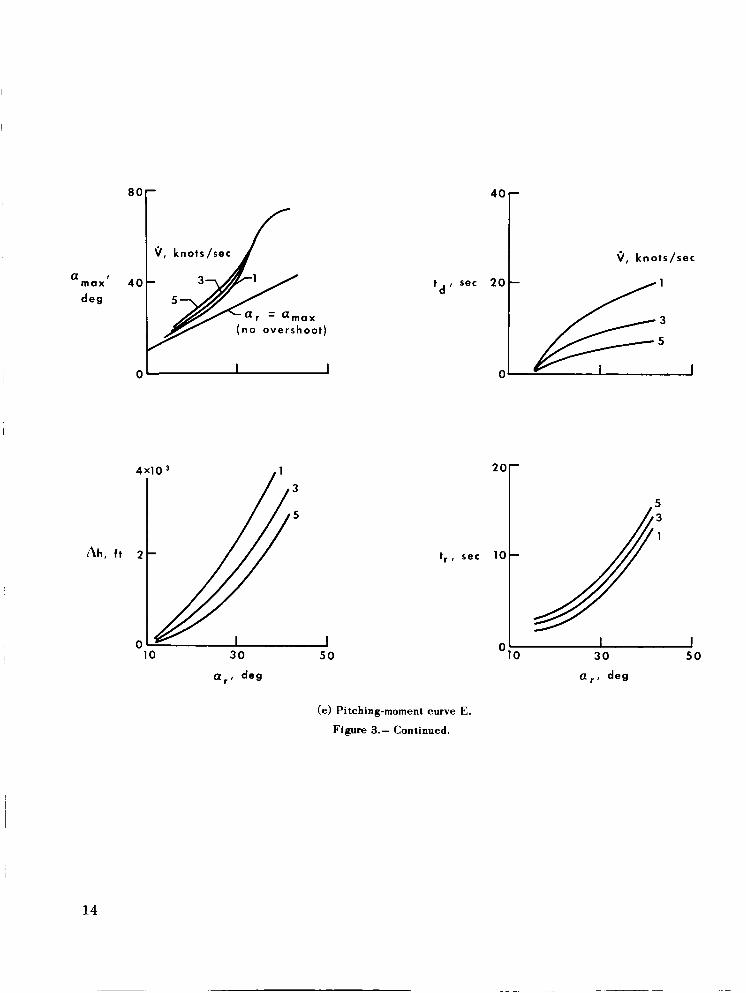
The results for each of the six pitching-moment curves using the basic maneuver are shown in figures 3(a) to 3(f) in terms of
the recovery initiation angle of attack or for deceleration rates into the stall of 1, 3,
and 5 knots per second. These results would be useful in evaluating a situation in which there was a definite indication of the stalled condition, such as definite buffet or a mechanical indication such as a stick pusher, which would require recovery initi- ation to be made at a given angle of attack.
ah, td, and tr as functions of
8 0
0
Ah, f t
4 0
V, k n o t s / s e c
I I 0
20
t , , s e c 10
I 5
a , , deg
(a) Pitching-moment curve A.
Figure 3.- Effect of recovery-initiation angle of attack using the basic stall maneuver with entry rates of 1, 3, and 5 knots per second.
10

* O I
0
- c, knots/sec td’sec20-F I
1
% a x ,
(no overshoot )
0-
4x10’
3 5
h h , ft 2 -
0 1 10 3 0 5 0
a,, deg
9 , knots/sec 40r
I
(b) Pitching-moment curve B. Figure 3.- Continued.
11

c, knots/sec 8o r
a r = a m a x (no overshoot)
Qtnaxi 40 deg
12
10 30 50
Q r , deg
401 c, knots/sec
(c) Pitching-moment curve C.
Figure 3.- Continued.
0- 10 3 0 5 0
a r , deg
$, knots/sec 8 0 r
(no overshoot )
0 w
5
1 10 3 0 5 0
a,, d e g
40 - $, knots/sec
td, s e c 2 0 -
0 -
0- 10 3 0 5 0
a,, deg
(d) Pitching-moment curve D.
Figure 3.- Continued.
13
a m a x ' 4
d e 9
0 j$
l 3
/ 5
- 10 30 5 0
a,, deg
t d , sec 2 0 -
0
, 010 30 5 0
a , , deg
(e) Pitching-moment curve E.
Figure 3.- Continued.
14

8 0
1 0
V, knots/sec ~
1, 3, 5
(no overshoot)
f t
4 0 r 9 , knots/sec
'd' sec 20-
O 3
10 30 50 0
a,, de9
(f) Pitching-moment curve F Figure 3.- Concluded.
15

In order to consider the results from a second point of view, the data of figure 3 were replotted in figures 4(a) to 4(f) in terms of amax and Ah as a function of the
delay time td. These results would be useful when there is no definite stall warning,
so that the time available for the pilot to recognize the stalled condition is an important factor.
As the deceleration rate into the stall is increased, a small increase in recovery time is noted, which would tend to increase altitude losses (fig. 3); however, this tendency was compensated for by a large reduction in the time between stall warning and recovery initiation td.
faster rates.
This reduction resulted in smaller altitude losses for the
For recovery based on the time factor td (fig. 4), deceleration rate
c, knots/sec
5 3 1
d e g
O L r n a x , 40 t l c, knots/sec
c
4x10 '
I I I I c I I 1 0 10 20 30 0 10 20 30
t d , sec t d , sec
(a) Pitching-moment curve A. (b) Pitching-moment curve B. Figure 4.- Effect of delay time using the basic stall maneuver with e n q rates of 1, 3, and 5 knots per second.
16

8 0
40
C
4
2
i / , knots/sec
1
0 10 2 0 30
8 0
4 0
0
t d , sec
(c) Pitching-moment curve C.
- 9 , knots/sec
1
f l
c, knots/sec
1
1 I I
1
I 0 10 2 0 30
td , sec
(d) Pitching-moment curve D. 3 , knots/sec
0 1 0 20 30
t d , sec
(e) Pitching-moment curve E.
0 10 2 0 3 0
t d , sec
(f) Pitching-moment curve F. Figure 4.- Concluded.
17

c m Pitching-
C moment curve
' O r /D
I I I I I I
4x10³ D
A C B
3 -
Ah, ft 2 -
1 -
0 10 15 2 0 2 5 3 0 35 4 0
o r , deg
Figure 5.- Effect of deep-stall pitching-moment character- i s t i c s on angle-of-attack overshoot and altitude loss during recovery for recovery initiated a s a function of angle of attack. Entry rate = 3 knots per second.
C, W C Pitching- moment
60- curve
4 0 - amax! A
01 I I I I I I
4x10³
3 -
A
Ah, ft 2 -
I I I I I J 0 5 10 15 2 0 2 5 3 0
td, sec
Figure 6.- Effect of deep-stall itching-moment character- i s t i c s on angle-of-attack oversEoot and altitude loss dur- ing recovery for recovery initiated a s a function of time past a stall warning. Entry rate = 3 knots per second.
had almost no effect on altitude loss for the linear, stable curve (curve A). For the decreased stability curves, the higher rates reduced the time before a pitch-up occurred, which resulted in greater angle- of-attack overshoot and altitude loss at a given delay time. In general, the decel- eration rate into the stall had little effect on the severity of the pitch-up for recov- eries initiated as a function of angle of attack but could have a noticeable effect for recoveries initiated as a function of the time past a stall warning.
Evaluation of Pitching-Moment Shape
Deep-stall characteristics. - To illus - trate the effects of the shapes of the pitching-moment curves in the deep-stall region of a! = 20" to a! = 50", figures 3 and 4 a re summarized in figures 5 and 6 for an entry rate of 3 knots per second. For recovery initiated as a function of angle of attack (fig. 5), there is no signif- icant difference in either angle-of-attack overshoot o r altitude loss for recoveries initiated at an angle of attack less than 25" (5" past the initial stall). Beyond O r = 25", however, curve D shows a no- ticeable pitch-up and an associated large altitude loss as a result of long recovery times (tr in fig. 3). The linear pitching- moment curve, curve A, which might be expected to have the smallest altitude loss at a given ar, because of the low recovery time, has a relatively large altitude loss because of the longer time required to reach a given angle of attack. For curve B, pitch-up occurs relatively easily (low td) but recovery is also relatively easy (low tr), resulting in the lowest altitude loss of the four pitching-moment curves.
A comparison of the maximum angle- of-attack and altitude loss of these same pitching-moment curves for the recovery initiation based on the time factor td is
shown in figure 6. As the level of deep- stall stability is increased, there is an
18

Pitching- moment curve
I 6 0 r c .
4 0 i I I I I I
4x10³ I
or, des
Figure 7.- Effect of pitching-moment character- i s t ics at stall on angle-of-attack overshoot and altitude loss during recovery for recovery initi- ated a s a function of angle of attack. rate = 3 knots per second.
Entry
cm D ~ F Pitch in g- m o m e n t
I I I I I
4x10³
I
k 0
YF I I I I I 5 10 15 2 0 2 5
td, sec
Figure 8.- Effect of pitching-moment character- i s t ics at stal l on angle-of-attack overshoot and altitude loss during recovery for recovery initi- ated a s a function of time past the stall warning. Entry rate = 3 knots per second.
increase in the time required to reach a given value of amax and, thereby, a re-
duction in the altitude loss for a given delay time. A significant difference in altitude loss occurs between curve C (neutrally stable when trimmed at the initial stall) and curve B (slightly stable when trimmed at the initial stall). It appears that if there is some degree of stability in the deep-stall region, altitude losses will be on the same order as those for a linear pitching- moment curve for a recovery initiated at the same delay time td. Similarly, neu-
tral and unstable pitching-moment curves will have significantly larger altitude losses than the linear curve if recovery is not initiated until after the initial stall.
Initial-stall characteristics. - The ef- fects of the pitching-moment characteristics in the initial-stall region on the maximum angle of attack and altitude loss are shown in figures 7 and 8. When recovery is initi- ated as a function of angle of attack (fig. 7), curve E , with the destabilizing tendency in the initial-stall region, shows less altitude loss than either curves D or F, with the moderate and highly stabilized regions at the initial stall , although the angle -of - attack overshoot is as much as 5" greater for the lower cvr recoveries. The detri-
mental effect of the stabilizing region on altitude losses for recoveries based on angle of attack is the result of the longer time required to reach a given angle of attack, due to the increased stability when entering the stall, combined with a greater recovery time, due to a more severe pitch- up caused by the greater degree of instabil- ity in the pitch-up region.
In terms of the time factor td, how-
ever, a progressive delay in pitch-up is noted as the stabilizing tendency at the initial stall is increased (fig. 8), which results in a reduction in altitude loss for a given delay time. These results were obtained with constant control -input rates , which did not include any rapid control in- puts prior to recovery.
19
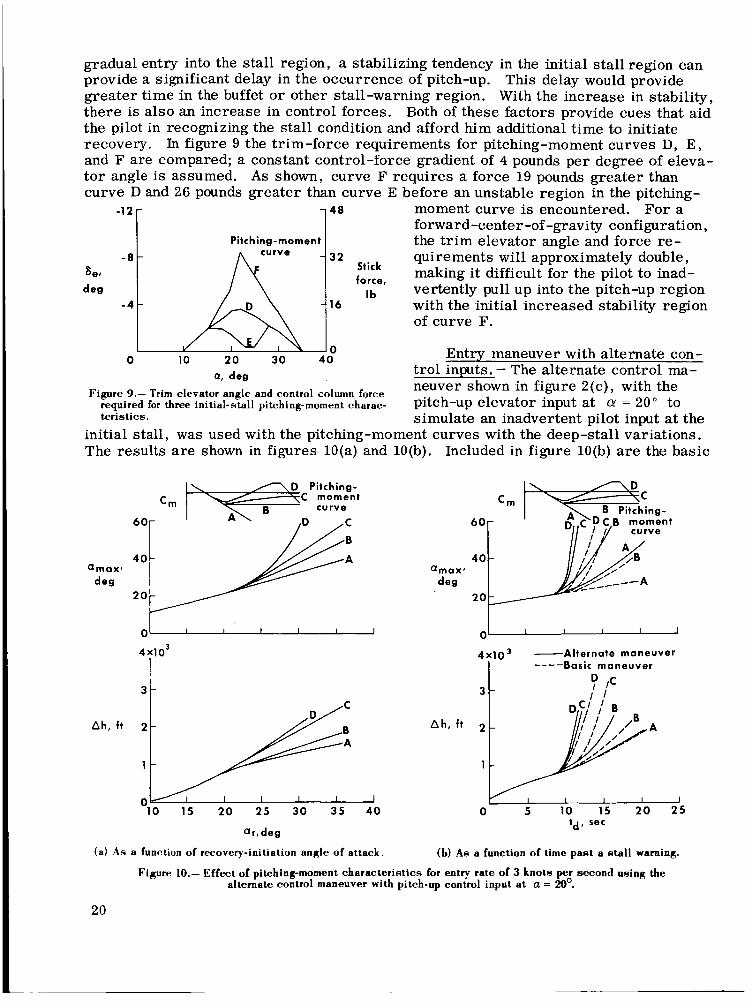
For this type of
-12
- 8
sei deg
- 4
Cm
- - 4 8 moment curve is encountered. For a forward-center -of -gravity configuration, the t r im elevator angle and force re-
making it difficult for the pilot to inad- vertently pull up into the pitch-up region
- - 16 with the initial increased stability region of curve F.
Pitching-moment
- - 32 quirements will approximately double, Stick force,
Ib
curve
A
I I I I I I
Qmax deg
3 -
Cm
60
2 0
Basic maneuver ----
maneuver results of figure 6 . basic maneuver except that the increase in alti$de losses due to the longer delay times of curve A is no longer a significant factor, si ce the rapid pullup reduces the delay time to an extent that the altitude losses are pr rimarily a function of recovery times (fig. lO(a)). The data again indicate that some degree of positive stability in the deep- stall region significantly decreases the angle-of-attack overshoot and altitude loss as a function of delay time (fig. 10(b)) and also, to some extent, as a function of recovery angle of attack.
The results follow the same trend as those with the
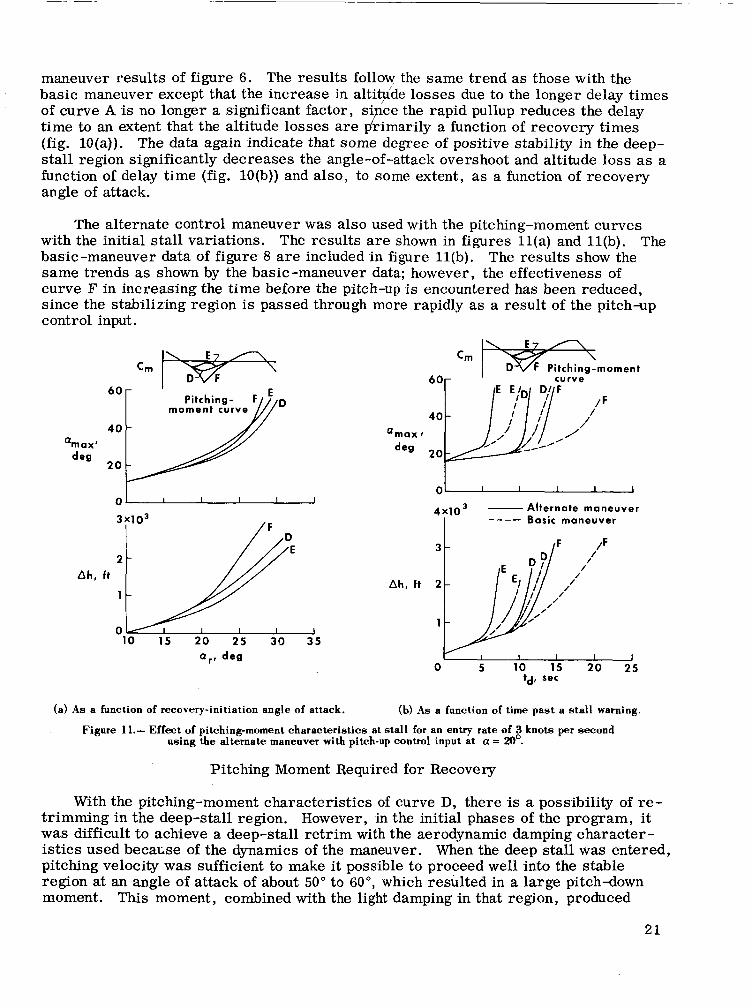
The alternate control maneuver was also used with the pitching-moment curves with the initial stall variations. The results a re shown in figures l l ( a ) and l l(b). basic-maneuver data of figure 8 a r e included in figure l l(b). The results show the same trends as shown by the basic -maneuver data; however, the effectiveness of curve F in increasing the time before the pitch-up is encountered has been reduced, since the stabilizing region is passed through more rapidly as a result of the pitch-up control input.
The
moment curve
‘ma,,
2 0 des
cm It%$+- F Pitching-moment
I I I I I
Alternate maneuver Basic maneuver
4x10³ - --_- 0
3X1O3
/F /
3 -
/ Ah, ft
Ah, ft 2 -
1 10 15 2 0 25 30 3 5
a r t des I I I I 1 0 5 10 15 2 0 25
td, sec
(a) A s a function of recovery-initiation angle of attack. (b) A s a function of time past a stall warning.
Figure 11.- Effect of pitching-moment characteristics at stall for an entry rate of 3 knots p e r second using the alternate maneuver with pitch-up control input at a = 20”.
Pitching Moment Required for Recovery
With the pitching-moment characteristics of curve D, there is a possibility of re- trimming in the deep-stall region. However, in the initial phases of the program, it was difficult to achieve a deep-stall re t r im with the aerodynamic damping character- istics used b e c a u e of the dynamics of the maneuver. When the deep stall was entered, pitching velocity was sufficient to make it possible to proceed well into the stable region at an angle of attack of about 50” to 60”, which resulted in a large pitch-down moment. This moment, combined with the light damping in that region, produced
2 1
sufficient nose-down pitching velocity to enable the airplane to pass through the deep- stall retrim region and return to the t r im point at an angle of attack of 10". quently, a series of stall maneuvers was made with various levels of damping (assumed constant with angle of attack) and control effectiveness (fig. l(c)) to determine the pitching moment necessary to recover from the basic stall maneuver of figure 2 over a range of recovery-initiation angles of attack.
Conse-
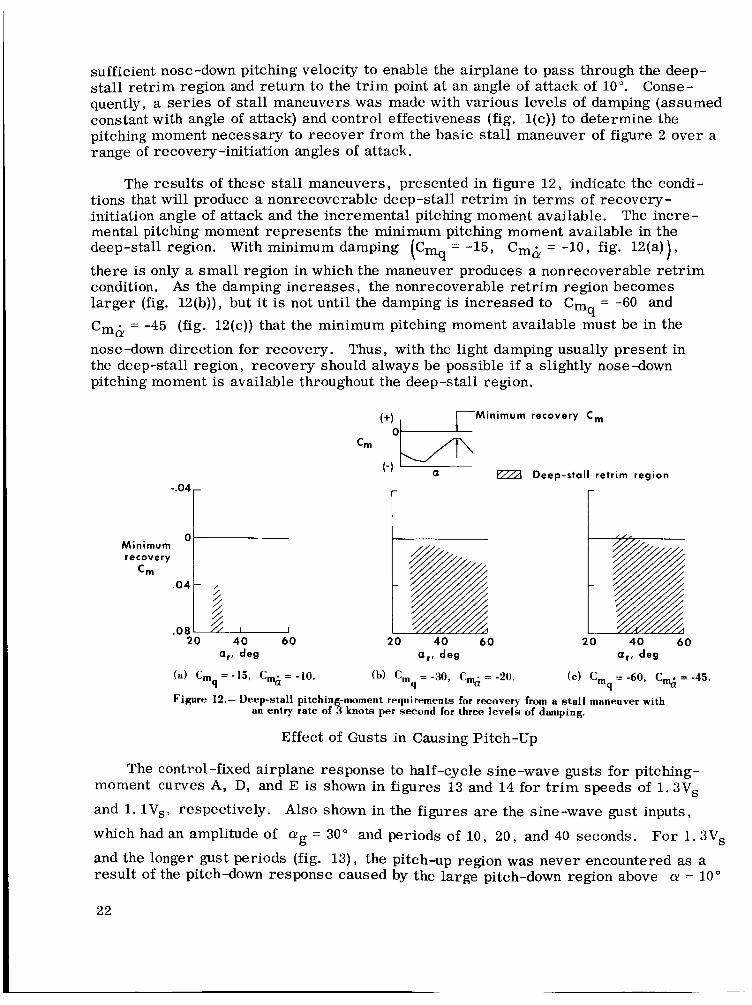
The results of these stall maneuvers, presented in figure 12, indicate the condi- tions that will produce a nonrecoverable deep-stall retrim in terms of recovery- initiation angle of attack and the incremental pitching moment available. mental pitching moment represents the minimum pitching moment available in the deep-stall region. With minimum damping (Cm = -15, Cmb = -10, fig. 12(a)), there is only a small region in which the maneuver produces a nonrecoverable retrim condition. As the damping increases, the nonrecoverable re t r im region becomes larger (fig. 12(b)), but it is not until the damping is increased to C = -60 and Cmb = -45 (fig. 12(c)) that the minimum pitching moment available must be in the nose-down direction for recovery. Thus, with the light damping usually present in the deep-stall region, recovery should always be possible if a slightly nose-down pitching moment is available throughout the deep-stall region.
The incre-
q
"q
(+I I r M i n i m u m recovery Cm
Minimum recovery
Cm
Deep-stall retrim region (-1 - a
ar, deg
Figure 12.- Deep-stall pitching-moment requirements for recovery from a s ta l l maneuver with an entry rate of 3 knots per second for three levels of damping.
Effect of Gusts in Causing Pitch-Up
The control-fixed airplane response to half-cycle sine-wave gusts for pitching- moment curves A, D, and E is shown in figures 13 and 14 for t r im speeds of 1. 3Vs
and 1. lVs, respectively. Also shown in the figures are the sine-wave gust inputs,
which had an amplitude of ag = 30" and periods of 10, 20, and 40 seconds. For 1. 3Vs
and the longer gust periods (fig. 13), the pitch-up region was never encountered as a result of the pitch-down response caused by the large pitch-down region above a! = 10"
l 40 60 a,, deg
40 60
22

a, 20 deg 0 -
-201 I I I I I
Gust input
- - - - Pitching-moment curve D - --- -- --_ -__-- _I
I I I I I
deg --- ,- '\\l I I I 0 5 10 15 20 2 5
t,sec
Figure 13.- Response to sinusoidal gust input for trim at 1.3Vs (a= 109.
Gust input period, sec
4 0 20 10
-__--- --
_--
2 0 Pitching-moment curve E ~~
01 I I I I I
-20 I I I I I
Gust input
I I 0 5 10 15 2 0 2 5
t, sec
Figure 14.- Response to sinusoidal gust input for trim at l . l V s (a = 14O).
(fig. l(a)). For the low-period gust input, the pitch-up region was not encountered for a sufficiently long time to allow a divergence in angle of attack. When the t r im speed was reduced to 1. lVs (fig. 14), for curve D there was still a sufficient pitch-down region to keep the angle of attack below the pitch-up region for the longest gust period. For the shorter gust periods, the pitch-up region was encountered, but the combined effects of the initial pitch-down response tendency and the rapid reduction in the gust input prevented the occurrence of a deep-stall retrim. For curve E, which had a smaller pitch-down region, the angle of attack did not return to the stable region with the three gust inputs, eventually resulting in deep-stall retrim conditions. Since the gust magnitude used represents an extreme gust condition (corresponding to a gust velocity at an altitude of 10 , 000 feet of 150 ft/sec for 1. lVs and 184 ft/sec for 1. 3Vs), it appears that for normal operating speeds, gust penetration is not likely to cause a pitch-up to the deep-stall region.
To further define the effects of pitching-moment-curve shape at the initial stall on fixed-control airplane response to gusts a t low speeds, a range of sizes of the pitch- down region at the initial stall in terms of ACm and Acu (fig. 15(a)) was investigated in a continuous -gust environment. A tape recording of the gust velocities, obtained from a penetration of a thunderstorm (ref. 9), was used. A typical time history of the gust velocity and the airplane angle-of-attack response is shown in figure 15(b). The results a r e shown in figure 15(c) in terms of the parameters ACm and Acu (size of pitch-down region), and the maximum gust magnitude that could be penetrated without causing a pitch-up to a deep-stall retrim condition. This magnitude is expressed as a percent of the actual full-scale turbulence level of 15.6 feet per second root mean square (ref. 9). The results indicate that the level of gust magnitude that could be penetrated without producing a deep-stall retrim is dependent on both the height ACm and width Aa of the pitch-down region and varies approximately as the square root of
the area of the pitch-down region ,/(ACm)(A@). As a result, the gust margin cannot be
23

specified directly in terms of a speed margin (or angle-of-attack margin) but must, instead, be specified in terms of the size of the pitch-down region of the pitching- moment curve between the desired t r im point and the deep-stall t r im point.
(+I
Cm 0
( -1 T r i m point
a
(a) Parameters of pitch-down-region s i z e .
40
01 I I I I I I I 1 I
t, sec
(b) Time history of gust velocity and airplane res onse; ha = 8’, AC, = 0. IO, relative gust magnitude = 39 percent.
Gust magnitu
percent of
- 2 0
de, fu l l scale
I 1 I I I 0 4 8 12 16
A a , deg
(c) Level of gust magnitude that can be penetrated without causing a pitch-up to a deep-stall retrim.
Figure 15.- Effect of the size of the pitch-down region on preventing pitch-up during continuous- gust penetration.
24

CONCLUSIONS
An analog computer program was conducted to study factors that influence the pitch-up characteristics representative of T-tail transport-type aircraft. of this study showed that:
The results
1. During a stall maneuver, the time available for a pilot to initiate an acceptable recovery was significantly reduced as the severity of the pitch-up was increased. However, the shape of the pitching-moment curve in the deep-stall region had only a small effect on altitude loss during recovery when recovery initiation was performed as a function of angle of attack.
2. A region of increased stability at the initial stall can be of significant benefit, in that it provides a delay in the occurrence of pitch-up and an increase in control forces required at the initial stall. Both of these factors provide cues that aid the pilot in recognizing the stall condition and afford him additional time to initiate recovery.
3. For a pitching-moment curve with a deep-stall t r im point, a recovery is possible if a small amount of pitch-down recovery moment is available throughout the deep-stall region when light damping is present.
4. A pitch-down region at the initial stall provided a margin to prevent pitch-up The margin varied approximately as the square root of caused by gust penetration.
the area under the curve of pitch-down moment versus angle of attack.
Flight Research Center, National Aeronautics and Space Administration,
Edwards, Calif. , March 28, 1966.
25

REFERENCES
1. Campbell, George S. ; and Weil, Joseph: The Interpretation of Nonlinear Pitching Moments in Relation to the Pitch-Up Problem. NASA TN D-193, 1959.
2. Holleman, Euclid C. ; and Boslaugh, David L. : A Simulator Investigation of Factors Affecting the Design and Utilization of a Stick Pusher for the Prevention of Air - plane Pitch-Up. NACA RM H57J30, 1958.
3. Sadoff, Melvin; Stewart, John D. ; and Cooper, George E. : Analytical Study of the Comparative Pitch-Up Behavior of Several Airplanes and Correlation With Pilot Opinion. NACA RM A57D04, 1957.
4. Ray, Edward J. ; and Taylor, Robert T. : Effect of Configuration Variables on the Subsonic Longitudinal Stability Characteristics of a High-Tail Transport Con- figuration. NASA TM X-1165, 1965.
5. White, Maurice D. ; and Cooper, George E. : Simulator Studies of the Deep Stall. Conference on Aircraft Operating Problems, NASA SP-83, 1965, pp. 101-110.
6. Taylor, Robert T. ; and Ray, Edward J. : Deep-Stall Aerodynamic Characteristics of T-Tail Aircraft. Conference on Aircraft Operating Problems , NASA SP-83, 1965, pp. 113-121.
7. Taylor, Robert T. ; and Ray, Edward J. : A Systematic Study of the Factors Con- tributing to Post-Stall Longitudinal Stability of T-Tail Transport Configurations. Paper No. 65-737, AIAA, 1965.
8. Lina, Lindsay J. ; and Mod, Martin T. : A Simulator Study of T-Tail Aircraft in Deep Stall Conditions. Paper No. 65-781, AIAA, 1965.
9. Seiner , Roy; and Rhyne , Richard H. : Some Measured Characteristics of Severe Storm Turbulence. Rep. No. 10, National Severe Storms Project, U. S. Dept. of Commerce, July 1962.
26 NASA-Langley, 1966 H-402