copper and copper alloy scrap use and trade in china … 2013/china, copperalloy...refined copper...
TRANSCRIPT

2013 ISRI Convention
April 12th 2013, Orlando, Florida, USA
Copper and Copper Alloy Scrap Use and Trade
in China and the Rest of the World
Carlos R. Risopatron
Head of Environment and Economics
International Copper Study Group
email: [email protected] www.icsg.org

Copper Scrap Use and Refined Copper Price: Annual Growth 2003-2011
-20.0%
-15.0%
-10.0%
-5.0%
0.0%
5.0%
10.0%
15.0%
20.0%
25.0%
2003 2004 2005 2006 2007 2008 2009 2010 2011 2012:Jan-
Sept
-40.0%
-20.0%
0.0%
20.0%
40.0%
60.0%
80.0%
100.0%
Secondary Refined Production (Kt-Cu) Cu Content of Direct Melt by Semis Kt-Cu LME Refined Copper Price USD/Tonne
The global use of scrap in smelters and fabricators is driven by refined copper prices.

2012: a 10% fall in refined copper prices with unreported bonded stocks in Shanghai.
The price of refined copper is driven by the global balance of refined copper.
ICSG World Refined Copper Balance and
LME Refined Price Annual Growth 1974-2012
-60.0%
-40.0%
-20.0%
0.0%
20.0%
40.0%
60.0%
80.0%
100.0%
-1,000 -800 -600 -400 -200 0 200 400 600 800 1,000
ICSG Refined Copper Balance in Tonnes
2006 miners shortage
2011
2012

World Refined Copper Demand: Million Tonnes of Copper, ICSG.
0 5 10 15 20 25
2002
2012 * Preliminary
World ex-China China
Increasing Chinese demand: the key factor driving
the global shortage of refined copper in the last decade.
1974 2012 Growth
World Refined Demand Kg per Cápita 1.93 2.94 52.3%

Scrap recyclers helped to reduce the impact of the global copper shortage.
… but most of the supply response came at the end from copper miners.

World Mine Capacity Utilization and Refined Copper Price 2002-2012. % Utilization and USD/Tonne.
0
1,000
2,000
3,000
4,000
5,000
6,000
7,000
8,000
9,000
10,000
80 82 84 86 88 90 92 94
The other key factor of the global refined market shortage
was a sharp contraction in copper mine capacity utilization.

440
183
0
50
100
150
200
250
300
350
400
450
Concentrate SX-EW
Additional World Copper Mine Production Jan-Nov 2012/2011
But in 2012 world copper mine capacity utilization jumped.
Miners increased production before expected new capacity in 2013-2014.

World Copper Mine Capacity 2012 in Kt-Cu
and Plans 2013-2016.
19,81920,388
21,343 21,52322,218 22,550
00
112747
1,978
2,956
00
689
2,214
1000
18,000
20,000
22,000
24,000
26,000
28,000
30,000
2011 2012 2013 2014 2015 2016
Operating Developing Feasibility
2013-2014 copper mine capacity projects pipeline is big as usual. 1.1 Mt-Cu in 2013, ~1 Mt-Cu in 2014, but mine output will grow slower than new capacity.
“Is time to stop building!“ Ivan Glasenberg, CEO Glencore International. (Miami, March 2013)

If copper holds a Ph.D. in economics this is the picture of the world economy.
Industrial use of copper up just in China and a few oil economies.
Country 2007 2012 Oct* Growth SourceMt Mt %
China 6.3 11.31 79.5% ICSG
United States 2.94 2.17 -26.0% ICSG
Germany 1.85 1.52 -17.7% ICSG
Japan 1.75 1.33 -23.9% ICSG
Korean Republic 1.33 1.06 -20.2% ICSG
Italy 1.75 1.03 -41.2% ICSG
Taiwan (China) 0.85 0.71 -16.4% ICSG
Spain 0.34 0.32 -4.7% ICSG
Poland 0.34 0.23 -31.4% ICSG
France 0.54 0.19 -64.5% ICSG
Slovakia 0.02 ICSG
India 0.71 0.64 -9.6% Estimate
Russian Federation 0.80 0.56 -30.2% Estimate
Turkey 0.41 0.27 -34.0% Estimate
Thailand 0.29 0.27 -5.6% Estimate
Brazil 0.37 0.23 -38.4% Estimate
Indonesia 0.20 0.22 8.5% Estimate
United Arab Emirates 0.00 0.21 100% Estimate
Saudi Arabia 0.19 0.21 8.4% Estimate
Iran 0.19 0.20 7.5% Estimate
Sample of Countries 21.1 22.7 7.4%
* 12 months before November 2012
Fabrication of Copper and Copper Alloyed Products: 2012 Versus 2007
million tonnes gross weight, other alloyed metals included

United States of America:
Monthly Semis Output
0
50
100
150
200
250
300
Jan
Feb
Mar Ap
r
May Jun
Jul
Aug
Sep
Oct
Nov
Dec
Jan
Feb
Mar Ap
r
May Jun
Jul
Aug
Sep
Oct
Nov
Dec
Jan
Feb
Mar Ap
r
May Jun
Jul
Aug
Sep
Oct
Nov
2010 2011 2012
Copper Wire Rod (sec>6mm)
Copper Alloys Plates, Sheets & Strips
Copper Tubes
Copper Alloys Bars & Profiles
Copper Plates, Sheets & Strips
Copper Bars & Profiles
Copper Wire - Other
Copper Alloys Tubes (Total)
In the USA and EU-27, copper and copper alloy fabrication continue stagnated
EU-27 Fabricators Reporting Monthly:
Recent Trends, Kt.
0
50
100
150
200
250
300
350
Oct Nov Dec Jan Feb Mar Apr May Jun Jul Aug Sep Oct
2011 2012
Germany Italy Spain Poland France Slovakia

North East Asia: Copper and Alloys Semifabrication Output
Latest Monthly Data, Kt ICSG
0
200
400
600
800
1,000
1,200
Oct Nov Dec Jan Feb Mar Apr May Jun Jul Aug Sep Oct Nov Dec
2011 2012
China
Japan
Korean Rep.
Taiwan (China)Gross Weight Numbers
Copper Alloys Included
Cu,Zn, Sn,Pb and other metals
Strong growth in China official fabrication statistics in 2012: up >12% to 11.5 Mt !
China Copper Content in Fabrication Output. Source: ICSG Consultants
-
2,000
4,000
6,000
8,000
10,000
2011 2012
Castings Copper Alloy Semis Copper Semis Copper Wire Rod
But copper content in Chinese fabrication ~9.2 Mt-Cu : just 1% growth in 2012 Chinese large semifabricators profits down around 50% in H1-2012!

China Copper Wire Rod Output and Capacity Kt-Cu
0 2,000 4,000 6,000 8,000 10,000 12,000 14,000
2009
2010
2011
2012
2013(f)
2014(f)
2015(f)
Production Capacity
China produced 5.8 Mt-Cu of copper wire rod in 2012. Another 3.3 Mt-Cu used in copper semis, brass mills and castings.
Wire rod capacity utilization around 50% and more plant capacity coming.
-
20.0
40.0
60.0
80.0
100.0
120.0
140.0
160.0
180.0
200.0Ja
n
Feb
Mar
Apr
May
Jun Jul
Aug
Sep
Oct
Nov
Dec
Jan
Feb
Mar
Apr
May
Jun Jul
Aug
Sep
Oct
Nov
Dec
Jan
Feb
Mar
Apr
May
Jun Jul
Aug
Sep
Oct
Nov
Dec
Jan
Feb
Mar
Apr
May
Jun Jul
Aug
Sep
Oct
Nov
Dec
2009 2010 2011 2012
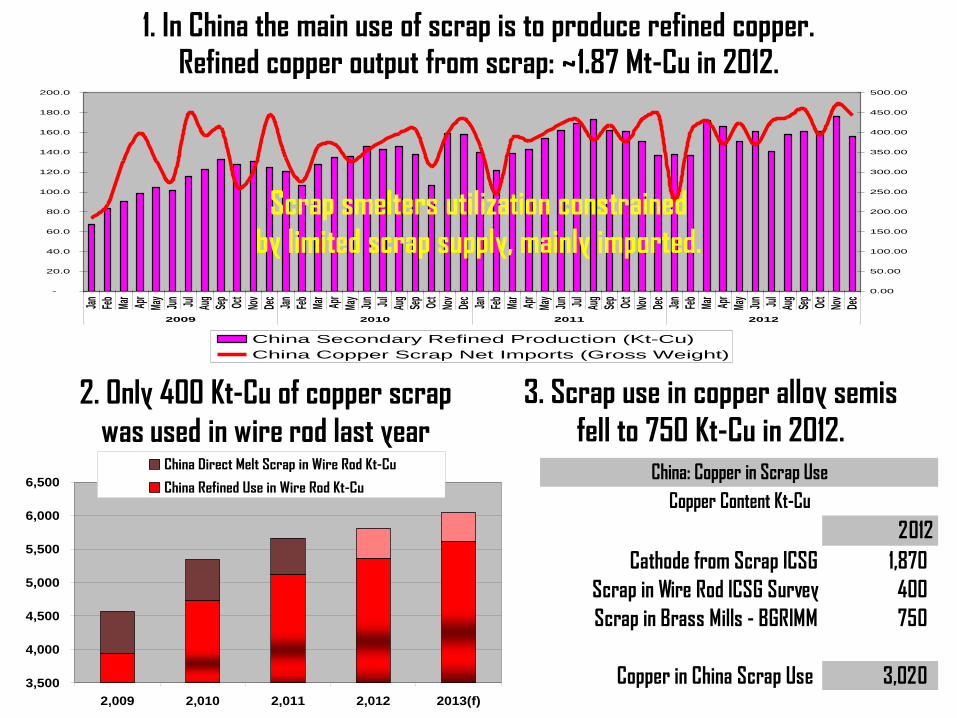
0.00
50.00
100.00
150.00
200.00
250.00
300.00
350.00
400.00
450.00
500.00
China Secondary Refined Production (Kt-Cu)
China Copper Scrap Net Imports (Gross Weight)
Scrap smelters utilization constrained
by limited scrap supply, mainly imported.
1. In China the main use of scrap is to produce refined copper. Refined copper output from scrap: ~1.87 Mt-Cu in 2012.
3,500
4,000
4,500
5,000
5,500
6,000
6,500
2,009 2,010 2,011 2,012 2013(f)
China Direct Melt Scrap in Wire Rod Kt-Cu
China Refined Use in Wire Rod Kt-Cu
2. Only 400 Kt-Cu of copper scrap
was used in wire rod last year
3. Scrap use in copper alloy semis
fell to 750 Kt-Cu in 2012.
2012
Cathode from Scrap ICSG 1,870
Scrap in Wire Rod ICSG Survey 400
Scrap in Brass Mills - BGRIMM 750
Copper in China Scrap Use 3,020
China: Copper in Scrap Use
Copper Content Kt-Cu

China 2012: Copper in Scrap Use 3.02 Mt-Cu Copper Content
62%13%
25%
Cathode from Scrap Official ICSG Scrap in Wire Rod ICSG Survey 2012 Scrap in Brass Mills BGRIMM
China Coper Scrap Supply 2011-2013 Kt-Cu
2012-2013 Forecasts
0 500 1,000 1,500 2,000 2,500 3,000 3,500
2011
2012
2013
Copper in Scrap Imports Domestic Old Scrap Domestic New Scrap
Copper in imported scrap
to China ~ 1.8 Mt-Cu in 2011,
+/- the same in 2012 !
Domestic old scrap
recycling growing slowly:
•slow GDP 2011 and 2012,
•lower copper scrap prices,
•low historic stock of copper.
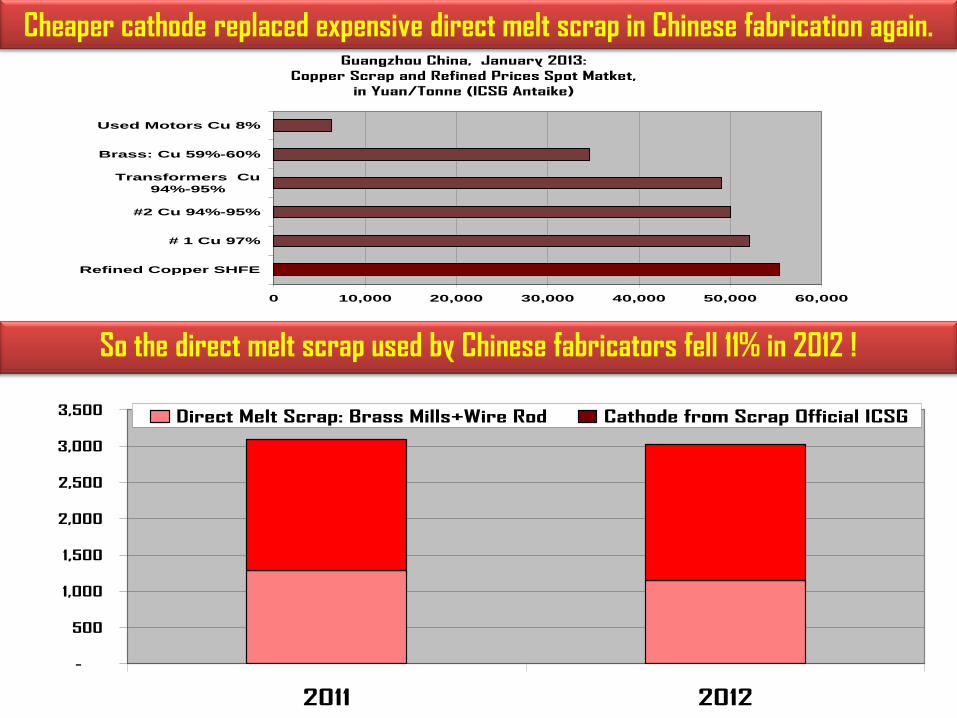
Guangzhou China, January 2013:
Copper Scrap and Refined Prices Spot Matket,
in Yuan/Tonne (ICSG Antaike)
0 10,000 20,000 30,000 40,000 50,000 60,000
Refined Copper SHFE
# 1 Cu 97%
#2 Cu 94%-95%
Transformers Cu
94%-95%
Brass: Cu 59%-60%
Used Motors Cu 8%
Cheaper cathode replaced expensive direct melt scrap in Chinese fabrication again.
So the direct melt scrap used by Chinese fabricators fell 11% in 2012 !
-
500
1,000
1,500
2,000
2,500
3,000
3,500
2011 2012
Direct Melt Scrap: Brass Mills+Wire Rod Cathode from Scrap Official ICSG

China: Annual Growth of Imported Copper
Raw Materials 2012/2011 (%)
(15.0)
(10.0)
(5.0)
0.0
5.0
10.0
15.0
20.0
25.0
Refined Copper Concentrates Scrap
Volume
Value
With lower prices, China imported more refined and concentrate than scrap in 2012 Imported copper scrap values fell in proportion to falling refined copper prices.
0
10000
20000
30000
40000
50000
60000
70000
80000
Jan.
Feb.
Mar
.
Apr
.
May
Jun.
Jul.
Aug
Sep Oct
Nov
Dec Jan
Feb
Mar
Apr
May
Jun
Jul
Aug
Sep Oct
Nov
Dec Jan
Feb
Mar
Apr
May
Jun
Jul
Aug
Sep Oct
Nov
Dec Jan
Feb
Mar
Apr
May
Jun
Jul
Aug
Sep Oct
Nov
Dec
2009 2010 2011 2012
SHFE Cash #1 copper cu 98% min #2 Copper 94%-96%
Lower refined prices increased the chronic
shortage of scrap in China.

0
500
1,000
1,500
2,000
2,500
3,000
3,500
Scrap Smelting
Capacity
2012 Scrap
Smelter Output
2012 Scrap
Refining Capacity
2012 Scrap
Refinery Output
Jiangxi Copper Tongling Group Shandong Dongying FangyuanGuangxi Nonferrous Hebei Jiangchang Copper Shandong JinshengTianyuan Copper Ningbo Jintian JinchuanDaye Non-ferrous Hefeng Copper XiangguangQingyuan Yuntong Qingyuan Smelter of JCC ShengzhouNingbo Jintian_yingtan Lanxi Zili Copper Yunnan CopperShanghai Dachang Jiangxi Jinhui Shanghai XinyeDongying Jinxi Wuhu Hengxin Group Guangzhou Zhujiang CopperDaye Dajiang Copper Tonglu Hengxin Tianjin DatongLuoyang Copper
Smelters Refineries
53.0% 61.4%
Survey: Capacity Utilization 2012
So the increasing copper scrap smelting capacity in China remains under-utilized.
Plant, Location & Technology Capacity kt/a Operating
Jinsheng Copper, Sahndong NGL 100 2013
Shandong Dahai NA 200 2013
Shandong Xinze Smalter & Refinery 200 2013
Tongling Group NGL 120 2014
Jinchian, Fangchenggang, Guangxi AUSMELT 200 2014
Yantai Humon , Shandong NGL 200 2014
Tianjing Datong Ausmelt 200 2015
Total 1,220 3 Years
China Copper Scrap Smelters Pipeline 2013-2015
Scrap smelting capacity 2013-2015:
to grow even more to >1,2 Mt-Cu
Main reason to invest:
EIA approval easier versus mine smelters.

0
1,000
2,000
3,000
4,000
5,000
6,000
7,000
8,000
2009 2010 2011 2012 2013(f) 2014(f) 2015(f)
Scrap Recovery/secondary Output China Primary Cathode Production
Refined copper output from scrap may grow faster in China…
but profits at Chinese scrap smelters are squeezed by the small spreads.
Small fabricators and smelters using scrap in China will close in late 2015 (MIIT) Small brass mills to be replaced by large copper alloy plants. Less money to new smelters.
• New Scrap Direct Melt Use Capacity • >= 50kt Allowed.
• <20kt to close by 2015.
• New Scrap Smelters Capacity • > 100 Kt Allowed.
• < 50 Kt to close by 2015.

With lower prices in 2012, global scrap exports down 4%... UK and USA most affected.
2012 Growth in Copper and Alloy Scrap,
Selected Countries, January-November
-30%
-25%
-20%
-15%
-10%
-5%
0%
5%
10%
15%
20%
United
King
dom
United
Sta
tes
Belgium
German
y
Nethe
rland
s
Fran
ce Italy
Japa
n
Copper and Alloy Scrap Net Exports: Main Net Exporters
Jan-Nov 2010-2012, Kt Gross Weight
-500
0
500
1,000
1,500
2,000
Jan-Nov 2010 Jan-Nov 2011 Jan-Nov 2012
Belgium Germany Italy Netherlands France United Kingdom United States
European Union Exports to China in 2012
Copper and Alloy Scrap Kt. Gross weight.
0
100,000
200,000
300,000
400,000
500,000
600,000
700,000
800,000
Copper Scrap Alloy ScrapIRELAND LUXEMBOURG MALTA SLOVAKIA LATVIA LITHUANIA
ESTONIA CYPRUS SWEDEN AUSTRIA HUNGARY DENMARK
GREECE BULGARIA SLOVENIA POLAND PORTUGAL ROMANIA
CZECH REPUBLIC (CS->1992) FINLAND FRANCE SPAIN BELGIUM (and LUXBG -> 1998) ITALY
UNITED KINGDOM NETHERLANDS GERMANY (incl DD from 1991)
0
200,000
400,000
600,000
800,000
1,000,000
1,200,000
EU-27 copper and alloy scrap
exports to China:
>1 Mt gross weight in 2011
989 Kt gross weight in 2012
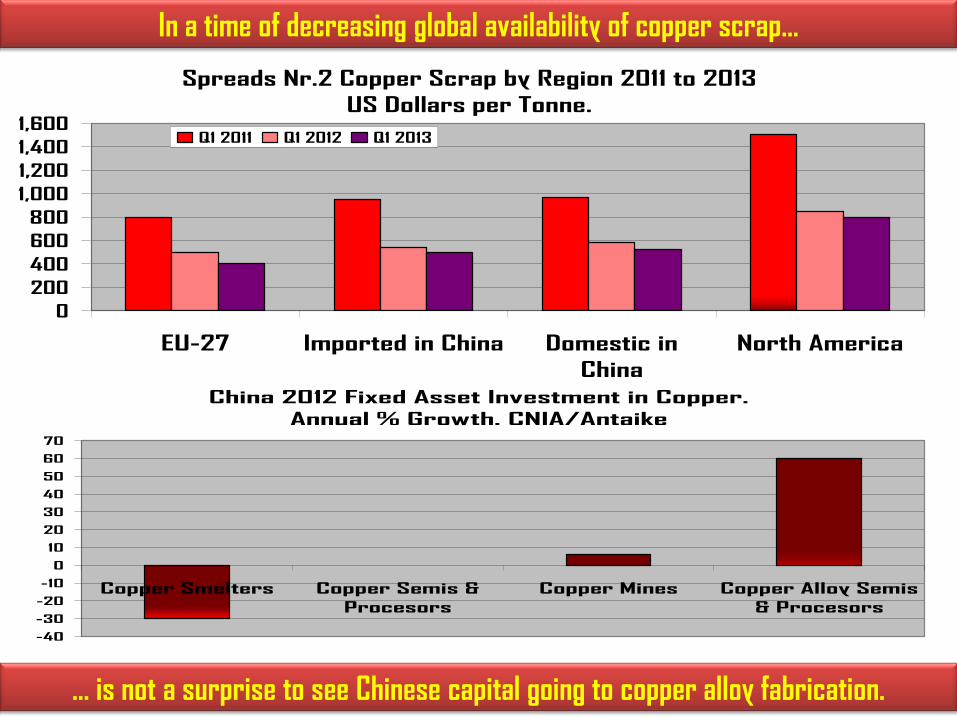
Spreads Nr.2 Copper Scrap by Region 2011 to 2013
US Dollars per Tonne.
0
200
400
600
800
1,000
1,200
1,400
1,600
EU-27 Imported in China Domestic in
China
North America
Q1 2011 Q1 2012 Q1 2013
In a time of decreasing global availability of copper scrap...
China 2012 Fixed Asset Investment in Copper.
Annual % Growth. CNIA/Antaike
-40
-30
-20
-10
0
10
20
30
40
50
60
70
Copper Smelters Copper Semis &
Procesors
Copper Mines Copper Alloy Semis
& Procesors
... is not a surprise to see Chinese capital going to copper alloy fabrication.

21
ICSG Publications Available in 2013: [email protected]
ICSG PUBLICATIONS
•The ICSG Monthly Publication: COPPER BULLETIN - 2012
•ICSG DIRECTORY OF COPPER AND COPPER ALLOY FABRICATORS - 2012
•ICSG DIRECTORY OF COPPER PLANTS AND MINES - 2012
•Access to ICSG ONLINE STATISTICAL DATABASE
The ICSG STATISTICAL YEARBOOK - 2012
•Survey on Non Ferrous Metal Use in Chinese Semifabrication Plants -2012
•Copper Scrap Supply Survey in China -2012
•Copper Scrap Market Recycling in NAFTA -2012
Study of By-products of Copper, Lead, Zinc and Nickel - 2012
ICSG Historic Recyclables Surveys - 2011
•ICSG Global Copper Scrap Research Project Final Report - 2010
•Domestic Copper Scrap Generation in China -2009
China Scrap Usage Survey to Smelters and Semis -2009
•Copper Scrap Market and International Trade in Japan -2009
•The Copper Scrap Market in India -2009
•The Chinese Copper Scrap Market -2009