copolymer compositional drift measurement - spectra … · copolymer compositional drift ......
TRANSCRIPT

www.spectra-analysis.com Spectra Analysis, Inc. 257 Simarano Drive, Marlborough, MA 01752 • Tel: +1.508.281.6232 • Fax: +1.508281.6238 • Email: [email protected]
Copolymer Compositional Drift Measurement
INSTRUMENTATION
The DiscovIR-LC is a powerful new tool for materials analysis. When connected to the outlet of a LC column, the DiscovIR deposits LC eluants as a continuous track on an infrared transparent substrate. The built-in interferometer simultaneously captures a set of time-ordered infrared spectra from the deposited track. Sample data collection and data analysis are executed by the software resident on the DiscovIR system. When analyzing polymers the chromatographic eluant is deposited as a continuous track of sample, ranging from high molecular weight to low. The deposit track is scanned by the Infrared spectrometer, and a time-ordered set of spectra obtained. Processing logic generates chromatograms of selected infrared spectral bands.
Variation across the MW distribution
DATA PROCESSING
GPC coupled to the DiscovIR can be used to characterize copolymer composition drift. A copolymer was analyzed using the DiscovIR-LC, coupled to a Gel Permeation Chromatograph. The green trace (above) is the IR Chromatogram of the polymer. Functional group chromatograms for the comonomers were generated, and processed by the algorithms described in this note. The red trace shows the changing amount of one comonomer across the GPC elution profile. In this polymer sample the styrene comonomer is seen to steadily increase with increasing elution time (decreasing mw).
DiscovIR-LC Deposition and Detection System
Application Note 18

www.spectra-analysis.com Spectra Analysis, Inc. 257 Simarano Drive, Marlborough, MA 01752 • Tel: +1.508.281.6232 • Fax: +1.508281.6238 • Email: [email protected]
1
Introduction
Polymers require a broad array of physical, thermal, and chemical properties. There is a need to be able to tailor polymer materials synthesis to specific property sets. Commercial homopolymers are limited in their ability to be adjusted for simultaneous requirements, such as elasticity, impact strength, thermal transitions, and environmental resistance. This can be addressed to an extent with polymer blends, but compatibility and possible poor qualities of any of the blend components affect the finished blend product. Copolymers provide a continuum of adjustment in the characteristics of the individual comonomer constituents, and are a flexible way to tailor product finish properties.
An aspect of copolymer synthesis that must be managed is Composition Drift: a variation of the relative amounts of comonomer species incorporated into the growing polymer chains during polymerization. Small variations in the concentration of comonomers in the reaction environment or any difference in monomer reactivities will generate composition drift during synthesis. The synthesis process must incorporate controls to either reduce composition drift, or to tailor it to a profile that yields desired product finish properties.
In copolymers, important properties like the heat distortion temperature, the decomposition temperature, and toughness do not only depend upon the molecular weight distribution, but also upon the chemical composition distribution. Some products are very intolerant of a composition drift of 3 – 5%.
Copolymers used for optical applications are one such example. Composition drift in Styrene Acrylonitrile (SAN) copolymers is undesirable, because polymer chains of differing composition are incompatible and cause phase separation, plus refractive index change with composition. The result is a hazy, rather than optically clear product1. Conversely for Gradient index lenses (GRIN) a “controlled trajectory of copolymer composition is required2.”
Other examples of desired composition drift include observations by Benkowski et al3 that random copolymer layers are effective at reinforcing bonding at polymer/polymer interfaces. Further, the induction of composition drift in random copolymers enhanced the fracture energy of the interface when compared to copolymer synthesized of uniform composition.
There are various synthesis strategies that can be employed to control the profile of composition drift.
www.spectra-analysis.com Spectra Analysis, Inc. 257 Simarano Drive, Marlborough, MA 01752 • Tel: +1.508.281.6232 • Fax: +1.508281.6238 • Email: [email protected]
1
• Composition drift is inherent in synthesis of most copolymers.
• Copolymer product properties can be controlled/optimized by controlling composition drift characteristics.
• The ability to characterize composition drift can greatly aid polymer manufacturers, processors, and end-users.
• This Application note describes a rapid and simple way to characterize composition drift in polymers. Such drift is most commonly measured against the molecular weight distribution, as determined by Gel Permeation Chromatography (GPC) of the copolymer.
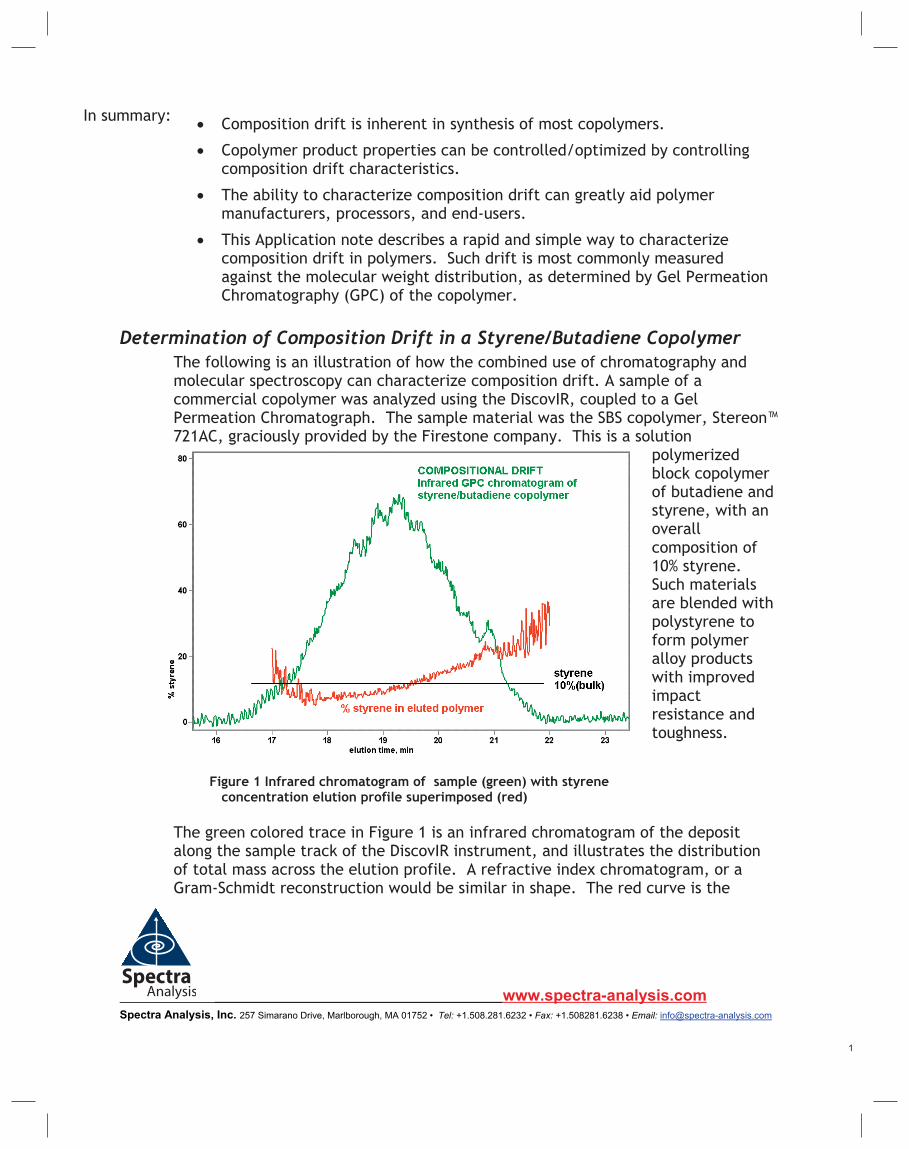
Determination of Composition Drift in a Styrene/Butadiene Copolymer The following is an illustration of how the combined use of chromatography and molecular spectroscopy can characterize composition drift. A sample of a commercial copolymer was analyzed using the DiscovIR, coupled to a Gel Permeation Chromatograph. The sample material was the SBS copolymer, Stereon™ 721AC, graciously provided by the Firestone company. This is a solution
polymerized block copolymer of butadiene and styrene, with an overall composition of 10% styrene. Such materials are blended with polystyrene to form polymer alloy products with improved impact resistance and toughness.
Figure 1 Infrared chromatogram of sample (green) with styrene
concentration elution profile superimposed (red)
The green colored trace in Figure 1 is an infrared chromatogram of the deposit along the sample track of the DiscovIR instrument, and illustrates the distribution of total mass across the elution profile. A refractive index chromatogram, or a Gram-Schmidt reconstruction would be similar in shape. The red curve is the
In summary:

www.spectra-analysis.com Spectra Analysis, Inc. 257 Simarano Drive, Marlborough, MA 01752 • Tel: +1.508.281.6232 • Fax: +1.508281.6238 • Email: [email protected]
1
processed chromatogram showing the actual (% styrene) across the elution profile. The Styrene content is lowest in the high molecular weight (earliest elution) region of the GPC separation, and steadily increases with decreasing molecular weight. This is characteristic of the compositional drift of block copolymers.
Benefits of using the DiscovIR for copolymer characterization • A fast, low-labor method for determining composition drift. Traditional
techniques of preparative chromatography, fractions collection, and multi-samples preparation can consume several days of laboratory time per sample.
• The DiscovIR-LC data system uses advanced data analysis techniques to compare continuous band chromatograms. The comparison produces a continuous assessment of spectral homogeneity and functional group distributions of both major and minor components. The information derived from this data on the minor components is often impossible to obtain with manual fraction collection techniques.
• A seamless instrumental procedure that links polymer chromatography and molecular spectroscopy into an integrated, automated instrument system.
• Analysis with a single laboratory procedure, without critical sample prep requirements.
• Data acquisition and analysis software is an integral part of the system. Processing subroutines can be incorporated into the DiscovIR software, so as to automate data acquisition and data processing of similar samples.
• The system accurately measures composition changes of a few per cent.
Experimental Column: Jordi 50 X 1 cm Mixed bed linear DVB
Mobile Phase: Tetrahydrofuran (THF)
Sample: 5 µl of12 mg/ml Firestone 721AC Styrene/Butadiene copolymer, THF solvent
Mobile phase flow rate: 1 ml/min
Column eluant was fed to the DiscovIR. The eluant was deposited as a track, which was immediately scanned to generate a time-ordered set of infrared spectra. Functional group chromatograms were generated by scanning the data set along the time axis for selected infrared bands.

www.spectra-analysis.com Spectra Analysis, Inc. 257 Simarano Drive, Marlborough, MA 01752 • Tel: +1.508.281.6232 • Fax: +1.508281.6238 • Email: [email protected]
1
Methodology Figure 2 is the infrared spectrum of a Styrene Butadiene copolymer, with four of the absorption bands marked. The three bands filled in red arise from the styrene comonomer (1605, 1493, and 698 cm-1). The green filled band (964 cm-1) is generated by the butadiene comonomer. There is no significant overlap of any of these bands by the other comonomer species.
Figure 2 Spectrum of styrene/butadiene copolymer
The DiscovIR software has the ability to generate infrared chromatographs of sample functional groups. By dividing a styrene band chromatogram by a diene band chromatogram, one generates a chromatogram of the styrene/diene composition ratio across the molecular weight distribution.
Data Analysis For the following analysis we used the 1493 cm-1 band to represent the styrene, and the 966 cm-1 band for the butadiene. In the DiscovIR Data Workbook software, this is done with a single click of the Ratio button, which generates a chromatogram for each band and the ratio chromatogram. This ratio chromatogram can be converted to a chromatogram of (% Styrene vs. time) by the following treatment.
If the materials here satisfy the Lambert-Beer law then:
(1) Aνi = ενibCνI Aνi = absorbance of component i at wavenumber ν ενi = molar absorbtivity of component i b = film thickness Ci = fraction of component i in the FTIR sample beam
At any point along the deposited chromatogram spectral peak intensity of a comonomer is the product of both concentration and deposit film thickness (equation 1). If spectral bands from each component are ratioed, however, the thickness term drops out of the fraction, and the intensity is due solely to the

www.spectra-analysis.com Spectra Analysis, Inc. 257 Simarano Drive, Marlborough, MA 01752 • Tel: +1.508.281.6232 • Fax: +1.508281.6238 • Email: [email protected]
1
relative amounts of the comonomers. This is expressed in equation (2), where absorbance ratios of two species are proportional to their mass amounts.
(2) tdiene
tstyrene
tdiene
tstyrene
tdiene
tstyrene
CC
kbCbC
kAA
,
,
,
,
,
, ==
≡tdiene
tstyrene
AA
,
, ratio of styrene/diene chromatograms
diene
styrenek,
,
ν
ν
εε
= , ratio of extinction coefficients
Note that the film thickness of equation (1) is present in the numerator and denominator, and so drops out of equation (2). If one selects wavenumbers of two different sample comonomers and generates a ratio of their chromatograms, that ratio reflects solely the relative species concentrations, and not the mass amounts at all points of the chromatogram.
The bulk styrene content of the sample was known. For the determination of k, we make use of the knowledge of the samples stated overall composition of 10% styrene and restate equation (2) as:
(3) 9.01.0
2
1,
2
1,
•=
∑
∑k
A
A
t
ttdiene
t
ttstyrene
To solve for (k), Integrate (sum) the absorbance values of the styrene chromatogram and the diene chromatogram over the GPC elution profile.
The diene chromatogram (964 cm-1) and its integral are shown in Figure 3. The maximum scalar value is obtained from the Figure 4 data, and a similar integral is obtained for the integral of the styrene absorbance chromatogram, using the 1493 cm-1 styrene absorbance band. These two integral values are used in equation (3) to determine k.
To generate a chromatogram that directly expresses the styrene comonomer as a fraction % of material, use the
Figure 3. IR Chromatogram of the diene (964 cm-1) band and its integral

www.spectra-analysis.com Spectra Analysis, Inc. 257 Simarano Drive, Marlborough, MA 01752 • Tel: +1.508.281.6232 • Fax: +1.508281.6238 • Email: [email protected]
1
following algebraic transformation.
(4) tstyrene
tstyrene
tdiene
tstyrene
tdiene
tstyrene
CC
kCC
kAA
,
,
,
,
,
,
1−==
(5) To simplify notation, let tdiene
tstyrenet A
Ak
q,
,,
1•=
(6) ( ) 1001,%, •
+=
t
ttstyrene q
qC
Data Processing summary
1. Generate an absorbance ratio chromatogram for the styrene and diene bands. (The DiscovIR software also generate/saves the individual chromatograms of the styrene and diene.)
2. Integrate the individual styrene and diene chromatograms over the elution profile, and determine the scalar value of each integral. Determine the value of k as per equation (3). See Figure 4.
3. Using the GRAMS spectral math functions, process the ratio chromatogram as per equations (5) and (6). The result is a chromatogram in which the Y-axis numeric values are expressed directly as the fraction % of styrene content.
Notes • The styrene content chromatogram is truncated on the tails of the elution curve at
approximately 5% of maximum intensity. As the “denominator” values of the peak ratio chromatogram approach zero, the ratio will become very noisy and lose information content. Truncation deletes spectral noise and any optical distortions of the very low intensity spectra.
• The example is a two–comonomer sample. Higher component copolymers can be similarly processed, provided that each species has one infrared spectral band not shared by the other comonomers.
1 Modern Styrenic Polymers: Polystyrenes and Styrenic Copolymers, Schiers J and Priddy D 2 Polymer reaction Engineering, José M. Asua 3 The Effects of Composition Drift on Random Copolymer Reinforcement of Polymer-Polymer Interfaces, Benkowski, Jason, Fredrickson, Glenn, Kramer, Edward, American Physical Society, Annual March Meeting, March 12 - 16, 2001 Washington State Convention Center Seattle, Washington Meeting ID: MAR01, abstract #C19.004
