coping with recession - higher · pdf filethe current recession coincides with the third great...
TRANSCRIPT

Coping with Recession:
Public Policy, Economic Downturnsand Higher Education
By Patrick M. Callan
February 2002
The National Center for Public Policy and Higher Education

Prepared for the Ford Policy Forum, “Forum for the Future of Higher Education,”The Aspen Institute, September 23–26, 2001.
Patrick M. Callan is president of the National Center for Public Policy and HigherEducation.
National Center Report #02-2
©2002 by The National Center for Public Policy and Higher Education.
iii
Contents
Executive Summary . . . . . . . . . . . . . . . . . . . . . . . . . . . . . . . . . . . . . . . . . . . . . . . . . iv
Introduction. . . . . . . . . . . . . . . . . . . . . . . . . . . . . . . . . . . . . . . . . . . . . . . . . . . . . . . . . 1The Context: State Budgeting and Higher Education’s Vulnerability . . . . . . . 1The Continuing Battle to Sustain Current Support for Higher Education . . . 5Recent Experience: The Recession of the Early 1990s . . . . . . . . . . . . . . . . . . . . . 8What’s Different? . . . . . . . . . . . . . . . . . . . . . . . . . . . . . . . . . . . . . . . . . . . . . . . . . . . . 8Unprecedented Enrollment Growth. . . . . . . . . . . . . . . . . . . . . . . . . . . . . . . . . . . 10The Tuition Conundrum. . . . . . . . . . . . . . . . . . . . . . . . . . . . . . . . . . . . . . . . . . . . . 13Student Support . . . . . . . . . . . . . . . . . . . . . . . . . . . . . . . . . . . . . . . . . . . . . . . . . . . . 18Concluding Observation. . . . . . . . . . . . . . . . . . . . . . . . . . . . . . . . . . . . . . . . . . . . . 20References . . . . . . . . . . . . . . . . . . . . . . . . . . . . . . . . . . . . . . . . . . . . . . . . . . . . . . . . . 21
About the National Center for Public Policy and Higher Education . . . . . . 23
Executive Summary
The current recession, which coincides with a surge in college enrollments,will test our nation’s values and priorities. If state budgets remain tight or
become even tighter—at a time when college has become the gateway to fullparticipation in American life —will the states and colleges maintain collegeopportunity for Americans?
No one can answer that question today. But a look at the recession of the1990s brings some tough lessons for state policymakers seeking to preserveopportunity for their residents:
1. When revenue shortfalls are allocated among state services, highereducation is likely to absorb larger cuts than other sectors. Publichigher education must compete with K–12 schools, welfare,Medicaid, corrections, and other services for state funding. Relativeto these other services and agencies, colleges and universities areperceived by state policymakers as having more fiscal andprogrammatic flexibility. For instance, many higher educationinstitutions have separate budgets, revenue streams, and reserves.
2. When higher education faces cuts in state funding, the state andhigher education institutions are likely to shift shortfalls tostudents and their families by raising tuition. Formulas for settingtuition are early victims of tight budgets. The steepest tuitionincreases in the public sector have occurred during recessions asstates shift their costs to users, including students and their families.
3. During a recession, states are unlikely to make new or additionalinvestments in student financial aid that will offset increases intuition. Indeed, student aid may be reduced. For example, inCalifornia over the first three years of the 1990s’ recession, state supportfor public higher education was reduced. The higher educationinstitutions raised tuition, while state-funded student financial aid wasdecreased by 15%. One result of these and related policies: California’spublic institutions served some 200,000 fewer students.
What’s Different about the Current Recession?
One difference is “good news”: the robust financial condition of higher education.National averages can conceal unevenness among sectors, institutions and states,but in general the decade of the 1990s was the best of times for public highereducation. After accounting for inflation, average revenues per student increased
Coping with Recession
iv

to an all-time high during the decade. But there are three significant challenges:
1. Enrollment Growth and Diversity. States that experience budgetshortfalls in this decade will face a situation quite different from thatin the last recession: the new fiscal constraints will come during aperiod of growing enrollment demand. Over the next 10 years thestudent body will also become increasingly diverse. It will includelarger proportions of students from low-income families and fromhistorically underrepresented ethnic groups.
2. The Dilemmas of Tuition Policy. Tuition for public higher educationis on a roller-coaster pattern: When state funding is sufficient, tuitiontends to remain stable or is even reduced. But when higher revenuesare needed or when state support falls below expectations, tuition isincreased. One generation of students coasts downhill with stable oreven declining real tuition charges; the next labors uphill with theincreased price. And it’s the students who enroll during difficulteconomic conditions who face the uphill climb.
3. The Mismatches Between Public Policies of the 1990s and theNeeds of the New Decade. During the next decade, the cohort ofprospective students will include larger proportions of students fromlow-income families and underrepresented ethnic groups. Yet themajor policy initiatives of the 1990s in higher education did not focuson the needs of these groups. Many states established or increasedsupport of non–means tested (“merit”) student aid programs. At thefederal level, establishing the tuition tax credits was the majorinitiative of the 1990s. Both merit-based student aid and tuition taxcredits are likely to have at most a marginal impact on the enrollmentof underserved populations; these programs generally benefit thosewith middle- and upper-middle incomes.
The Stakes Have Never Been Greater
The current recession coincides with the third great wave of college enrollments.This generation of students will be the most ethnically heterogeneous—and thepoorest—ever to seek higher education. It will require extraordinary effort forstates and colleges and universities to meet the needs of these students, even ifthe economy avoids a prolonged downturn. The public policy initiatives of the1990s did not position the states to meet the demands of the coming decade.Nevertheless, the assets that states and their colleges and universities bring to thisnew era should not be underestimated. What will the states and colleges chooseto protect during a time of difficult choices? The stakes in maintaining andenhancing college opportunity have never been greater.
Coping with Recession
v


INTRODUCTION
This essay is about recessions and the major policy considerations that statesand institutions must face in the current economic downturn. I will discuss thepublic policy implications of three major variables in the course of the essay:(1) each of the 50 states has a unique higher education system; (2) each statealso has unique revenue and budgetary processes; and (3) each recession is aunique, unpredictable event with its own unique causes, impacts, andduration. To these variables, one must add such conditions as a state’sdemographic characteristics and economic trends.
My focus will be on higher education policy, and I cannot overemphasize itsimportance. Skeptics will tell you that state public policy is a myth, and thatpolitics is all there is. Politics is certainly more visible than policy, but policy isjust as real. State policies look to desirable, even ideal, outcomes. In contrast,state politics look to the practical and the feasible, and political considerationsweigh heavily on elected state officials who must make the key decisions aboutfunding public services. The politics of scarcity are very different from thepolitics of prosperity— and different in ways that are often inimical to financialsupport of higher education.
State higher education policy, therefore, will be the setting for this essay.Within this setting, my observations are not guided by any generally acceptedconcept (if indeed there is one) that explains the complex interactions betweengovernment and higher education institutions. Rather, I first want to describecertain aspects of state financing of colleges and universities, focusing on thosethat were most affected by the recession in the early 1990s. Then I will discussselected aspects of the current recession, particularly how it differs from earlierones. I will close with a final observation on the present recession.
THE CONTEXT: STATE BUDGETING AND HIGHER EDUCATION’SVULNERABILITY
The great variety of state budgetary and higher education structures mayprevent us from finding broadly applicable methods to cope with recession, butwe can generalize about policy initiatives, past and prospective. A principalstory of American higher education has been one of growth: growth inenrollments, in the number of public institutions of higher education, and instate support for these institutions. Such growth would not have occurred
Coping with Recession
1
The politics ofscarcity arevery differentfrom thepolitics ofprosperity—and different inways that areoften inimicalto financialsupport ofhighereducation.

without positive federal and state public policy initiatives. The results justifythe policies—for example, the percentage of people in the United States 25years of age and older who have at least a bachelor’s degree has increased fromjust over 20% to just over 25% during the past decade.1 But we must not forgetthat in the early 1990s, during the recession, higher education was sometimes insevere competition with other state services for financial support.2
In this part of the essay, I will describe the state financing structures andpolicies that support public higher education, then I will discuss economicprojections that suggest these structures can cause financial stress for highereducation in the near future, and finally I will touch on major aspects of therecession of the early 1990s.
The Structure of State Revenues
Under our federal system, responsibility for education is with the 50 states. (Inmany other countries, education is under national control.) Federal initiatives—in particular, the Land Grant legislation and the G.I. Bill—were seminal policyactions. It was the individual states, however, that implemented the historicexpansions of opportunity. Each state responded based on its own uniquepolitical and social conditions—for example, Land Grant status may be withthe state’s major public research university, as in California and Illinois; with aseparate public university, as in Iowa and Michigan; or with an independentuniversity, as in New York.
This diversity of state higher education structures is mirrored by thediversity of state revenue structures. These revenue structures are distinguishedfrom that of the federal government by their low elasticity—that is, state andlocal revenues from existing taxes do not grow as rapidly as personal income,while federal revenues grow more rapidly. The major reason for the differenceis the heavy reliance of many states on sales taxes—taxes on goods sold.During the period of prosperity from 1992 to 1997, the increase in state revenuefrom state and local taxes soared, rising on average by 31%. In 1997 sales taxes
Coping with Recession
2
This diversity ofstate higher
educationstructures is
mirrored by thediversity of
state revenuestructures.
1 U.S. Bureau of the Census, as reported in ”Economic Focus: Educational Attainment,”The Wall Street Journal, Aug. 22, 2001, p. B8.2 Harold A. Hovey, State Spending for Higher Education in the Next Decade: The Battle toSustain Current Support (San Jose: National Center for Public Policy and HigherEducation, July 1999), p. 8.

represented 40.9% of state and local revenue, and property taxes 34.2%; incometaxes accounted for only 24.8% of state revenues.3
These national averages tell a story about state revenues, but they alsoobscure important differences that have implications for managing statebudgets and determining state policy. For instance, New Hampshire derives78% of its state and local revenue from property taxes, while Alabama derivesonly 15% from that source. Nevada, on the other hand, derives 75% of its staterevenue from sales taxes, but in Oregon only 13% comes from that source.Delaware relies on income tax to provide 54% of state revenues and SouthDakota and Texas have no income tax at all.4 These differences determine howstates are affected by, respond to, and ultimately recover from recessions.
Public higher education—including funding for student financial aid—must compete with other state services for its share of available funds. Becauseall the states but one are required to have a balanced budget, a gain for onelegitimate, worthy state service—say, Medicaid—means less for another—say,higher education. National data, for example, show that in 1987 Medicaidreceived slightly over 10% of state spending, and higher education receivedslightly over 12%. By 1990, however, spending for Medicaid slightly exceededthat for higher education, and by 1995 Medicaid’s share was more than 19%and higher education’s share just over 10%. For fiscal 2002 state governors haverecommended an increase of some $25.1 billion for prescription drugs underMedicaid—almost double the amount spent in fiscal 1998.5 This example is notan isolated one.
Higher education’s declining share of state expenditures does not representany deliberate policy decision to substantially curtail state funding. Indeed,state support for higher education has often increased in absolute dollars, evenas its share declined. The reasons for the decline in share can be found in thenature of the competition for state funds, the growth of other state services,political priorities, and the perceptions of key state officials. In his detailedassessment of the competitors for state funds, Harold Hovey looked at the
Coping with Recession
3
3 Kendra A. Hovey and Harold A. Hovey, CQ’s State Fact Finder 2001 (Washington,D.C.: CQ Press, 2001).4 Ibid. 5National Governors Association and National Association of State Budget Officers,The Fiscal Survey of the States (Washington, D.C.: June 2001), pp. vii and 14.
Highereducation’sdeclining shareof stateexpendituresdoes notrepresent anydeliberatepolicy decisionto substantiallycurtail statefunding.

Coping with Recession
4
public schools, which receive the largest share—roughly one-third of stateexpenditures—and noted that:
This group is politically formidable because it does many thingsthat public higher education does very little of or not at all: (1)active lobbying from the grass roots while legislators are insession; (2) endorsement of candidates; (3) support of endorsedcandidates with campaign workers and campaign contributions;and (4) retaliation against perceived opponents by such devicesas supporting opponents in primary challenges and generalelections.6
He might have added that public school leaders are often less reluctant thanhigher education leaders to publicly oppose tax cuts that threaten their stateappropriations.
The impact of Medicaid on other state services is well known. As theNational Governors Association notes, “Because of the large percentage of statebudgets that Medicaid commands, Medicaid spending increases are feltthroughout state government, affecting resources allocated for other keyservices, such as education.”7
Like the public schools, Medicaid enjoys a political edge over highereducation. Hovey explains how changing Medicaid eligibility standards toreduce state expenditures would mean risking the publicity of throwing elderlynursing home residents “out on the street.”8
Higher education’s competitive position is also weakened by the perceptionsof governors, legislators, and key executive and legislative staff members.Relative to other state services and agencies, colleges and universities are seen ashaving fiscal and programmatic flexibility. Unlike other state agencies, manyhigher education institutions have separate budgets and reserves of their own.Campuses are also assumed to be able to absorb temporary fiscal adversity bytranslating budget cuts into payroll cuts, since many campuses are not bound bycollective bargaining agreements. Unlike state agencies whose programs haverelatively fixed spending levels (some set in statute, others mandated by courtdecisions and federal requirements), colleges and universities can save money
6Hovey, State Spending for Higher Education, p. 42.7National Governors Association, Fiscal Survey of the States, p. 13.8Hovey, State Spending for Higher Education, p. 44.

by increasing class sizes and changing course offerings—and even by reducingenrollments. Higher education can also shift costs to students and their familiesby raising tuition.9 Ironically, the fairly recent tendency on the part of somecolleges and universities to characterize themselves as “state related” and “stateaffiliated,” in hopes of attracting private support, may also undermine theperception of state responsibility for their support.
Although higher education is vulnerable in the competition for stateresources, it nevertheless entered the new millennium with several years ofhistorically unprecedented increases in state appropriations.10 It is stilluncertain whether these recent gains are now threatened, but it is clear that2001 may mark the end of higher education’s very best of financial times.11
Some 17 states faced budget shortfalls in fiscal 2001.12 I do not know all thecauses of these current difficulties, nor will I speculate on whether they indicatejust a blip, a short-term recession, the beginning of a long-term economicdownturn, or a new plateau. I do believe, however, that regardless of the effectsof the current recession, the medium-term fiscal prospects of highereducation—public higher education, particularly—are quite problematic.
THE CONTINUING BATTLE TO SUSTAIN CURRENT SUPPORT FOR HIGHER
EDUCATION
In 1999 Harold Hovey, one of the nation’s leading analysts of public finance,examined the consequences of the inelasticity of state revenue structures.13 Aspersonal incomes rise, people spend incrementally less on taxed goods andmore for nontaxed services, and thus increases in state revenues do not keeppace with increases in personal income. At the same time, however, the costs ofmaintaining state services increase—owing to demography, workloadformulas, inflation, and other factors—and they increase at a faster rate thanthe revenues available to support them. The result is that for every increase of
Coping with Recession
5
9Ibid., p. 20.10Corina Eckl and Arturo Pérez, “State Budget & Tax Actions 2001—PreliminaryReport,” NCSL News (Denver: National Conference of State Legislators, Aug. 1, 2001),p. 4; National Governors Association, Fiscal Survey of the States, p. 1.11”Colleges Brace for the Economic Downturn,” a Special Report in The Chronicle ofHigher Education, Apr. 20, 2001, pp. A10–18.12Eckl and Pérez, “State Budget & Tax Actions 2001,” p. 1.13Harold A. Hovey, State Spending for Higher Education. My discussion also relies heavilyon Steven D. Gold, ed., The Fiscal Crisis of the States: Lessons for the Future (Washington,D.C.: Georgetown University Press, 1995).

10% in personal income—the cost of current services in the base year—stateand local tax revenues rise only by about 9.5%.14
Hovey projected that, based on maintaining current services over eightyears from 1998, the cost of state programmatic financial commitments wouldexceed state revenues in 39 states and that in the eighth year the average“structural deficit” for the 50 states would be 3.8% (see Table 1). In other words,the data from 1998 indicated that most states were living above their long-termmeans. (Some states have since enacted tax cuts.)
Coping with Recession
6
14Hovey, State Spending for Higher Education, p. 6.
State and Local Surplus (or Shortfall) as a Percentage of Baseline RevenuesIn Year Eight of Fiscal Projections
Rank State Percent Rank State Percent
1 Iowa 2.7 27 North Carolina –3.72 Nebraska 1.5 United States –3.83 North Dakota 0.9 28 Utah –4.34 Ohio 0.9 29 South Carolina –4.65 Kentucky 0.5 30 Vermont –4.66 Connecticut 0.4 31 Alabama –4.87 Michigan 0.4 32 South Dakota –5.08 New York 0.3 33 Indiana –5.79 Maine 0.1 34 Montana –5.7
10 Minnesota 0.1 35 Georgia –6.511 Massachusetts 0.0 36 Washington –6.712 Oregon –0.1 37 Virginia –6.813 Illinois –0.4 38 Colorado –7.014 Pennsylvania –1.3 39 Maryland –7.115 West Virginia –1.4 40 Texas –7.816 Wisconsin –1.5 41 New Hampshire –8.217 Missouri –1.8 42 Florida –8.818 Kansas –1.9 43 Tennessee –9.119 Mississippi –2.0 44 Arizona –10.520 Oklahoma –2.1 45 Wyoming –10.621 Arkansas –2.3 46 New Mexico –12.022 Louisiana –2.5 47 Idaho –13.223 California –2.8 48 Hawaii –15.124 Rhode Island –2.9 49 Alaska –16.425 Delaware –3.0 50 Nevada –18.326 New Jersey –3.3
Source: Hovey, State Spending for Higher Education, p. 10.
%%
Table 1

Coping with Recession
7
Hovey’s projections were made during the high point ofeconomic prosperity. These projections did not assume, Imust emphasize, a major recession, but rather only an endto the economic boom and an eventual return to the normalgrowth patterns of the previous quarter century. Hovey’sprojections were not embraced enthusiastically by eitherpolitical or higher education leaders. The clear implicationwas that a day of reckoning for most states would come— aday when either taxes would have to be increased orbudgets would have to be cut in order to maintain currentservices. Like most of us, elected officials tend to ignore badnews about the future.
Hovey also predicted that state higher educationbudgets would be uniquely vulnerable when the day ofreckoning arrived, even if the country experienced a returnto normal growth rates and no significant downturn orrecession. If state budgetmakers asked higher education toabsorb only its proportional share of reduced revenuegrowth, college appropriations would fall, on the average,approximately 0.5% short of the amount needed tomaintain current services. New initiatives could not besupported without commensurate reductions in basebudgets. Maintaining higher education’s current sharewould call for a major reversal of trends over the lastquarter century. States would have to increase theirappropriations for higher education, on the average, at arate 1 percentage point above appropriations for other stateand local spending over the eight-year period. In a third ofthe states, the annual growth of state higher educationspending would have to exceed growth in other stateprograms by 2 percentage points or more (see Table 2).
In other words, the rates of expenditure growth in themid and late 1990s were not sustainable, even in normaleconomic times. Between 1993 and 1998, a period thatHovey characterized as “about as good as it gets in statefunding of higher education,” college and universityappropriations increased at rates that exceeded enrollment
1 Vermont 5.3 41.0% 83.32 Nevada 4.9 75.4 114.83 Hawaii 4.3 45.3 79.54 New Mexico 3.3 52.2 78.95 Arizona 3.3 60.6 86.96 South Dakota 3.2 40.2 65.77 Wisconsin 3.0 36.9 60.88 Florida 2.9 46.3 69.69 Minnesota 2.8 38.0 60.3
10 Kansas 2.8 37.2 59.211 Washington 2.7 44.9 66.412 Connecticut 2.4 31.8 51.113 Maryland 2.4 40.5 59.614 New Hampshire 2.2 44.5 62.015 Iowa 2.1 32.0 48.716 Oklahoma 2.1 33.7 50.417 Alaska 2.1 43.6 60.318 Pennsylvania 1.9 32.5 47.419 Montana 1.7 43.1 56.720 Colorado 1.7 50.8 64.221 California 1.7 38.9 52.322 Rhode Island 1.6 33.7 46.823 North Dakota 1.5 33.2 45.024 Oregon 1.4 43.2 54.825 Nebraska 1.4 35.9 47.426 Missouri 1.3 36.9 47.527 Delaware 1.3 43.8 54.328 Louisiana 1.3 33.3 43.7
United States 1.0 39.5 47.729 New York 1.0 32.5 40.530 Georgia 0.8 50.0 56.431 Massachusetts 0.8 36.1 42.332 Texas 0.7 45.5 51.533 Idaho 0.6 57.8 62.334 Virginia 0.5 41.6 45.735 Wyoming 0.3 42.4 44.536 Utah 0.1 51.0 52.137 Michigan 0.1 31.7 32.638 Illinois 0.0 33.4 33.839 Tennessee 0.0 45.4 45.440 Maine –0.1 31.3 30.441 Ohio –0.2 32.1 30.542 Indiana –0.2 38.7 36.743 New Jersey –0.5 37.1 33.344 Arkansas –0.5 40.2 36.245 South Carolina –0.5 40.0 36.046 Alabama –0.6 38.9 34.347 Kentucky –0.8 35.4 28.648 Mississippi –0.9 37.4 30.549 West Virginia –0.9 29.4 22.050 North Carolina –1.3 45.9 35.3
Spending Increases Needed Over Eight YearsTo Maintain Level of Services in 1998
Annual Extra Eight-Year SpendingBudget Growth Rate
Rank State Growth Neededfor Higher All HigherEducation* Programs Education
Table 2
%
*Positive values indicate that maintaining current services will require statespending for higher education to increase at a faster rate than that forother state programs. Negative values indicate that the state is projectedto be able to maintain current services by increasing spending for highereducation at a slower rate than that for other programs.
Source: Hovey, State Spending for Higher Education, p. 15.
%

Coping with Recession
8
growth or inflation.15 The structure of state finance, as well as historical andpolitical patterns, suggest higher education’s vulnerability to economicslowdown or recession.
RECENT EXPERIENCE: THE RECESSION OF THE EARLY 1990S
For additional insights into the political and fiscal dimensions of state finance,we need look no further than the national recession of the early 1990s.16 At leastfive generalizations are of significance:
• A national recession affects each state differently: In the early 1990s, therecession was very severe in the Northeast and in California, but it hadrelatively little impact in many other states.
• Although a national recession may be short, individual states may facefinancial stress for much longer periods.
• During a national recession, individual states may face financial stressfor a number of other reasons. Among such factors in the early 1990s:rising Medicaid costs, new federal mandates, higher public schoolenrollments, court rulings, voter initiatives, inelastic tax systems, andcorrections policy.
• When states face fiscal constraints, the impacts on state services varyacross states, within states, and among service sectors.
• When revenue shortfalls are allocated among state services, highereducation is likely to be required to absorb proportionately larger cutsthan other sectors. When this happens, the state and higher educationinstitutions are likely to shift shortfalls to students and their families byraising tuition.
Will these generalizations from the last recession be useful in the currentsituation? I do not know, but I do know that when higher education has to facethe impact of a recession, it will do so under different conditions and policiesthan it did in the early 1990s.
WHAT’S DIFFERENT?
The structural characteristics of state finances and state higher education
15Hovey, State Spending for Higher Education, p. 8.16My discussion of the early 1990s recession draws heavily on two studies: Gold, TheFiscal Crisis of the States and Patrick M. Callan and Joni E. Finney, eds., Public and PrivateFinancing of Higher Education: Shaping Public Policy for the Future (Washington, D.C.:American Council on Education/Oryx Press, 1997).

finance have not changed significantly since the recession of the early 1990s.Other factors, however — demographic in part, policy driven in part — will bedifferent and will influence state and higher education responses.
One difference is “good news”: the robust financial condition of highereducation at the beginning of the new century. The decade of the 1990s was indeedthe best of times for public highereducation. Average revenues per studentincreased (in constant dollars) to an all-time high of $14,459 in 1998 (see Figure1). State appropriations and tuition andfees account for about 70% of revenuesfor public colleges and universities. Statesupport, after declining in the late 1980sand early 1990s, increased faster thaninflation and enrollment growth in themiddle and late 1990s. Revenues fromtuition also reached an historic high in1998. These trends continued throughthe end of the decade. From 1998 to 2000,as reported by researchers at Illinois StateUniversity, state appropriations per FTE(full-time-equivalent) student, measuredin constant dollars, increased by 14.5%.17
Tuition at public institutions alsocontinued to increase from 1998 to 2000,by 7% in four-year public institutionsand by 10% in community colleges.18
Of course, these national averagesconceal unevenness and varyingpatterns of support among sectors,institutions and states, and even withinstates. They also mask the bumpy rideof public finance for many states and
Coping with Recession
9
17Grapevine: A National Database of Tax Support for Higher Education (Normal, IL: Centerfor Higher Education and Educational Finance, Illinois State University, 1999–2001).Internet publication: http://www.coe.ilstu.edu/grapevine/. 18The College Board, Trends in College Pricing, 2001 (New York: College BoardPublications, 2001), p. 15.
Figure 1
Revenues for Public Institutions per Full-Time-Equivalent Student(In Constant Dollars)
Sources: Finance figures: National Center for Education Statistics, Current Fund Revenues and Expenditures of Higher Education, Fiscal Years 1980–1988, 1987–1995, 1996; Current Fund Revenues and Expenditures of Degree Granting Institutions, Fiscal Year 1996; Integrated Postsecondary Education Data System—Peer Analysis Program (2000). Full-time-equivalent enrollment figures: National Center for Education Statistics, Digest of Education Statistics, years 1984 through 2000. Current Price Index: U.S. Bureau of Labor Statistics, Current Price Index for All Urban Consumers.
1980 Total:$10,570
1998 Total:$14,459
$0
$3,000
$6,000
$9,000
$12,000
$15,000
Tuition and Fees
State Governments
Federal Government
Local Governments
1980
1982
1984
1986
1988
1990
1992
1994
1996
1998
Other Sources
$2,000
$3,512
$6,747
$5,989

institutions that suffered the most during the recession in the early 1990s andthen benefited the most in the boom times of the middle and late 1990s.Nevertheless, the national data indicate that—whatever the future may hold—public higher education entered the new century financially strong. Stateappropriations held steady and increased modestly during the 1980s and 1990s.Fears and allegations of state disinvestment were false alarms. Tuition and feesdid rise considerably faster than appropriations and other revenue sourcesduring this period, and higher education’s share of state appropriations did fallin most states. But the states maintained and improved their support for highereducation over these years, and the financial condition of public highereducation was significantly strengthened.
I now turn to three less-heartening changes that have taken place since thelast recession: the challenges of enrollment growth, the dilemmas of tuitionpolicy, and the “mismatches” between the public policies of the 1990s and theneeds of the new decade.
UNPRECEDENTED ENROLLMENT GROWTH
States that experience substantial budget shortfalls within this decade will facea situation quite different from that in the last recession: the new fiscalconstraints will come during a period of growing enrollment demand. (Duringthe 1990s recession, in contrast, higher education enrollments were relativelystable.) Over the next 10 years the student body will also become increasinglymore diverse.
The number of high school graduates began to increase in the mid-1990sand will continue to increase through 2008, when the nation will graduate thelargest public high school class in its history—3.2 million students—exceedingthe class of 1979, the peak year of the baby boom, by more than 60,000graduates. The class of 2008 will include 332,000 graduates from private highschools (an increase of about 30% over the mid-1990s).19
Having more high school graduates will mean, of course, more collegeapplicants, and the nation’s colleges and universities are expected to experience
Coping with Recession
10
19Western Interstate Commission for Higher Education and The College Board,Knocking at the College Door (Boulder: WICHE, Feb. 1999), pp. 1–4.
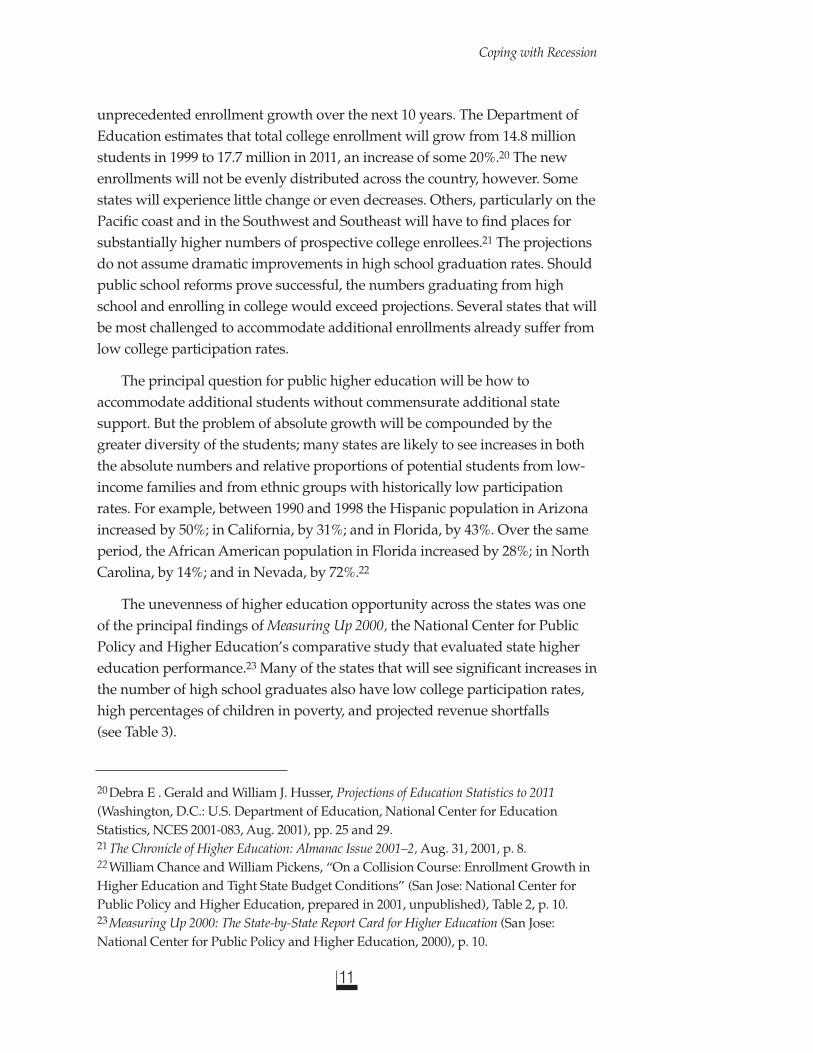
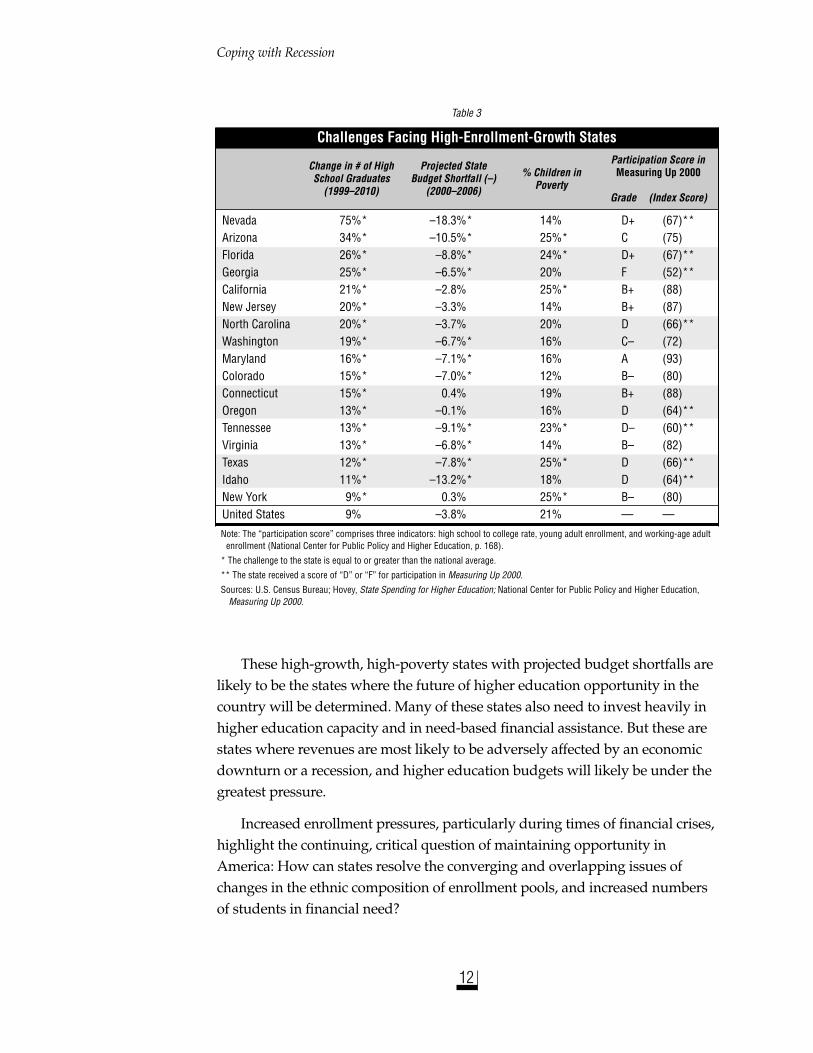
unprecedented enrollment growth over the next 10 years. The Department ofEducation estimates that total college enrollment will grow from 14.8 millionstudents in 1999 to 17.7 million in 2011, an increase of some 20%.20 The newenrollments will not be evenly distributed across the country, however. Somestates will experience little change or even decreases. Others, particularly on thePacific coast and in the Southwest and Southeast will have to find places forsubstantially higher numbers of prospective college enrollees.21 The projectionsdo not assume dramatic improvements in high school graduation rates. Shouldpublic school reforms prove successful, the numbers graduating from highschool and enrolling in college would exceed projections. Several states that willbe most challenged to accommodate additional enrollments already suffer fromlow college participation rates.
The principal question for public higher education will be how toaccommodate additional students without commensurate additional statesupport. But the problem of absolute growth will be compounded by thegreater diversity of the students; many states are likely to see increases in boththe absolute numbers and relative proportions of potential students from low-income families and from ethnic groups with historically low participationrates. For example, between 1990 and 1998 the Hispanic population in Arizonaincreased by 50%; in California, by 31%; and in Florida, by 43%. Over the sameperiod, the African American population in Florida increased by 28%; in NorthCarolina, by 14%; and in Nevada, by 72%.22
The unevenness of higher education opportunity across the states was oneof the principal findings of Measuring Up 2000, the National Center for PublicPolicy and Higher Education’s comparative study that evaluated state highereducation performance.23 Many of the states that will see significant increases inthe number of high school graduates also have low college participation rates,high percentages of children in poverty, and projected revenue shortfalls(see Table 3).
Coping with Recession
11
20Debra E . Gerald and William J. Husser, Projections of Education Statistics to 2011(Washington, D.C.: U.S. Department of Education, National Center for EducationStatistics, NCES 2001-083, Aug. 2001), pp. 25 and 29.21The Chronicle of Higher Education: Almanac Issue 2001–2, Aug. 31, 2001, p. 8.22William Chance and William Pickens, “On a Collision Course: Enrollment Growth inHigher Education and Tight State Budget Conditions” (San Jose: National Center forPublic Policy and Higher Education, prepared in 2001, unpublished), Table 2, p. 10. 23Measuring Up 2000: The State-by-State Report Card for Higher Education (San Jose:National Center for Public Policy and Higher Education, 2000), p. 10.
Nevada 75%* –18.3%* 14% D+ (67)**Arizona 34%* –10.5%* 25%* C (75)Florida 26%* –8.8%* 24%* D+ (67)**Georgia 25%* –6.5%* 20% F (52)**California 21%* –2.8% 25%* B+ (88)New Jersey 20%* –3.3% 14% B+ (87)North Carolina 20%* –3.7% 20% D (66)**Washington 19%* –6.7%* 16% C– (72)Maryland 16%* –7.1%* 16% A (93)Colorado 15%* –7.0%* 12% B– (80)Connecticut 15%* 0.4% 19% B+ (88)Oregon 13%* –0.1% 16% D (64)**Tennessee 13%* –9.1%* 23%* D– (60)**Virginia 13%* –6.8%* 14% B– (82)Texas 12%* –7.8%* 25%* D (66)**Idaho 11%* –13.2%* 18% D (64)**New York 9%* 0.3% 25%* B– (80)United States 9%* –3.8% 21% — —
Note: The “participation score” comprises three indicators: high school to college rate, young adult enrollment, and working-age adultenrollment (National Center for Public Policy and Higher Education, p. 168).
* The challenge to the state is equal to or greater than the national average.
** The state received a score of “D” or “F” for participation in Measuring Up 2000.
Sources: U.S. Census Bureau; Hovey, State Spending for Higher Education; National Center for Public Policy and Higher Education,Measuring Up 2000.
These high-growth, high-poverty states with projected budget shortfalls arelikely to be the states where the future of higher education opportunity in thecountry will be determined. Many of these states also need to invest heavily inhigher education capacity and in need-based financial assistance. But these arestates where revenues are most likely to be adversely affected by an economicdownturn or a recession, and higher education budgets will likely be under thegreatest pressure.
Increased enrollment pressures, particularly during times of financial crises,highlight the continuing, critical question of maintaining opportunity inAmerica: How can states resolve the converging and overlapping issues ofchanges in the ethnic composition of enrollment pools, and increased numbersof students in financial need?
Coping with Recession
12
Challenges Facing High-Enrollment-Growth States
Change in # of High Projected State% Children in
Participation Score in
School Graduates Budget Shortfall (–)Poverty
Measuring Up 2000
(1999–2010) (2000–2006)Grade (Index Score)
Table 3

THE TUITION CONUNDRUM
Setting tuition, the price that students andtheir families must pay to attend a publiccollege, is a problem that seems to defyrational solution—or even broadagreement about what would constitute“rationality.” There is probably no otherpublic policy issue in higher education onwhich the great preponderance of expertopinion—policy experts, scholars andmany higher education leaders—is socompletely at odds with the preferences ofthe American public. Policy expertsoverwhelming favor “high tuition––highfinancial aid” strategies that wouldconcentrate public subsidies on those leastable to afford college. While there is littlesupport for free public higher education,the general public consistently favors lowto moderate tuition with financialassistance for qualified and motivatedstudents who are unable to afford college.24
Since 1980, tuition at public and privateinstitutions has risen significantly (see Figure 2). As discussed earlier in thisessay, the structure of state finances and the exigencies of state politics squeezehigher education budgets when state revenues decline. States and collegestypically fill this revenue gap with tuition. The steepest tuition increases haveoccurred in times of economic hardship (see Figure 3)—times when personalincome declines, unemployment rises, and public economic anxiety is high.This is probably one major reason for the political unpopularity of tuition
Coping with Recession
13
24 See John Immerwahr and Steve Farkas, The Closing Gateway: Californians Consider TheirHigher Education System (San Jose: The California Higher Education Policy Center, Sept.1993); John Immerwahr, Enduring Values, Changing Concerns: What Californians Expect fromTheir Higher Education System (San Jose: The California Higher Education Policy Center,Feb. 1997); John Immerwahr, The Price of Admission: The Growing Importance of HigherEducation (San Jose: National Center for Public Policy and Higher Education, 1998).
131%128%
117%
Figure 2
Percentage Change in Tuition Since 1971, All Institutions(In Constant Dollars)
Source: The College Board, Trends in College Pricing 2001.
0%
20%
40%
60%
80%
100%
120%
140%
1980
1982
1984
1986
1988
1990
1992
1994
1996
1998
2000
Private Four-Year
Public Two-Year
Public Four-Year

increases. When sharp tuition increases areenacted to fill gaps in state revenues, theyrarely adhere to the “high tuition–high aid”model. The freed state dollars—rather thanbeing used to increase need-based financialaid for college students—are expended tosupport programs of higher politicalsalience, such as Medicaid, public schoolsand corrections. In both good times andhard times, state and federal financial aidhave lost ground to tuition (see Figure 4).
During good economic times, the reason-able and salutary principle that increases intuition should be gradual, moderate, andpredictable is not difficult to follow. But arecession is defined by economic changesthat are sudden, large, and unpredictable.Recent history has shown that:
• Formulas for setting tuition are earlyvictims of a recession.
• The steepest tuition increases in thepublic sector have occurred duringrecessions as states seek to shift their
costs to users, including students and their families. The followingcomments, from a 1976 study,25 illustrate this cost-shifting strategy:
Campus administrators were very outspoken against tuitionincreases until the legislature indicated that these would be theonly source of new money. They changed their minds fast.
—Panel of university chief budget officers
Essentially, there will be level funding for 1976–77, offset in partby a portion of amounts that governing boards are able to raiseby increased tuition and fees.
—State budget officer
Coping with Recession
14
25Frank M. Bowen and Lyman A. Glenny, State Budgeting for Higher Education: StateFiscal Stringency and Public Higher Education (Berkeley: Center for Research andDevelopment in Higher Education, 1976), p. 60.
Early 1980s Recession
Early 1990s Recession
Figure 3
Percentage Change in Income and Public College Tuition from Previous Year
Sources: Income: U.S. Bureau of the Census, "Median Income for Four Person Families, By State" (2001). Tuition: Washington State Higher Education Coordinating Board, Tuition and Fee Rates: A National Comparison, volumes 1985, 1990, 1995, 2000.
0%
2%
4%
6%
8%
10%
12%
14%
16%
18%
1981
19
83
1985
19
87
1989
19
91
1993
19
95
1997
19
99
Income
Tuition
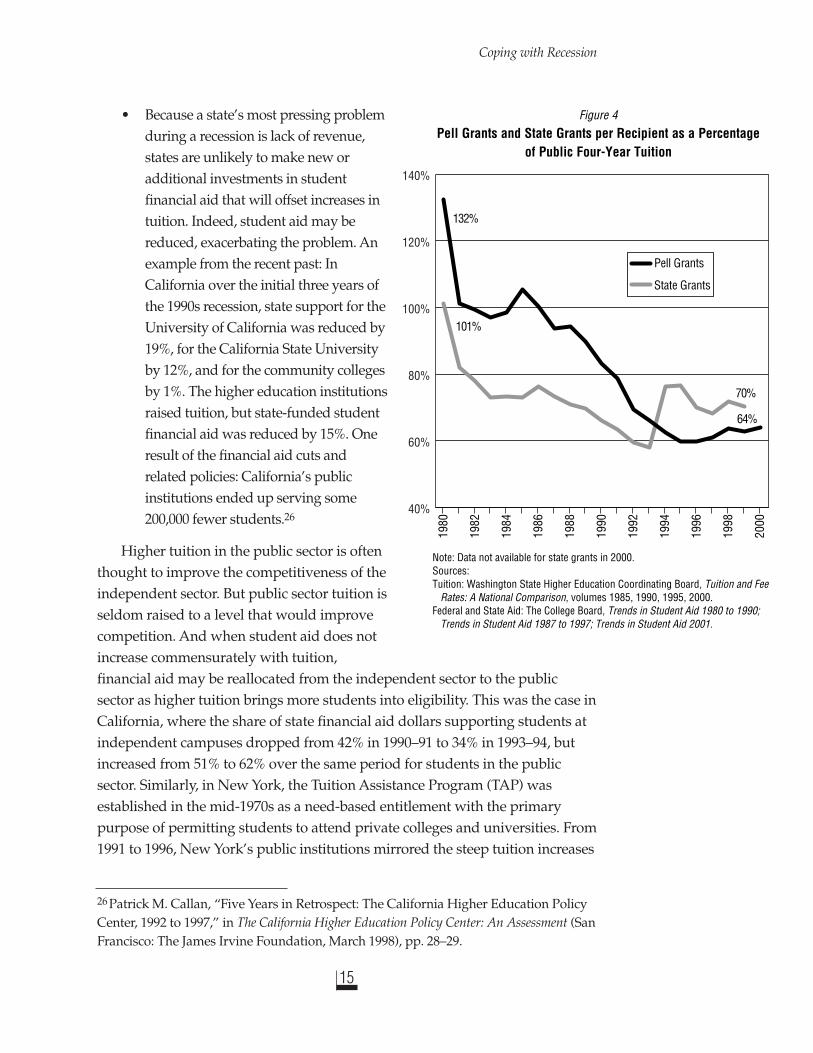
• Because a state’s most pressing problemduring a recession is lack of revenue,states are unlikely to make new oradditional investments in studentfinancial aid that will offset increases intuition. Indeed, student aid may bereduced, exacerbating the problem. Anexample from the recent past: InCalifornia over the initial three years ofthe 1990s recession, state support for theUniversity of California was reduced by19%, for the California State Universityby 12%, and for the community collegesby 1%. The higher education institutionsraised tuition, but state-funded studentfinancial aid was reduced by 15%. Oneresult of the financial aid cuts andrelated policies: California’s publicinstitutions ended up serving some200,000 fewer students.26
Higher tuition in the public sector is oftenthought to improve the competitiveness of theindependent sector. But public sector tuition isseldom raised to a level that would improvecompetition. And when student aid does notincrease commensurately with tuition,financial aid may be reallocated from the independent sector to the publicsector as higher tuition brings more students into eligibility. This was the case inCalifornia, where the share of state financial aid dollars supporting students atindependent campuses dropped from 42% in 1990–91 to 34% in 1993–94, butincreased from 51% to 62% over the same period for students in the publicsector. Similarly, in New York, the Tuition Assistance Program (TAP) wasestablished in the mid-1970s as a need-based entitlement with the primarypurpose of permitting students to attend private colleges and universities. From1991 to 1996, New York’s public institutions mirrored the steep tuition increases
Coping with Recession
15
26Patrick M. Callan, “Five Years in Retrospect: The California Higher Education PolicyCenter, 1992 to 1997,” in The California Higher Education Policy Center: An Assessment (SanFrancisco: The James Irvine Foundation, March 1998), pp. 28–29.
40%
60%
80%
100%
120%
140%
132%
64%
70%
101%
Figure 4
Pell Grants and State Grants per Recipient as a Percentageof Public Four-Year Tuition
Note: Data not available for state grants in 2000. Sources: Tuition: Washington State Higher Education Coordinating Board, Tuition and Fee Rates: A National Comparison, volumes 1985, 1990, 1995, 2000. Federal and State Aid: The College Board, Trends in Student Aid 1980 to 1990; Trends in Student Aid 1987 to 1997; Trends in Student Aid 2001.
1980
19
82
1984
19
86
1988
19
90
1992
19
94
1996
19
98
2000
Pell Grants
State Grants

seen throughout the country. TAP expenditures to CUNY and SUNY studentsincreased by 180% and 97%, respectively, while expenditures to undergraduatesat independent institutions increased only 7%. By 1996 more TAP funding wassupporting students at New York’s public institutions than students atindependent institutions. When TAP was established, its maximum award paidfor approximately half the average tuition at independent institutions, but in1996 it covered only 26%.27
Public higher education tuition is on a roller-coaster pattern because,regardless of formulas, it remains stable or is even reduced when state fundsare sufficient to cover the cost of education. But when institutional costs rise tothe point that higher revenues are needed or when state support decreases orfalls below expectations, tuition is increased. One generation of students coastsdownhill with stable or even declining real tuition charges; the next laborsuphill with the increased price. In difficult economic times, all attempts torationalize tuition policies founder. But the roller-coaster pattern continues:during a recession students pay higher tuition, and their successors may benefitfrom a backlash that reduces the price.
The Politics of Tuition
Tuition increases are likely to remain an important tool in the repertoire of stateand institutional response to recession. But the experience of the 1990s isinstructive, for it reveals the political limits of this tool, and the force of thebacklash when the public believes that increases have been excessive. In NewYork State, between 1990 and 1995 tuition increased from 4.2% to 7.7% ofmedian household income; in California, the increase was from 1.7% to 3.1%.28
Public opinion research during this period of economic volatility showed thatthe middle class in particular feared that higher education, just when it seemedmore essential than ever, was becoming less accessible. As middle-class familiesweighed in on this issue, elected officials, first at the state and then at the federallevel, began searching for ways to relieve public apprehensions. By the mid-1990s, of the five states that had raised tuition by the largest percentages from1990 to 1995 (California, Massachusetts, New York, Oregon, and Virginia), fourhad frozen tuition or slowed the rate of growth significantly. Tuition rollbacks
Coping with Recession
16
27Callan and Finney, Public and Private Financing, pp. 97, 218, and 219. 28 Kent Halstead, State Profiles: Financing Public Higher Education 1978 to 1976(Washington, D.C.: Research Associates of Washington, 1998), pp. 11 and 67.
In difficulteconomictimes, all
attempts torationalize
tuition policiesfounder.
Coping with Recession
17
followed in several states; most of them occurred after the economic crisis hadpassed, financial aid had been restored, and lost enrollment had been recovered,but public resentment remained. Governor Pete Wilson of California andGovernor George Pataki of New York had supported steep tuition increases in theearly and mid-1990s. Faced with adverse public opinion, and with reelectioncampaigns before them (Wilson in 1994; Pataki in 1998), both governors backedaway from their earlier positions. In Wilson’s case, this meant reneging on anagreement with public college and university leaders that called for annualtuition increases of up to 10%.29 Prior to Wilson’s reversal (and perhapsaccounting for it in part), Gray Davis, the gubernatorial candidate who succeededWilson in 1998, proposed an amendment to the state constitution that would havefrozen tuition and restricted future increases.
While tuition freezes and rollbacks were under way in some states, othersinitiated new programs of student support, programs that were not means-tested, and that provided new subsidies to middle-income students. At aboutthat time, based on focus group information, President Clinton featuredmiddle-class tax credits in his 1996 reelection campaign. I will comment onthese programs in the next section. It is sufficient here to note that theseprograms came in the wake of steep tuition increases and public opinion pollsreflecting middle-class anxiety over the price of a college education.
A final word on public opinion. In an afterword to a national public opinionsurvey published in May 2000, Deborah Wadsworth, president of the PublicAgenda organization commented: “For most Americans, higher education is apublic policy success story.” She then identified some future scenarios “thatmight cloud the public’s current rosy outlook.” The first of these, “problemswith affordability,” merits quotation in full:
If large numbers of American families begin to feel that they can nolonger afford to send their youngsters to college, higher educationmight easily become a “hot button” for the public. Toughereconomic times that force colleges and universities to raise pricesor reduce admissions could affect the public’s view that anyonewho really wants a college education can get one. What’s more,tougher economic times might well increase families’ anxiety
29Mario C. Martinez and Thad Nodine, “California: Financing Higher Education AmidPolicy Drift,” in Public and Private Financing of Higher Education, edited by Patrick M.Callan and Joni E. Finney (Washington, D.C.: American Council on Education/OryxPress, 1997), p. 94.

Coping with Recession
about their ability to cover their share of college expenses, as wellas the availability of jobs for themselves and their children justcoming out of college. Graduates’ willingness and ability toshoulder substantial loans could drop dramatically in a lesshospitable job market. An economic downsizing could upset theapple cart; cash-strapped Americans would likely greet any sign ofdiminishing access or rising costs with dismay. As we have seen,Americans see higher education as the gateway to a good job andmiddle class lifestyle. If that gateway is threatened, we mightexpect to see considerable public distress.30
STUDENT SUPPORT
Generous state financial support in the 1990s left higher education in soundfinancial condition at the end of the decade. As discussed in earlier sections, inthe coming decades many states that have had low college participation rateswill be faced with significantly higher enrollment demand. And the cohort ofprospective students will include larger proportions of students from low-income families and from historically underrepresented ethnic groups. Whencollege finances were healthy in the 1990s, it might have been expected thatnew state programs would have focused on these needs of the latter groups. Itis clear that the new programs did not.
Instead, the major initiatives in many states were the establishment andsupport of non–means tested (“merit”) student aid programs. States respondedto middle-class financial anxiety about college costs, to concerns about “braindrain”—the migration of high-achieving high school graduates to out-of-statecolleges—and to the attraction of rewarding student achievement. Theseprograms grew rapidly. From 1996–97 to 1999–2000, state non-need-basedfinancial aid increased by 90%, from $459 million to $873 million; state need-based aid grew by 24%, from $2.6 billion to $3.2 billion.31 The structures of themerit programs vary considerably across states, but most are likely to have at
18
30 John Immerwahr and Tony Foleno, Great Expectations: How the Public and Parents—White, African American and Hispanic—View Higher Education. (San Jose: National Centerfor Public Policy and Higher Education, May 2000), pp. 33–34.31 National Association of State Grant and Aid Programs, 28th Annual Survey Report,1996–97 Academic Year (Albany, NY: New York State Higher Education ServicesCorporation, March 1998), table 1; and 31st Annual Survey Report, 1999–2000 Academic Year(Albany, NY: New York State Higher Education Services Corporation, April 2001), table 1.
Coping with Recession
most a marginal impact on the enrollment of underserved populations. Instead,these increasingly well-financed programs with politically potent middle-classbeneficiaries now compete with need-based financial aid for state support, acompetition that is certain to intensify during a recession.
At the federal level, a program for tuition tax credits was the major initiativeof the 1990s. The beneficiaries are families with taxable incomes between$40,000 and $90,000, particularly those with students at colleges that chargehigh tuition. What appears to be an unintended consequence is that states withlow-tuition public colleges and universities can shift costs to the federalgovernment by raising tuition and encouraging eligible students and families toclaim the credit. However, only students and families who owe taxes areeligible; lower-income students and their families who do not owe taxes are noteligible.32 Most states and public institutions have not yet raised tuition tocapture this new federal subsidy, probably because of the relatively generousstate appropriations of recent years and the political unpopularity of tuitionincreases. In a recession, however, it is unlikely that states or public colleges anduniversities will leave this federal subsidy “on the table,” even though tuitionincreases to capture the subsidy will impede access for low-income studentswithout increases in need-based student financial aid. However, recent historysuggests that recessions are the time when states are least likely to make suchinvestments. And federal tax credits may make it easier to reduce statesubsidies for higher education, and to shift support to other parts of the statebudget. At the federal level, need-based student aid, unlike tax credits, mustcompete with other domestic programs in the annual appropriations process, acompetition that inevitably intensifies during recessions.
It is not the purpose of this essay to evaluate these state and federalinitiatives. Whatever their merits, they represent another variable in thecomplexities of public financing for higher education. In responding to therecession, states will face enormous difficulties in understanding and workingwith the interactions among state grant programs, federal grant and tax creditprograms, institutional aid, student qualifications, and family tax liabilities. I donot envy their task.
19
32 See Kristin D. Conklin, Federal Tax Credits and State Higher Education Policy (San Jose:National Center for Public Policy and Higher Education, Dec. 1998).
Coping with Recession
20
CONCLUDING OBSERVATION
The current recession coincides with the third great wave of collegeenrollments. The first was the G.I.s after World War II; then their children, thebaby boomers. The current cohort includes many who, like the G.I.s, will be thefirst in their family to seek college admission. This generation of students willbe the most racially and ethnically heterogeneous— and the poorest— ever toseek higher education. And these students arrive at a time when postsecondaryeducation and training are essential for full participation in the civic, economic,and social life of America—for, if you will, participation in middle-class life.
It will require extraordinary effort on the part of states and colleges anduniversities to meet the needs of these students, even if the economy avoids amajor, prolonged recession. The public policy initiatives of the 1990s did notposition the states to meet the demands of the coming decade. Someinitiatives—merit aid for students of affluent families, tax credits that excludelow-income Americans—may come to be remembered as public policy’scontribution to “irrational exuberance.”
Nevertheless, the assets that states and their colleges and universities bringto this new era should not be underestimated. Unlike the 1960s, most of thecapacity to accommodate the new enrollments already exists. The financialcondition of public higher education is generally strong. Public confidence inthe enterprise is high.
Recession will test our nation’s values and priorities. What will the statesand the colleges choose to protect during a time of difficult choices? Collegehas become the gateway to full participation in American life, and the stakesin maintaining and enhancing college opportunity have never been greater.

Coping with Recession
21
References
Bowen, Frank M., and Lyman A. Glenny. State Budgeting for Higher Education: State FiscalStringency and Public Higher Education. Berkeley: Center for Research and Development inHigher Education, 1976.
Callan, Patrick M. “Five Years in Retrospect: The California Higher Education Policy Center, 1992to 1997.” In The California Higher Education Policy Center: An Assessment. San Francisco: TheJames Irvine Foundation, March 1998.
Callan, Patrick M., and Joni E. Finney, eds. Public and Private Financing of Higher Education: ShapingPublic Policy for the Future. Washington, D.C.: American Council on Education/Oryx Press,1997.
Chance, William, and William Pickens. “On a Collision Course: Enrollment Growth in HigherEducation and Tight State Budget Conditions.” San Jose: National Center for Public Policyand Higher Education, prepared in 2001, unpublished.
The Chronicle of Higher Education, Almanac Issue 2001–02, Aug. 31, 2001.The College Board. Trends in College Pricing 2001. New York: College Board Publications, 2001. ———. Trends in Student Aid 1980 to 1990 (1990); Trends in Student Aid 1987 to 1997 (1997); Trends in
Student Aid 2001 (2001). New York: College Board Publications. “Colleges Brace for the Economic Downturn.” The Chronicle of Higher Education, April 20, 2001.Conklin, Kristin D. Federal Tax Credits and State Higher Education Policy. San Jose: National Center
for Public Policy and Higher Education, Dec. 1998.“Economic Focus: Educational Attainment.” The Wall Street Journal, Aug. 22, 2001, p. B8. Eckl, Corina, and Arturo Pérez. “State Budget & Tax Actions 2001—Preliminary Report.” NCSL
News. Denver: National Conference of State Legislators, Aug. 1, 2001.“Economic Focus: Educational Attainment.” The Wall Street Journal, Aug. 22, 2001.Gerald, Debra E., and William J. Husser. Projections of Education Statistics to 2011. Washington,
D.C.: U.S. Department of Education, National Center for Education Statistics, NCES 2001-083, Aug. 2001.
Gold, Steven D., ed. The Fiscal Crisis of the States: Lessons for the Future. Washington, D.C.:Georgetown University Press, 1995.
Grapevine: A National Database of Tax Support for Higher Education. Normal, IL: Center for HigherEducation and Educational Finance, Illinois State University, 1997–2000. (Internetpublication: http://www.coe.ilstu.edu/grapevine/.)
Halstead, Kent. State Profiles: Financing Public Higher Education 1978 to 1995. Washington, D.C.:Research Associates of Washington, 1998.
Hovey, Harold A. State Spending for Higher Education in the Next Decade: The Battle to SustainCurrent Support. San Jose: National Center for Public Policy and Higher Education, July 1999.
Hovey, Kendra A., and Harold A. Hovey. CQ’s State Fact Finder 2001. Washington, D.C.: CQ Press,2001.
Immerwahr, John. Enduring Values, Changing Concerns: What Californians Expect from Their HigherEducation System. San Jose: The California Higher Education Policy Center, Feb. 1997.
———. The Price of Admission, The Growing Importance of Higher Education. San Jose: NationalCenter for Public Policy and Higher Education, 1998.
Immerwahr, John, and Steve Farkas. The Closing Gateway: Californians Consider Their HigherEducation System. San Jose: The California Higher Education Policy Center, Sept. 1993.
Immerwahr, John, and Tony Foleno. Great Expectations: How the Public and Parents—White, AfricanAmerican and Hispanic—View Higher Education. San Jose: National Center for Public Policyand Higher Education, May 2000.
Martinez, Mario C. and Thad Nodine. “California: Financing Higher Education Amid PolicyDrift,” in Public and Private Financing of Higher Education, edited by Patrick M. Callan and JoniE. Finney. Washington, D.C.: American Council on Education/Oryx Press, 1997.
National Association of State Grant and Aid Programs. 28th Annual Survey Report, 1996–97Academic Year. Albany: New York State Higher Education Services Corporation, March 1998.
———. 31st Annual Survey Report, 1999–2000 Academic Year. Albany: New York State HigherEducation Services Corporation, April 2001.
National Center for Education Statistics. Current Fund Revenues and Expenditures of Degree GrantingInstitutions: Fiscal Year 1996. E.D. Tab. Washington, D.C.: U.S. Department of Education, 1999.
———. Current Fund Revenues and Expenditures of Higher Education: Fiscal Years 1980 through 1988(1991); Fiscal Years 1987 through 1995 (1997); Fiscal Year 1996 (1999). E.D. Tab. Washington,D.C.: U.S. Department of Education.
———. Digest of Education Statistics, years 1984 through 2000. Washington, D.C.: U.S. Departmentof Education, annual volumes 1985 to 2001.
———. Integrated Postsecondary Education Data System—Peer Analysis Program. E.D. Tab.Washington, D.C.: U.S. Department of Education, 2000.http://nces.ed.gov/ipedspas/index.asp, accessed on Sept. 15, 2001.
National Center for Public Policy and Higher Education. Measuring Up 2000: The State-by-StateReport Card for Higher Education. San Jose: 2000.
National Governors Association and National Association of State Budget Officers, The FiscalSurvey of the States. Washington, D.C.: June 2001.
U.S. Bureau of the Census. “Median Income for Four Person Families, By State.” Washington,D.C.: Census Bureau, 2001. http://www.census.gov/hhes/income/4person.html, accessedon September 20, 2001.
U.S. Bureau of Labor Statistics. Current Price Index for All Urban Consumers. Washington, D.C.: U.S.Department of Commerce, Bureau of Labor Statistics, 2001.http://www.bls.gov/cpi/home.htm, accessed on September 15, 2001.
Washington State Higher Education Coordinating Board. Tuition and Fee Rates: A NationalComparison. Olympia, WA: volumes 1985, 1990, 1995, 2000.
Western Interstate Commission for Higher Education and the College Board, Knocking at theCollege Door. Boulder: Feb. 1999.
Coping with Recession
22

THE NATIONAL CENTER FOR PUBLIC POLICY AND HIGHER EDUCATION
The National Center for Public Policy and Higher Education promotes public policiesthat enhance Americans’ opportunities to pursue and achieve high-quality educationand training beyond high school. As an independent, nonprofit, nonpartisanorganization, the National Center prepares action-oriented analyses of pressing policyissues facing the states and the nation regarding opportunity and achievement in highereducation—including two- and four-year, public and private, for-profit and nonprofitinstitutions. The National Center communicates performance results and key findingsto the public, to civic, business and higher education leaders, and to state and federalleaders who are poised to improve higher education policy.
Established in 1998, the National Center is not affiliated with any institution ofhigher education, with any political party, or with any government agency; it receivescontinuing, core financial support from a consortium of national foundations thatincludes The Pew Charitable Trusts, The Atlantic Philanthropies, and The FordFoundation.
152 North Third Street, Suite 705, San Jose, California 95112Telephone: 408-271-2699 • FAX: 408-271-2697
www.highereducation.org
National Center Publications
The National Center publishes:
★ Reports and analyses commissioned by the National Center,
★ Reports and analyses written by National Center staff,
★ National Center Policy Reports that are approved by the National Center’sBoard of Directors, and
★ CrossTalk, a quarterly publication.
The following National Center publications—as well as a host of other information andlinks—are available at www.highereducation.org. Single copies of most of thesereports are also available from the National Center. Please FAX requests to 408-271-2697and ask for the report by publication number. Measuring Up 2000 is available by calling888-269-3652.
Coping with Recession: Public Policy, Economic Downturns and Higher Education, by PatrickM. Callan (February 2002, #02-2). Outlines the major policy considerations that states andinstitutions of higher education face during economic downturns.
Competition and Collaboration in California Higher Education, by Kathy Reeves Bracco andPatrick M. Callan (January 2002, #02-1). Argues that the structure of California’s state highereducation system limits the system’s capacity for collaboration.
Measuring Up 2000: The State-by-State Report Card for Higher Education (November 2000, #00-3). This first-of-its-kind report card grades each state on its performance in higher education. The
Coping with Recession
23

24
Coping with Recession
report card also provides comprehensive profiles of each state and brief states-at-a-glancecomparisons. Visit www.highereducation.org to download Measuring Up 2000 or to make yourown comparisons of state performance in higher education. Printed copies are available for$25.00 by calling 888-269-3652 (discounts available for large orders).
Beneath the Surface: A Statistical Analysis of the Major Variables Associated with StateGrades in Measuring Up 2000, by Alisa F. Cunningham and Jane V. Wellman (November2001, #01-4). Using statistical analysis, this report explores the “drivers” that predict overallperformance in Measuring Up 2000.
Supplementary Analysis for Measuring Up 2000: An Exploratory Report, by Mario Martinez(November 2001, #01-3). Explores the relationships within and between the performancecategories in Measuring Up 2000.
Some Next Steps for States: A Follow-up to Measuring Up 2000, by Dennis Jones and KarenPaulson (June 2001, #01-2). What are the next steps states can take to improve performance inhigher education? This report provides an introduction to the kinds of actions states can taketo bridge the gap between the performance areas identified in Measuring Up 2000 and theformulation of effective policy.
A Review of Tests Performed on the Data in Measuring Up 2000, by Peter Ewell (June 2001,#01-1). Describes the statistical testing performed on the data in Measuring Up 2000 by theNational Center for Higher Education Management Systems.
Recent State Policy Initiatives in Education: A Supplement to Measuring Up 2000, by AimsMcGuinness, Jr. (December 2000, #00-6). Highlights education initiatives that states haveadopted since 1997–98.
Assessing Student Learning Outcomes: A Supplement to Measuring Up 2000, by Peter Ewelland Paula Ries (December 2000, #00-5). National survey of state efforts to assess studentlearning outcomes in higher education.
Technical Guide Documenting Methodology, Indicators and Data Sources for Measuring Up2000 (November 2000, #00-4).
A State-by-State Report Card on Higher Education: Prospectus (March 2000, #00-1).Summarizes the goals of the National Center’s report card project.
Great Expectations: How the Public and Parents—White, African American and Hispanic—View Higher Education, by John Immerwahr with Tony Foleno (May 2000, #00-2). This report byPublic Agenda finds that Americans overwhelmingly see higher education as essential forsuccess. Survey results are also available for the following states:
Great Expectations: How Pennsylvanians View Higher Education (May 2000, #00-2b)Great Expectations: How Floridians View Higher Education (August 2000, #00-2c)Great Expectations: How Coloradans View Higher Education (August 2000, #00-2d)Great Expectations: How Californians View Higher Education (August 2000, #00-2e)Great Expectations: How New Yorkers View Higher Education (October 2000, #00-2f)Great Expectations: How Illinois Residents View Higher Education (October 2000, #00-2h)
State Spending for Higher Education in the Next Decade: The Battle to Sustain Current Support,by Harold A. Hovey (July 1999, #99-3). This fiscal forecast of state and local spending patternsfinds that the vast majority of states will face significant fiscal deficits over the next eight years,which will in turn lead to increased scrutiny of higher education in almost all states, and tocurtailed spending for public higher education in many states.
Coping with Recession
25
South Dakota: Developing Policy-Driven Change in Higher Education, by Mario Martinez (June1999, #99-2). Describes the processes for change in higher education that government, businessand higher education leaders are creating and implementing in South Dakota.
Taking Responsibility: Leaders’ Expectations of Higher Education, by John Immerwahr (January1999, #99-1). Reports the views of those most involved with decision-making about highereducation, based on a survey and focus groups conducted by Public Agenda.
The Challenges and Opportunities Facing Higher Education: An Agenda for Policy Research, byDennis Jones, Peter Ewell, and Aims McGuinness (December 1998, #98-8). Argues that due tosubstantial changes in the landscape of postsecondary education, new state-level policyframeworks must be developed and implemented.
Higher Education Governance: Balancing Institutional and Market Influences, by Richard C.Richardson, Jr., Kathy Reeves Bracco, Patrick M. Callan, and Joni E. Finney (November 1998, #98-7). Describes the structural relationships that affect institutional effectiveness in higher education,and argues that state policy should strive for a balance between institutional and market forces.
Federal Tuition Tax Credits and State Higher Education Policy: A Guide for State Policy Makers,by Kristin D. Conklin (December 1998, #98-6). Examines the implications of the federal incometax provisions for students and their families, and makes recommendations for state highereducation policy.
The Challenges Facing California Higher Education: A Memorandum to the Next Governor ofCalifornia, by David W. Breneman (September 1998, #98-5). Argues that California shoulddevelop a new Master Plan for Higher Education.
Tidal Wave II Revisited: A Review of Earlier Enrollment Projections for California HigherEducation, by Gerald C. Hayward, David W. Breneman and Leobardo F. Estrada (September1998, #98-4). Finds that earlier forecasts of a surge in higher education enrollments were accurate.
Organizing for Learning: The View from the Governor’s Office, by James B. Hunt Jr., chair of theNational Center for Public Policy and Higher Education, and former governor of North Carolina(June 1998, #98-3). An address to the American Association for Higher Education concerningopportunity in higher education.
The Price of Admission: The Growing Importance of Higher Education, by John Immerwahr(Spring 1998, #98-2). A national survey of Americans’ views on higher education, conducted andreported by Public Agenda.
Concept Paper: A National Center to Address Higher Education Policy, by Patrick M. Callan(March 1998, #98-1). Describes the purposes of the National Center for Public Policy and HigherEducation.
www.highereducation.org
