coping with change - nber
TRANSCRIPT

NBER WORKING PAPER SERIES
COPING WITH CHANGE:INTERNATIONAL DIFFERENCES IN THE RETURNS TO SKILLS
Eric A. HanushekGuido Schwerdt
Simon WiederholdLudger Woessmann
Working Paper 22657http://www.nber.org/papers/w22657
NATIONAL BUREAU OF ECONOMIC RESEARCH1050 Massachusetts Avenue
Cambridge, MA 02138September 2016
Wiederhold and Woessmann gratefully acknowledge financial support from the Leibniz Association through the project “Acquisition and Utilization of Adult Skills.” The views expressed herein are those of the authors and do not necessarily reflect the views of the National Bureau of Economic Research.
NBER working papers are circulated for discussion and comment purposes. They have not been peer-reviewed or been subject to the review by the NBER Board of Directors that accompanies official NBER publications.
© 2016 by Eric A. Hanushek, Guido Schwerdt, Simon Wiederhold, and Ludger Woessmann. All rights reserved. Short sections of text, not to exceed two paragraphs, may be quoted without explicit permission provided that full credit, including © notice, is given to the source.
Coping with Change: International Differences in the Returns to SkillsEric A. Hanushek, Guido Schwerdt, Simon Wiederhold, and Ludger WoessmannNBER Working Paper No. 22657September 2016JEL No. I20,J31,O15
ABSTRACT
Expanded international data from the PIAAC survey of adult skills allow us to analyze potential sources of the cross-country variation of comparably estimated labor-market returns to skills in a more diverse set of 32 countries. Returns to skills are systematically larger in countries that have grown faster in the recent past, consistent with models where skills are particularly important for adaptation to dynamic economic change.
Eric A. HanushekHoover InstitutionStanford UniversityStanford, CA 94305-6010and [email protected]
Guido SchwerdtDepartment of EconomicsUniversity of KonstanzBox 13378457 [email protected]
Simon WiederholdCatholic University Eichstaett-IngolstadtIfo Institute for Economic Research and CESifo Poschingerstr. 5 81679 [email protected]
Ludger WoessmannUniversity of MunichIfo Institute for Economic Research and CESifoPoschingerstr. 581679 Munich, [email protected]
1
Introduction
The persuasive hypothesis that a prime value of education is the ability to adapt to a changed
economic environment (Nelson and Phelps (1966), Welch (1970), Schultz (1975)) has actually
received little testing. While developed in somewhat different ways, the underlying idea is that
different economic conditions require worker adjustment and that a fundamental attribute of
education and skill is providing the ability to adapt to emerging disequilibria and to prosper in
new environments. The relevant economic changes can come from a variety of factors including
capital deepening, technological change, and altered industrial structure. To test this, we suggest
that international comparisons provide clearer evidence on this hypothesis than within-country
analyses because of the better picture of broad differences in the economic environment.
The most direct evidence on the relationship between returns to education and adaption to
changed economic environments is narrow and specialized, coming from analysis of farmer
decisions. Welch (1970) first considers the relationship between agricultural profitability and
farmer education, and this is extended in models of adoption of new technologies by Foster and
Rosenzweig (1996) and others. The key to these types of analyses is the ability to observe
distinct new technologies. Other investigations, while suggestive, offer less clear evidence on the
specific role of education in coping with change. For example, the hypothesis is consistent with
the finding that returns to schooling increased when former communist countries transitioned to
a market economy (Münich, Svejnar, and Terrell (2005)), but this could also reflect nonmarket
returns under the prior managed economy rather than returns to the ability to adjust to the
changed economic setting. Consideration of skill biased technological change generally focuses
on the impact of technologies with different skill contents (e.g., Katz and Murphy (1992), Goldin
and Katz (2008), Acemoglu and Restrepo (2016)) but does not distinguish between adaptation to
2
change and any long-run embedded skill requirements. The relationship of schooling demand
with vintages of capital in broad manufacturing industries is similarly consistent with
expectations about adaptation to different technologies (Bartel and Lichtenberg (1987)) but also
with alternative explanations of changing demand for skilled workers by age of plant and capital.
We turn to international evidence to investigate how changes in the economic environment
relate to returns to skills. As is clear from work on variations in economic growth, there are wide
differences in the pace of economic change across countries. This variation has been difficult to
exploit in the past to test the education adjustment hypothesis as international skill comparisons
have been limited. Specifically, school attainment is a very poor measure of productive skills in
an international setting, because a year of schooling does not produce the same individual skills
across diverse countries (Hanushek and Woessmann (2015)). Recently, however, new
international data provide direct comparisons of adult cognitive skills across a significant number
of countries. Exploiting international variations in returns to these skills has its own difficulties,
but it permits more direct linkage to the pace of economic change.
We employ data on cognitive skills across 32 diverse economies to provide a preliminary
exploration of the patterns of rewards to individual skills. These new data on skills and earnings
across countries reveal that returns to skills vary more across countries than previously thought,
offering sufficient variation to explore the cross-country association of skill returns with
economic change. Results provide consistent support for the basic hypothesis, showing that the
return to worker skills is systematically related to prior economic growth rates. While causal
identification is clearly difficult, this relationship of returns to change holds up in the presence of
plausible alternative explanations of the pattern of returns.

3
The PIAAC Survey of Adult Skills
Our analysis relies on the Programme for the International Assessment of Adult
Competencies (PIAAC), developed by the OECD to provide internationally comparable data on
the skills of the adult populations. The first round of PIAAC data, administered between August
2011 and March 2012, produced data on 23 (mostly OECD) countries (see OECD (2013),
Hanushek et al. (2015)).1 In a second round, PIAAC administered the same skill survey in an
additional nine countries (including both non-OECD countries and new members to the OECD)
between April 2014 and March 2015 (see OECD (2016)), extending the usable sample with
comparable skill data to 32 countries. At least 5,000 adults participated in the PIAAC assessment
in each country, providing considerably larger samples than in IALS, the predecessor of PIAAC.
In each participating country, a representative sample of adults between 16 and 65 years of age
was interviewed at home in the language of their country of residence. The standard survey mode
was to answer questions on a computer, but respondents without sufficient computer knowledge
could also do a pencil-and-paper survey.
PIAAC was designed to measure key cognitive and workplace skills needed for individuals
to advance at work and participate in society. The survey assessed cognitive skills in three
domains: numeracy, literacy, and problem solving in technology-rich environments. We focus on
numeracy skills, which we deem most comparable across countries. We standardize skills to
have mean zero and standard deviation (SD) one and employ the sample weights provided in
PIAAC.2 To provide perspective, one SD in numeracy skills corresponds to one out of five
1 In this, we do not include the Russian Federation because its data are still subject to change and are not
representative of the entire population because of the lack of the Moscow municipal area (OECD (2013)).
2 Throughout, we use the first plausible value of the PIAAC scores.

4
proficiency levels in PIAAC and roughly amounts to twice the learning difference between
school-attending PIAAC respondents in lower secondary and upper secondary education.3
An internationally harmonized background questionnaire surveyed labor-market status,
earnings, education, experience, and demographic characteristics. Our wage measure refers to
gross hourly earnings of wage and salary workers.4 The measure of actual work experience refers
to the number of years with at least six months spent in paid work. Appendix Table A-1 provides
descriptive statistics for the second-round PIAAC participants (see Hanushek et al. (2015) for
first-round participants).
To measure the amount of recent economic change, we use the annual growth rate in real
GDP per capita at constant national prices between 1990 and 2011 from the Penn World Tables
9.0 (see Feenstra, Inklaar, and Timmer (2015)). For additional features of country labor markets,
we follow Hanushek et al. (2015) in measuring union density as the share of employees who are
3 We calculate this “ISCED-level equivalent” by regressing numeracy skills of respondents aged 16-18 years in
the 32-country sample on an indicator that takes the value 1 for respondents currently in upper secondary education
(ISCED 3A-B, C long) and 0 in lower secondary education (ISCED 2, 3C short). Regressions control for gender,
age, number of books at home, migrant background, and country fixed effects.
4 The earnings data in the Public Use File are reported only in deciles for Singapore and Turkey in the second
round, as well as for Austria, Canada, Sweden, and the United States in the first round. For these countries, we
assign the median wage of each decile of the country-specific wage distribution (obtained from the OECD) to each
person belonging to the respective decile. Hanushek et al. (2015) show that using decile medians has no substantive
impact on estimated returns to skills for those countries with continuous wage data. To limit the influence of
outliers, we trim the bottom and top one percent of the wage distribution in each country.

5
trade union members (provided by the International Labour Organization) and in calculating
public employment as the share of workers employed in the public sector in the PIAAC data.5
New Evidence on Returns to Skills
We consider how measured cognitive skills affect labor market earnings. As developed in
Hanushek et al. (2015), our baseline empirical model is simply an analog to a Mincer equation
except that it is built on measured cognitive skills (C) instead of years of schooling:
20 1 2 3ln i i i i i iy C E E Gβ γ β β β ε= + + + + + , (1)
where yi is the hourly wage of individual i, E is experience, G is gender, and ε is a stochastic
error. Our parameter of interest is γ, the earnings gradient associated with skills. Our analysis
focuses on full-time workers aged 35-54, because prime-age earnings best approximate lifetime
earnings (Hanushek et al. (2015)).6
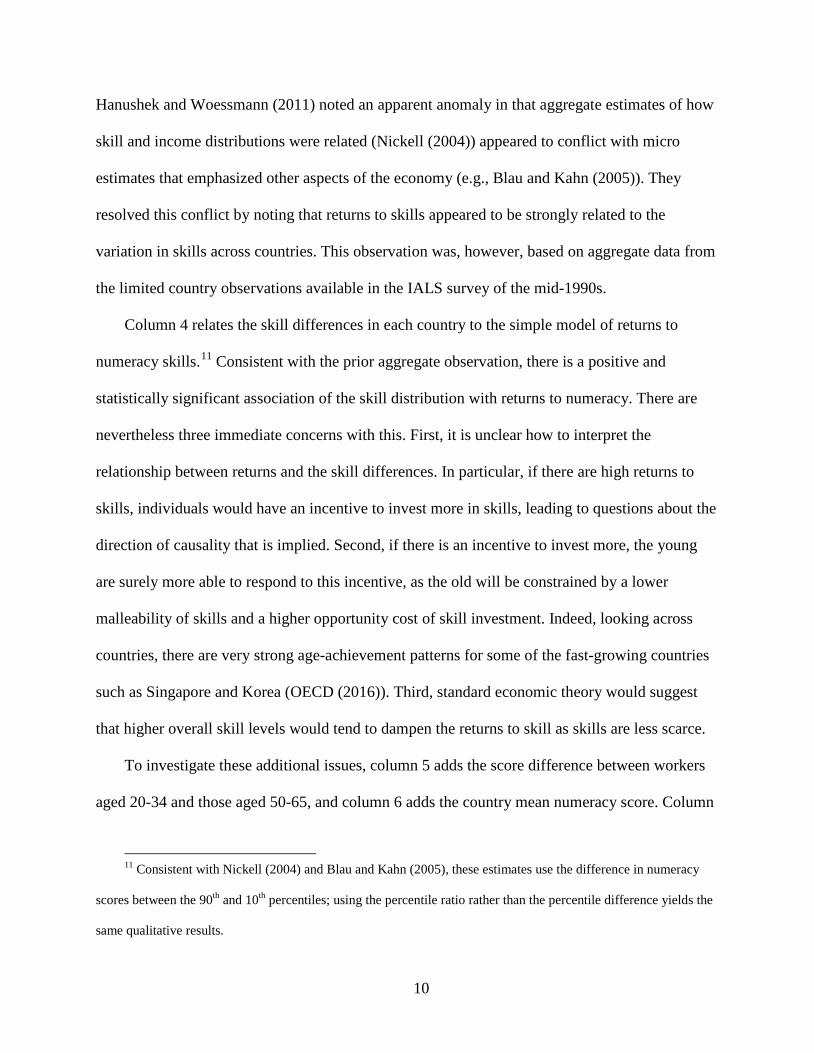
The new results indicate that returns to skills are even more diverse than previously thought.
Our estimates for the original PIAAC sample of 23 countries showed the returns to numeracy
skills to range from 0.12 in Sweden to 0.25 in the United States.7 As shown in Figure 1, this
range is expanded on both ends with the addition of the nine new countries (dark bars). The
estimates now range from 0.10 in Greece to 0.45 in Singapore. (The full regression models for
the newly added countries are shown in Table 1). The pooled estimate (with country fixed
5 Data refer to the beginning year of the respective PIAAC round or the most recent available year before that.
6 Full-time workers are defined as working at least 30 hours per week (see Hanushek et al. (2015) for detail).
7 This U.S. estimate is based on earnings data reported in deciles in the most recent Public Use File; with
access to continuous earnings data at the national data center, our prior estimate was 0.28 (Hanushek et al. (2015)).

6
effects) across the 32 countries is 0.20; i.e., a one standard deviation increase in numeracy skills
is related to 20 percent higher earnings.
Moreover, the general character of the estimates for the new countries follows closely what
was seen in the smaller set of original PIAAC countries. In particular, we continue to find strong
age-varying returns to skills. In the extended sample of employees aged 16-65, estimates of
returns to skills increase steadily with age until age 35 and are reasonably flat from there on
(Appendix Figure A-1).8 Just as earnings of prime-age workers tend to be good proxies for
lifetime earnings (Haider and Solon (2006)), returns estimated in the prime-age category will
more likely capture lifetime returns to skills.
Table 2 shows how the estimated returns vary across alternative specifications in each
second-round country and in the pooled 32-country sample. While the baseline model
standardizes scores within each country, results are quite similar when standardizing scores to
have mean zero and SD one in the full international sample. The exception is Singapore, where
the return drops from 0.45 to 0.35 with the international standardization, reflecting the large
within-country score variation in Singapore; still, Singapore remains the largest estimate in the
sample. The cross-country pattern is quite similar when using literacy skills or problem-solving
skills instead of numeracy skills, as well as for males and females. Expectedly, estimates of skill
returns are reduced when conditioning on years of schooling, which is one of the inputs into
cognitive skills. In addition to their relationship with earnings, skills are also positively
associated with employment. As in our previous analysis, in the pooled sample returns to skills
are slightly larger for workers with high-educated parents, for those in the private as opposed to
8 The aggregate picture might suggest including older workers. But past age 50, variations in retirement and
labor-force participation across countries come into play, leading us to focus just on prime-age workers.
7
public sector, and for full-time as opposed to part-time workers (not shown). But pooled returns
do not differ statistically significantly between males and females and, surprisingly, between
migrants and natives.
Economic Change and Differences in Returns to Skills across Countries
Our primary focus is how returns to skills are related to the amount of change in the
economy. To capture varying amounts of change across different economies, we rely upon prior
growth rates in GDP per capita.9 We use average annual growth in real GDP per capita over the
period 1990-2011. Starting in 1990 ensures that we do not lose previously communist bloc
countries. We consider growth up to the beginning of the PIAAC observations to capture longer-
run changes in economic production.
Figure 2 shows clearly that returns to skills are systematically larger in countries that
experienced faster economic growth in the recent past. This pattern is consistent with the
hypothesis that part of the economic value of skills lies in the ability to adapt to economic
change.
To investigate this association more rigorously and condition on the potentially confounding
effects of other differences in environmental factors across countries, we pool the micro data for
all countries, include country fixed effects (ηc), and estimate interactions of numeracy scores
with the different country-level features as in:
20 0 1 1 2 3ln ( )c
i i i c i i i c iy C C Z E E Gβ γ γ β β β η ε= + + × + + + + + , (2)
9 We refrain from restricting the measure of change to changes in total factor productivity (TFP) as this would
leave out influences of adding new capital, foreign direct investment, and different industrial configurations that
require labor-market adjustments.

8
where Zc are different measures of the economic environment in country c and γ1 is the estimate
of how the return to numeracy varies with Z. In this interacted model, we de-mean all variables
to facilitate interpretation.10
The first column of Table 3 has the simplest specification where numeracy skills enter
directly and also vary by countries’ prior growth rates in GDP per capita. This specification
effectively replicates the bivariate scatterplot of Figure 2: There is a strong and statistically
significant positive relationship between growth and returns to skills.
This investigation of course must also consider other possible confounding factors across
countries. In our analysis of the original 23 PIAAC countries, we found that returns to skills are
systematically related to features of countries’ labor markets such as union density and public
employment shares (Hanushek et al. (2015)). Column 2 shows that this is also the case in the
extended sample of countries: Returns to skills are lower when union membership and public
employment are higher. The growth estimates clearly are intertwined with these impacts, but
when these effects of union density and public employment are netted out in column 2, the
independent growth effect remains strong and highly significant.
The observed association of more rapid economic change with the value of skills is quite
substantial. Average annual growth rates in our sample differ by 4 percentage points, ranging
from 0.7 percent in Japan to 4.7 percent in Korea (see Figure 2). Evaluated at this range, the
estimates in column 2 suggest a difference in the return to one standard deviation in numeracy
skills of 0.13, which is sizeable compared to a mean return of 0.20. When similarly evaluated at
the range of their respective distributions, differences in union density (0.04) and public
employment (0.10) are also strongly related to returns but to a lesser extent than seen for growth.
10 The pooled analyses exclude Jakarta (Indonesia), for which we do not have the relevant country measures.

9
Robustness Checks
While the international comparisons offer substantial variation in the economic environment
that makes it possible to describe the interplay with the labor-market returns to skill, it is
simultaneously difficult to find clearly exogenous variation in economic change across countries
to test the hypothesis. Concerns of direct reverse causation from the incentives created by larger
skill returns feeding back into an economy’s growth process are minimized in the basic model by
our measurement of economic growth over a period that predates the estimation of skill returns.
We also took a number of steps to address the most plausible threats that omitted country factors
pose to identification of the relationship of skill returns with growth including estimating the
models with just within-country variance (by including country fixed effects) and incorporating
previously identified features of the labor market in each country. The analysis could nonetheless
suffer from both reverse causation and omitted variables bias beyond that already considered.
Although we cannot deal conclusively with all possible issues, we now extend this investigation
to see how the results hold up under further potential threats to identification.
One concern with the cross-country analysis is that much of the country differences in
returns to skills might reflect different occupational and industrial structures of the economies.
As a check on this possibility, we introduce a full set of industry-by-occupation fixed effects
(183 in total) so that the returns to skills are estimated just from variations within these cells
(column 3). The main effect of numeracy drops, indicating that about half of the return to
numeracy skills comes through the path of selection into specific occupations and industries. The
within-industry and within-occupation impacts of growth and of the other environmental forces
are, however, little changed from the overall effects in column 2.
A second issue about the basic estimates relates to the distribution of skills within each
country. In reviewing prior research on how skill differences relate to the distribution of income,
10
Hanushek and Woessmann (2011) noted an apparent anomaly in that aggregate estimates of how
skill and income distributions were related (Nickell (2004)) appeared to conflict with micro
estimates that emphasized other aspects of the economy (e.g., Blau and Kahn (2005)). They
resolved this conflict by noting that returns to skills appeared to be strongly related to the
variation in skills across countries. This observation was, however, based on aggregate data from
the limited country observations available in the IALS survey of the mid-1990s.
Column 4 relates the skill differences in each country to the simple model of returns to
numeracy skills.11 Consistent with the prior aggregate observation, there is a positive and
statistically significant association of the skill distribution with returns to numeracy. There are
nevertheless three immediate concerns with this. First, it is unclear how to interpret the
relationship between returns and the skill differences. In particular, if there are high returns to
skills, individuals would have an incentive to invest more in skills, leading to questions about the
direction of causality that is implied. Second, if there is an incentive to invest more, the young
are surely more able to respond to this incentive, as the old will be constrained by a lower
malleability of skills and a higher opportunity cost of skill investment. Indeed, looking across
countries, there are very strong age-achievement patterns for some of the fast-growing countries
such as Singapore and Korea (OECD (2016)). Third, standard economic theory would suggest
that higher overall skill levels would tend to dampen the returns to skill as skills are less scarce.
To investigate these additional issues, column 5 adds the score difference between workers
aged 20-34 and those aged 50-65, and column 6 adds the country mean numeracy score. Column
11 Consistent with Nickell (2004) and Blau and Kahn (2005), these estimates use the difference in numeracy
scores between the 90th and 10th percentiles; using the percentile ratio rather than the percentile difference yields the
same qualitative results.
11
5 shows that overall skill inequality in fact loses significance when the age pattern of skills is
included. This suggests that it is not skill inequality in general but the age differences in skills
that are related to skill returns, consistent with the incentive effects of high returns and reverse
causation driving the estimated association of the skill distribution with returns. In column 6, the
addition of the mean skill shows a negative relationship with the return to skill (significant at the
10 percent level), and the age distribution of skills remains significant.
The prior estimates do not, however, include any of the factors found significant in column
2, leading to the more complete specification in column 7. Once we account for the impact of
growth, unionization, and public employment on skill returns, the measure of skill distribution in
fact becomes small and statistically insignificant. This also holds when we look at the
relationships within industry-occupation cells (column 8), where higher average skill levels in a
country are significantly related to lower returns to skills. These results are consistent with an
interpretation where the association between skill inequality and skill returns is fully driven by
the fact that skill returns are larger in changing environments.
Results are also robust to a number of alternative specifications not shown in the table. First,
when added to the baseline model, an interaction of numeracy with the initial level of GDP per
capita does not enter significantly and does not alter the interaction of numeracy with the GDP
growth rate. Second, Hanushek et al. (2015) also included a measure of employment protection;
while available only for 29 of our 31 countries, this measure also enters with a significant
negative interaction with numeracy in our model, but leaves all other qualitative results
unchanged.12 Third, results are robust to using alternative periods over which to measure prior
12 Hanushek et al. (2015) also showed that returns to skills are not systematically related to product-market
regulations and minimum wages.
12
growth, such as 1990-2000, 1990-2005, or 1990-2007, indicating that results are not affected by
the 2008 recession. Fourth, results are robust to dropping one country at a time, indicating that
the cross-country pattern is not driven by individual country observations.13 Fifth, results are also
robust to restricting the analysis to variation within continents by adding a set of interactions of
numeracy with continental fixed effects and to restricting the sample to European countries only.
In sum, direct analysis of plausible confounding factors and elimination of potentially suspect
variations across countries and continents leave the strong relationship between the returns to
skills and the amount of change in the economic environment intact.
Conclusions
The availability of new information about earnings and skills in a broader set of 32 countries
permits closer investigation than previously possible of the hypothesis that education has a
stronger payoff when there is faster economic change. It turns out that the range of differences in
labor-market returns to skills across countries is even larger than previously thought, with two of
the nine newly added countries – Singapore and Chile – having by far the highest returns to skills
in the sample and newly added Greece having the lowest. The main observed cross-country
pattern is simply that returns to skills are larger in countries with faster prior economic growth,
consistent with skilled workers being able to adjust more readily to economic change. These
descriptive estimates of course are subject to questions about causality, but considering a range
of alternative influences does not change this overall pattern.
13 Results are also robust to dropping both Chile and Singapore, the two countries with the highest returns.

13
References Acemoglu, Daron, and Pascual Restrepo. 2016. "The race between machine and man:
Implications of technology for growth, factor shares and employment." NBER Working Paper 22252. Cambridge, MA: National Bureau of Economic Research.
Bartel, Ann P., and Frank R. Lichtenberg. 1987. "The comparative advantage of educated workers in implementing new technology." Review of Economics and Statistics 69, no. 1: 1-11.
Blau, Francine D., and Lawrence M. Kahn. 2005. "Do cognitve test scores explain higher US wage inequality?" Review of Economics and Statistics 87, no. 1: 184-193.
Feenstra, Robert C., Robert Inklaar, and Marcel P. Timmer. 2015. "The next generation of the Penn World Table." American Economic Review 105, no. 10: 3150-3182.
Foster, Andrew D., and Mark R. Rosenzweig. 1996. "Technical change and human-capital returns and investments: Evidence from the green revolution." American Economic Review 86, no. 4: 931-953.
Goldin, Claudia, and Lawrence F. Katz. 2008. The race between education and technology. Cambridge, MA: Harvard University Press.
Haider, Steven, and Gary Solon. 2006. "Life-cycle variation in the association between current and lifetime earnings." American Economic Review 96, no. 4: 1308-1320.
Hanushek, Eric A., Guido Schwerdt, Simon Wiederhold, and Ludger Woessmann. 2015. "Returns to skills around the world: Evidence from PIAAC." European Economic Review 73: 103-130.
Hanushek, Eric A., and Ludger Woessmann. 2011. "The economics of international differences in educational achievement." In Handbook of the Economics of Education, Vol. 3, edited by Eric A. Hanushek, Stephen Machin, and Ludger Woessmann. Amsterdam: North Holland: 89-200.
Hanushek, Eric A., and Ludger Woessmann. 2015. The knowledge capital of nations: Education and the economics of growth. Cambridge, MA: MIT Press.
Katz, Lawrence F., and Kevin M. Murphy. 1992. "Changes in relative wages, 1963-1987: Supply and demand factors." Quarterly Journal of Economics 107, no. 1: 35-78.
Münich, Daniel, Jan Svejnar, and Katherine Terrell. 2005. "Returns to human capital under the communist wage grid and during the transition to a market economy." Review of Economics and Statistics 87, no. 1: 100-123.
Nelson, Richard R., and Edmund Phelps. 1966. "Investment in humans, technology diffusion and economic growth." American Economic Review 56, no. 2: 69-75.
Nickell, Stephen. 2004. "Poverty and worklessness in Britain." Economic Journal 114, no. 494: C1-C25.
OECD. 2013. OECD skills outlook 2013: First results from the survey of adult skills. Paris: Organisation for Economic Co-operation and Development.
OECD. 2016. Skills matter: Further results from the survey of adult skills. Paris: Organisation for Economic Co-operation and Development.
Schultz, Theodore W. 1975. "The value of the ability to deal with disequilibria." Journal of Economic Literature 13, no. 3: 827-846.
Welch, Finis. 1970. "Education in production." Journal of Political Economy 78, no. 1: 35-59.

Figure A-1: Returns to Skills by Age Group
0.0
5.1
.15
.2R
etur
ns to
num
erac
y sk
ills
16−19 20−24 25−29 30−34 35−39 40−44 45−49 50−54 55−59 60−65Age group
Notes: Coefficient estimates on numeracy score (standardized to std. dev. 1 within each country) for indicated 5-year age groups in a regressionof log gross hourly wage on numeracy, gender, a quadratic polynomial in actual work experience, and country fixed effects, sample of full-timeemployees pooling all countries. Sample includes 32 PIAAC countries. Regressions weighted by sampling weights, giving same weight to eachcountry. Slopes of solid lines reflect average change in returns by age groups (separately estimated for ages 16-34 and 35-54). Data source:PIAAC 2016.

Table A-1: Descriptive Statistics
Chile Greece Indonesiaa Israel Lithuania New Zealand Singapore Slovenia Turkey
Gross hourly wage 3.3† 7.1 16.8† 57.8 11.6 29.1 23.8 7.7 11.8(national currency) (2.9) (3.6) (17.0) (37.3) (6.8) (13.9) (16.4) (3.5) (10.5)Numeracy 213.5 263.5 208.3 263.1 270.0 278.9 259.0 263.1 233.7
(59.9) (47.9) (55.5) (59.0) (48.0) (54.8) (67.5) (51.6) (54.9)Schooling (years) 11.8 13.0 11.8 13.8 13.7 14.2 12.3 10.7 9.2
(3.4) (3.2) (3.8) (2.6) (2.3) (2.6) (3.2) (1.9) (3.6)Experience (years) 18.5 19.1 16.5 22.4 21.8 23.5 19.9 22.7 16.0
(8.8) (7.1) (8.2) (7.4) (7.1) (8.0) (7.9) (7.8) (8.4)Female (share) 0.38 0.40 0.20 0.48 0.55 0.42 0.43 0.49 0.22Observations 903 623 806 908 1260 1204 1507 1306 674
Notes: Means, standard deviations (in parentheses), and numbers of observations for selected variables by country. Sample: full-time employeesaged 35-54. †wages divided by 1000. aJakarta only. Data source: PIAAC 2016.
Figure 1: Returns to Skills across PIAAC Countries
0.20
0.18
0.15
0.20
0.14
0.120.
14
0.18
0.14
0.17
0.240.24
0.13
0.18
0.22
0.18
0.13
0.19
0.18
0.23
0.12
0.22
0.25
0.20
0.38
0.11
0.25
0.28
0.17
0.19
0.45
0.190.
20
0.1
.2.3
.4.5
Ret
urns
to n
umer
acy
skill
s
Singap
ore
Chile
Israe
lU.S
.
Indo
nesia
aIre
land
Germ
any
Spain
U.K.
Korea
Turke
yAus
tralia
Pooled
Canad
aPola
ndSlov
enia
New Z
ealan
dAus
tria
Japa
n
Slovak
Rep
.
Nethe
rland
sEsto
niaFra
nce
Lithu
ania
Belgium
Finlan
dCyp
rus
Denm
ark
Italy
Norway
Czech
Rep
.Swed
enGre
ece
Notes: Coefficient estimates on numeracy score (standardized to std. dev. 1 within each country) in a regression of log gross hourly wage onnumeracy, gender, and a quadratic polynomial in actual work experience, sample of full-time employees aged 35-54. Regressions weighted bysampling weights. Pooled specification includes country fixed effects and gives same weight to each country. Hollow bars indicate first-roundcountries, black bars indicate second-round countries. aJakarta only. Data source: PIAAC 2016.

Figure 2: GDP Growth and Returns to Skills
AUSAUT
BEL
CAN
CHL
CYPCZE
DNK
EST
FIN
FRA
DEU
GRC
IRLISR
ITA
JPN
KOR
LTU
NLD
NZL
NOR
POL
SGP
SVK
SVN
ESP
SWE
TUR
GBR
USA
.1.1
5.2
.25
.3.3
5.4
Ret
urns
to n
umer
acy
skill
s
1 2 3 4 5Average annual growth rate in real GDP per capita, 1990−2011 (in %)
Notes: Scatter plot of returns to numeracy skills (international standardization) against average annual growth rate in real GDP per capita,1990-2011. Data sources: Penn World Tables, PIAAC 2016.

Table 1: Returns to Skills in Second-Round PIAAC Countries
Pooled Chile Greece Indonesiaa Israel Lithuania New Zealand Singapore Slovenia Turkey
Numeracy .200∗∗∗ .380∗∗∗ .107∗∗∗ .249∗∗∗ .281∗∗∗ .165∗∗∗ .189∗∗∗ .455∗∗∗ .191∗∗∗ .202∗∗∗
(.003) (.026) (.021) (.028) (.016) (.016) (.011) (.013) (.011) (.027)Experience .028∗∗∗ .019 .026∗∗ .045∗∗∗ .034∗∗∗ .015 .023∗∗∗ .049∗∗∗ .009 .075∗∗∗
(.001) (.012) (.010) (.011) (.007) (.012) (.007) (.007) (.007) (.010)Experience2 –.052∗∗∗ –.027 –.046∗ –.089∗∗∗ –.055∗∗∗ –.033 –.042∗∗∗ –.110∗∗∗ –.024 –.173∗∗∗
(.003) (.032) (.025) (.029) (.017) (.027) (.014) (.017) (.016) (.028)Female –.145∗∗∗ –.116∗∗ –.055 –.261∗∗∗ –.082∗∗ –.217∗∗∗ –.116∗∗∗ –.158∗∗∗ –.071∗∗∗ –.009
(.005) (.051) (.039) (.063) (.032) (.035) (.023) (.028) (.021) (.068)R2 .218 .365 .099 .171 .277 .158 .265 .480 .215 .208Observations 45064 903 623 806 908 1260 1204 1507 1306 674
∗ p<0.10, ∗∗ p<0.05, ∗∗∗ p<0.01
Notes: Least squares regressions weighted by sampling weights. Dependent variable: log gross hourly wage. Sample: full-time employees aged35-54. Pooled specification includes all 32 PIAAC countries; includes country fixed effects and gives same weight to each country. Numeracyscore standardized to std. dev. 1 within each country. Experience2 divided by 1000. R2 refers to within-country R2. Robust standard errorsin parentheses. aJakarta only. Data source: PIAAC 2016.

Table 2: Returns to Skills in Alternative Specifications
Pooled Chile Greece Indonesiaa Israel Lithuania New Zealand Singapore Slovenia Turkey
(1) Baseline model .200∗∗∗ .380∗∗∗ .107∗∗∗ .249∗∗∗ .281∗∗∗ .165∗∗∗ .189∗∗∗ .455∗∗∗ .191∗∗∗ .202∗∗∗
(.003) (.026) (.021) (.028) (.016) (.016) (.011) (.013) (.011) (.027)(2) International standardization .210∗∗∗ .348∗∗∗ .123∗∗∗ .256∗∗∗ .235∗∗∗ .191∗∗∗ .187∗∗∗ .354∗∗∗ .191∗∗∗ .199∗∗∗
(.003) (.024) (.024) (.029) (.014) (.019) (.011) (.010) (.011) (.027)(3) Literacy .187∗∗∗ .318∗∗∗ .083∗∗∗ .237∗∗∗ .259∗∗∗ .144∗∗∗ .176∗∗∗ .430∗∗∗ .184∗∗∗ .210∗∗∗
(.003) (.027) (.019) (.034) (.017) (.016) (.011) (.015) (.010) (.026)(4) Problem solving .159∗∗∗ .309∗∗∗ .083∗∗∗ .223∗∗∗ .206∗∗∗ .154∗∗∗ .297∗∗∗ .180∗∗∗ .101∗∗∗
(.003) (.035) (.022) (.019) (.017) (.012) (.017) (.011) (.034)(5) Numeracy conditional on .109∗∗∗ .148∗∗∗ .041∗ .062∗∗ .198∗∗∗ .087∗∗∗ .127∗∗∗ .227∗∗∗ .075∗∗∗ .077∗∗∗
years of schooling (.003) (.031) (.021) (.028) (.019) (.018) (.012) (.017) (.012) (.025)(6) Males .199∗∗∗ .380∗∗∗ .094∗∗∗ .201∗∗∗ .299∗∗∗ .160∗∗∗ .194∗∗∗ .458∗∗∗ .185∗∗∗ .221∗∗∗
(.004) (.034) (.030) (.034) (.023) (.026) (.014) (.017) (.015) (.032)(7) Females .199∗∗∗ .384∗∗∗ .126∗∗∗ .377∗∗∗ .259∗∗∗ .174∗∗∗ .184∗∗∗ .445∗∗∗ .200∗∗∗ .130∗∗∗
(.004) (.038) (.028) (.041) (.023) (.018) (.017) (.022) (.015) (.043)(8) Employment regression .079∗∗∗ .103∗∗∗ .036∗∗∗ .013 .107∗∗∗ .083∗∗∗ .074∗∗∗ .035∗∗∗ .093∗∗∗ .058∗∗∗
(.002) (.014) (.011) (.008) (.010) (.012) (.009) (.008) (.009) (.011)∗ p<0.10, ∗∗ p<0.05, ∗∗∗ p<0.01
Notes: Least squares regressions weighted by sampling weights. Dependent variables: log gross hourly wage in rows (1) to (7); employmentindicator, taking the value of one if a person is employed (self-reported), in row (8). Samples: full-time employees aged 35-54 in wageregressions; all individuals aged 35-54 with self-reported employment status in employment regressions. Pooled specification includes all 32PIAAC countries; includes country fixed effects and gives same weight to each country. Estimations control for gender and a quadraticpolynomial in work experience in wage regressions and for gender and a quadratic polynomial in age in employment regressions. Robuststandard errors in parentheses. aJakarta only. Data source: PIAAC 2016.
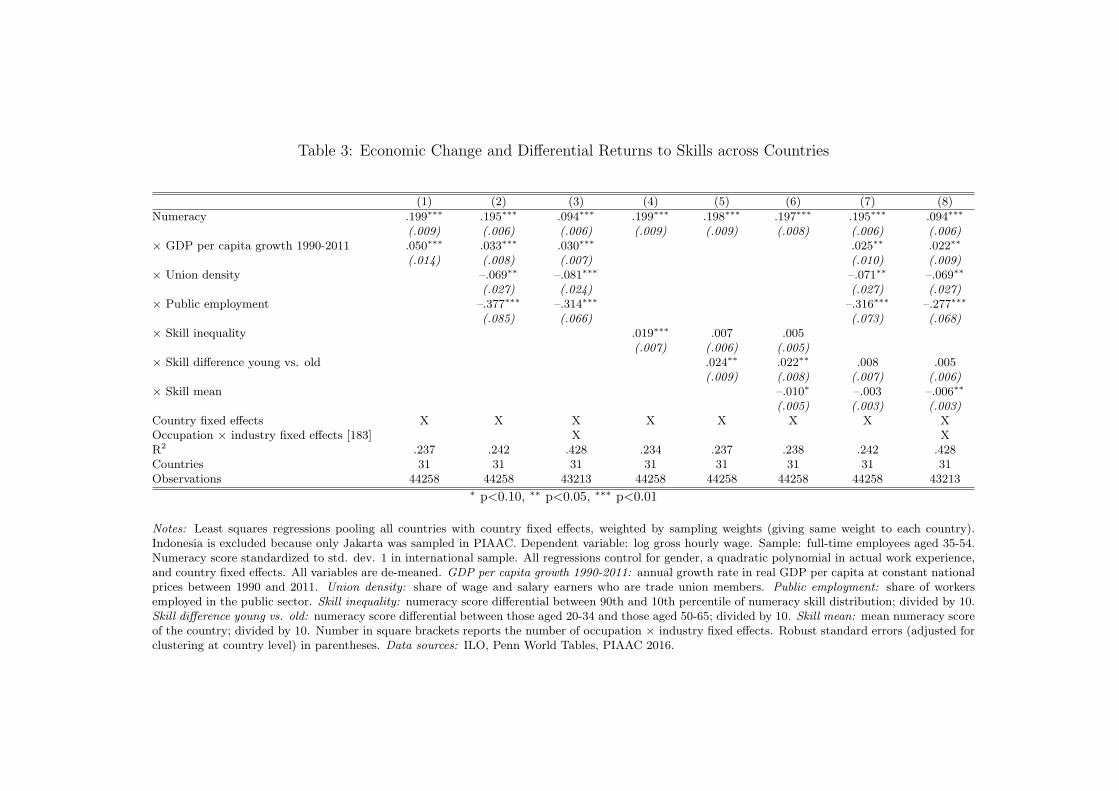
Table 3: Economic Change and Differential Returns to Skills across Countries
(1) (2) (3) (4) (5) (6) (7) (8)
Numeracy .199∗∗∗ .195∗∗∗ .094∗∗∗ .199∗∗∗ .198∗∗∗ .197∗∗∗ .195∗∗∗ .094∗∗∗
(.009) (.006) (.006) (.009) (.009) (.008) (.006) (.006)× GDP per capita growth 1990-2011 .050∗∗∗ .033∗∗∗ .030∗∗∗ .025∗∗ .022∗∗
(.014) (.008) (.007) (.010) (.009)× Union density –.069∗∗ –.081∗∗∗ –.071∗∗ –.069∗∗
(.027) (.024) (.027) (.027)× Public employment –.377∗∗∗ –.314∗∗∗ –.316∗∗∗ –.277∗∗∗
(.085) (.066) (.073) (.068)× Skill inequality .019∗∗∗ .007 .005
(.007) (.006) (.005)× Skill difference young vs. old .024∗∗ .022∗∗ .008 .005
(.009) (.008) (.007) (.006)× Skill mean –.010∗ –.003 –.006∗∗
(.005) (.003) (.003)Country fixed effects X X X X X X X XOccupation × industry fixed effects [183] X XR2 .237 .242 .428 .234 .237 .238 .242 .428Countries 31 31 31 31 31 31 31 31Observations 44258 44258 43213 44258 44258 44258 44258 43213
∗ p<0.10, ∗∗ p<0.05, ∗∗∗ p<0.01
Notes: Least squares regressions pooling all countries with country fixed effects, weighted by sampling weights (giving same weight to each country).Indonesia is excluded because only Jakarta was sampled in PIAAC. Dependent variable: log gross hourly wage. Sample: full-time employees aged 35-54.Numeracy score standardized to std. dev. 1 in international sample. All regressions control for gender, a quadratic polynomial in actual work experience,and country fixed effects. All variables are de-meaned. GDP per capita growth 1990-2011: annual growth rate in real GDP per capita at constant nationalprices between 1990 and 2011. Union density: share of wage and salary earners who are trade union members. Public employment: share of workersemployed in the public sector. Skill inequality: numeracy score differential between 90th and 10th percentile of numeracy skill distribution; divided by 10.Skill difference young vs. old: numeracy score differential between those aged 20-34 and those aged 50-65; divided by 10. Skill mean: mean numeracy scoreof the country; divided by 10. Number in square brackets reports the number of occupation × industry fixed effects. Robust standard errors (adjusted forclustering at country level) in parentheses. Data sources: ILO, Penn World Tables, PIAAC 2016.