copernicus global land operations vegetation and energy · add table 9 i1.21 . ... lpj-dgvm...
TRANSCRIPT

Copernicus Global Land Operations – Lot 1
Date Issued: 07.02.2018
Issue: I1.21
Copernicus Global Land Operations
”Vegetation and Energy” “CGLOPS-1”
Framework Service Contract N° 199494 (JRC)
PRODUCT USER MANUAL
DRY MATTER PRODUCTIVITY (DMP)
GROSS DRY MATTER PRODUCTIVITY (GDMP)
COLLECTION 300M
VERSION 1
Issue I1.21
Organization name of lead contractor for this deliverable: VITO
Book Captain: Bruno Smets
Contributing Authors: Else Swinnen
Roel Van Hoolst

Copernicus Global Land Operations – Lot 1
Date Issued: 07.02.2018
Issue: I1.21
Document-No. CGLOPS1_PUM_DMP300m-V1 © C-GLOPS1 consortium
Issue: I1.21 Date: 07.02.2018 Page: 2 of 44
Dissemination Level PU Public X
PP Restricted to other programme participants (including the Commission Services)
RE Restricted to a group specified by the consortium (including the Commission Services)
CO Confidential, only for members of the consortium (including the Commission Services)

Copernicus Global Land Operations – Lot 1
Date Issued: 07.02.2018
Issue: I1.21
Document-No. CGLOPS1_PUM_DMP300m-V1 © C-GLOPS1 consortium
Issue: I1.21 Date: 07.02.2018 Page: 3 of 44
Document Release Sheet
Book captain: Bruno Smets
Sign Date 07.02.2018
Approval Roselyne Lacaze
Sign Date 08.02.2018
Endorsement: Michael cherlet
Sign Date
Distribution: Public

Copernicus Global Land Operations – Lot 1
Date Issued: 07.02.2018
Issue: I1.21
Document-No. CGLOPS1_PUM_DMP300m-V1 © C-GLOPS1 consortium
Issue: I1.21 Date: 07.02.2018 Page: 4 of 44
Change Record
Issue/Rev Date Page(s) Description of Change Release
03.05.2017 All First issue I1.00
I1.00 15.11.2017 14-20
34-40 Update after external review I1.10
I1.10 20.01.2018 23-24 Split DMP and GDMP in two products I1.20
I1.20 07.02.2017
19, 21
24
29
Fixed final consolidation product to RT5
Update quality flag table
Add Table 9
I1.21

Copernicus Global Land Operations – Lot 1
Date Issued: 07.02.2018
Issue: I1.21
Document-No. CGLOPS1_PUM_DMP300m-V1 © C-GLOPS1 consortium
Issue: I1.21 Date: 07.02.2018 Page: 5 of 44
TABLE OF CONTENTS
Executive Summary .................................................................................................................. 11
1 Background of the document ............................................................................................. 12
1.1 Scope and Objectives............................................................................................................. 12
1.2 Content of the document....................................................................................................... 12
1.3 Related documents ............................................................................................................... 12
1.3.1 Applicable document .................................................................................................................................. 12
1.3.2 Input ............................................................................................................................................................ 12
1.3.3 External reference ...................................................................................................................................... 13
2 Algorithm .......................................................................................................................... 14
2.1 Introduction .......................................................................................................................... 14
2.2 Retrieval Methodology .......................................................................................................... 14
2.2.1 Background ................................................................................................................................................. 14
2.2.2 Input data.................................................................................................................................................... 15
2.2.3 Processing steps .......................................................................................................................................... 15
2.2.4 Near Real Time retrieval of the DMP 300m Version 1 ................................................................................ 17
2.3 Limitations ............................................................................................................................ 19
3 Product Description ........................................................................................................... 21
3.1 File Format ............................................................................................................................ 21
3.2 Product Content .................................................................................................................... 23
3.2.1 Data Files ..................................................................................................................................................... 23
3.2.2 QFLAG image ............................................................................................................................................... 24
3.2.3 File and Layer attributes ............................................................................................................................. 25
3.2.4 Quicklook image ......................................................................................................................................... 29
3.3 Product Characteristics .......................................................................................................... 30
3.3.1 Projection and grid information ................................................................................................................. 30
3.3.2 Spatial information ..................................................................................................................................... 30
3.3.3 Temporal information ................................................................................................................................. 30
3.4 Data Policies ......................................................................................................................... 31
3.5 Contacts ................................................................................................................................ 32
4 Quality Assessment ........................................................................................................... 33
5 Product Usage ................................................................................................................... 35

Copernicus Global Land Operations – Lot 1
Date Issued: 07.02.2018
Issue: I1.21
Document-No. CGLOPS1_PUM_DMP300m-V1 © C-GLOPS1 consortium
Issue: I1.21 Date: 07.02.2018 Page: 6 of 44
5.1 Typical use ............................................................................................................................ 35
5.2 Advanced usage: how to analyze the data .............................................................................. 35
5.3 Exploitation in empirical regressive modelling ........................................................................ 40
6 References ........................................................................................................................ 42
Annex: Review of Users Requirements ...................................................................................... 43

Copernicus Global Land Operations – Lot 1
Date Issued: 07.02.2018
Issue: I1.21
Document-No. CGLOPS1_PUM_DMP300m-V1 © C-GLOPS1 consortium
Issue: I1.21 Date: 07.02.2018 Page: 7 of 44
List of Figures
Figure 1: Global land cover map (ESA CCI epoch 2010) derived from ENVISAT MERIS and SPOT-
VGT data. .............................................................................................................................. 15
Figure 2: Process flow of GDMP/DMP. Based on meteo data a daily DMPmax is estimated. At the
end of each dekad, a Mean Value Composite of these DMPmax images is calculated. At the
same time, a fAPAR product is generated. The final DMP10 product is retrieved by the simple
multiplication of the latter two images..................................................................................... 17
Figure 3: Scheme showing the compositing used for real time estimates ...................................... 18
Figure 4: Regions of DMP/GDMP product. Red lines indicate the boundaries on availability of
meteorological data. ............................................................................................................... 23
Figure 5 : Color coding for quicklook images ................................................................................. 30
Figure 6 : Global DMP map of the last dekad of July 2014. ........................................................... 35
Figure 7 : Western Africa, last dekad of July 2006. Absolute difference in DMP with respect to long
term average. Green = better situation, Red = worse ............................................................. 36
Figure 8 : Sahel, seasonal dry matter productivity as calculated by the Biogenerator software of
Action Contre la Faim (NGO). Yellow = low cumulative DMP, Dark green = high cumulative
DMP. Map obtained from Ham et al. (2012). .......................................................................... 37
Figure 9 : profiles for DMP for winter cereals in Belgium derived with 6 different un-mixing
methods: Regional mean, Hard classification, CNDVI threshold = 20%, CNDVI threshold =
50%, Linear un-mixing and Neural network ............................................................................ 38
Figure 10 : Regional unmixed means of DMP. Example for the Horn of Africa. ............................. 39
Figure 11: Online dashboard of the time series viewer as provided by Copernicus Global Land
Service (http://viewer.globalland.vgt.vito.be/tsviewer/). .......................................................... 40
Figure 12: Temporal trends of predicted yield calibrated by leave-one-out cross validation
technique ............................................................................................................................... 41

Copernicus Global Land Operations – Lot 1
Date Issued: 07.02.2018
Issue: I1.21
Document-No. CGLOPS1_PUM_DMP300m-V1 © C-GLOPS1 consortium
Issue: I1.21 Date: 07.02.2018 Page: 8 of 44
List of Tables
Table 1: Individual terms in the Monteith variant used for Global Land service GDMP/DMP. All
terms are expressed on a daily basis. .................................................................................... 16
Table 2: Definition of the continental tiles distributed via Eumetcast.............................................. 23
Table 3: Range of values and scaling factors of GDMP/DMP........................................................ 24
Table 4: Range of values of QFLAG. ............................................................................................ 24
Table 5: Description of netCDF file attributes ................................................................................ 26
Table 6: Description of netCDF layer attributes ............................................................................. 27
Table 7: Description of netCDF coordinate variable attributes ....................................................... 28
Table 8: Description of netCDF grid mapping variable attributes ................................................... 28
Table 9: Description of netCDF attributes for time coordinate variable .......................................... 29
Table 10 : QuickLook - value signification ..................................................................................... 29

Copernicus Global Land Operations – Lot 1
Date Issued: 07.02.2018
Issue: I1.21
Document-No. CGLOPS1_PUM_DMP300m-V1 © C-GLOPS1 consortium
Issue: I1.21 Date: 07.02.2018 Page: 9 of 44
List of Acronyms
AD Applicable Document
AFI Area Fraction Image
AR Autotrophic Respiration
ATBD Algorithm Theoretical Basis Document
AVHRR Advanced Very High Resolution Radiometer
CCI Climate Change Initiative, an ESA program
CEOS Committee on Earth Observation System
CGLS Copernicus Global Land Service
CNDVI Cumulative NDVI
CNES Centre National d’Etudes Spatiale
CTIV Centre de Traitement des Images VEGETATION
CSV Comma Separated Values
DM Dry Matter
DMP Dry Matter Productivity
DN Digital number
Efficiency
EBF Evergreen Broadleaf Forest
EC European Commission
ECMWF European Centre for Medium-Range Weather Forecasts
ECV Essential Climate Variable
ENVISAT Environment satellite from ESA, contains MERIS instrument
ERA-Interim A global atmospheric reanalysis dataset from ECMWF
ESA European Space Agency
fAPAR Fraction of absorbed photosynthetically active radiation
FP7 Framework Programme 7
GAUL Global Administrative Unit Layers
GCOS The Global Climate Observing System
GDMP Gross Dry Matter Productivity
GIO GMES Initial Operations
GLC Global Land Cover
GLIMPSE Global image processing software
GPP Gross Primary Productivity
Ha Hectares
HDF Hierarchical Data Format
IGBP International Geosphere Biosphere Program
ImagineS Implementation of Multi-scale Agricultural Indicators Exploiting Sentinels
ISLSCP International Satellite Land-Surface Climatology Project Initiative
JRC Joint Research Centre

Copernicus Global Land Operations – Lot 1
Date Issued: 07.02.2018
Issue: I1.21
Document-No. CGLOPS1_PUM_DMP300m-V1 © C-GLOPS1 consortium
Issue: I1.21 Date: 07.02.2018 Page: 10 of 44
LPJ-DGVM Lund-Potsdam-Jena Dynamic Global Vegetation Model
LPV Land Product Validation group of CEOS
LUE Light use efficiency
MARS Monitoring Agricultural ResourceS
MARSOP MARS-operations
MERIS Medium Resolution Imaging Spectrometer
MODIS Moderate Resolution Imaging Spectroradiometer
NBP Net Biome productivity
NDVI Normalized Difference Vegetation Index
NEE Net-Ecosystem exchange
NEP Net Ecosystem productivity
NetCDF Scientific data Network Common Format
NGO Non Governmental Organization
NPP Net Primary Productivity
NRT Near Real Time
PAR Photosynthetically active radiation
PROBA-V Vegetation instrument on PROBA platform, Belgian mission
PUM Product User Manual
R Radiation
RMSE Root Mean Square Error
RS Remote Sensing
RUM Regional Unmixed Means
SPOT Système Pour l’Observation de la Terre
T Temperature
UN-LCCS United Nations Land Cover Classification System
VGT VEGETATION sensor onboard SPOT4/5
VITO Flemish Institute for Technological Research
VR Validation Report
WGS World Geodetic System
XML Extensible Markup Language
XSL Extensible Style sheet Language

Copernicus Global Land Operations – Lot 1
Date Issued: 07.02.2018
Issue: I1.21
Document-No. CGLOPS1_PUM_DMP300m-V1 © C-GLOPS1 consortium
Issue: I1.21 Date: 07.02.2018 Page: 11 of 44
EXECUTIVE SUMMARY
The Copernicus Global Land Service (CGLS) is earmarked as a component of the Land service to
operate “a multi-purpose service component” that provides a series of bio-geophysical products on
the status and evolution of land surface at global scale. Production and delivery of the parameters
take place in a timely manner and are complemented by the constitution of long term time series.
This document describes the global Dry Matter Productivity Collection 300m Version 1 product,
derived from PROBA-V. The product is calculated globally and made available to the user in near-
real time every 10 days. The product provides Gross Dry Matter Productivity (GDMP) and Dry
Matter Productivity (DMP) information. They are delivered with a maximum of 3 days lag in Near
Real Time (NRT), followed by consolidations in the course of the next 6 dekads.

Copernicus Global Land Operations – Lot 1
Date Issued: 07.02.2018
Issue: I1.21
Document-No. CGLOPS1_PUM_DMP300m-V1 © C-GLOPS1 consortium
Issue: I1.21 Date: 07.02.2018 Page: 12 of 44
1 BACKGROUND OF THE DOCUMENT
1.1 SCOPE AND OBJECTIVES
The Product User Manual (PUM) is the primary document that users have to read before handling
the products. It gives an overview of the product characteristics, in terms of algorithm, technical
characteristics, and main validation results.
The DMP/GDMP Collection 300m Version 1 product is derived from the CGLS Fraction of
Absorbed Photosynthetically Active Radiation (FAPAR) Collection 300m Version 1, and hence
follows the delivery scheme of this dataset [GIOGL1_PUM_FAPAR300m-V1].
1.2 CONTENT OF THE DOCUMENT
This document is structured as follows:
Chapter 2 presents a description of the algorithm
Chapter 3 describes the technical characteristics of the product
Chapter 4 summarizes the main results of the quality assessment exercise
Chapter 5 gives examples of the product usage
The users’ requirements are recalled in Annex.
1.3 RELATED DOCUMENTS
1.3.1 Applicable document
AD1: Annex I – Technical Specifications JRC/IPR/2015/H.5/0026/OC to Contract Notice 2015/S
151-277962 of 7th August 2015
AD2: Appendix 1 – Copernicus Global land Component Product and Service Detailed Technical
requirements to Technical Annex to Contract Notice 2015/S 151-277962 of 7th August 2015
AD3: GIO Copernicus Global Land – Technical User Group – Service Specification and Product
Requirements Proposal – SPB-GIO-3017-TUG-SS-004 – Issue I1.0 – 26 May 2015.
1.3.2 Input
Document ID Descriptor
GIOGL1_ATBD_DMP300m-V1 Algorithm Theoretical Basis Document of the Dry Matter Productivity Collection 300m Version 1

Copernicus Global Land Operations – Lot 1
Date Issued: 07.02.2018
Issue: I1.21
Document-No. CGLOPS1_PUM_DMP300m-V1 © C-GLOPS1 consortium
Issue: I1.21 Date: 07.02.2018 Page: 13 of 44
GIOGL1_ATBD_DMP1km-V2 Algorithm Theoretical Basis Document of the Dry Matter Productivity Collection 1km Version 2
GIOGL1_ATBD_FAPAR1km-V2 Algorithm Theoretical Basis Document of the FAPAR Collection 1km Version 2 products
GIOGL1_PUM_FAPAR300m-V1 Product User Manual of the FAPAR Collection 300m Version 1
GIOGL1_QAR_FAPAR300m-V1 The quality assessment report of the PROBA-V FAPAR Collection 300m Version 1 products
GIOGL1_QAR_DMP300m-V1 The quality assessment report of the PROBA-V DMP Collection 300m Version 1 products
1.3.3 External reference
SPOT-VGT http://www.spot-vegetation.com/index.html
PROBA-V http://proba-v.vgt.vito.be/
ImagineS_RP2.1_ATBD-FAPAR300m Algorithm Theoretical Basis Document LAI, FAPAR and FCOVER 300m.

Copernicus Global Land Operations – Lot 1
Date Issued: 07.02.2018
Issue: I1.21
Document-No. CGLOPS1_PUM_DMP300m-V1 © C-GLOPS1 consortium
Issue: I1.21 Date: 07.02.2018 Page: 14 of 44
2 ALGORITHM
2.1 INTRODUCTION
DMP, or Dry Matter Productivity, gives an indication of the dry matter biomass increase (growth
rate) of the vegetation and is directly related to the well-known NPP (Net Primary Productivity), but
customized for agro-statistics and expressed in kilograms of dry matter (kg DM) per hectare per
day.
DMP images, in this case derived from PROBA-V (from January 2014) imagery combined with
(modelled) meteorological data from ECMWF, are made available at 300m resolution and are
updated every 10 days.
Relation between Net Primary Production (NPP) and Dry Matter Productivity (DMP)
DMP, or Dry Matter Productivity, represents the overall growth rate or dry biomass increase of the
vegetation, expressed in kilograms of dry matter per hectare per day (kgDM/ha/day). DMP is
directly related to NPP (Net Primary Productivity, in gC/m²/day), but its units are customized for
agro-statistical purposes.
1 kgDM/ha/day = 1000 gDM/ha/day = 0.1 gDM/m2/day (1)
According to Atjay et al. (1979), the efficiency of the conversion between carbon and dry matter is
on the average 0.45 gC/gDM. So NPP and DMP only differ by a constant. In practice, to scale
DMP to NPP following calculation should be done:
NPP [gC/m2/day] = DMP [kgDM/ha/day] * 0.45 * 0.1 (2)
Similar to the relation between NPP and DMP also the agronomic equivalent of the GPP (Gross
Primary Productivity) can be defined as GDMP (Gross Dry Matter Productivity). Scaling from NPP
to GDMP or oppositely is similar to the scaling described above. The main difference between the
NPP/DMP and GPP/GDMP is the inclusion of the autotrophic respiration.
2.2 RETRIEVAL METHODOLOGY
2.2.1 Background
A simplified Monteith (1972) approach, using remote sensing data to provide the fraction of
absorbed PAR-radiation (fAPAR), was first implemented by Veroustraete (1994) and provided NPP

Copernicus Global Land Operations – Lot 1
Date Issued: 07.02.2018
Issue: I1.21
Document-No. CGLOPS1_PUM_DMP300m-V1 © C-GLOPS1 consortium
Issue: I1.21 Date: 07.02.2018 Page: 15 of 44
estimates for European forests. The current version of the DMP is a modification of this original
model, operating on meteorological data from ECMWF and the CGLS fAPAR.
2.2.2 Input data
Meteodata: Up till 2014, the global meteo data were delivered by MeteoConsult in the frame of
MARSOP3, in the form of daily CSV-files, providing for each “grid-cell” (at 0.25° resolution) the
values of all standard meteorological variables. Basically, all daily data are “operational forecasts
for the next 24 hours” derived from ECMWF (ERA-Interim for the years 1989-2008). Radiation, Tmin
and Tmax are derived from these dataset for the DMP calculations. The Copernicus Global Land
Service adopted the retrieval of the global meteorological data from MeteoConsult in dito format.
fAPAR corresponds to the fraction of photosynthetically active radiation absorbed by the green
elements of the canopy. It depends on canopy structure, vegetation element optical properties and
illumination conditions. The current 300 m DMP uses a 10-daily fAPAR based on PROBA-V data.
The algorithm is described in detail in the ATBD (ImagineS_RP2.1_ATBD-FAPAR300).
Land Cover information: The DMP 300m V1 uses biome specific Light Use Efficiency (LUE)
values. The information on the global distribution of land cover types comes from the ESA CCI
Land Cover Map (epoch 2010), which was derived from ENVISAT-MERIS and SPOT-VGT imagery
of the period 2008-2010. The land cover classes are based on the UN Land Cover Classification
System (LCCS). The global map is shown in Figure 1.
Figure 1: Global land cover map (ESA CCI epoch 2010) derived from ENVISAT MERIS and SPOT-VGT
data.
2.2.3 Processing steps
The GDMP and DMP product of the Global Land service is currently computed with the following
Monteith variant (see Table 1):
GDMP = R.c.fAPAR.LUEc.T.CO2[.RES] (3)
DMP = R.c.fAPAR.LUEc.T.CO2.AR[.RES] (4)

Copernicus Global Land Operations – Lot 1
Date Issued: 07.02.2018
Issue: I1.21
Document-No. CGLOPS1_PUM_DMP300m-V1 © C-GLOPS1 consortium
Issue: I1.21 Date: 07.02.2018 Page: 16 of 44
Table 1: Individual terms in the Monteith variant used for Global Land service GDMP/DMP. All terms
are expressed on a daily basis.
TERM MEANING VALUE UNIT
GDMP Gross Dry Matter Productivity 0 - 640 kgDM/ha/day
DMP Dry Matter Productivity 0 – 320 kgDM/ha/day
R Total shortwave incoming radiation (0.2 – 3.0µm) 0 – 320 GJT/ha/day
c Fraction of PAR (0.4 – 0.7µm) in total shortwave 0.48 JP/JT
fAPAR PAR-fraction absorbed (PA) by green vegetation 0.0 ... 1.0 JPA/JP
LUEc Light use efficiency (DM=Dry Matter) at optimum Biome-specific kgDM/GJPA
T Normalized temperature effect 0.0 ... 1.0 -
CO2 Normalized CO2 fertilization effect 0.0 ... 1.0 -
AR Fraction kept after autotrophic respiration 0.5 -
RES Fraction kept after omitted effects (drought, pests...) 1.0 -
A detailed description of the terms are described in the ATBD [GIOGL1_ATBD_DMP300m-V1].
Given the simple elaboration of the epsilons (and dropping the factor RES), equation (3) and
equation (4) can be rewritten as:
GDMP = R.c.fAPAR.LUEc.T.CO2 = fAPAR.LUEc.R.(T,CO2) = fAPAR.LUEc.GDMPmax (5)
DMP = GDMP.AR = GDMP . 0.5 (6)
with (T,CO2)=c.T.CO2 and LUEc is the land cover specific LUE. This formulation better highlights
the fact that (within the limits of the described model) GDMP is only determined by four basic
factors: fAPAR, radiation (R), temperature (T) and CO2. At the same time, equation (5) provides a
practical method which allows bypassing the differences in temporal and spatial resolution
between the inputs. In practice, the meteorological inputs (R, T) are provided on a daily basis and
at a very low resolution, here 0.25° x 0.25°. On the contrary, fAPAR is provided on a dekadal
basis, having pixels with a size of around 300x300m. The ESA CCI land cover map is also applied
at 300m resolution to include the Light Use Efficiency (LUE or LUEc) factor. Then, the final
GDMP/DMP-product has this 300m resolution and dekadal frequency.
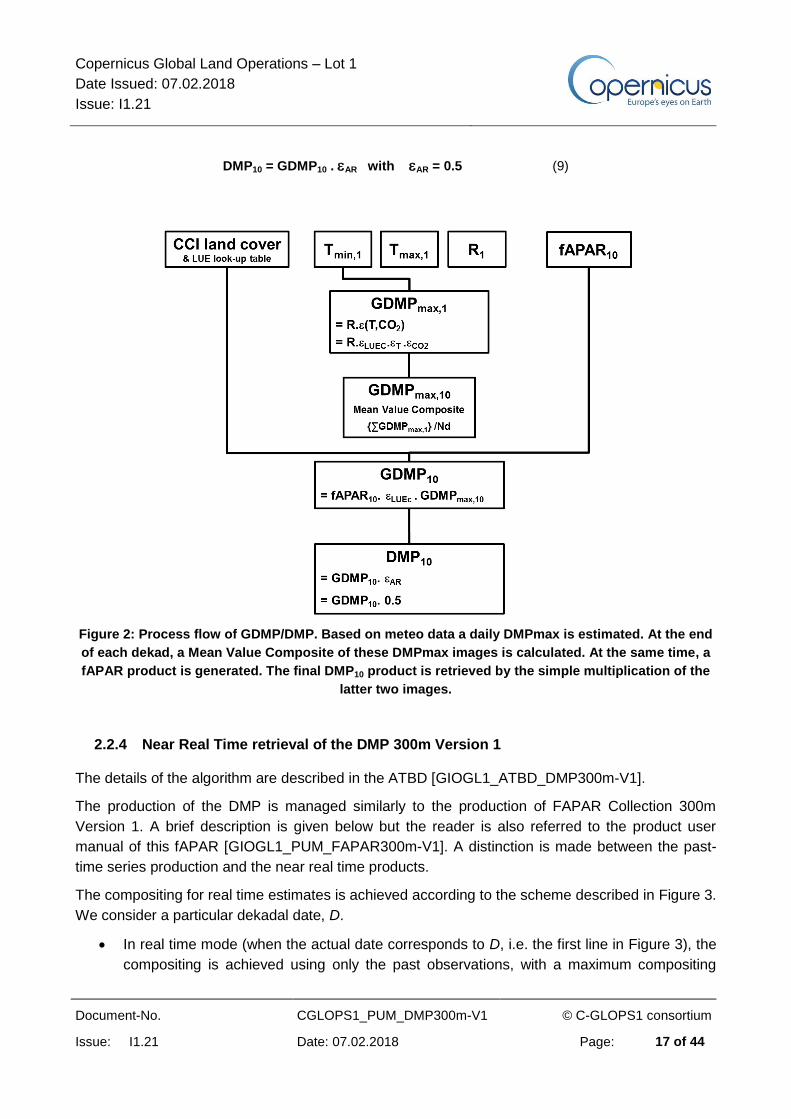
So, in practice, we use the procedure (Eerens et al., 2004) illustrated in Figure 2 and can be
formulated as follows (the subscripts 1 and 10 indicate daily and dekadal products, Nd is the
number of days in each dekad)
GDMP10 = fAPAR10 . LUEc . GDMPmax,10 with GDMPmax,10 = {GDMPmax,1} /Nd (8)
Copernicus Global Land Operations – Lot 1
Date Issued: 07.02.2018
Issue: I1.21
Document-No. CGLOPS1_PUM_DMP300m-V1 © C-GLOPS1 consortium
Issue: I1.21 Date: 07.02.2018 Page: 17 of 44
DMP10 = GDMP10 . AR with AR = 0.5 (9)
Figure 2: Process flow of GDMP/DMP. Based on meteo data a daily DMPmax is estimated. At the end
of each dekad, a Mean Value Composite of these DMPmax images is calculated. At the same time, a
fAPAR product is generated. The final DMP10 product is retrieved by the simple multiplication of the
latter two images.
2.2.4 Near Real Time retrieval of the DMP 300m Version 1
The details of the algorithm are described in the ATBD [GIOGL1_ATBD_DMP300m-V1].
The production of the DMP is managed similarly to the production of FAPAR Collection 300m
Version 1. A brief description is given below but the reader is also referred to the product user
manual of this fAPAR [GIOGL1_PUM_FAPAR300m-V1]. A distinction is made between the past-
time series production and the near real time products.
The compositing for real time estimates is achieved according to the scheme described in Figure 3.
We consider a particular dekadal date, D.
In real time mode (when the actual date corresponds to D, i.e. the first line in Figure 3), the
compositing is achieved using only the past observations, with a maximum compositing

Copernicus Global Land Operations – Lot 1
Date Issued: 07.02.2018
Issue: I1.21
Document-No. CGLOPS1_PUM_DMP300m-V1 © C-GLOPS1 consortium
Issue: I1.21 Date: 07.02.2018 Page: 18 of 44
window spanning c- days in the past. The value of the product at dekadal date D is
therefore relatively inaccurate.
Then, the observations accumulate after dekadal date D when time passing. The value at
dekadal date D is updated using the observations available after dekadal date D within the
consolidation period. The accuracy of the product value progressively improves during this
consolidation period.
At the end of the consolidation period that lasts c+ days, the value of the product value at
dekadal date D have converged towards the ‘historical’ value, i.e. when there is at least c-
days (maximum length of the compositing window) after dekadal date D.
Figure 3: Scheme showing the compositing used for real time estimates
Note that the compositing period is not symmetric: the maximum compositing window in the past is
longer than the maximum compositing window in the future (after date D) that is limited by the
length of the consolidation period. The length of the maximum compositing window is set to 60
days, however more daily observations are used to classify the pixel as Evergreen Broadleaf
Forest (EBF) or no-EBF. If not enough daily observations are available to estimate the decadal
value, either an interpolation with the surrounding dekads is performed or in case of EBF the value
will be based on the previous decadal value.
Once a new dekad is available after dekadal date D, the value of the product at dekadal date D is
updated, and replaces the previous update. This allows saving significant space. The reliability of
the estimate will increase with the consolidations. The product is provided in the following

Copernicus Global Land Operations – Lot 1
Date Issued: 07.02.2018
Issue: I1.21
Document-No. CGLOPS1_PUM_DMP300m-V1 © C-GLOPS1 consortium
Issue: I1.21 Date: 07.02.2018 Page: 19 of 44
consolidations: RT0 (at dekad D), RT1 (at dekad D+1), RT2 (at dekad D+2) and RT5 (at dekad
D+5).
2.3 LIMITATIONS
Following remarks should be taken into consideration when interpreting the DMP products:
The biome-specific LUE’s are calibrated against flux tower Eddy Covariance (EC) data. These
flux data are considered as ground truth measurements of GPP. But in fact, this GPP is a
combination of Net Ecosystem Exchange (NEE) measurements and a modelled respiration
factor. Additionally, there are other reasons to question the relation between flux
measurements and modelled GPP estimates. The spatial representativeness of the tower, for
example, is strongly dependent on local conditions like the towers footprint, wind direction, etc.
Thus caution should be made when comparing 1 km pixel values with tower observations.
Each tower also has its specific environmental conditions like soil properties, precipitation,
elevation,…This makes it difficult to generalize tower specific parameterization into broad
categories like land cover.
The biome-specific parametrization requires accurate information on the land cover type. At
global scale, a land cover map will always contain a fraction of falsely classified pixels.
The in-situ data availability can determine the reliability of the biome-specific LUE’s. For
example, for needlelaved deciduous forests, there is only one tower available which even was
classified differently in the land cover map as the IGBP legend.
Some potentially important factors, such as drought stress, nutrient deficiencies, pests and
plant diseases, are omitted in the DMP product. As a consequence, the product might better be
called “potential” DMP. On the other hand, it might be argued that the adverse effects of
drought, diseases and shortages of nutrients are manifested (sooner or later) via the RS-
derived fAPAR.
The DMP algorithm does not include a water stress factor to account for short term drought
stresses. In drought sensitive vegetation types, this can lead to an overestimation of the actual
plants productivity. The temperature dependency factor uses generalized values derived from
the parameterization on European forests (Veroustraete et al., 2002) and these
parameterization may not hold for other biome types and agro-ecological zones. Especially the
difference between C3 and C4 vegetation types is pronounced. C3 plants (like the forests used
in the current calibration) will have their optimal temperate around 20-25 degrees whereas C4
plants will reach their optimum around 30-35 degrees (Massad et al., 2007; Yamori et al.,
2013).
The autotrophic respiration is calculated as a simple fraction of GDMP and is therefore
assumed to have the same ecophysiological behaviour. In other models (e.g. used for MODIS
product retrieval), the autotrophic respiration is considered as an independent component.
The CO2 fertilization factor relies on the original definition by Veroustraete (1994). We
acknowledge that more sophisticated and state-of-the-art CO2 fertilization submodels should be
developed. But in the Copernicus Global Land Service, the focus is on algorithm

Copernicus Global Land Operations – Lot 1
Date Issued: 07.02.2018
Issue: I1.21
Document-No. CGLOPS1_PUM_DMP300m-V1 © C-GLOPS1 consortium
Issue: I1.21 Date: 07.02.2018 Page: 20 of 44
implementation rather than on fundamental research on algorithm components. Hence we
have to rely on existing described methods. If state-of-the-art modules are being developed
which have proven themselves, it can be considered to implement them in the GDMP.

Copernicus Global Land Operations – Lot 1
Date Issued: 07.02.2018
Issue: I1.21
Document-No. CGLOPS1_PUM_DMP300m-V1 © C-GLOPS1 consortium
Issue: I1.21 Date: 07.02.2018 Page: 21 of 44
3 PRODUCT DESCRIPTION
The Dry Matter Productivity and Gross Dry Matter Productivity Collection 300m Version 1
products follow the naming standard:
c_gls_<product>[-<RTx>]_<YYYYMMDDhhmm>_<AREA>_<SENSOR>_V<Major.Minor.Run>
where
<product> is either DMP300 (Dry Matter Productivity) or GDMP300 (Gross Dry Matter
Productivity)
<RTx> is an optional parameter. It is uses whenever a real-time product is provided:
RT0: Near Real Time product
RT1 or RT2: Consolidated Real Time product (in convergence period), where the
number equals the number of times the RT0 product was successively updated
RT5: Final consolidated Real Time product
For OFFLINE reprocessing, this parameter is omitted.
<YYYYMMDDhhmm> gives the temporal location of the file. YYYY, MM, DD, hh, and mm
denote the year, the month, the day, the hour, and the minutes, respectively.
<AREA> gives the spatial coverage of the file. In this case, <AREA> is GLOBE, the name
used for the full globe.
<SENSOR> gives the name of the sensor family used to retrieve the product, so VGT
referencing SPOT-VEGETATION, and PROBAV for PROBA-V.
<Major.Minor.Run> gives the version number of the product. “Major” increases when the
algorithm is updated. “Minor” increases when bugs are fixed or when processing lines are
updated (metadata, colour quicklook, etc...). “Run” increases whenever a new processing
run (with the same major and minor version) is performed without a change in the algorithm
(e.g. due to a change in input data). This version refers to Major = 1.
3.1 FILE FORMAT
The DMP/GDMP Collection 300m Version 1 products are delivered with global coverage in
compressed Network Common Data Form version 4 (netCDF4) files with metadata attributes
compliant with version 1.6 of the Climate and Forecast (CF) conventions.
Separate products are delivered for DMP and GDMP variables.

Copernicus Global Land Operations – Lot 1
Date Issued: 07.02.2018
Issue: I1.21
Document-No. CGLOPS1_PUM_DMP300m-V1 © C-GLOPS1 consortium
Issue: I1.21 Date: 07.02.2018 Page: 22 of 44
The multi layer GDMP netCDF files contain the following layers:
o GDMP: Gross Dry Matter Productivity value
o QFLAG : Quality Flag indicator
The multi layer DMP netCDF files contain the following layers:
o DMP : Dry Matter Productivity value
o QFLAG : Quality Flag indicator
Separately from the data file, the following files are available:
An xml file containing the metadata conforms to INSPIRE2.1.
A quicklook in a coloured GeoTIFF format, sub-sampled to 25% in both horizontal and
vertical directions from the DMP or GDMP layer.
For a more user-friendly viewing of the XML metadata, an XSL transformation file can be
downloaded on https://land.copernicus.eu/global/sites/cgls.vito.be/files/xml/c_gls_ProductSet.xsl
This file should be placed in the same folder as the XML file.
The products are delivered as one single global image, covering 180°W to 180°E longitude and
80°N to 60°S latitude. The globe is divided in 36 tiles in longitude and 18 in latitude according to
Figure 4. Only the green tiles, covering land, are generated and hence integrated in the global
image. The meteorological input is bound from 75°N to 50°S, hence the green tiles outside this
window are filled with empty values (Table 3). In winter season, the northern hemisphere has less
observation, hence the number of available tiles could be less.
Note that continental tiles, as defined as in Table 2 for AFRI and SOAM are distributed over
EUMETCast. The distribution is limited to the real-time mode, hence products with file name
convention c_gls_DMP300-RT0_* or c_gls_DMP300-RT0_*.

Copernicus Global Land Operations – Lot 1
Date Issued: 07.02.2018
Issue: I1.21
Document-No. CGLOPS1_PUM_DMP300m-V1 © C-GLOPS1 consortium
Issue: I1.21 Date: 07.02.2018 Page: 23 of 44
Figure 4: Regions of DMP/GDMP product. Red lines indicate the boundaries on availability of
meteorological data.
Short name Continent
AFRI Africa: 30°W – 60°E, 40°N – 40°S
SOAM South America: 110°W – 30°W, 20°N – 60°S
Table 2: Definition of the continental tiles distributed via Eumetcast
3.2 PRODUCT CONTENT
3.2.1 Data Files
Table 3 gives the digital numbers associated with the physical DMP and GDMP range and no data
values. Note that no uncertainties are associated to DMP and GDMP values. The physical values
are retrieved by:
PhyVal = DN * scale_factor + add_offset
where the scale_factor and add_offset are given in the table below. This rescaling formula does
not apply to the binary numbers representing special flag values (Table 3).

Copernicus Global Land Operations – Lot 1
Date Issued: 07.02.2018
Issue: I1.21
Document-No. CGLOPS1_PUM_DMP300m-V1 © C-GLOPS1 consortium
Issue: I1.21 Date: 07.02.2018 Page: 24 of 44
Table 3: Range of values and scaling factors of GDMP/DMP.
GDMP
(kg Dry Matter / ha / day)
DMP
(kg Dry Matter / ha / day)
Minimum value 0 0
Maximum value 655.34 327.67
Maximum DN value 32767 32767
Missing value -1 -1
Specific value for sea -2 -2
Scale_factor 0.02 0.01
Add_offset 0 0
Once properly decoded, the physical DMP (GDMP) values range between 0 and 327.67 (655.34)
kg dry matter per hectare per day. The lowest values are found over non vegetated areas like
deserts, urban areas or outside the growing season in cold climate zones. The highest values
indicate high productive pixels, often found over forested areas in the peak of the growing season
or in tropical zones.
3.2.2 QFLAG image
In addition to the quality flags in the negative range of the data image (Table 3), the quality of the
GDMP/DMP product is also directly linked to the quality of the input fAPAR.
Table 4 provides the DMP/GDMP 300m version 1 QFLAG layer. This layer is derived from the
FAPAR 300m quality indicator as referenced in the last column of the table.
Table 4: Range of values of QFLAG.
Bit Qualitative indicator Meaning Mapping on FAPAR300
1 FAPAR missing or invalid
0 = Available FAPAR300 value
1 = Missing FAPAR300 value
FAPAR = 255
2 Meteo missing or invalid 0 = Available Meteo values
1 = Missing Meteo values
-
3 Not used
4 Evergreen Broadleaf Forest (EBF)
1 = EBF
0 = no EBF
QFLAG bit 2

Copernicus Global Land Operations – Lot 1
Date Issued: 07.02.2018
Issue: I1.21
Document-No. CGLOPS1_PUM_DMP300m-V1 © C-GLOPS1 consortium
Issue: I1.21 Date: 07.02.2018 Page: 25 of 44
5 Not used
6 Not used
7 FAPAR computation for EBF
0 = FAPAR from daily observations
1 = FAPAR filled from previous dekad
QFLAG bit 5
8 FAPAR gap filling by interpolation
0 = FAPAR not interpolated
1 = FAPAR interpolated
QFLAG Bit 3
3.2.3 File and Layer attributes
The netCDF file contains a number of attributes
at the file-level, see Table 5
at the level of the variables (layers), see Table 6
at the level of the standard coordinate (dimension) variables for latitude (‘lat’) and longitude
(‘lon’), holding one value per row or column respectively: see Table 7
at the level of the grid mapping (spatial reference system) variable (named ‘crs’): seeTable
8
at the level of time coordinate, see Table 9

Copernicus Global Land Operations – Lot 1
Date Issued: 07.02.2018
Issue: I1.21
Document-No. CGLOPS1_PUM_DMP300m-V1 © C-GLOPS1 consortium
Issue: I1.21 Date: 07.02.2018 Page: 26 of 44
Table 5: Description of netCDF file attributes
Attribute name Description Data
Type Example
Conventions Version of the CF-Conventions used String CF-1.6
title A description of the contents of the file String 10-daily Dry Matter Productivity 333M:
GLOBE 2014-02-10T00:00:00Z
institution The name of the institution that
produced the product String VITO NV
source The method of production of the
original data String Derived from EO satellite imagery
history
A global attribute for an audit trail. One
line, including date in ISO-8601
format, for each invocation of a
program that has modified the dataset.
String 2017-04-21 Processing line DMP2
333M
references
Published or web based references
that describe the data or methods
used to produce it.
String https://land.copernicus.eu/global/prod
ucts/dmp
archive_facility Specifies the name of the institution
that archives the product String VITO
product_version Version of the product (VM.m.r) String V1.0.1
time_coverage_start Start date and time of the total
coverage of the data for the product. String 2014-02-01T00:00:00Z
time_coverage_end End date and time of the total
coverage of the data for the product. String 2014-02-10T23:59:59Z
platform Name(s) of the orbiting platform(s) String Proba-V
sensor Name(s) of the sensor(s) used String VEGETATION
identifier Unique identifier for the product String
urn:cgls:global:dmp300_v1_333m:DM
P300_201402100000_GLOBE_PROB
AV_V1.0.1
parent_identifier
Identifier of the product collection (time
series) for the product in Copernicus
Global Land Service metadata
catalogue.
String urn:cgls:global:dmp300_v1_300m
long_name Extended product name String Dry matter productivity
orbit_type Orbit type of the orbiting platform(s) String LEO
processing_level Product processing level String L3
processing_mode
Processing mode used when
generating the product (Near-Real
Time, Consolidated or Reprocessing)
String Offline
copyright
Text to be used by users when
referring to the data source of this
product in publications (copyright
notice)
String Copernicus Service information 2018
Copernicus Global Land Operations – Lot 1
Date Issued: 07.02.2018
Issue: I1.21
Document-No. CGLOPS1_PUM_DMP300m-V1 © C-GLOPS1 consortium
Issue: I1.21 Date: 07.02.2018 Page: 27 of 44
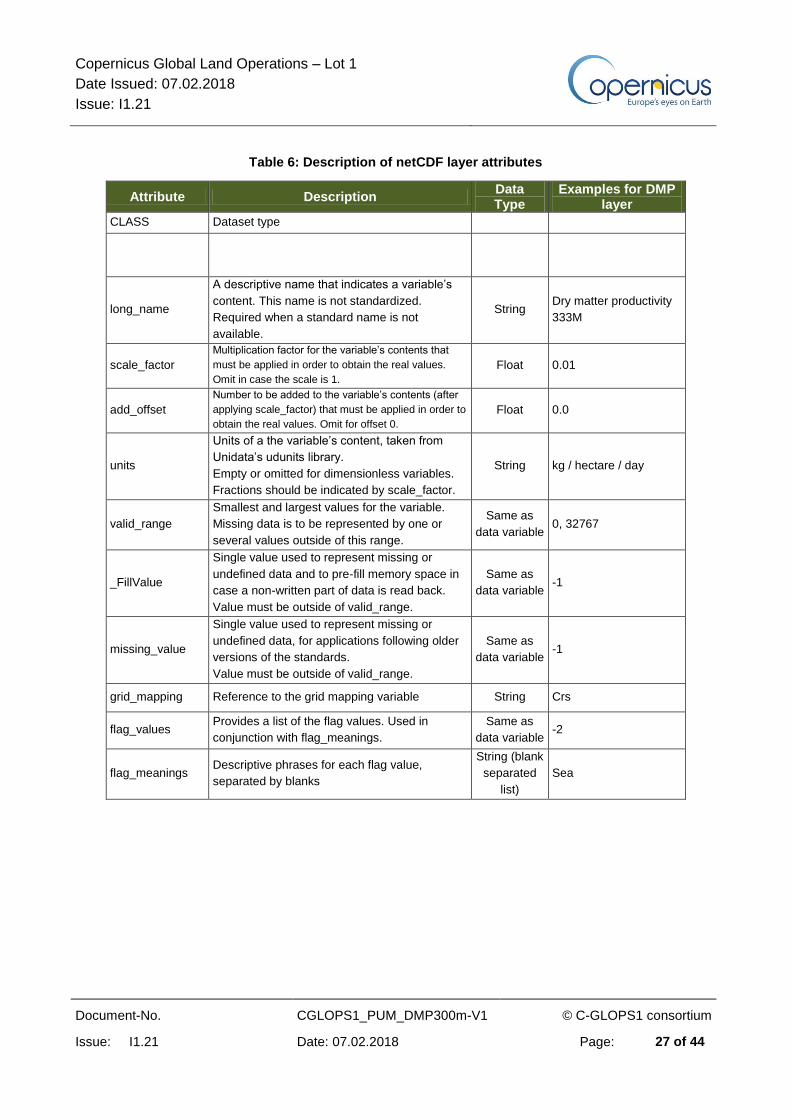
Table 6: Description of netCDF layer attributes
Attribute Description Data Type
Examples for DMP layer
CLASS Dataset type String DATA
long_name
A descriptive name that indicates a variable’s
content. This name is not standardized.
Required when a standard name is not
available.
String Dry matter productivity
333M
scale_factor
Multiplication factor for the variable’s contents that
must be applied in order to obtain the real values.
Omit in case the scale is 1.
Float 0.01
add_offset
Number to be added to the variable’s contents (after
applying scale_factor) that must be applied in order to
obtain the real values. Omit for offset 0.
Float 0.0
units
Units of a the variable’s content, taken from
Unidata’s udunits library.
Empty or omitted for dimensionless variables.
Fractions should be indicated by scale_factor.
String kg / hectare / day
valid_range
Smallest and largest values for the variable.
Missing data is to be represented by one or
several values outside of this range.
Same as
data variable 0, 32767
_FillValue
Single value used to represent missing or
undefined data and to pre-fill memory space in
case a non-written part of data is read back.
Value must be outside of valid_range.
Same as
data variable -1
missing_value
Single value used to represent missing or
undefined data, for applications following older
versions of the standards.
Value must be outside of valid_range.
Same as
data variable -1
grid_mapping Reference to the grid mapping variable String Crs
flag_values Provides a list of the flag values. Used in
conjunction with flag_meanings.
Same as
data variable -2
flag_meanings Descriptive phrases for each flag value,
separated by blanks
String (blank
separated
list)
Sea

Copernicus Global Land Operations – Lot 1
Date Issued: 07.02.2018
Issue: I1.21
Document-No. CGLOPS1_PUM_DMP300m-V1 © C-GLOPS1 consortium
Issue: I1.21 Date: 07.02.2018 Page: 28 of 44
Table 7: Description of netCDF coordinate variable attributes
Attribute Description Data Type
Example
CLASS Dataset type String DIMENSION_SCALE
DIMENSION_
LABELS Label used in netCDF4 library String Lon
NAME Short name String Lon
standard_name
A standardized name that references a
description of a variable’s content in CF-
Convention’s standard names table. Note
that each standard_name has corresponding
unit (from Unidata’s udunits).
String longitude
long_name
A descriptive name that indicates a variable’s
content. This name is not standardized.
Required when a standard name is not
available.
String longitude
units Units of a the variable’s content, taken from
Unidata’s udunits library. String degrees_east
axis Identifies latitude, longitude, vertical, or
time axes. String X
_CoordinateAxisType Label used in GDAL library String Lon
Table 8: Description of netCDF grid mapping variable attributes
Attribute Description Data Type
Example
GeoTransform
Six coefficients for the affine transformation
from pixel/line space to coordinate space,
as defined in GDAL’s GeoTransform
String
-180.0000000000
0.0089285714 0.0
80.0000000000 0.0
-0.0089285714
_CoordinateAxisTypes Label used in GDAL library
String,
blank
separated
GeoX GeoY
_CoordinateTransform
Type Type of transformation String Projection
grid_mapping_name Name used to identify the grid mapping String latitude_longitude
inverse_flattening
Used to specify the inverse flattening (1/f)
of the ellipsoidal figure
associated with the geodetic datum and
used to approximate the
shape of the Earth
Float 298.257223563
long_name A descriptive name that indicates a
variable’s content. String
coordinate
reference system
longitude_of_prime_m
eridian
Specifies the longitude, with respect to
Greenwich, of the prime meridian
associated with the geodetic datum
Float 0.0

Copernicus Global Land Operations – Lot 1
Date Issued: 07.02.2018
Issue: I1.21
Document-No. CGLOPS1_PUM_DMP300m-V1 © C-GLOPS1 consortium
Issue: I1.21 Date: 07.02.2018 Page: 29 of 44
semi_major_axis
Specifies the length, in metres, of the semi-
major axis of the
ellipsoidal figure associated with the
geodetic datum and used to
approximate the shape of the Earth
Float 6378137.0
spatial_ref Spatial reference system in OGC’s Well-
Known Text (WKT) format String
GEOGCS["WGS
84",DATUM["WGS
_1984",…
AUTHORITY["EPS
G","4326"]]
Table 9: Description of netCDF attributes for time coordinate variable
Attribute Description Data Type
Example
CLASS Dataset type String DIMENSION_SCALE
NAME Short name String time
long_name
A descriptive name that indicates a variable’s
content. This name is not standardized. Required
when a standard name is not available.
String Time
units Units of a the variable’s content, taken from
Unidata’sudunits library. String
Days since
1970-01-01 00:00:00
axis Identifies latitude, longitude, vertical, or
time axes. String T
calendar Specific calendar assigned to the time variable,
taken from the Unidata’sudunits library. String standard
3.2.4 Quicklook image
The quicklook is a GEOTIFF file, representing either the DMP or GDMP layer. The spatial
resolution is sub-sampled, using nearest neighbour re-sampling, to 5% in both directions.
The quicklook is provided in an unsigned character (8 bits) with a scale factor of 1.28 and an offset
of 0 (see Table 10).
Digital Value Description Decode
0 No DMP n.a.
1 to 255 Unit: kg Dry Matter / ha / day Scaling factor: 1.28
Offset: 0
Table 10 : QuickLook - value signification

Copernicus Global Land Operations – Lot 1
Date Issued: 07.02.2018
Issue: I1.21
Document-No. CGLOPS1_PUM_DMP300m-V1 © C-GLOPS1 consortium
Issue: I1.21 Date: 07.02.2018 Page: 30 of 44
The physical values can be retrieved from the digital numbers using the following formula:
physical value = (digital number * Sc) + Off, where Sc and Off are the scaling
factor and offset parameters from the “Decode” column in the table above.
The quicklook is provided with an embedded color table (Figure 5).
Figure 5 : Color coding for quicklook images
3.3 PRODUCT CHARACTERISTICS
3.3.1 Projection and grid information
The product is displayed in a regular latitude/longitude grid (plate carrée) with the ellipsoïd WGS
1984 (Terrestrial radius=6378km). The resolution of the grid is 1/112°.
The reference is the centre of the pixel. It means that the longitude of the upper left corner of the
pixel is (pixel_longitude – angular_resolution/2.). The product is provided at global scale. However,
through a custom order, the user is able to select either region according to his/her needs.
3.3.2 Spatial information
As shown in Figure 4, the DMP/GDMP product is provided from longitude 180°W to 180°E and
latitude 80°N to 60°S.
3.3.3 Temporal information
The temporal information “YYYYMMDDhhmm” in the filename corresponds to the end date of the
dekad, similar to the corresponding FAPAR300 input product.
For example, the file c_gls_DMP300-RT0_201508310000_GLOBE_PROBAV_V1.0.1.nc
corresponds to the NRT values for the dekad from 21/08/2015 to 31/08/2015.
The temporal information is detailed in the netCDF attributes time_coverage_start and
time_coverage_end and in the XML metadata (by the fields "EX_TemporalExtent : beginPosition"
and "EX_TemporalExtent : endPosition"), each expressed as “YYYY-MM-DDTHH:MM::SS”, giving
the beginning and the end of the 10-days time period, respectively. The startPosition of the 10-
days time period is always set to the 01st, 11th or 21th day of the month.

Copernicus Global Land Operations – Lot 1
Date Issued: 07.02.2018
Issue: I1.21
Document-No. CGLOPS1_PUM_DMP300m-V1 © C-GLOPS1 consortium
Issue: I1.21 Date: 07.02.2018 Page: 31 of 44
3.4 DATA POLICIES
All users of the Global Land service products benefit from the free and open access policy as
defined in the European Union’s Copernicus regulation (N° 377/2014 of 3 April 2014) and
Commission Delegated Regulation (N° 1159/2013), available on the Copernicus programme’s web
site, http://www.copernicus.eu/library/detail/248). Products from legacy R&D projects are also
provided with free and open action.
This includes the following use, in so far that is lawful:
a) reproduction;
b) distribution;
c) communication to the public;
d) adaptation, modification and combination with other data and information;
e) any combination of points (a) to (d).
EU law allows for specific limitations of access and use in the rare cases of security concerns,
protection of third party rights or risk of service disruption.
By using Sentinel Data or Service Information the user acknowledges that these conditions
are applicable to him/her and that the user renounces to any claims for damages against
the European Union and the providers of the said Data and Information. The scope of this
waiver encompasses any dispute, including contracts and torts claims that might be filed in
court, in arbitration or in any other form of dispute settlement.
Where the user communicates to the public on or distributes the original DMP/GDMP products,
he/she is obliged to refer to the data source with (at least) the following statement (included as the
copyright attribute of the netCDF file):
Copernicus Service information [Year]
with [Year]: year of publication
Where the user has adapted or modified the products, the statement should be:
Contains modified Copernicus Service information [Year]
For complete acknowledgement and credits, the following statement can be used:
"The products were generated by the Global Land Service of Copernicus, the Earth Observation
program of the European Commission. The research leading to the current version of the product
has received funding from various European Commission Research and Technical Development
programs. The product is based on PROBA-V data (© ESA).”

Copernicus Global Land Operations – Lot 1
Date Issued: 07.02.2018
Issue: I1.21
Document-No. CGLOPS1_PUM_DMP300m-V1 © C-GLOPS1 consortium
Issue: I1.21 Date: 07.02.2018 Page: 32 of 44
The user accepts to inform the Copernicus Global Land Service about the outcome of the use of
the above-mentioned products and to send a copy of any publications that use these products to
the following address [email protected].
3.5 CONTACTS
The DMP/GDMP products are available through the Copernicus Global Land Service website at
the address:
https://land.copernicus.eu/global/products/dmp
Scientific, Production and Distribution support contact:
https://land.copernicus.eu/global/contactpage
Email address: [email protected]
Accountable contact: European Commission Directorate-General Joint Research Center
Email address: [email protected]

Copernicus Global Land Operations – Lot 1
Date Issued: 07.02.2018
Issue: I1.21
Document-No. CGLOPS1_PUM_DMP300m-V1 © C-GLOPS1 consortium
Issue: I1.21 Date: 07.02.2018 Page: 33 of 44
4 QUALITY ASSESSMENT
Details of the validation of the DMP can be found in the CGLS quality assessment report
[GIOGL1_QAR_DMP300m-V1]. Below we summarize the approach and main results from the
quality assessment.
The CGLS DMP 300 m product is validated against various sources of reference data. The idea
was that using multiple sources of reference information would stimulate the “convergence of
evidence”. The validation is following the guidelines, protocols and metrics defined by the Land
Product Validation (LPV) group of the Committee on Earth Observation Satellite (CEOS). Adjusted
to the specificities of the CGLS DMP, the validation is done on three levels: spatial consistency
analysis, global statistical analysis and temporal consistency analysis. This analysis compare the
CGLS product with DMP/GDMP estimates from modelled or satellite remote sensing products.
Separately, an accuracy assessment is done by comparing the CGLS product with in situ
measurements (FLUXNET).
Only a limited set of reference data is available for an accuracy assessment of the DMP. The
intermediate GDMP product can be validated against FLUXNET estimates, but this tower
information cannot be considered at the moment as representative for all possible biomes and
climatological zones throughout the globe. For the DMP product, no recent and globally
representative in-situ dataset is available. Hence, we rely on comparisons with other EO data
based estimates and models.
The quality assessment revealed that the DMP at 300 m has a large fraction of missing values
during winter in the northern hemisphere. The global product completeness varies between 60 and
75% throughout the year. This is mainly caused by the input fAPAR at 300m which is not gap filled
with and has strong constraints on the solar zenith angle. A global comparison showed that the
CGLS DMP deviates from reference data (remote sensing: MODIS and modelled: ISLSCP-II)
mainly in the boreal regions where the CGLS is lower and the tropics, where the CGLS is higher. In
Europe, the U.S., Sahel and the North China Plain, CGLS matches the ISLSCP-II data fairly well. A
global statistical analysis showed that there is a fairly good overall relation between the CGLS
DMP and reference data for the majority of the pixels. However, there is a wide spread and for high
productive values the CGLS is exceeding the reference data. The agreement between CGLS and
reference data depends on the land cover but the results are often diverging depending on the
reference data source. For example, for cropland, CGLS shows higher values than MODIS and the
modelled data but similar to FLUXNET values. For grassland, CGLS underestimates FLUXNET for
GDMP and the modelled data for DMP, but is exceeding the MODIS values. For broadleaved
evergreen forests, CGLS is in each analysis higher than the reference data. For broadleaved
evergreen forest also diverging results are found. CGLS is exceeding the MODIS for GDMP and
modelled data for GDMP at higher values, but the analysis with FLUXNET showed that the GDMP
is even underestimating the high productive estimates of GDMP. Also for needleleaved evergreen
forests, deviating results are observed. CGLS matches quite well the MODIS GDMP but is
underestimating FLUXNET measurements. The analysis of temporal profiles of CGLS GDMP

Copernicus Global Land Operations – Lot 1
Date Issued: 07.02.2018
Issue: I1.21
Document-No. CGLOPS1_PUM_DMP300m-V1 © C-GLOPS1 consortium
Issue: I1.21 Date: 07.02.2018 Page: 34 of 44
compared to FLUXNET showed that the CGLS GDMP time series are not capable to capture the
field or parcel specific temporal behaviour of crop growth as measured with in-situ FLUXNET data.
The main reason is that the spatial resolution of the EO data does not allow to obtain pure pixel
profiles for crop fields because often surrounding vegetation is mixed in the EO signal. Similar
patterns were observed for managed grasslands where in-season cuts were not captured as
detailed as measured by the FLUXNET data.
Based on the findings above, we consider the DMP as an empirical indicator for vegetation
productivity. Given the limited availability of in-situ reference data for DMP, it is not possible to
provide a clear statement on the products accuracy at global scale. Despite these limitations, the
DMP is considered as a matured product, which has proven to be useful for the monitoring of crops
and pasture.

Copernicus Global Land Operations – Lot 1
Date Issued: 07.02.2018
Issue: I1.21
Document-No. CGLOPS1_PUM_DMP300m-V1 © C-GLOPS1 consortium
Issue: I1.21 Date: 07.02.2018 Page: 35 of 44
5 PRODUCT USAGE
5.1 TYPICAL USE
The DMP products are provided in a single image and are commonly visualized through
specialized software or via quicklooks. Note that, in order to retrieve actual DMP from the images,
the digital numbers have to be divided by 100 (Table 3) or 50 for the GDMP. Missing values due to
clouds or snow/ice and sea are indicated with special flags (see also Table 3).
DMP values are classified into a number of classes and colour-coded for easy interpretation.
Country, province or district boundaries and a lat/lon grid are superposed on the map. An example
of such a quicklook is provided below in Figure 6.
These visual representations of the Dry Matter Productivity product can then be inspected to
identify zones of high or low productivity and as such they are useful for general evaluations of the
ecosystem productivity of an area.
Figure 6 : Global DMP map of the last dekad of July 2014.
5.2 ADVANCED USAGE: HOW TO ANALYZE THE DATA
The examples shown below are from DMP Collection 1km Version 1 product. Similar usage can be
done with DMP Collection 300m product.
For dry matter productivity assessment over the growing season, an analysis needs to be made of
a multi-temporal set of those images so that the progress of the growing season and changing
growth rates can be assessed (e.g. by looking at the differences of consecutive images in the
same season, or by comparing to previous years or seasons or long term averages). Alternatively,
the Dry Matter Productivity images (kg/ha/day) can be cumulated over time from the start of the
season in order to estimate the final dry matter (kg/ha) which had been produced by the vegetation

Copernicus Global Land Operations – Lot 1
Date Issued: 07.02.2018
Issue: I1.21
Document-No. CGLOPS1_PUM_DMP300m-V1 © C-GLOPS1 consortium
Issue: I1.21 Date: 07.02.2018 Page: 36 of 44
over time. When properly calibrated against official yield statistics (post-processed) DMP products
can even be used for crop yield estimation and forecasting.
Possible post-processing operations:
1. Calculation of differences (in absolute values or percentages):
Differencing consecutive images in one season makes it possible to assess the progress
(evolution) of dry matter productivity and growth rates during the season.
Calculation of the differences between current DMP images and images of previous years
or seasons or long-term averages, allows the detection of anomalies in vegetation growth,
e.g. Figure 7.
Figure 7 : Western Africa, last dekad of July 2006.
Absolute difference in DMP with respect to long term average. Green = better situation, Red = worse
2. Cumulating DMP over time, from the start of the season onwards, provides estimates of final
dry matter production over time, an example in Figure 8.

Copernicus Global Land Operations – Lot 1
Date Issued: 07.02.2018
Issue: I1.21
Document-No. CGLOPS1_PUM_DMP300m-V1 © C-GLOPS1 consortium
Issue: I1.21 Date: 07.02.2018 Page: 37 of 44
Figure 8 : Sahel, seasonal dry matter productivity as calculated by the Biogenerator software of
Action Contre la Faim (NGO). Yellow = low cumulative DMP, Dark green = high cumulative DMP. Map
obtained from Ham et al. (2012).
3. Calculation of land cover or crop specific regional means statistics:
Computation of DMP values per administrative (agro-statistical) unit or other regions
(preserved areas, forests) and per land-cover class / crop type further enhances the product for
the purpose of dry matter productivity monitoring in specific areas and/or for specific vegetation
classes or crop types.
Several techniques can be used for un-mixing, ranging from the calculation of simple regional
means (if no land use information is available), regional means per class or crop type (if per
pixel the class/crop type is known), weighted regional means (if per pixel the area fractions of
the classes/crops are known) or using more complex techniques as matrix inversion (linear un-
mixing) or nonlinear estimation with neural networks. The method to be used mainly depends
on the quality of the available information on crop type and location.
After un-mixing the results are stored in a database. In this way, the image data become
compatible with the other agro-statistical information (official areas/yields, model-outputs,…) in
a spatial and thematic sense. The agro-statistical region (or district) replaces the pixel as
spatial unit, and the class/crop becomes the thematic unit. The procedure also involves an
important data reduction.
By generating graphs from the database the seasonal evolution of the dry matter productivity
for a certain region and class/crop can easily be monitored and, in the same way, comparisons
can be made with previous years or with the long term average.
In the graph below (Figure 9), DMP profiles are shown for winter cereals in Belgium. Un-mixing
was done according to 6 different methods (Verbeiren, 2006).

Copernicus Global Land Operations – Lot 1
Date Issued: 07.02.2018
Issue: I1.21
Document-No. CGLOPS1_PUM_DMP300m-V1 © C-GLOPS1 consortium
Issue: I1.21 Date: 07.02.2018 Page: 38 of 44
Figure 9 : profiles for DMP for winter cereals in Belgium derived with 6 different un-mixing
methods: Regional mean, Hard classification, CNDVI threshold = 20%, CNDVI threshold = 50%,
Linear un-mixing and Neural network
The next figure (Figure 10) describes an example how regional land cover specific statistics can be
derived for the Horn of Africa. In this case, the regions are defined by FAO’s Global Administrative
Unit Layer (GAUL). The land cover information is derived from Africover and GLC2000
classifications. These original maps are resampled to Area Fraction Images (AFI), where each
pixel contains the proportion (0-100%) of the area (300x300m=9ha) covered by the concerned
class (example: class 10, pastoral dry). In the example a threshold of 50% is specified to withdraw
pixels from the computation if their area fraction for a given class is below this threshold. The
resulting graph shows the DMP evolution of pastoral dry areas in the Bakool region in Somalia in
2005, 2006 and 2007.

Copernicus Global Land Operations – Lot 1
Date Issued: 07.02.2018
Issue: I1.21
Document-No. CGLOPS1_PUM_DMP300m-V1 © C-GLOPS1 consortium
Issue: I1.21 Date: 07.02.2018 Page: 39 of 44
Figure 10 : Regional unmixed means of DMP. Example for the Horn of Africa.
Copernicus Global Land Service provides an online dashboard to view temporal profiles of regional
and land cover specific averages of the DMP (Figure 11).
10-daily DMP images
Image with administrative regions from FAO-GAUL and
area fraction per class (example: class 10, pastoral
dry) as derived from GLC2000/Africover
ID CLASS NAME
1 Cropland (from GLC2000)
2 Grassland (from
GLC2000)
3 Continuous large fields
4 Continuous small fields
5 Clustered large fields
6 Clustered small fields
7 Isolated small fields
8 Irrigated large fields
9 Irrigated small fields
10 Pastoral dry
11 Pastoral wet

Copernicus Global Land Operations – Lot 1
Date Issued: 07.02.2018
Issue: I1.21
Document-No. CGLOPS1_PUM_DMP300m-V1 © C-GLOPS1 consortium
Issue: I1.21 Date: 07.02.2018 Page: 40 of 44
Figure 11: Online dashboard of the time series viewer as provided by Copernicus Global Land
Service (http://viewer.globalland.vgt.vito.be/tsviewer/).
5.3 EXPLOITATION IN EMPIRICAL REGRESSIVE MODELLING
The DMP product and in particular the regional and class/crop type specific regional averaged
statistics (see above) of the cumulative DMP or maximum DMP (maximum growth rate) are often
used for crop yield estimation and prediction, as they are considered to be indicative for agricultural
production. Multiple regression and neural networks are the most commonly used techniques to
relate DMP and official yields. Availability of a sufficiently large time series of satellite data and
reliable yield statistics is crucial for obtaining good results.
Figure 12 shows an example of the temporal dynamics of yield statistics versus the CGLS DMP at
1 km derived from SPOT-VEGETATION for the period 1999-2012 (Durgun et al., 2016). A
comparison is made with a locally adjusted version of the DMP (including a water balance model)
and the classical vegetation indices (fAPAR and NDVI).

Copernicus Global Land Operations – Lot 1
Date Issued: 07.02.2018
Issue: I1.21
Document-No. CGLOPS1_PUM_DMP300m-V1 © C-GLOPS1 consortium
Issue: I1.21 Date: 07.02.2018 Page: 41 of 44
Figure 12: Temporal trends of predicted yield calibrated by leave-one-out cross validation technique confronted with the actual yield for 1999–2012 period per region for Morocco and Belgium. Examples
obtained from Durgun et al. (2016). Line color legend: Black=Yield, Solid orange=Modified DMP, Dashed orange=CGLS DMP, Green=fAPAR, Blue=NDVI.

Copernicus Global Land Operations – Lot 1
Date Issued: 07.02.2018
Issue: I1.21
Document-No. CGLOPS1_PUM_DMP300m-V1 © C-GLOPS1 consortium
Issue: I1.21 Date: 07.02.2018 Page: 42 of 44
6 REFERENCES
Atjay, G.L., Ketner, P. & Duvigneaud, P. (1979). Terrestrial primary production and phytomass. In:
The Global Carbon Cycle [Bolin, B., E.T. Degens, S. Kempe, and P. Ketner (eds.)], John Wiley
& Sons, Chichester, pp. 129-181.
Durgun et al. (2016). Testing the contribution of stress factors to improve wheat and maize yield
estimations derived from remotely-sensed dry matter productivity. Remote Sensing, 8, 170.
doi:10.3390/rs8030170
Eerens H., Piccard I., Royer A. & Orlandi S. (2004). Methodology of the MARS Crop Yield
Forecasting System. Volume 3: Remote Sensing, data processing and analysis, Office for
Official Publications of the European Communities, Luxemburg, 2004 (EU-Monograph EU
21291/EN3).
Ham, F., Fillol, E. “Chapter 10: Pastoral surveillance system and feed inventory in the Sahel” in FAO. 2012. Conducting national feed assessments, by Michael B. Coughenour & Harinder P.S. Makkar. FAO/ACF Animal Production and Health Manual No. 15. Rome, Italy.
Luyssaert, S. et al. (2010). The European carbon balance. Part 3: forests. Global Change Biology,
16, pp. 1429-1450.
Massad, R-S., Tuzet, A. & Bethenod, O. (2007). The effect of temperature on C4-type leaf
photosynthesis parameters. Plant, Cell and Environment, 30, pp. 1191-1204.
Monteith, J.L. (1972). Solar radiation and productivity in tropical ecosystems. Journal of Applied
Ecology, 19, pp. 747-766.
Verbeiren S. (2006). Comparison of different unmixing methods for yield estimation in Belgium and
China, Oral presentation at the ISPRS conference in Stresa, December 2006
Veroustraete F. (1994). On the use of a simple deciduous forest model for the interpretation of
climate change effects at the level of carbon dynamics. Ecological Modelling, 75/76, pp. 221-
237.
Veroustraete, F., Sabbe, H., Eerens H. (2002). Estimation of carbon mass fluxes over Europe
using the C-Fix model and Euroflux data. Remote Sensing of Environment, 83, pp. 376-399.
Yamori, W., Hikosaka, K., Way, D.A. (2013). Temperature response of photosynthesis in C3, C4
and CAM plants: temperature acclimation and temperature adapation. Photosynth Res, 119 (1-
2), pp. 101-117.

Copernicus Global Land Operations – Lot 1
Date Issued: 07.02.2018
Issue: I1.21
Document-No. CGLOPS1_PUM_DMP300m-V1 © C-GLOPS1 consortium
Issue: I1.21 Date: 07.02.2018 Page: 43 of 44
ANNEX: REVIEW OF USERS REQUIREMENTS
According to the applicable document [AD2] and [AD3], the user’s requirements relevant for DMP
are:
Definition:
Amount (weight) of dry matter produced per surface unit and per time unit. The
accumulation over time leads to the assessment of the biomass (in this context,
phytomass), herein defined as above-ground mass per unit area of living plant material
(GCOS 107 & 154)
Geometric properties:
o Pixel size of output data shall be defined on a per-product basis so as to facilitate
the multi-parameter analysis and exploitation.
o The baseline datasets pixel size shall be provided, depending on the final product,
at resolutions of 100m and/or 300m and/or 1km.
o The target baseline location accuracy shall be 1/3rd of the at-nadir instantaneous
field of view
o pixel co-coordinates shall be given for centre of pixel
Geographical coverage:
o Geographic projection: regular lat-long
o Geodetical datum: WGS84
o Coordinate position: centre of pixel
o Window coordinates:
Upper Left:180°W-70°N
Bottom Right: 180°E 50°S
Ancillary information:
o the per-pixel date of the individual measurements or the start-end dates of the
period actually covered
o quality indicators, with explicit per-pixel identification of the cause of anomalous
parameter result
Accuracy requirements:
o Baseline: wherever applicable the bio-geophysical parameters should meet the
internationally agreed accuracy standards laid down in document "Systematic
Observation Requirements for Satellite-Based Products for Climate". Supplemental
details to the satellite based component of the "Implementation Plan for the Global
Observing System for Climate in Support of the UNFCC (GCOS-154, 2011)"

Copernicus Global Land Operations – Lot 1
Date Issued: 07.02.2018
Issue: I1.21
Document-No. CGLOPS1_PUM_DMP300m-V1 © C-GLOPS1 consortium
Issue: I1.21 Date: 07.02.2018 Page: 44 of 44
o Target: considering data usage by that part of the user community focused on
operational monitoring at (sub-) national scale, accuracy standards may apply not
on averages at global scale, but at a finer geographic resolution and in any event at
least at biome level.
As the DMP is not directly an Essential Climate Variable (ECV), the GCOS does not specify requirements.
The users requirements expressed during previous project FP7 geoland2/BioPar for 10-daily
composites of DMP, expressed in kg of DM / ha / day, are: Optimal: 5, Target: 10, and Threshold:
20.