coosa river flow estimate
TRANSCRIPT

Mark Notich - FW: Coosa River Low Flow Estimate Page 1 1Mark Notich - FW: Coosa River Low Flow Estimate Page 1
From: "Moorer, Tom C." <[email protected]>To: <[email protected]>, <[email protected]>Date: 12/26/2006 11:50:01 PMSubject: FW: Coosa River Low Flow Estimate
Barton information we discussed.
TCM
> From: Williams, Dana M.> Sent: Wednesday, December 13, 2006 8:42 AM> To: Moorer, Tom C.> Subject: Coosa River Low Flow Estimate
> <<Coosa River Low Flow Estimate.pdf>>
> Merry Christmas!
> Dana Williams> Southern Nuclear Operating Company" Nuclear Development" P.O. Box 1295" Birmingham, AL 35201" P 205.992.5934" F 205.992.5296

c:\temp\GW}O0001 .TMP Page 11I
Mail Envelope Properties (4591F98B.C99: 10: 40089)
Subject:Creation DateFrom:
Created By:
FW: Coosa River Low Flow Estimate12/26/2006 11:40:55 PM"Moorer, Tom C." <[email protected]>
TCMOORER @southernco.com
Recipientsnrc.gov
TWGWPOO1.HQGWDOO1mdn (Mark Notich)
pnl.govmichael.sackschewsky
Post OfficeTWGWPOO1 .HQGWDOO1
Routenrc.govpnl.gov
Files SizeMESSAGE 497Coosa River Low Flow Estimate.pdfMime.822 871131
Date & Time12/26/2006 11:40:55 PM620887
OptionsExpiration Date:Priority:ReplyRequested:Return Notification:
Concealed Subject:Security:
NoneStandardNoNone
NoStandard
Junk Mail Handling Evaluation ResultsMessage is eligible for Junk Mail handlingThis message was not classified as Junk Mail
Junk Mail settings when this message was deliveredJunk Mail handling disabled by UserJunk Mail handling disabled by AdministratorJunk List is not enabledJunk Mail using personal address books is not enabledBlock List is not enabled

c:\temp\GW}00001.TMP . Page 2

S United States Department of the InteriorGEOLOGICAL SURVEY
2350 Fairlane Drive, Suite 120Montgomery, Alabama 36116
November 28, 2001
Mr. William C. DykesAlabama Power Company600 North 1 8th StreetP.O. Box 2641Birmingham, Alabama 35291
Dcar Mr. Dykcs:
Enclosed are the following items utilized in the 7-day 10-year low-flow estimate forCoosa River near Childersburg, Alabama:
I. Spreadsheet of minimum 7-day values with dates of occurrence and ranking forperiod 1965-2001 for Logan Martin, Lay, Mitchell, and Jordan Dams.
2. Same spreadsheet with plotting position handwritten on it.3. Plots of discharge vs. plotting position for Logan Martin, Lay, Mitchell, and
Jordan Dams.
Daily discharges for this analysis were obtained from Alabama Power Company on aspreadsheet giving the daily turbine releases and gate or spillway spillages. This datawas processed using EXCEL to compute a 7-day running average for the period of recordbeginning January 1, 1964 to December 31, 2000. Discharges for Logan Martin did notinclude the leakage flow until 1993 so a value of 650 cubic feet per second was added tothe 7-day running averages prior to this date.
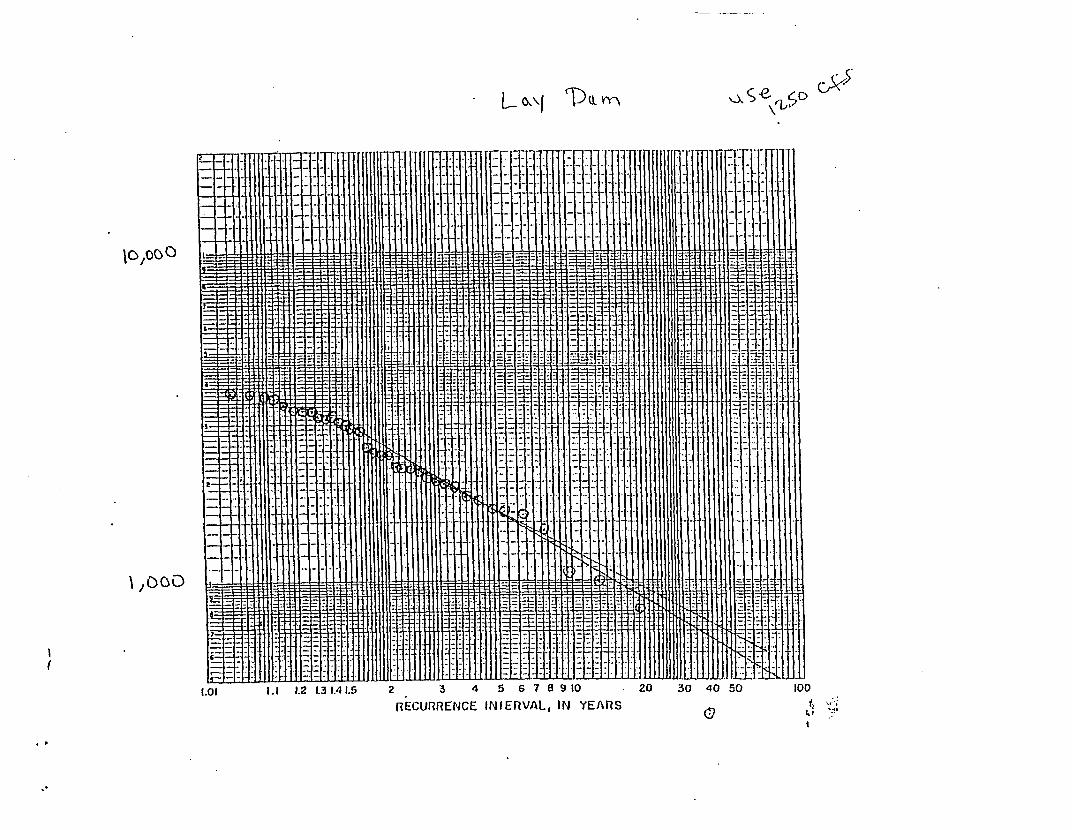
The 7-day values were ranked for each climatic year (ending March 3 1) and plottingposition computed using n=37 years and the equation n+l/rank. So the lowest value for37 years is plotted at a recurrence interval of 38 years, the 2nd lowest at 19 years .... ,andthe 37'h lowest at 1.03 years. This method is known as a Log-Pearson Type IIIdistribution, which is the technique used by USGS in the determination of low-flowestimates. A hand drawn line was done because our computer program uses dischargesinput into our database. Since the discharges for three of the dams were not in ourdatabase it was easier to do the plots by hand.

The graphical fit of the line giving the relationship of discharge to recurrence intervaldemonstrates the reason that the 7-day 10-year low-flow is considered to be an estimate.It must be stated that frequency curves are based on random homogeneous data andchanges in operation procedures can impact the data. An example of this is the minimumflow at Jordan Dam. The current 1-day and 3-day discharge figures have certainly beenimpacted and differ from those prior to 1990. A time-sampling error can occur withshorter periods of data as an extraordinary event can bias the relationship. Certainly asmore years of data are obtained the fit becomes tighter and more reliable. However, theresults appear to be within 100 cubic feet per second for each of the four dams.
Hopefully this explanation of the process used is adequate for your need. Let me know iffurther explanation is necessary.
Sincerely,
James L. PearmanHydrologist
Enclosure

LOGAN MARTIN LAY DAM MITCHELL DAM JORDAN D)AMYEAR DATE FLOW RANK DAlE FLOW RANK DATE FLOW RANK DAI E FLOW IHANK
1965 21-Jul 3200 31 13-Jul 2850 23 10-Jul 3590 31 I I-Jul 4000 :321966 I-Sep 3660 36 17-Oct 3140 29 19-Oct 3210 27 19-Oct 2900 171967 31-Jul 3310 34 29-Jul 3260 30 29-Jul 3500 30 29-Jul 3840 301968 18-Apr 2790 23 23-Apr 2890 25 17-Apr 3070 24 18-Apr 3230 241969 12-Sep 2070 11 13-Sep 1580 6 13-Sep 1760 7 13-Sep 1710 1I
1970 22-Jul 1800 8 23-Jul 1800 10 23-Jul 2190 9 22-Jul 2320 101971 10-Jul 2120 12 3-Oct 1410 5 4-OcI 1580 5 0-Oct 1550 31972 13-Oct 1370 4 13-Oct 810 2 13-Oct 871 1 13-Oct 1190 21973 9-Oct 2410 17 12-Oct 1920 11 6-Oct 2340 12 12-Oct 2110 7
1974 19-Sep 2770 22 19-Sep 2190 17 19-Sep 2550 18 19-Sep 2690 151975 3-Oct 893 2 2-Oct 387 1 2-Oct 894 2 2-Oct 2050 61976 2-Sep 2950 27 2-Sep 3170 27 2-Sep 38.30 33 2-Sep 4490 351977 6-Sep 2530 20 6-Sep 2470 21 27-Nov 2750 20 27-Nov 3270 251978 6-Sep 1960 9 4-Jul 1620 7 6-Sep - 1690 6 5-Jul 2360 121979 1-Oct 2500 19 28-Solj 2190 16 28-Sep 2540 17 10-OC:1 3310 271980 5-Jul 3790 37 5-Jul 3740 37 5-Jul 4570 37 6-Jul 5370 :171981 20-Jan 2280 14 20-Jan 2130 15 20-Jan 2710 19 20-Jaui 2800 161982 26-May 1480 6 27-May 1750 9 18-Aug 2080 8 18-Augj 2230 a1983 6-Sep 2860 .24 6-Sep 3050 26 2-Sep 3020 23 2-Sep 2980 201984 6-Sep 2750 21 6-Sep 2520 22 6-Sep 2820 21 5-Sep 3150 2:"
1985 24-Sep 2370 16 28-Sep 1640 I( 28-Snp 2210 10 26-S.p 2600 141986 30-Sep 3030 29 30-Sep 3290 31 20-Sep 3910 26 1t1-Sep 3320 201
1987 23-May 733 1 23-May 990 3 25-May 1520 4 17-May 1830 5
1988 12-Aug 24103 18 12-Aug 2430 20 12-Aug 24770 14 II At!I P 255!1 1:.
1989 13-Jul 1240 3 15-Jul 1050 4 15-Jul 1290 3 15-Jul 1170 11990 29-Apr 2950 26 14-AwIK 3630 35 14-Atie 31130 25 14-Atiq 341n 21)1991 6-Jul 3210 32 4-Jul 3900 20 4-Selp 3220 21 4 -Sup 3:000 291992 24-Sep 3180 30 24-Sep 3300 32 24-Sep 3690 32 10-Oct 3280 261993 8 Aug 3450 35 13-Aigj 3600( 34 fI-A.ic :3990) 34 II AuIg ,12401 3;1994 7-Nov 1610 7 12-Ocl 1990 12 8-Oct 2500 15 lb-Ucl 2290 9
1995 9-Jun 2940 25 8-Jun 3730 36 5-Jun 4460 36 20-Nov 4330 3,4
1996 15-Sep 2370 15 15-ScIp 2000 13 1t4-S'.p 2210 11 It At q 29701 19
1997 5-Sep 3230 33 5-Sep 3440 33 5-Sep 4110 35 5-Sop '1510 301998 24-Sep 3030 28 24-Sep 2880 24 24-Sep 3400 29 7-Sep 3940 31
1999 19-Oc1 1400 5 6.-.I 2420 tU 25-00: 29203 22 25 (N;I 29.109 lil
2000 21-Sep 2240 13 22-Sep 2210 18 22-Sep 2450 13 26-Selp 3100 22
2001 25-Jun 2060 10 29-Jun 2080 14 1-Jul 2500 16 4-Jul 2350 11

f):,;l
I W
_ ,LOGAN MARTIN\")ýj YEAR DATE FLOW
6,5o - 1965 21-Jul 3200 -,.•1966 I-Sep 3660" u" I :1967 31-Jul 3 3 10 'VZ- t1.651968 18-Apr 2790 3-U61969 12-Sep 2070-i|.1970 22-Jul 1 800 - 5 ,1971 10-Jul 2120 -- 13:l71972 13-Oct 1 3 7 0 -4- 1C.51973 9-Oct 2410 -'1- -1974 19-Sep 27701975 3-Oct 8931976 2-Sep 2950 -27-1977 6-Sep 2530-'Z1.- 01978 6-Sep 1960 -0 - L4..1979 1-Oct 2500 -1 Z .o1980 5-Jul 37.90 311981 20-Jan 2280 _ Z.I1982 26-May 1480 -1983 6-Sep 28601984 6-Sep 2750-- -
1985 24-Sep 2370 -1 Z-31986 30-Sep 3030 .t -
1987 23-May 733-,1988 12-Aug 2410 .\t8%.S-
1989 13-JIA 1240- -11990 29-Apr 2950.. ?,(- - tA-i1991 6-Jul 3210 -_ A
- 1 992 24-Sep 3.180-' - -1.-
C -- 1993 8-Aug 34501994 7-Nov 1810--*) - ~Z1995 9-Jun 2940 - - \1996 15-Sep 2370 -\ ,-1997 5-Sep 3230 _-z' ; .
• 1998 24-Sep 3030 _z'g~ - .!
1999 19-Oct 1400 -5 -7.2000 21-Sep 2240 -13 2.-,9
i -o _ 2001 25-Jun 2060 - Io-
,LAY DAMDATE FLOW
13-Jul17-Oct29-Jul23-Apr13-Sep23-Jul3-Oct
13-Oct12-Oct19-Sep
2-Oct2-Sep6-Sep4-Jul
28-Sep5-Jul
20-Jan27-May
6-Sep6-Sep
28-Sep30-Sep23-May12-Aug15-Jul
14-Aug4-Jul
24-Sep8-Aug12-0ct8-Jun
15-Sep5-Sep
24-Sep6-Oct
22-Sep29-Jun
2850 ~ " |631403260 -34" -2890 _1. -|"/-158o 0 -G ,.1800 .lo -v.514 i0_5_"?.(:
810 -
2190 4"-%387 1-; ,
3170 -TV L42470 ?' - " 11620-'l - .4le2190"|,-."5b3740 021301750--t3050 -*Z&,-2520 77-1 ."•.. .3•16410 -% - 4-15
3290 - -9903- V'-h
2430 -'20-1050-'- -C.5
3100 -'6 -
3300QQ$'_L .3600 "3' •
37302000 - %3 7(113440 -3•3-28802420 - -2210 -• •2080 - "A\ - .'
MITCHELL DAMDATE FLOW
1o-Jul 359019-Oct 3210 -29-Jul 3500 -'?,•--.17-Apr 3070 --- I-
13-Sep 17601 -Q.23-Jul 2190 -"4-Oct . 1580 -
13-Oct 871 1- 3?6-Oct 2340 A'-Z' 1•7
19-Sep 25502-Oct 8942-Sep 3833 _-I;o3 5-I
27-Nov 2751 •6-Sep 1690 -
28-Sep 2540 - k1 2.L-_5-Jul 4570 -37--"71
20-Jan 2710 \ () -Z '418-Aug 2080o-- -n
2-Sep 3020 - -20 i, •lI.66-Sep 2820 L-1.
28-Sep 2210 3'o t"
20-Sep 3180
25-May 1520- -'3$~12-Aug 2470 -
15-Jul 1290 -,-14-Aug 3180 -qS- '4-Sep 3220 'z.%- i.e
24-Sep 3690 "-11 - l \18-Aug 3990.8-Oct 2500 -~$--~ (5-Jun" 4460 "
14-Sep 2210 -\\ .3.,.1K5
5-Sep 4110 -3 -24-Sep 3400 - VZ25-Oct 2920 -2.-22-Sep 2450 - -
1-Jul 2500 _1t,- 2-2
JORDAN DAMDATE FLOW
11-Jul 4000 -'-119-Oct 2900 ,29-Jul 38401 B-Apr 3230
13-Sep 171022-Jul 2320 -- :6-Oct 1550 - ',-\ "
13-oct 1190•o- -12-Oct 2110 119-Sep 2690
2-Oct 2050 - •o-. . )2-Sep 4490
27-Nov 3270 • "5-Jul 2360 -
10-Oct 3310 i " ' _5-Jul 5370
20-Jan 2800 -, -18-Aug 2230 - 02-Sep 2980- "5-Sep .3150 -
26-Sep 260018-Sep 3320 .
17-Mvay 1830 - 4.11-Aug 2550 -
15-Jul 1170 -. " -14-Aug 3410- -Z") - -'4-Sep 3080 . ,lO-Oct 3280 --? V48-Aug 4240 -"?' 1- -
15-Oct 2290 (7.- .20-Nov 4330 L- "L-
8-Aug 29705-Sep 45807-Sep 3940 -3" -IL.
25-Oct 2970-1 "7 " .26-Sep 3100 - "
4-Jul 2350 -
j-\1 kV"tll^ 1-74-0
LA' 9 053Q 76U

Lo~~~~c~~~i0 rcv\v hVcy -X' L
.n ....1 .p~i~
-- --
III-it.
Z". X , m'
ZZ Z XX - - ----
7 T I
X-'T =K: X7
t Z z
j
Tl T
A:
Z
m:'Z z7"------ LL1.
J)oe
I1.01 1.1 1.2 l.,[3 1.5 2 3 4 5 678910
RECURRENCE INTERVAL, IN YEARS20 30 40 50 I00
Lc-x 0 T\ C ( x -ei
iiIk q1UH 41.WIT illp1 .111
till 1-It11
10/ 011
-11-1
--"14---- 4-4--I-I!41 flfIIII "H-t4-11 "t-Itt f I-t t*--H::I :tl --
::A .7-.7
j"boo
I
1.01 1.1 1.2 1.3 1.4 1.5 2 3 4 5 6 I7 8 E910RE'CURRENCE INIERVAL, IN YEARS20 30 40 50 I00
Q

ti -T-1 I` I -I I I 1 1111-1-1 !.1 1 1 i.111 :
(-p
1 71IT1-11. , .'i IIIlcý,Ozý
X 7~
* - - j. == - : ' i :
z~ z.
TI:
1.01 I.I 1.2 1.31.41.5 2 3 4 5 6 789910 20 30 41 50 100
RECURRENCE INrERVAL, IN YEARS

-'Tcvýo'ý -Dý ýn kj\ oQ CC) C 5
l3looc> ~~.1 -
7 ... 7L
IH
- .. - - ::<:
X I1
Th- 7
HIM 1111 R111P.M.Mf M-:[Hfill 111 £-]4HIHFl iIIfili~ 3:1-11
m44t-wjA44 V444~1
20 30 .10 50111 I-FIli--i-i L.]..IIj..lJ I.P- L .. A-I 1 I.-L J -Ji ... I- L..L.I .. •,.--L•. J.,J..kJ. I.J-J
1.01 1.1 1.2 1.3 1,41.5 2 3 4 5 6 78910
RECURRENCE INIERVAL, IN YEARS100

Page 1 of2
Moorer, Tom C.
From: Dykes, William C.
Sent: Monday, November 13, 2006 4:25 PM
To: Moorer, Tom C.
Cc: Stover, Charles M.; Graham, Stacey A.
Subject: RE: Hydro Budget Average Flows at Mitchell and Jordan
Attachments: USGS November 28 2001 Letter on 7Q10 on the Coosa River.pdf
Tom,
Attached are 7Q10 determinations for APC's reservoirs on the Coosa River. These 7Q10 flows were determinedby the USGS in 2001. For Mitchell and Jordan, the 7Q10 flows are 1,500 cfs and 1,700 cfs respectively.
From the 2006 Hydro Budget, the 2005 average flow at Mitchell is 13,914 cfs (88% of average) and the 2005average flow at Jordan/Bouldin is 13,941 cfs (92% of average). The actual flows recorded in 2005 at bothMitchell and Jordan/Bouldin are within a 1/4 of a percentage point when compared with 2006 Hydro Budget flowvalues for 2005.
Bill DykesSouthern Company GenerationHydro ServicesPh: (205) 257-3585SoLINC Local: (205) 438-8072SoLINC Toll Free: (888) 325.1593SoLING Radio: 10'10018
From: Moorer, Tom C.Sent: Monday, November 13, 2006 2:58 PMTo: Dykes, William C.Cc: Stover, Charles M.; Graham, Stacey A.Subject: RE: Hydro Budget Average Flows at Mitchell and Jordan
Thanks, Bill. This is exactly what I needed. Do we have a 7Q10 or other statistical measurement offlowavailable? Also, how does the 2005 average compare with other water years? Is it a high, low, or average year?
TCM
From: Dykes, William C.Sent: Monday, November 13, 2006 2:52 PMTo: Moorer, Tom C.Cc: Stover, Charles M.; Graham, Stacey A.Subject: Hydro Budget Average Flows at Mitchell and Jordan
Tom,
From Reservoir Management's 2006 Hydro Budget, the average daily flows are as follows:
Mitchell 15,733 cfs
11/13/2006

Page 2 of 2
Jordan/Bouldin 16,386 cfs
Jordan 6,538 cfsBouldin 9,848 cfs
Please call or email if wish to discuss or need further information.
Take care,
Bill DykesSouthern Company GenerationHydro ServicesPh: (205) 257-3585SoLINC Local: (205) 438-8072SoLINc Toll Free: (888) 325-1593SoLINC Radio: 10*10018
11/13/2006