cooperativity and coverage dependent molecular desorption
TRANSCRIPT

Cooperativity and Coverage Dependent Molecular Desorption in Self-Assembled Monolayers: Computational
Case Study with Coronene on Au(111) and HOPG
Journal: Physical Chemistry Chemical Physics
Manuscript ID CP-ART-03-2019-001774.R1
Article Type: Paper
Date Submitted by the Author: 02-May-2019
Complete List of Authors: Chilukuri, Bhaskar; Washington State University, ChemistryMazur, Ursula; Washington State University, ChemistryHipps, K W; Washingotn State University, Chemistry
Physical Chemistry Chemical Physics

Received 00th January 20xx,
Accepted 00th January 20xx
DOI: 10.1039/x0xx00000x
Cooperativity and Coverage Dependent Molecular Desorption in
Self-Assembled Monolayers: Computational Case Study with
Coronene on Au(111) and HOPG
Bhaskar Chilukuri,*a Ursula Mazur,a and K. W. Hipps*a
One of the common practices in the literature of molecular desorption is the comparison of theoretically (mostly using DFT)
calculated single molecule adsorption energies with experimental desorption energies from studies like temperature
programmed desorption (TPD) etc. Comparisons like those do not consider that the experimental desorption energies are
obtained via ensemble techniques while theoretical values are calculated at the single molecule level. Theoretical values are
generally based upon desorption of a single molecule from a clean surface, or upon desorption of an entire monolayer. On
the other hand, coverage dependent molecule-molecule interactions add to and modify molecule-substrate interactions that
contribute to the experimentally determined desorption energies. In this work, we explore the suitability of an additive nearest
neighbor model for determining general coverage dependent single molecule desorption energies in non-covalent self-
assembled monolayers (SAMs). These coverage dependent values serve as essential input to any model attempting to
reproduce coverage dependent desorption or for understanding the time dependent desorption from a partially covered surface.
This method is tested using a case study of coronene adsorbed on Au(111) and HOPG substrates with periodic DFT
calculations. Calculations show that coronene exhibits coverage and substrate dependence in molecular desorption. We found
that intermolecular contact energies in the coronene monolayer are not strongly influenced by the HOPG substrate, while
coronene desorption on Au(111) exhibits strong cooperativity where the additive model fails.
Introduction
Surfaces functionalized by self-assembled monolayers1 (SAM)
have applications in molecular electronics,2,3 catalysis,4
corrosion control,5 sensors,6 etc. Hence, the kinetics and
thermodynamics of these systems is of immense interest.7,8,9-10
One of the important quantities needed to determine both
equilibrium and kinetic processes on surfaces is the
adsorption/desorption energy of molecules forming the adlayer.
Adsorption and desorption of SAMs from the vapor are directed
by adsorbate-substrate, adsorbate-adsorbate interactions.11, At
the solution-solid (SS) interface solvent-substrate, solvent
adlayer, and solvent-solute interactions also influence the self-
assembly process. Molecular desorption involves the interplay of
all the aforementioned chemical interactions.
Conventionally, desorption of SAMs is studied
experimentally using temperature programmed desorption
(TPD),12-14 quartz crystal microbalance,15-17 ellipsometry,18,19
surface plasmon resonance,20,21 harmonic generation,22
chronoamperometry,23 or a variety of spectroscopic techniques
like IR,24 XPS,25 mass,26 etc. But the desorption energies
obtained through conventional techniques are at the ensemble
level, where the energies obtained are averaged over a large
number of molecules, adsorption sites and variable surface
coverages. For example, desorption energies from TPD
experiments are typically coverage dependent and most values
reported in the literature includes a ‘forced compensation
effect’27,28 which can lead to false pre-exponential factors and
activation energies and hence false desorption energies.
Coverage dependent measurements have been reported29,30 to
provide a so called ‘complete analysis’27,31 of TPD spectra. Yet,
these measurements are at an ensemble level. Perhaps the most
insightful computational study was that of Nieskens et al27 who
used Monte Carlo Modeling of a system with pair wise
interactions to compute the TPD and then fit various models to
that data. They found that a coverage dependent contribution
could be extracted from the adsorption energy provided their
proposed analysis method was used. Even in this case, however,
the molecular interactions are not resolved, just their overall
effect on the macroscopic surface.
Scanning probe microscopy (SPM), is a technique available
to study surface desorption characteristics of single
molecules.7,8,32 Recently Hipps et al. reviewed measurement of
desorption rates of non-covalent SAMs at the SS-interface.33 In
the review, a typical potential energy surface (PES) of single
molecule desorption is presented for a monocomponent network
with single morphology. Unlike the PES in surface chemistry
and catalysis34,35,36 which involves a reaction coordinate with
a. Department of Chemistry, Washington State University, Pullman, WA 99164-4630, USA.
† Footnotes relating to the title and/or authors should appear here. Electronic Supplementary Information (ESI) available: [details of any supplementary information available should be included here]. See DOI: 10.1039/x0xx00000x
Fig. 1 Potential energy surface of a single molecule as it moves from
vacuum to a solid substrate. The red dotted lines represent desorption
energies and blue dotted line represents adsorption energy.
Page 1 of 9 Physical Chemistry Chemical Physics

bond making and bond breaking, the PES in non-covalent SAMs
involves physisorption, diffusion and desorption, mostly through
van der Waals interactions. Based on PES of molecular
desorption at SS-interface,33 a similar PES for molecular
desorption at the vacuum-solid interface is shown in Fig. 1. In
this PES, a single molecule in vacuum adsorbs onto a substrate
from which the desorption energy is Ed1. Once the molecule is
on the surface, it can diffuse across the surface and reach an edge
of an island of an ordered network with an adsorption energy of
Ea1. If the molecule must move from the edge of the island to
being free on the surface, it requires a desorption activation
energy of Ed2. Therefore, for a molecule to desorb from the edge
of the island to vacuum, the desorption energy is Ed2+Ed1-Ea1. On
the other hand, if the molecule must desorb from the inside of an
island to vacuum, the desorption energy is Ed3. To complicate the
issue, the details of the number (and possibly orientation) of
molecules initially adjacent to the desorbing molecule will affect
the desorption energy. Similarly, the location of an edge
molecule (number of contacts) will affect the activation energy
Ed2. Obtaining all the adsorption/desorption and activation
energies implied by Fig. 1, using SPM is hard even for a
monocomponent system with single morphology while in fact,
an actual SAM can have multiple grain boundaries, step edges
and morphologies. Also, it is possible to have a
multicomponenet network where the PES can be more
complicated than Fig. 1.
In this work, we present a simple model to determine the
single molecule desorption energy of a specific molecule in a
physisorbed non-covalent SAM at the vacuum-solid interface
using density functional theory (DFT) calculations. Most
theoretical studies in the literature37-44 usually calculate the
adsorption energy of an isolated molecule where the calculated
energy is only dominated by the molecule-substrate interactions.
As one can see from Fig. 1, single molecule desorption energy
varies based on the surface coverage. In other words, desorption
energy is dependent upon the number of nearest neighbor
molecules surrounding a specific adsorbate. While the
desorption energy is also dependent upon the adsorption site
relative to the substrate, in this study we restrict consideration to
the site occupied by the optimized monolayer. Unlike earlier
studies,40-44 here we use a combination of molecule-substrate
binding energy and molecule-molecule contact energies to
determine single molecule desorption energy. Our goal here is to
determine the role and contribution of intermolecular contact
energies to single molecule desorption energy from substrates.
As representative systems, we choose a monocomponent
network of coronene molecules adsorbed on Au(111) and HOPG
substrates with single morphology to determine the desorption
energies. This model is the one used by Nieskens et al.27 for the
coverage dependent desorption energy, but they used an
empirical parameter while we actually calculate the values here.
We note that this model assumes all clusters of coronene on the
surface have the same structure as the experimental equilibrium
structure. We realize this is a simplification that could be
accounted for by including more representative systems. Doing
so, however, would not affect the primary purpose of this study
– to show that the use of a single surface configuration for
calculation of desorption energies is not realistic.
Models and Methodology
Geometries for DFT calculations
Different geometries of coronene on Au(111) and HOPG for
DFT calculations were developed using previously reported
surface lattice structures from scanning tunneling microscopy
(STM) experiments. Jahanbekam et al.,45 have shown that
coronene can have multiple polymorphs on Au(111), but here we
only consider the high-density surface structure for our
calculations. The high-density epitaxial coronene/Au(111)
lattice structure has a hexagonal symmetry with intermolecular
spacing of 1.15 ± 0.04 nm. This structure also matches with
other STM studies of coronene/Au(111).46-48 Walzer et al.49
reported the first STM study of coronene/HOPG interface which
had a six-fold symmetrical lattice with intermolecular spacing of
1.11 ± 0.01 nm. This structure also matches with other STM
studies of coronene/HOPG.30,50 We use Jahanbekam’s45 and
Walzer’s49 surface structures of coronene on Au(111) and HOPG
respectively to develop our computational geometries.
It is important to note that experimental STM sturctures
show coronene binds epitaxially to Au(111)45 and HOPG49 with
one coronene molecule per lattice. Using the step edge and the
reconstruction lines on Au(111), Jahanbekam et al., determined
the orientation of coronene molecules on Au(111) which has
head-to-head coronene hydrogens configuration with its nearest
neighbor. On the other hand, Thrower et al., showed that
coronene molecules adsorb in a staggered configuration on
HOPG.30 Hence, we used head-to-head and staggered coronene
orientations on Au(111) and HOPG respectively for our
computational modeling. Furthermore, these configurations are
determined to be lowest energy configurations based on
preliminary periodic DFT calculations (Section S1, Fig. S1 in
supplementary information). For developing our computational
geometries, we use 4x4 supercells of the optimized head-to-head
configuration of coronene/Au(111) (Fig. S1-B) and staggered
configuration of coronene/HOPG (Fig. S1-C). The
corresponding initial (before optimization) geometries of
monolayer of coronene on Au(111) and HOPG are shown in
Figures S2 and S3 respectively.
Fig. 2 Geometry of coronene/substrate (substrate = Au(111) or HOPG.
Colors: Substrate-yellow, grey-coronene and white line represents
hexagonal lattice.
Page 2 of 9Physical Chemistry Chemical Physics
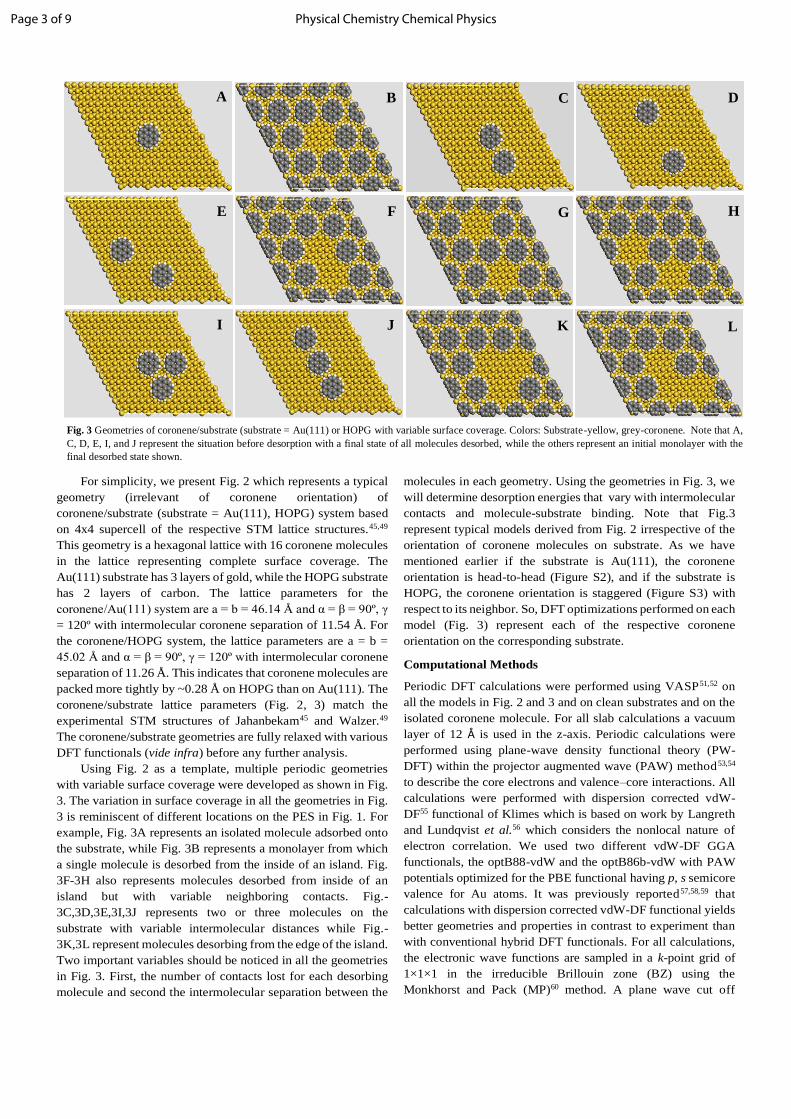
For simplicity, we present Fig. 2 which represents a typical
geometry (irrelevant of coronene orientation) of
coronene/substrate (substrate = Au(111), HOPG) system based
on 4x4 supercell of the respective STM lattice structures.45,49
This geometry is a hexagonal lattice with 16 coronene molecules
in the lattice representing complete surface coverage. The
Au(111) substrate has 3 layers of gold, while the HOPG substrate
has 2 layers of carbon. The lattice parameters for the
coronene/Au(111) system are a = b = 46.14 Å and α = β = 90º, γ
= 120º with intermolecular coronene separation of 11.54 Å. For
the coronene/HOPG system, the lattice parameters are a = b =
45.02 Å and α = β = 90º, γ = 120º with intermolecular coronene
separation of 11.26 Å. This indicates that coronene molecules are
packed more tightly by ~0.28 Å on HOPG than on Au(111). The
coronene/substrate lattice parameters (Fig. 2, 3) match the
experimental STM structures of Jahanbekam45 and Walzer.49
The coronene/substrate geometries are fully relaxed with various
DFT functionals (vide infra) before any further analysis.
Using Fig. 2 as a template, multiple periodic geometries
with variable surface coverage were developed as shown in Fig.
3. The variation in surface coverage in all the geometries in Fig.
3 is reminiscent of different locations on the PES in Fig. 1. For
example, Fig. 3A represents an isolated molecule adsorbed onto
the substrate, while Fig. 3B represents a monolayer from which
a single molecule is desorbed from the inside of an island. Fig.
3F-3H also represents molecules desorbed from inside of an
island but with variable neighboring contacts. Fig.-
3C,3D,3E,3I,3J represents two or three molecules on the
substrate with variable intermolecular distances while Fig.-
3K,3L represent molecules desorbing from the edge of the island.
Two important variables should be noticed in all the geometries
in Fig. 3. First, the number of contacts lost for each desorbing
molecule and second the intermolecular separation between the
molecules in each geometry. Using the geometries in Fig. 3, we
will determine desorption energies that vary with intermolecular
contacts and molecule-substrate binding. Note that Fig.3
represent typical models derived from Fig. 2 irrespective of the
orientation of coronene molecules on substrate. As we have
mentioned earlier if the substrate is Au(111), the coronene
orientation is head-to-head (Figure S2), and if the substrate is
HOPG, the coronene orientation is staggered (Figure S3) with
respect to its neighbor. So, DFT optimizations performed on each
model (Fig. 3) represent each of the respective coronene
orientation on the corresponding substrate.
Computational Methods
Periodic DFT calculations were performed using VASP51,52 on
all the models in Fig. 2 and 3 and on clean substrates and on the
isolated coronene molecule. For all slab calculations a vacuum
layer of 12 Å is used in the z-axis. Periodic calculations were
performed using plane-wave density functional theory (PW-
DFT) within the projector augmented wave (PAW) method53,54
to describe the core electrons and valence–core interactions. All
calculations were performed with dispersion corrected vdW-
DF55 functional of Klimes which is based on work by Langreth
and Lundqvist et al.56 which considers the nonlocal nature of
electron correlation. We used two different vdW-DF GGA
functionals, the optB88-vdW and the optB86b-vdW with PAW
potentials optimized for the PBE functional having p, s semicore
valence for Au atoms. It was previously reported57,58,59 that
calculations with dispersion corrected vdW-DF functional yields
better geometries and properties in contrast to experiment than
with conventional hybrid DFT functionals. For all calculations,
the electronic wave functions are sampled in a k-point grid of
1×1×1 in the irreducible Brillouin zone (BZ) using the
Monkhorst and Pack (MP)60 method. A plane wave cut off
A B C D
H G
I J K L
F E
Fig. 3 Geometries of coronene/substrate (substrate = Au(111) or HOPG with variable surface coverage. Colors: Substrate-yellow, grey-coronene. Note that A,
C, D, E, I, and J represent the situation before desorption with a final state of all molecules desorbed, while the others represent an initial monolayer with the
final desorbed state shown.
Page 3 of 9 Physical Chemistry Chemical Physics

energy of 550 eV was used for all simulations which is chosen
based on the energy convergence of primitive lattice structures
of Au(111), HOPG and isolated coronene molecule. Methfessel–
Paxton smearing was used to set the partial occupancies for each
wave function with a smearing width of 0.2 eV. All the
geometries were fully optimized up to ~0.001 eV energy
convergence with both optB88-vdW and optB86b-vdW
functionals, while keeping the bottom layer of the substrate
constant in each coronene/substrate (substrate = Au(111),
HOPG) system. Hence for each coronene/substrate system, a
total of 15 calculations with each functional yields a total of 60
DFT optimized systems.
Results and Discussion
Upon optimizing all the geometries in Fig. 3, the desorption
energy (Ei) of a coronene molecule in any given geometry ‘i’ is
fitted to the following nearest neighbor interaction energy model,
𝑬𝒊 = 𝑬𝟎 ∓ 𝒂 ∙ ∑ 𝜹k j𝒌 𝒋 (1)
where, E0 = best fit desorption energy of single isolated coronene
molecule on the substrate, δkj = 1 if each missing molecule ‘k’
has a nearest neighbor ‘j’ and ‘a’ = average coronene-coronene
contact energy which is a fitting parameter. The parameter ‘a’ is
equivalent to NN in reference 27, except they parameterized for
4 nearest neighbors while we have 6. The parameter ‘a’ is
determined from the following least squares fitting (LSF)
equations, where we minimize the difference between the DFT
calculated energy associated with a given geometry (Ei) and the
energy calculated from the nearest neighbor interaction model eq
1.
𝑭(𝒂)𝒊 = 𝑬𝒊 − (𝒏𝒊𝑬𝟎 + 𝒂𝒄𝒊) (2)
X(a) = ∑ (𝑭(𝒂)𝒊)𝟐
𝒊 (3)
where, ni = number of desorbed molecules in geometry ‘i’, and
ci = total number of contacts lost in each geometry. F(a)i is the
total error in desorption energy for each different geometry, ‘i’,
shown in Fig. 3. X(a) is the sum of the squares of error F(a)i from
which ‘a’ is obtained. Table 1 shows the number of desorbed
molecules (ni) and total lost contacts (ci) for each geometry, ‘i’.
The corresponding E0 and ‘a’ values obtained form LSF for
coronene/substrate systems using optB88 and optB86b vdW-DF
functionals are listed in Table 2.
To determine the role of substrates on the intermolecular
contact energies (‘a’), we performed similar PW-DFT
calculations and LSF analysis on coronene only geometries
without the substrate. For these calculations the substrates were
removed and the geometries of the coronene only monolayers
(ML) were kept intact and single point energies were determined.
We refer to these geometries as “coronene ML only” systems
(Table 2). Using the single point energies, analysis was carried
out using equations 1-3 for all “coronene ML only” systems from
HOPG and Au(111) and corresponding E0 and ‘a’ are listed in
Table 2. Additionally, desorption energies (Ed) (obtained using
equation-S1,S2 in supplementary information) of isolated
coronene molecule on HOPG and Au(111) substrates were also
listed in Table-2. The calculated Ed values listed in Table 2 are
consistent with reported experimental and theoretical desorption
energies of coronene on HOPG.30 Ed of coronene on Au(111)
from experiment is not reported to the best of our knowledge.
We attempted TPD experiments for coronene on Au(111) and
found that the coronene monolayer does not completely desorb
from gold. Based on the work by Talyzin et. al.,61 we think that
coronene may have turned to graphene like structures on
Au(111) at high temperatures. But, the calculated Ed of coronene
on Au(111) (Table-2) matches with other DFT calculations in the
literature.62,9
Fig. 4 shows total error, F(a)i, in calculated desorption
energy between the DFT results and the nearest neighbor model.
Model energies were based on fitted contact energies, ‘a’ for
each geometry, ‘i’ (Table 2). The F(a)i values range within 20
meV for coronene on HOPG with both DFT functionals, while
the errors range from 50-150 meV for coronene on Au(111).
Also the ‘a’ values are 58 and 52 meV (Table 2) for
coronene/HOPG systems while they change to 55 meV for
Table 1. Parameters used in least squares fit analysis. Geometries listed
in the table refers to Figure 3. Table 2. Parameters obtained from PW-DFT and least squares fitting
calculations. E0 is best fit desorption energy of single isolated coronene on
substrate. ‘a’ is the average contact energy between coronenes. Ed is the
calculated desorption energy of an isolated coronene on a given substrate.
Page 4 of 9Physical Chemistry Chemical Physics

coronene/Au(111) system with optB88-vdW . Note that all these
‘a’ values are positive which are indicative of attractive
interaction/contact energies. The optB86b-vdW functional gave
only -3 meV (repulsive energy) for the coronene/Au(111)
system. That is, optB86b-vdW predicted slightly repulsive
interaction between coronenes on Au(111). This is the origin for
what appear to be very good fits in Figures 4 and 5. This could
be due to the interplay of stabilizing and destabilizing
interactions of each coronene molecule with the gold substrate
and with its neighbors when optB86b-vdW functional is used.63
Similar observations for other physisorbed systems on metals
have been reported.63-65 Gautier et. al.,63 have noted that there is
no universal DFT functional that yields correct energies all the
time and hence a combination of DFT functionals have to be
checked to determine a trend. Due to significant differences in
F(a)i and ‘a’ values for coronene/Au(111) systems with optB88
and optB86b vdW-DF functionals, we performed an additional
set of calculations with optPBE vdW-DF functional55,56,66 on all
coronene/Au(111) geometries (Fig. 2 and 3) followed by fitting
the data to our model. The corresponding F(a)i and ‘a’ value are
shown in section-S3 and Fig. S4, S5 in the supplementary
information. Coronene-coronene contact energies ‘a’ with
optPBE-vdW functional are determined to be 78 and 64 meV
with and without the Au(111) substrate (Table 2). These values
are consistent with calculated values of coronene/Au(111)
systems with optB88-vdW functional (Table 2) indicating that
optB86b-vdW functional underestimates ‘a’ in the presence of a
Au(111) substrate. Calculations with various functionals (Table
2) show that coronene-coronene contact energies for various
geometries (Fig. 3) fluctuate less (~20 meV) when coronene is
bound to HOPG. In contrast, coronene-coronene contact
energies vary significantly (50-150 meV) when coronene is
bound to Au(111). These results indicate that there may be a high
degree of cooperative binding in coronene/Au(111) systems,
where the site of desorption (like the edge of island or inside of
island, see Fig. 1 and 3) plays an important role in the contact
energies unlike the coronene/HOPG systems where the error,
F(a)i is less than 25 meV (Fig. 4) regardless of the adsorption
location.
Note that the data shown in Fig. 4 are total errors in
desorption energy for each geometry. As one can see from Table
2, the number of lost contacts and molecules desorbed vary from
geometry to geometry. To determine if the number of lost
contacts in each geometry is influencing the total error
fluctuation in Fig. 4, we divided the total error, F(a)i, with the
number of lost contacts (ci) and replotted them in Fig. 5. If the
geometries do not have any lost contacts (geometries 3A, 3D,
3E), then they are not shown in Fig. 5. The magnitude of errors
has now been lowered significantly compared to Fig. 4. For
coronene/HOPG systems the error per contact ranges within 5
meV while the coronene/Au(111) systems the error ranges
within 30 meV. Thus, the model “error” is less than 10% for the
case of coronene on HOPG but can be as large as 50% for
coronene on gold.
As we discussed in Fig. 1, single molecule desorption in
SAMs may be a multistep process which depends on the location
of desorption. For example, if coronene molecules must desorb
like ‘Geometry K’ (Fig. 3K), a total of 3 molecules must desorb
(Table 1). The first coronene molecule desorbing has 6
neighboring contacts, the second molecule adjacent to it has 5
contacts and the third molecule has 4 contacts, giving a total of
15 lost contacts (Table 1). If the DFT functional used is optB88-
vdW and substrate is HOPG, the first desorbing molecule should
have a total desorption energy (Ed-Total) which is the sum of
desorption energy of isolated coronene molecule on HOPG, Ed
(2.12 eV, Table 2) and six times the coronene-coronene contact
energy, 6*‘a’ = (6*(58 meV) = 348 meV (Table 2). Since the
error per contact, F(a)i/ci, for coronene/HOPG ranges within 5
meV (6*5 meV = 30 meV) (Fig. 5), the total desorption energy
(Ed-Total) for first desorbing molecule in ‘Geometry K’ (Fig. 3K)
should at least be 2.12 eV + 348 meV ± 30 meV = 2.47 ± 0.03
eV. Consequently, Ed-Total for second desorbing molecule should
be Ed+5*‘a’ = 2.41 ± 0.02 eV and Ed-Total for the third desorbing
molecule is Ed+4*‘a’ = 2.35 ± 0.02 eV. These should be
compared to the Ed for an isolated molecule, 2.12 eV. Thus, the
Figure 4. Errors, F(a)i, in energy for each geometry (see Figure 3) of
coronene/substrate (where, substrate = HOPG (orange, blue) or Gold (red,
green) with optB88 and optB86b vdW-DF functionals. The error
fluctuation (y-axis) in each plot is relative to energy (E0) of single isolated
coronene molecule on substrate. Note that relatively weak error fluctuation
of optB86b-vdW functional (green) on Au(111) is due near zero
interaction energy (vide supra and Table 2). The line connecting points is
solely meant to guide the eye.
Figure 5. Errors per contact, F(a)i/ci, for geometries with contacts (see Figure
3) of coronene/substrate (where, substrate = HOPG (orange, blue) or Gold
(red, green) with optB88 and optB86b vdW-DF functionals. The error
fluctuation (y-axis) in each plot is relative to energy (E0) of single isolated
coronene molecule on substrate. Note that relatively weak error fluctuation of
optB86b-vdW functional (green) on Au(111) is due near zero interaction
energy (vide supra and Table 2). The line connecting points is solely meant to
guide the eye.
Page 5 of 9 Physical Chemistry Chemical Physics
desorption energy can vary by ~0.4 eV depending upon the
coverage.
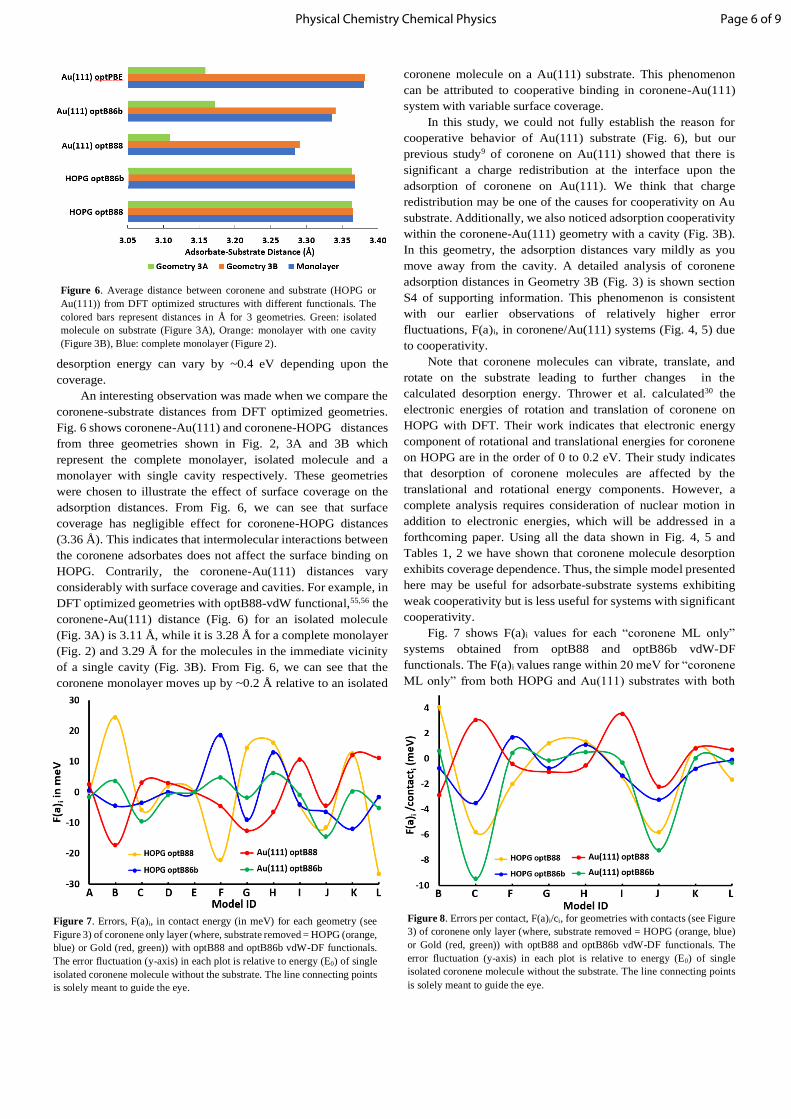
An interesting observation was made when we compare the
coronene-substrate distances from DFT optimized geometries.
Fig. 6 shows coronene-Au(111) and coronene-HOPG distances
from three geometries shown in Fig. 2, 3A and 3B which
represent the complete monolayer, isolated molecule and a
monolayer with single cavity respectively. These geometries
were chosen to illustrate the effect of surface coverage on the
adsorption distances. From Fig. 6, we can see that surface
coverage has negligible effect for coronene-HOPG distances
(3.36 Å). This indicates that intermolecular interactions between
the coronene adsorbates does not affect the surface binding on
HOPG. Contrarily, the coronene-Au(111) distances vary
considerably with surface coverage and cavities. For example, in
DFT optimized geometries with optB88-vdW functional,55,56 the
coronene-Au(111) distance (Fig. 6) for an isolated molecule
(Fig. 3A) is 3.11 Å, while it is 3.28 Å for a complete monolayer
(Fig. 2) and 3.29 Å for the molecules in the immediate vicinity
of a single cavity (Fig. 3B). From Fig. 6, we can see that the
coronene monolayer moves up by ~0.2 Å relative to an isolated
coronene molecule on a Au(111) substrate. This phenomenon
can be attributed to cooperative binding in coronene-Au(111)
system with variable surface coverage.
In this study, we could not fully establish the reason for
cooperative behavior of Au(111) substrate (Fig. 6), but our
previous study9 of coronene on Au(111) showed that there is
significant a charge redistribution at the interface upon the
adsorption of coronene on Au(111). We think that charge
redistribution may be one of the causes for cooperativity on Au
substrate. Additionally, we also noticed adsorption cooperativity
within the coronene-Au(111) geometry with a cavity (Fig. 3B).
In this geometry, the adsorption distances vary mildly as you
move away from the cavity. A detailed analysis of coronene
adsorption distances in Geometry 3B (Fig. 3) is shown section
S4 of supporting information. This phenomenon is consistent
with our earlier observations of relatively higher error
fluctuations, F(a)i, in coronene/Au(111) systems (Fig. 4, 5) due
to cooperativity.
Note that coronene molecules can vibrate, translate, and
rotate on the substrate leading to further changes in the
calculated desorption energy. Thrower et al. calculated30 the
electronic energies of rotation and translation of coronene on
HOPG with DFT. Their work indicates that electronic energy
component of rotational and translational energies for coronene
on HOPG are in the order of 0 to 0.2 eV. Their study indicates
that desorption of coronene molecules are affected by the
translational and rotational energy components. However, a
complete analysis requires consideration of nuclear motion in
addition to electronic energies, which will be addressed in a
forthcoming paper. Using all the data shown in Fig. 4, 5 and
Tables 1, 2 we have shown that coronene molecule desorption
exhibits coverage dependence. Thus, the simple model presented
here may be useful for adsorbate-substrate systems exhibiting
weak cooperativity but is less useful for systems with significant
cooperativity.
Fig. 7 shows F(a)i values for each “coronene ML only”
systems obtained from optB88 and optB86b vdW-DF
functionals. The F(a)i values range within 20 meV for “coronene
ML only” from both HOPG and Au(111) substrates with both
Figure 8. Errors per contact, F(a)i/ci, for geometries with contacts (see Figure
3) of coronene only layer (where, substrate removed = HOPG (orange, blue)
or Gold (red, green)) with optB88 and optB86b vdW-DF functionals. The
error fluctuation (y-axis) in each plot is relative to energy (E0) of single
isolated coronene molecule without the substrate. The line connecting points
is solely meant to guide the eye.
Figure 7. Errors, F(a)i, in contact energy (in meV) for each geometry (see
Figure 3) of coronene only layer (where, substrate removed = HOPG (orange,
blue) or Gold (red, green)) with optB88 and optB86b vdW-DF functionals.
The error fluctuation (y-axis) in each plot is relative to energy (E0) of single
isolated coronene molecule without the substrate. The line connecting points
is solely meant to guide the eye.
Figure 6. Average distance between coronene and substrate (HOPG or
Au(111)) from DFT optimized structures with different functionals. The
colored bars represent distances in Å for 3 geometries. Green: isolated
molecule on substrate (Figure 3A), Orange: monolayer with one cavity
(Figure 3B), Blue: complete monolayer (Figure 2).
Page 6 of 9Physical Chemistry Chemical Physics

DFT functionals. This indicates that regardless of the functional
used the error in coronene-coronene contact energies is small
compared to the coronene/substrate systems (Fig. 4). The error
per contact is graphed in Fig. 8. For “coronene ML only” from
both HOPG and Au(111) substrate geometries, the error
fluctuation reduced from 20 meV (Fig. 4) to 10 meV (Fig. 5).
The average intermolecular contact energies, ‘a’ values, are
determined to be 54 meV for “coronene ML only from HOPG”,
while ‘a’ = 40 meV for “coronene ML only from Au(111)” with
both functionals. The higher ‘a’ for “coronene ML only” from
HOPG (54 meV) than from Au(111) (40 meV) can be attributed
to the denser coronene-coronene packing on HOPG substrate49
(by ~0.28 Å) than on Au(111) substrate.45 Comparison of
coronene contact energies (‘a’) with and without the substrate
(Table 2), we notice that ‘a’ values are similar for coronene with
or without HOPG (~55 meV). This indicates that HOPG
substrate plays little role in the intermolecular contact energies.
On the other hand, ‘a’ values for coronene with or without
Au(111) substrate vary significantly indicating again that gold
substrate plays a significant role in the intermolecular contact
energies. Hence, coronene contact energies exhibit substrate
dependence on Au(111) and HOPG.
Conclusions
To summarize, we performed PW-DFT calculations with
vdW-DF functionals on coronene/substrate (substrate =
Au(111), HOPG) systems to determine coverage dependent
desorption energies at the single molecule level. We showed that
single molecule desorption in a physisorbed SAM is a complex
process (Fig. 1) and dependent on the coverage and substrate.
Using multiple geometries (Fig. 2, 3) developed based on
predetermined experimental STM images of coronene SAM on
Au(111) and HOPG, we calculated the electronic contributions
to the single molecule desorption energies and intermolecular
1 Ulman, Chem. Rev. 1996, 96, 1533−1554.
2 J. C. Love, L. A. Estroff, J. K. Kriebel, R. G. Nuzzo and G. M.
Whitesides, Chem. Rev. 2005, 105, 1103–1170.
3 S. Casalini, C. A. Bortolotti, F. Leonardi and F. Biscarini, Chem. Soc.
Rev. 2017, 46, 40–71.
4 Schoenbaum, D. K. Schwartz and J. W. Medlin, Acc. Chem. Res. 2014,
47, 1438–1445.
5 G. K. Jennings and P. E. Laibinis, Colloids Surf., A 1996, 116, 105−114.
6 R. Y. Lai, D. S. Seferos, A. J. Heeger, G. C. Bazan and K. W. Plaxco,
Langmuir 2006, 22, 10796–10800.
7 U. Mazur and K. W. Hipps, Chem. Commun. 2015, 51, 4737– 4749.
8 K. S. Mali, N. Pearce, S. De Feyter and N. R. Champness, Chem. Soc.
Rev. 2017, 46, 2520–2542.
contact energies. The computational results were least squares fit
(LSF) to a simple nearest neighbor model in order to account for
intermolecular contact energies. Data (Fig. 4-8 and Tables 1 and
2) from PW-DFT calculations and LSF analysis indicates that
coronene molecules have contact energies of about 54 meV with
or without the HOPG substrate indicating little substrate
dependence in the monolayer packing. On Au(111), coronene
exhibited cooperative binding with variable surface coverage.
The adsorption distances, desorption energies and intermolecular
coronene-coronene contact energies varied considerably with
various amounts of coverage (Fig. 2, 3) for the coronene/Au(111)
system. This study presents a simple model to determine
approximate position dependent desorption energies that, for
systems showing weak adsorbate-substrate cooperativity, can be
used with Monte Carlo simulations to predict accurate desorption
versus coverage data. On the other hand, systems with
significant cooperativity are not well reproduced by a nearest
neighbor model. In fact, attempts to use a quadratic dependence
on number of neighbors gave equally poor results in the
coronene/Au(111) case.
Acknowledgements
We gratefully acknowledge support of this work by the US
National Science Foundation (CHE-1800070). The
computational work was performed using resources from the
Center for Institutional Research Computing (CIRC) at
Washington State University (WSU) and from EMSL (grant
48783), a DOE Office of Science User Facility located at Pacific
Northwest National Laboratory (PNNL).
References
9 Jahanbekam, B. Chilukuri, U. Mazur and K. W. Hipps, J. Phys. Chem. C
2015, 119, 25364–25376.
10 G. Nandi, B. Chilukuri, K. W. Hipps and U. Mazur, Phys. Chem. Chem.
Phys. 2016, 18, 20819– 20829.
11 S. Whitelam, Adv. Mater. 2015, 27, 5720– 5725.
12 R. Valiokas, M. Östblom, S. Svedhem, S. C. T. Svensson and B. J.
Liedberg, J. Phys. Chem. B 2002, 106, 10401–10409.
13 D. Lindstrom, M. Muntwiler and X. Y. Zhu, J. Phys. Chem. B 2007, 111,
6913– 6920.
14 R. S. Smith and B. D. Kay, J. Phys. Chem. B 2018, 122, 587– 594.
15 S. Karpovich and G. J. Blanchard, Langmuir 1994, 10, 3315-3322.
16 G. Ghanizadeh and G. Asgari, Reaction Kinetics, Mechanisms and
Catalysis 2011, 102, 127-142.
Page 7 of 9 Physical Chemistry Chemical Physics

17 H. M. Schessler, D. S. Karpovich and G. J. Blanchard, Journal of the
American Chemical Society 1996, 118, 9645-9651.
18 D. Bain, E. B. Troughton, Y.-T. Tao, J. Evall, G. M. Whitesides, and R.
G. Nuzzo, Journal of the American Chemical Society 1989, 111, 321-
335.
19 Y. H. Yuan, C. M. Yam, O. E. Shmakova, R. Colorado Jr., M. Graupe,
H. Fukushima, H. J. Moore and T. R. Lee, J. Phys. Chem. C 2011, 115,
19749–19760.
20 L. S. Jung, C. T. Campbell, T. M. Chinowsky, M. N. Mar, and S. S. Yee,
Langmuir 1998, 14, 5636– 5648.
21 L. S. Jung and C. T. Campbell, J. Phys. Chem. B 2000, 104, 11168-
11178.
22 O. Dannenberger, M. Buck and M. Grunze, Journal of Physical
Chemistry B 1999, 103, 2202-2213.
23 R. Madueno, T. Pineda, J. M. Sevilla and M. Blazquez, Journal of
Electroanalytical Chemistry 2005, 576, 197–203.
24 T. J. Mullen, A. A. Dameron, H. M. Saavedra, M. E. Williams and P. S.
Weiss, Journal of Physical Chemistry C 2007, 111, 6740-6746.
25 S. Kundu, W. Xia, W. Busser, M. Becker, D. A. Schmidt, M. Havenith
and M. Muhler, Phys. Chem. Chem. Phys. 2010, 12, 4351–4359
26 H. Kang, Y. Kim, I. Choi, R. Chang and W. Yeo, Analytica Chimica
Acta, 2014, 843, 38–45.
27 L. S. Nieskens, A. P. van Bavel and J. W. Niemantsverdriet, Surf. Sci.,
2003, 546, 159.
28 P. J. Barrie, Phys. Chem. Chem. Phys., 2008, 10, 1688.
29 W. Liu, F. Maaß, M. Willenbockel, C. Bronner, M. Schulze, S. Soubatch,
F. S. Tautz, P. Tegeder and A. Tkatchenko , Phys. Rev. Lett., 2015, 115 ,
036104.
30 J. D. Thrower, E. E. Friis, A. L. Skov, L. Nilsson, M. Andersen, L.
Ferrighi, B. Jorgensen, S. Baouche, R. Balog, B. Hammer and L.
Hornekær, J. Phys. Chem. C 2013, 117, 13520–13529.
31 J.W. Niemantsverdriet, P. Dolle, K. Markert, and K. Wandelt, J. Vac. Sci.
Technol. A 1987, 5, 875.
32 W. Song, N. Martsinovich, W. M. Heckl and M. Lackinger, J. Am. Chem.
Soc. 2013, 135, 14854–14862.
33 K. W. Hipps and A. Bhattrai, In Encyclopedia of Interfacial Chemistry;
Wandelt, K. Eds.; Elsevier, 2018, 100-109, ISBN- 9780128098943. DOI:
10.1016/B978-0-12-409547-2.13048-3.
34 J. K. Nørskov, T. Bligaard, B. Hvolbaek, F. Abild-Pedersen, I.
Chorkendorff and C. H. Christensen, Chem. Soc. Rev., 2008, 37, 2163–
2171.
35 G. A. Samorjai and Y. Li, Introduction to Surface Chemistry and
catalysis 2nd Ed., John Wiley and Sons Inc., New Jersey, 2010.
36 J. K. Nørskov, F. Abild-Pedersen, F. Studt and T. Bligaard, Proc. Natl.
Acad. Sci. U. S. A., 2011, 108, 937–943. 37 R. J. Maurer, V. G. Ruiz, J. Camarillo-Cisneros, W. Liu, N. Ferri, K.
Reuter and A. Tkatchenko, Prog. Surf. Sci. 2016, 91, 72–100.
38 P. Lazar, F. Karlicky, P. Jurečka, M. Kocman, E. Otyepkova, K. Šafářova
and M. Otyepka J. Am. Chem. Soc. 2013, 135, 6372– 6377
39 W. Liu, A. Tkatchenko and M. Scheffler, Acc. Chem. Res. 2014, 47,
3369– 3377
40 Heimel, L. Romaner, J.-L. Brédas and E. Zojer, Surf. Sci. 2006, 600,
4548– 4562.
41 Z. Hu, B. Li, A. Zhao, J. Yang and J. G. Hou, J. Phys. Chem. C 2008,
112, 13650– 13655.
42 Terentjevs, M. P. Steele, M. L. Blumenfeld, N. Ilyas, L. L. Kelly, E.
Fabiano, O. L. A. Monti and F. Della Sala, J. Phys. Chem. C 2011, 115,
21128–21138.
43 Y. Chin, D. Panduwinata, M. Sintic, T. J. Sum, N. S. Hush, M. J. Crossley
and J. R. Reimers, J. Phys. Chem. Lett. 2011, 2, 62– 66.
44 Chilukuri and T. R. Cundari, Surf. Sci. 2012, 606, 1100−1107.
45 Jahanbekam, S. Vorpahl, U. Mazur and K. W. Hipps, J. Phys. Chem. C
2013, 117, 2914– 2919.
46 S. Uemura, M. Sakata, I. Taniguchi, C. Hirayama and M. Kunitake, Thin
Solid Films 2002, 409, 206– 210.
47 M. Yano, M. Endo, Y. Hasegawa, R. Okada, Y. Yamada and M. J.
Sasaki, Chem. Phys. 2014, 141, 034708.
48 F. Raigoza, D. A. Villalba, N. A. Kautz and S. A. Kandel, Surf. Sci. 2010,
604, 1584–1590. (and references therein)
49 K. Walzer, M. Sternberg and M. Hietschold, Surf. Sci. 1998, 415, 376–
384.
50 Y. L. Yang, K. Deng, Q. D. Zeng and C. Wang, Surf. Interface Anal.
2006, 38, 1039–1046.
51 G. Kresse, and J. Hafner, Phys. Rev. B 1993, 47, 558-561.
52 G. Kresse and J. Furthmüller, Phys. Rev. B 1996, 54, 11169.
53 G. Kresse and D. Joubert, Phys. Rev. B 1999, 59, 1758.
54 P. E. Blöchl Phys. Rev. B 1994, 50, 17953.
55 J. Klimeš, D. R. Bowler and A. Michaelides, Phys. Rev. B 2011, 83,
195131.
56 M. Dion, H. Rydberg, E. Schroder, D. C. Langreth and B. I.
Lundqvist, Phys. Rev. Lett., 2004, 92, 246401.
57 G. Li, I. Tamblyn, V. R. Cooper, H. -J. Gao and J. B. Neaton, Phys. Rev.
B: Condens. Matter Mater. Phys. 2012, 85, 121409.
58 V. G. Ruiz, W. Liu, E. Zojer, M. Scheffler and A. Tkatchenko, Phys.
Rev. Lett. 2012, 108, 146103.
59 B. Chilukuri, U. Mazur and K. W. Hipps Phys. Chem. Chem. Phys. 2014,
16 (27), 14096-14107.
60 H. J. Monkhorst and J. D. Pack, Phys. Rev. B 1976, 13, 5188.
61 V. Talyzin, S. M. Luzan, L. Leifer, S. Akhtar, J. Fetzer, F. Cataldo, Y. O.
Tsybin, C. V. Tai, A. Dzwilewski and E. Moons J. Phys. Chem. C 2011,
115, 13207–13214
62 P. V. C. Medeiros, G. K. Gueorguiev and S. Stafström, Phys. Rev. B:
Condens. Matter Mater. Phys. 2012, 85, 205423
63 S. Gautier, S. N. Steinmann, C. Michel, P. Fleurat-Lessard and P.
Sautet, Phys. Chem. Chem. Phys., 2015, 17, 28921. 64 W. Reckien, M. Eggers and T. Bredow, Beilstein J. Org. Chem. 2014,
10, 1775–1784.
65 J. Hermann, R. A. DiStasio Jr and A. Tkatchenko, Chem. Rev., 2017, 117,
4714. 66 K. Berland, V. R. Cooper, K. Lee, E. Schröder, T. Thonhauser, P.
Hyldgaard and B. I. Lundqvist, Rep. Prog. Phys. 2015, 78, 66501.
Page 8 of 9Physical Chemistry Chemical Physics

248x145mm (150 x 150 DPI)
Page 9 of 9 Physical Chemistry Chemical Physics