cooperative alternative program: a study of program …
TRANSCRIPT
COOPERATIVE ALTERNATIVE PROGRAM: A STUDY OF PROGRAM
EFFECT ON THE DROPOUT RATE. TAAS EXIT TEST MASTERY
RATE, AND ATTENDANCE RATE AMONG IDENTIFIED
HISPANIC AT-RISK HIGH SCHOOL STUDENTS
by
JAMES ALVAH McSWAIN, B.A., M.Ed.
A DISSERTATION
IN
EDUCATIONAL LEADERSHIP
Submitted to the Graduate Faculty of Texas Tech University in
Partial Fulfillment of the Requirements for
the Degree of
DOCTOR OF EDUCATION
Approved
December, 1995
f?ol —r 2
/go-i3} TABLE OF CONTENTS
LIST OF TABLES iii
LIST OF FIGURES iv
CHAPTER
I. INTRODUCTION AND PROBLEM STATEMENT 1
II . REVIEW OF LITERATURE 21
III . PROCEDURES FOR COLLECTING DATA 43
IV. PRESENTATION OF THE DATA AND THE ANALYSIS OF THE RESULTS 50
V. SUMMARY, CONCLUSIONS, IMPLICATIONS, AND RECOMMENDATIONS 66
REFERENCES 72
11

LIST OF TABLES
4.1 Dropout Rate in Raw Nuinbers 51
4.2 TAAS Mastery Rate in Raw Numbers 55
4.3 Attendance Rate in Raw Numbers 59
1 1 1
LIST OF FIGURES
3 .1 Dropout Rate Collector 48
3 .2 TAAS Mastery Rate Collector 48
3 . 3 Attendance Rate Collector 49
4 .1 Dropout Rate Raw Number Bar Graph 52
4 . 2 Dropout Rate Percent Bar Graph 53
4.3 TAAS Mastery Rate Raw Number Bar Graph 57
4.4 TAAS Mastery Rate Percentage Bar Graph 5 8
4.5 Attendance Rate Raw Number Bar Graph 60
4. 6 Attendance Rate Percentage Bar Graph 62
4.7 Level of Statistical Significance Bar Graph 63
IV
CHAPTER I
INTRODUCTION
In recent years, educators have faced a problem of
increasing magnitude. It is a problem which centers on
students who have been identified as at-risk because they
are in danger of dropping out of school before reaching
graduation. The concern of educators in regard to these
students is that in leaving school most will condemn
themselves to lives of poverty. In poverty, they become a
burden on society in terms of social programs and increased
cost of law enforcement (Hahn, 1986). In recognizing this
problem, educators have searched for ways to keep more
children in school. Many at-risk students, however, come
from homes of poverty themselves and do not place a high
value on education. Parents who do not have a high regard
for education, or consider themselves incapable of
learning, pass those same ideas on to their children.
Without intervention, the cycle continues to perpetuate
itself (Cohen, 1986). In fact, the greatest single
predictor of a student's success in school is the
educational level of the mother (Markey, 1988).
Many attempts at interrupting the dropout cycle have
centered around enforcement of compulsory education laws or
1

providing special opportunities and facilities in an effort
to entice students to remain in school. Historically, most
efforts at dropout prevention have been made in the primary
grades. It has been assumed that little can be done to
keep children in school at the senior high level (Cohen,
1986) .
There is now growing evidence that programs to keep
students in school can be successful on the secondary
level. The focus is on those who have "fallen through the
cracks" in the system (Cohen, 1986). This new area of
study centers around helping at-risk students raise their
self-image and, therefore, motivate them to develop their
full potential (Story & Sullivan, 1986) . Many at-risk
students drop out of school because they believe that they
are not capable of completing an education. Their self-
image is low (Cohen, 1986).
The Cooperative Alternative Program (CAP) High School
is an alternative school designed to address the specific
needs of at-risk youth in an isolated, rural area.
Students are identified using State of Texas at-risk
guidelines and given the opportunity to participate in the
program. Students must be between the ages of fourteen and
twenty-one and be eligible for enrollment in one of the
eight participating school districts. In this manner.
students from small districts are able to receive highly
specialized services designed to counteract problems,
identified in the literature, as major factors in the
dropout phenomenon (Casey, McSwain & Beach, 1993). The
program opened in 1988 and continues as of the time of this
writing.
Small schools, especially those in rural, sparsely
populated regions of Texas, often find that providing such
an intervention program with accompanying services for
dropouts and at-risk students is too expensive for single
schools to develop. They lack the necessary financial
resources to provide the appropriate educational setting,
instructional technology, curriculum materials, and
training for faculty and staff (Casey & McSwain, 1989) .
In order to address this problem, the Cooperative
Alternative Program (CAP) High School was formed as a means
by which small rural schools in an isolated part of West
Texas could provide an effective and meaningful impact on
high-risk students with below-average academic performance
and who are enrolled in regular school programs within the
eight participating school districts. These high-risk
students are identified and given the option to participate
in the program. CAP also recruits individuals residing in
the districts who have already dropped out of school
without earning a high school diploma, including teenage
parents and single parents. Students arrive at the CAP
campus with minimal skills and limited employability in
surrounding communities and the job market in general.
For students enrolled in CAP High School, the program
provides a comprehensive, integrated curriculum that is an
alternative to the traditional classroom and coordinates
efforts between special education and vocational classes.
The program includes the following features (Casey,
McSwain, & Beach, 1993):
1. Accelerated Learning Strategies for Improved
Academic Performance--CAP High School is designed to
provide academic assistance to students who have dropped
out or are at-risk of dropping out by developing the skills
and competencies necessary to meet requisite academic
standards for high school graduation. Because of the
complex profile of the dropout and at-risk student, the
program addresses the problem by focusing on four
interrelated areas:
a. improvement of classroom grade averages;
b. overall improvement in passing TAAS tests;
c. improvement in attitude toward school; and
d. improvement in self-concept.

Improved classroom performance in grade averages and
achievement on the state mandated TAAS Exit Test are
addressed directly through instructional technology in the
form of computer-assisted instruction and interactive
video, coupled with curriculum resources that utilize
computer technology and provide a stimulating learning
environment. This technology allows students to accelerate
their learning and make up several grades in one year if
their performance so merits. The interactive learning
system provides an academic tracking mechanism and
diagnostic capability for each student so that teachers can
closely monitor the progress of students and prescribe
appropriate instruction and/or remediation (Casey, Wiese, &
McSwain, 1995).
Academic acceleration and the provision for student
success are methods consistent with the research of Harter
(1978), Wiesz and Stipek (1982), and Glasser (1992). The
research indicates that students' attitudes toward school
and ultimate success or failure may be significantly
correlated to students' ability to meet requisite academic
standards.
2. Systematic Monitoring of Attendance and Follow-up
of Absences with Parents--Th.e assistant principal is
responsible for monitoring the attendance records of

students at CAP High School and works with an attendance
officer. The assistant principal, working with the
attendance officer and counselor, reviews attendance
records and contacts students and parents of students who
have been absent without a legitimate excuse. A
computerized calling system is also used. The absentees
each day are entered into the system, and the
parents/guardians are called each evening. Contact is made
on a weekly basis with each contracting school district so
they can pursue chronic absentees as well. For students
with chronic unexcused absences, charges are filed against
the parents to secure support in getting the student to
school (Casey & McSwain, 1989). Research suggests that
parent involvement and accountability for student
attendance is a significant factor in student success at
school (Cantor, 1991; Curwin & Mendler, 1988).
3. Family Outreach--From its inception, CAP High
School has involved teachers and parents in the educational
programming for students. Many parents lack the necessary
skills to feel competent to be involved in the education of
their student. Family Systems curriculum was implemented
to involve the family unit in the educational process. The
Family Systems Curriculum serves as a vehicle for:

a. facilitating positive parent, student, and faculty
interaction,
b. reinforcing a positive, caring environment,
c. developing student self-awareness and coping
skills,
d. facilitating family involvement in school/
education,
e. focusing on the family as an area of study.
Topics included in the Family Systems Curriculum include
such areas as family stress, improving family
communication, and enjoying family holidays (Casey &
McSwain, 1989).
Helping students improve home life and portraying an
image of genuine concern for their well-being allows them
to view the school as a place of rescue and refuge instead
of an adversary and an institution to be feared. The
research of Glasser (1992) supports this tenet.
4. Counseling Services--ln addition to educational
opportunities, students receive counseling as needed from
an on-site counselor. Emphasis is placed on individual and
group counseling. A limited amount of family counseling is
performed; referrals are made to MHMR, Family Outreach, and
other social services agencies (Casey, McSwain, & Beach,
1993). The rationale for this service is supported by
Glasser (1992) .
5. Career Awareness and Preparation Services--
Students receive counseling with regard to career awareness
and career options and are encouraged and assisted in
applying for JTPA funds so they can be placed in a job
internship. A limited number of internship positions are
available at CAP High School, which provide students with
work experience and training prior to graduation (Casey,
Beach, & McSwain, 1993).
It is believed that successful and positive experience
with "real life" work responsibilities will enhance student
attitudes toward work, thus increasing the likelihood of
long-term career success. The premise is supported by the
research of Deci and Ryan (1980) and Mosley and Sullivan
(1983) .
6. Social Support Services--For students who have
dropped out of school because they have children of their
own, CAP High School furnishes an on-site, fully licensed
and certified day care and preschool facility. Students
receive transportation to and from school for themselves
and their children.
It is believed that the inclusion of a preschool unit
ight have a future effect on the dropout and at-risk cycle
8
mi

(Casey & McSwain, 1989). Research supports early
intervention (Slavin, Karweit, & Wasik, 1993).
7. Linkages Among Feeder Schools and Involvement of
Business Community--From the beginning of its development,
CAP High School has had an advisory council of local
business men and women who meet several times during the
year to provide guidance and input in the program planning
and development. The Advisory Council members have also
been helpful in sponsoring or finding sponsors for students
in work internship programs.
Each of the contracting school districts has a member
that serves on a governing board which oversees the general
operation of the school and supervises the delivery of
services to the students (Casey & McSwain, 1989) .
Obnectives of the Program
Objectives of CAP High School include:
1. Assess each student's functional level in the
skill areas of math, reading, and writing
(communications) and plan and implement a program
of instruction for students, which leads to higher
academic achievement as measured by grade averages
in class.

2. Increase student basic academic skills in the
context of life-like situations, particularly as
they apply to job related areas (i.e., calculating
square feet, making accurate change).
3. Provide a comprehensive, integrated curriculum for
students which incorporates learner accountability
and meets all state and district guidelines and
leads to successful completion of exit tests
(TAAS) for graduation.
4. Provide an instructional setting that gives
students a positive environment and purpose for
learning by means of a computer learning system
and teacher training in methods of working with
at-risk students,
5. Involve at least 60% of the parents in the
educational program of their student by including
them in the Family Systems Curriculum.
6. Improve school attendance and achieve at least a
minimum of 78-80% school retention and graduation
rate.
Statement of the Problem
The problem then focuses on the determination of
whether or not the Cooperative Alternative High School
10
indeed reduces the dropout rate and increases the TAAS Exit
Mastery Rate, and the attendance rate among eligible
Hispanic students from the region it serves.
The complexity of the dropout phenomena requires
consideration of nontraditional approaches and programmatic
designs in the effort to reduce the dropout rate, improve
attendance, and increase TAAS mastery. By design, the
Cooperative Alternative High School is a nontraditional
program, and it utilizes a nontraditional approach in its
academic regimen and addresses social and personal needs of
students. Because of its nontraditional design and
methods, formal analysis of program effect on identified
variables of attendance, dropout rate, and TAAS mastery is
warranted. The focus of the study on Hispanic students is
appropriate for the following reasons.
1. Hispanic students have the highest dropout rate of
any identifiable group in Texas (Cardenas, 1990) .
2 . The predominate minority group of the participating
schools is Hispanic.
3 . The predominate minority group present at CAP is
Hispanic.
4. The dropout rate for Hispanics in Texas has
continued to rise over the period of this study
(Johnson, 1993) .
11

5. Any effect on this group would be generalizable to
other populations.
Theoretical Framework
The basic theoretical foundations for the design to
the Cooperative Alternative Program and for the study are
found in human psychology - specifically in the work of
William Glasser, M.D. In his work on quality schools,
Glasser outlines the "Q-School." He proposes the "Q-
School" to be the most effective means for the delivery of
instruction. The proposed design of his "Q-School" is
based on his years of research in human psychology and its
application to schools. The theoretical "Q-School" would
exhibit the following features.
1. An alternative secondary school,
2. As few as one hundred students and five to ten
teachers,
3. A charter that requires all personnel to agree
that "Education is the process in which we
discover that learning adds quality to our lives,"
4. Curriculum that teaches academics but will apply
what is learned to the "real world,"
12

5. Students who learn at their own rate with the
academic emphasis placed on mastery of skills
rather than coverage of material,
6. No pressure for grades applied to students,
7. Teachers who are treated as professionals by
students and administration,
8. Assessment of students by means of portfolios and
projects,
9. Students who are taught social and moral
responsibility,
10. Students who are required to take responsibility
for the school, themselves, and others,
11. No use of coercion,
12. A school characterized by a warm atmosphere with
an attitude of concern for all,
13. No allowance for elitism (Glasser, 1992).
The Cooperative Alternative Program design closely
resembles the features of Glasser's "Q-School."
Foundations for Glasser's design of the "Q-School" are in
control theory. In control theory, Glasser contends that
human behavior is explained by the individual's choosing to
behave in a certain manner because he sees the behavior as
being congruent with that which is important to him. It
exists in his quality world. Glasser points out that most
13
schools have traditionally depended upon stimulus-response
theory to undergird programs and procedures. Specifically,
if negative behavior is exhibited, the student will be
punished. He argues that educational methods based on
stimulus-response theory do not affect real change, but
only cause temporary compliance in the presence of
authority. He further contends that continued use of
stimulus-response methods will produce the opposite of the
desired effect as the student rebels against the coercion
used to try to achieve a specific outcome. Conversely,
control theory postulates that the more importance or value
an individual ascribes to something or some activity, the
more he will want to do it, and he will perform the tasks
required at a higher level of competence. Such value or
importance is judged by each individual in accordance with
the degree to which it satisfies basic human needs.
Glasser (1992) summarizes control theory as follows:
To understand what motivation actually is, it is necessary first to understand that control theory contends that all human beings are born with five basic needs built into their genetic structure: survival, love, power, fun, and freedom. All of our lives we must attempt to live in a way that will satisfy one or more of these needs.
Control theory is a descriptive term because we try to control our own behavior so that what we choose to do is the most need-satisfying thing we can do at the time. (pp. 43-44)
14
By design then, the Cooperative Alternative Program
ascribes to control theory and includes most of the
features present in a Glasser Quality School.
Purpose of the Study
This study seeks to quantify the effect of the
Cooperative Alternative Program design on three significant
variables used in the evaluation of schools: Dropout Rate,
TAAS Mastery Rate, and Attendance Rate. These measures are
three of the most significant parts of the Texas Academic
Excellence Indicator System. The AEIS is the official
means employed at the time of this writing to assess school
performance and assign accreditation status in Texas. Use
of these measures is therefore appropriate for this study.
Hypotheses
1. CAP enrollment will be independent of Dropout Rate.
2. CAP enrollment will be independent of TAAS Mastery Rate.
3. CAP enrollment will be independent of Attendance Rate.
Delimitations
The study will focus specifically on the CAP program
effect on at-risk Hispanic students from a defined service
area. These students represent a group highly susceptible
15
to the dropout phenomenon. The study will serve to
quantify only the program effect on specific variables.
Limitations
Results of the study should not be generalized to any
other study or program. It is specifically not designed to
quantify any of the research of William Glasser and/or
control theory, even though control theory serves as a
theoretical foundation of the school and the study. This
study is not a validation of a "Q-School model." Further,
the study should not be considered to be and is not
intended as any type of measure of success or failure of
the Cooperative Alternative Program or its personnel. It
is only a study of program effect on specific variables.
Assumptions
It is imperative that specific assumptions be
considered as the results of this study are interpreted.
1. It is assumed that all data is correct. Data was
obtained through examination of official school
permanent records under the supervision of school
officials. Specific students' names are protected by
federal privacy laws and cannot be revealed in this
study or any other associated document.
16
2. A total of 71 eligible non-participants were identified.
It is assumed that use of 100% of these subjects will
insure validity of the study.
3 . It is assumed that random selection using a SAS computer
software program will insure validity in the selection
of an equal number of CAP participants.
4. It is assumed that statistical calculations made by
means of a SAS computer software program are correct.
5. It is assumed that CAP participation will impact the
variables of Dropout Rate, Attendance Rate, and TAAS
Mastery Rate.
6. It is assumed that Glasser's Q-School model is
appropriate for this population.
7. It is assumed that CAP staff members accept Glasser's
Q-School model as appropriate.
8. It is noted that three different administrative leaders
are present at CAP throughout the period studied. It is
assumed that the philosophical foundations remained
intact through this transition.
Definition of Terms
Alternative School--An educational program designed to meet
the needs of an identified group. It exists separate
from a regular school environment.
17
Attendance Rate--The number of students who exceeded the
State of Texas maximum number of absences (10% of the
number of days in the semester) for any one semester
while enrolled in high school compared to those who
did not exceed the maximum number of allowable
absences.
At-Risk--A term defining a group of students who meet one
or more criteria selected by the State of Texas that
identifies them as being at a statistically higher
risk of dropping out of school than students who do
not possess one or more of the identifying
characteristics.
Dropout Rate--The number of students who completed a high
school diploma or a G.E.D., remained in school, or
moved and enrolled in another school compared to those
who did not for the time period of September 1, 1988
through June 1, 1994.
Hispanic--Students whose official identification of
ethnicity according to official school records is "Of
Hispanic Origin."
TAAS Mastery Rate--The number of students who passed the
Reading, Writing, and Math sections of the Texas
Assessment of Academic Skills or the Texas Educational
Assessment of Minimal Skills simultaneously on the
18
first attempt after enrollment at CAP or a home campus
compared to those who failed one or more sections on
their first attempt at either CAP or their home
campus.
Procedures
The listed procedures for conducting this study will
be followed.
1. Identify eligible Hispanic nonparticipants for the
Cooperative Alternative Program.
2. Identify and randomly select a sample of eligible
Hispanic participants in the Cooperative Alternative
Program that matches the sample size of eligible
nonparticipants.
3. Locate the official school permanent records for each
student and determine, in categorical manner, the total
numbers of students for each group who have dropped out,
failed to master TAAS, or exceeded the maximum allowable
number of absences for a semester of high school, as
well as those who did not drop out, fail to master TAAS,
or exceed the maximum number of allowable absences for a
semester of high school.
4. The identified variables will be studied by means of
chi-square analysis.
19
5. The research design will identify a participant group
and a nonparticipant group. Categorical data for each
group will be analyzed to determine if any statistically
significant difference in categorical data is evident
between the two groups.
6. Results of the study will be reported and a narrative
analysis made.
Organization of the Dissertation
This dissertation is divided into five chapters.
Chapter I introduces the concepts and questions of the
study and outlines critical components. Chapter II
comprises a review of the literature related to at-risk
students, the dropout problem, and their possible causes.
Chapter III outlines the research design and methods to be
used in the collection and analysis of the data. Chapter
IV finalizes the research phase of the dissertation by
presenting the data and an analysis of its results in terms
of a statistical chi-square analysis. Finally, Chapter IV
summarizes the study and draws conclusions apparent from
the analysis of the data. It makes recommendations and
implications for further research and educational
programming.
20
CHAPTER II
REVIEW OF THE LITERATURE
Many have asked why numbers of children with great
potential give up and drop out of school. In a large
majority of cases the answer is discouragement. Students
who continually have a negative self-concept about their
ability to academically achieve soon become so discouraged
that they will not return to school. They consider the
entire experience of school a difficult and demanding
environment. Although with only minimal levels of
perseverance, they would be capable of coping with the
tasks before them; they do not believe that they are
capable of learning and drop out rather than continue to
face what they perceive to be an unpleasant task.
This idea was tested and validated in two studies.
Deci and Ryan (1980) and Mosley and Sullivan (1983) exposed
students to a negative atmosphere while they attempted
certain tasks. They determined that a relationship did
exist between the exposing of students to a negative
atmosphere and the consistency with which they returned to
a task performed under those conditions. A later research
study of Hispanic students in Texas found that 65% of
dropouts surveyed viewed school personnel in a negative
21
manner. In general, the most frequently reported factor in
the dropout phenomenon was a negative experience with
school (Davis, 1990).
When the concept is investigated further, it is found
that not only is a student less likely to return to a
difficult task, but his or her self-image begins to suffer
in a negative atmosphere as well. It has been confirmed
that declining self-image in itself is enough to extinguish
student motivation. Research by Harter (1978) and Wiesz
and Stipek (19 82) confirmed that perceived competence on
the part of the student has a definite effect on his or her
willingness to return to a task. They found that students
who repeatedly failed to successfully perform a task soon
develop a low self-image. The lower the self-concept
dropped, the less likely students were to continue the task
or to undertake new ones for fear that they could not
competently complete them.
In addition, Gurney (1987) researched maladjusted
students with low self-images. These students were exposed
to special schools that employed behavior modification
techniques designed to increase the occurrence of positive
self-referrant verbal statements. The hypothesis for
Gurney's study indicated that a period of six weeks or more
of eliciting positive self-referrant verbal statements from
22
students would enhance the students' global self-esteem.
Results indicated that the hypothesis was indeed correct.
According to Gurney (1987):
A significant enhancement effect for overt global self-esteem was noted, and although not a part of the research design and analysis, both the experimental and control groups gained significantly in expressed global self-esteem over the treatment period, (p. 40)
Research by Fuller, Ronning, Van Voorhis and Moore (1993)
found that students who showed an increase in perceived
levels of self-confidence later demonstrated greater gains
in reading comprehension when compared with students who
demonstrated lower levels of perceived self-confidence at
the beginning of the study. Along these same lines, it has
been found that a student's self-image can be manipulated
by teacher actions and reactions.
Miron (1971) and 0'Leary and O'Leary (1972) both found
a high degree of correlation between a teacher's level of
perceived competence of a student and the student's own
perceived level of competence. In terms of creating at-
risk students, teachers may actually contribute to a
student's propensity to be at-risk or drop out by labeling
the student and lowering his expectations, consequently
limiting the student's potential for academic achievement.
It has also been found that teachers frequently blame the
at-risk phenomenon on student homelife rather than consider
23

individual student needs or their own teaching methods and
practices (Koehler, 1988) .
Teacher comments and evaluation systems are probably
the two most evident contributors to the negative
environment that discourages many students and pushes them
further into the downward spiral that eventually leads to
the student's dropping out of school. Much empirical data
has been gathered in this area to support the conclusion.
Felker, Stanwyck, and Kay (1973) confirmed an association
between self-image and the frequency of positive self-
referrant verbal statements on the part of the student.
Maehr and Stalling (1972), Maehr (1976), and Kremer (1976)
suggested that negative teacher evaluations and comments
had a direct bearing on a student's willingness to return
to a task.
Pollack, Costomiris, Stroka, and Pittman (1982) and
Story and Sullivan (1986) found that positive teacher
evaluations greatly enhanced their subjects' self-images
and achievement levels. Story and Sullivan (1986) went on
to say, "When students do well or think they do well on a
task, they are likely to feel more competent" (p. 90).
Data suggested that the return rate to a task was much
higher when the student's perceived level of competence was
higher. The teacher can directly influence a student's
24
perception of competence by providing frequent activities
at which students are successful and by praising and giving
attention to student strengths.
An earlier study by Pittman, Boggiano, and Ruble
(1983) found much the same thing. Positive feedback in
terms of teacher evaluations enhanced the student's desire
to return to a particular task. Positive teacher comments
were the focus of a study done by Seligman (1975). It was
found that when a student is shown the relationship between
his effort and some measurable improvement, even if the
student still has not achieved a passing grade, he will be
encouraged to return to a difficult task and begin to
achieve. The use of positive comments helps students see
that their increased effort and perseverance at a task is
beginning to pay off.
Similar studies have concluded with similar results.
A student with a failing grade can still be motivated to
try harder and stay in school when teachers use positive
comments as a part of student evaluations. These findings
were confirmed by Story (1984), Morgan (1984), and
Rosenfield, Folger, and Adelman (1980). A study completed
by McDonald (1991) found that low performing students often
discredited negative teacher comments and feedback intended
to help them do better work. This phenomenon was
25

attributed to the student's need to preserve a positive
self-image.
The logical direction for a researcher to take at this
point might be to ask: What particular teacher actions
might break the cycle of a negative atmosphere which breeds
low self-concept and low achievement which in turn causes
failure and a further decline in self-concept, and an
eventual unwillingness on the part of the student to return
to the task at hand--school? The answer seems simple, and
it is supported by considerable evidence. Teachers can
affect and sometimes break a student's downward spiral with
praise and other forms of positive comments. The study
mentioned earlier by Seligman (1975) used comments such as,
"Your work has improved because you tried," and, "It's
clear you studied hard for the test - the effort shows,"
with students who received a failing grade (p. 24). He
found that students who received such comments were more
likely to return to a difficult task than students who
received the failing grade only.
Investigation by Deiro (1994) into the bonds formed
between teachers and secondary students at-risk concluded
students were positively affected by teachers who employed
methods directed at nurturance of healthy emotional
development. Successful teachers used meaningful and
26
responsive dialogue and one-on-one time to boost student
self-image.
A research project described by Beauchamp (19 92) and
conducted by Levin involved an experimental accelerated
school. Levin found that self-esteem was a primary factor
in student achievement and determined that direct teacher
actions and school policies can have a profound effect on a
child's feelings of self-worth and, consequently, his or
her ability to be successful in school. In his study, only
three students actually met the state's established
standard for being "gifted." By the school's standard,
however, and for purposes of research, all children were
labeled "gifted." The school concentrated on student
strengths and did not focus on weaknesses. High
expectations were set for all students, especially those in
Chapter I programs, and no student was tagged as a "slow
learner" or in need of remediation. No students were held
back, and the growth of student self-esteem was
communicated to teachers as one of their primary
assignments. Student projects and work lined the hallways.
Positive self-image mottoes and logos were posted
throughout the building. Every experience the children had
exposed them to techniques of positive self-image building.
Most important, teachers consistently praised students and
27
expected them to perform. Teachers also concentrated on
student strengths and placed less emphasis on student
failures. After the first year, 39% of Chapter I students
in math tested out of that program. In addition, 3 6% of
Chapter I reading students tested out of the program. The
level of vandalism caused by students dropped, and student
self-esteem, as measured by standardized scale, increased.
This experiment suggests that changing a student's
perception of his or her own self-worth impacts academic
success or failure (Beauchamp, 1992).
A similar experiment conducted by Levin and reported
by Egan (1992) yielded similar results. After two years,
standardized test scores continued to rise and student
failure rates decreased. Yet another such experiment by
Levin moved student test scores from a rank of 65th out of
79 schools to 23rd out of 69 (Egan, 1992).
In a case study of Sweetwater High School in National
City, California, the school was found to have reduced its
dropout rate from 3 6% to 19.5% over a three-year period.
The school is over 90% minority with 24% qualifying as low-
income. In addition, 73.7% of its graduates were accepted
and continued in post secondary education. The major
innovations credited for the change were:
28
1. A high degree of initiative in the implementation
of change by school personnel;
2. A higher degree of incentive and reward for
teachers who positively affect student
performance;
3 . A higher degree of incentives for students who
improve performance;
4. Technology and innovation in the classroom;
5. Emphasis on individual student responsibility;
6. Emphasis on student self-esteem and emotional
needs;
7. Staffing by teachers who believed in positive
motivation (Kammoun, 1991).
These case studies represent research data at the time of
this writing. They do support, in practical terms, the
connection between efforts designed to raise student self-
esteem and increased student achievement. They demonstrate
the potential impact on student performance when a
comprehensive programmatic approach is used.
Gage (1990) points out that it is important to examine
the instructional emphasis of schools if educators really
desire to enhance student self-esteem. He cites research
by Howard Gardner of Harvard University and Robert
Sternberg of Yale University to strengthen his position on
29

multiple intelligences. Gage notes that most high school
curricula places heavy emphasis on linguistic/verbal and
logistical/mathematic abilities, while other areas of
strength are ignored or seen as less important.
These other areas of intelligence include
bodily/kinesthetic intelligence, interpersonal
intelligence, intrapersonal intelligence, and musical
intelligence. He does acknowledge that the law of supply
and demand, which dictates our society, controls the number
of people with expertise in these areas that the society
needs; however, he postulates that schools with more
diverse curricula that encourage success in these other
areas of intelligence may well increase the likelihood that
students will achieve greater success in linguistic/verbal
and logical/mathematic areas; the premise being that the
experience of success in one area may be generalized and
increase the student's overall self-image. This improved
self-image should enable the student to overcome mental
barriers built by failure in areas of weakness. Gage's
theory is supported by the previous work of Gurney (1987) .
In addition, Gardner and Hatch (1989) propose that:
A consideration of a broader range of talents brings to fore individuals who previously had been considered unexceptional or even at risk for school failure. (Cited in Gage, 1990, p. 284)
30

studies done by Cohen, Emrich and deCharmes (1977)
found that teacher acquisition of knowledge only concerning
motivational techniques had no influence on student
performance. In moving a step forward, however, Rohrkemper
(1985) found that teachers who had been trained in positive
motivational techniques and used them in the classroom
affected the motivation levels of their students. The
emphasis of this study was on the use of techniques which
most teachers had learned in basic teacher training, but
had not put into practice.
This study served as a confirmation of a study by
Cohen (1979). In this study, teachers were trained in
methods of positive communication with their students. The
result was that student interest increased and positive
contributions in class went up while incidents of
disruptive and irrelevant behavior went down. More
learning took place and achievement went up. Cohen (19 86)
goes further to admonish teachers to learn to supply the
knowledge of motivation theory they possess. She suggests
that application is a weakness of teacher preparation
programs that directly relates to the success or failure of
students. Cohen advocates training teachers in
methodologies which allow students to have a sense of
ownership of behavior or personal causation. It should be
31
noted that a sense of personal causation linked to a
successful activity outcome on the part of students may
increase a student's likelihood of returning to the task.
A study by Stasz (1994) found that, indeed, teachers who
employed innovative teaching strategies designed to
increase cooperation between students and the reinforcement
of high level thinking skills had a higher degree of
positive comments from former students than traditional
classrooms.
There are those who have attempted to refute the ideas
presented thus far. Two primary studies are foremost in
supporting the philosophy that deliberate attempts to
motivate will not work for any length of time in the
classroom. Lepper and Green (1978) and Lepper (1983) hold
that,
an added incentive in the classroom provides overjustification to engage in an activity such that the activity will be subsequently perceived as an attempt to attain the incentive rather than to engage in activity. (p. 285)
In other words, a student will become so interested in the
incentive that he or she loses interest in the task. He or
she may even revert to negative behavior in an attempt to
gain the incentive without performing the task
successfully. In addition, one study by Hitz and Driscoll
32

(1989) determined that a teacher's use of inappropriate
praise may lower a student's level of self-confidence.
The evidence in support of using motivational
techniques to help at-risk students stay in school seems to
outweigh any evidence to the contrary. Justification,
therefore, exists to design and implement programs which
concentrate motivational techniques and specifically seek
to counteract low self-image among students.
The term at-risk describes a serious threat facing not
only Texas, but all of American society and, if
unaddressed, promises to consume significant numbers of tax
dollars and educational resources, thus causing a further
decline in the system's ability to serve other students.
Scores of youth who are unable to demonstrate basic
competence drop out of school and fail to complete their
high school education. Consequently, they swell the ranks
of the unemployed, the indigent, the welfare recipients,
and the incarcerated. Each year taxpayers are faced with
an increasing tax burden, yet the many students who drop
out of school not only drain the system, but are unable to
contribute to the tax base which supports it. As Gage
(1990) notes.
Clearly dropping out hurts the nation grievously in terms of health, wealth, and the achievement of our democratic ideals. It stunts lives, leads to personal
33
unhappiness and tragedy, and lowers an individual's self-esteem, (p. 280)
Nationally, the dropout rate is reported to be
approximately 25% and has remained relatively constant for
the past 30 years (Hahn, 1987). In Texas, the dropout rate
during the 1980's has been as high as 33% for the general
student population, and for Mexican American students, the
rate has averaged 47% during the last four years of the
1980's (Cardenas, 1990). In 1992, the dropout rate in
Texas was reported to be 34% overall and 48% for Hispanics
(Johnson, 1993). Population surveys and research reports
document that dropping out of school is the result of the
compound impact of many different kinds of problems
(Ekstrom, Goertz, Pollack, & Rock, 1986). Gage (1990)
states that "poverty stands out as the most conspicuous
overall factor" (p. 281).
Students from low socioeconomic family status are much
more likely to drop out of school than their economically
advantaged counterparts. Students from low socioeconomic
status families are often caught in a mismatch between
previous background experiences and those experiences
necessary for success in school. Most schools are designed
to serve the needs of students who come in with a
predisposition for success. Students without such a
predisposition are often labeled as "slow-learners," thus
34
causing further damage to the student's self-image and
increasing the likelihood of failure (Levin, 1992).
Students living in poverty are also more susceptible to the
variations in the quality of schooling (Ekstrom et al.,
1986).
The impact of minority status also has an impact on
students dropping out. As Gage (1990) describes the
situation.
Being African-American or Hispanic, having lower scores on achievement tests, getting low or failing grades, being older than usual for a given grade level, coming from a home where the parents are not high school graduates, becoming a parent as a teenager - all these characteristics are associated with both poverty and dropping out. (p. 281)
Family background has an especially powerful impact on the
creation of at-risk students, particularly if the student
is a minority (Cardenas, 1990) or of low socioeconomic
status (Rumburger, 1983). Levin (1992) emphasizes the
importance of family background when he says at-risk
students are,
... those students who are unlikely to succeed in schools as schools are currently constituted because they do not have the experiences in home, family and community on which school success is based, (p. 1)
A research report by Benjamin (1993) suggests that parental
literacy is directly related to student success in school
and that programs designed to raise parental literacy also
affect student performance. A 1994 study by Azmitia and
35
others suggested that low-income Mexican-American and
European-American families alike demonstrate clear links
between everyday learning experiences at home and parental
aspirations for the child's future and education and the
degree of success the child experiences in school. They
conclude that the parental attitude toward learning is a
key element.
One must be cautious, however, to understand that all
students of a given category are not necessarily at-risk.
According to Levin (1992), we must separate the child from
the label of being at-risk and instead look at the
conditions which contribute to that label. A child cannot
himself or herself be at risk; rather, he or she comes from
at-risk circumstances. To think of the child itself as at-
risk often leads one to believe that certain color, accents
or surnames or certain family backgrounds or socioeconomic
status produces a defective child that needs to be fixed or
remediated. If we recognize that at-risk is by nature a
condition produced by situation and not "color of skin or
poverty level" (p. 2), then we will be more likely to
address the real problem by addressing the situation.
If schools truly reflect society, then one must
consider the conditions that put students at-risk in
society. Hamby (1989) notes that:
36
students don't drop out of school because they do not want to learn. They drop out because they are failing to learn. Everyone wants to learn if the outcome serves a purpose and if the process is more positive than negative, (p. 23)
According to Hahn (1987), students cite multiple reasons
for dropping out of school. Poor grades, dislike for
school, alienation from peers, marriage or pregnancy and
employment are all primary factors students list as causes
for dropping out, but the most common and important reason
given is poor academic performance. Over 42% of high
school dropouts had grades mostly of "D" or below. Only
13% of males and only 8% of females reported that they had
to drop out to work and support a family. Only one-third
of students, according to Hahn (1987) blame themselves for
dropping out. One-third faulted the schools, and one-third
cited other factors beyond their control for dropping out.
It is apparent that there are diverse reasons for
dropping out, a factor which only adds to the problem of
finding a solution. The challenge is to provide at-risk
adolescents with school experiences that are meaningful and
more positive than negative and to reach early those who
are in danger of being at-risk and dropping out.
Therefore, intervention programs for both high schools and
junior high schools are needed.
37

Given the backgrounds and problems that students bring
to school with them, many are unable to function in
traditional settings. Research has established that school
climate and self-esteem contribute to students' dropping
out, particularly when there is a traditional emphasis on
rules, policies and regulations. Students with other
pressures (personal, economic, and educational) often
cannot cope with such structure (McDill, Natriello, &
Pallas, 1987) . Research findings also indicate that many
teachers treat low achieving students differently than high
achieving students, particularly in the areas of:
(1) questioning and participation patterns, (2) kind and
amount of feedback, (3) expectations regarding amount and
quality of work, and (4) proxemic interaction (Kerman,
Kimball, & Martin, 1980; Good, 1981).
In general, many students come to school with a
predisposition for failure, especially if socioeconomic,
parental background, and traditional school structure are
considered. In spite of the predisposition for failure,
however, it is critical to note, as Good (1981) states with
regard to a study of differences between low-achieving and
high-achieving students that, "... the instructor could
reduce differences between the two classes when he chose to
do so" (p. 420). This would indicate that the variables in
38
teacher treatment of students earlier cited could be
manipulated if a teacher were aware of them and had
appropriate training. Through such manipulation of
variables, it is possible that success and achievement of
at-risk students might be increased.
The lack of appropriate instructional technology,
curriculum materials, instructional programs, and trained
faculty and staff are often contributing factors in the
failure of traditional schools to reach at-risk students
and prevent dropouts. In fact, students often cite the
"hassles" (Good, 1981, p. 420) they receive at school as
one of the primary reasons for dropping out. When these
students fail and drop out of the school program, they are
not prepared to enter the work force because they are
usually several grade levels behind and have poor academic
skills, especially in the basic areas of reading, writing,
and math (Good, 1981) .
Throughout the United States, alternative schools have
attempted to address the problem. Some have met with
success. In New York City's alternative school program,
records indicate a 40% increase in the attendance rate of
at-risk youth and a 60% gain in credits toward graduation
when students enrolled in an alternative school. Still,
however, 25% of students enrolled in these schools dropped
39
out (Hahn, 1987). It is suggested that many of these
projects failed to recognize the need for increased student
motivation and positive self-image. In the case of New
York, the most successful of the alternative schools were
those who stressed high success in academics and adaptation
of the learning environment to meet the needs of students
in addition to intensive personal counseling and a staff
made up of caring adults. While the alternative school
concept shows promise, less than 2% of the nation's student
population is enrolled in such a program (Hahn, 1987) .
Clearly more research is needed, and successful programs
need to be replicated.
In Ekstrom et al.'s 1986 study, they concluded that no
single approach to an at-risk program would be effective in
a diverse population. They suggested that a successful
model would contain three major components:
1. A program must help pregnant teenagers remain in school.
2 . A program must help youth with economic needs and combine work and education.
3 . A program should be directed toward students who perform poorly because they are dissatisfied with school environment, (p. 371)
Wells (1987), after reviewing the professional
literature on school dropouts, concludes that prevention
programs should include the following components:
40
1. Separation of potential dropouts from other
students
2. Inclusion of a strong vocational component
3. Use of out of class instruction
4. Intensive counseling
It is possible to design and develop such programs
that can be effective interventions for short-and-long term
learning of at-risk students (Pogrow, 1990). The design of
such programs should recognize that:
1. At-risk students have tremendous levels of academic potential.
2. The fundamental learning problem is that at-risk students do not seem to understand "understanding."
3 . It is possible to change dramatically the relationships between teachers and students.
4. The fundamental learning problem can be eliminated if enough time and enough resources are made available.
5. Intensive, consistent exposure to conversation that engages students in key techniques to develop thinking, ... can significantly enhance the learning of all content by at-risk students. (Pogrow, 1990, pp. 391-393)
The preponderance of evidence suggests that an
intervention program designed around these research based
principles should impact the student dropout rate. Any
such program must have one primary tenet at its heart--it
must adapt to meet the needs of students. Levin (1992)
admonishes educators to remember this point when he says.
How do we think of these children? Research tells us that at birth these children have the same need for
41
love and affection, the same developing curiosity, the same physiological requirements and so on as children who are not in at-risk situations. How should we think of them? We had best think of them as children like all children. They have the needs of children, and that's where we have to begin, (p. 2)
The question then is whether or not a school
specifically designed to address the complexity of the at-
risk/dropout phenomenon can significantly impact the
variables of attendance rate, dropout rate, and TAAS
mastery.
42
CHAPTER III
PROCEDURES FOR COLLECTING DATA
Subjects
A total of one hundred and forty-two Hispanic subjects
were chosen from a group of students enrolled in any of the
eight school districts who participated in CAP High School.
Hispanic students were selected for this study because:
1. Hispanic students have the highest dropout rate of any
identifiable group in Texas (Cardenas, 1990).
2 . The predominate minority group of the participating
schools is Hispanic.
3. The predominate minority group present at CAP is
Hispanic.
4. The dropout rate for Hispanics in Texas has continued
to rise over the period of this study (Johnson, 1993) .
5. Any effect on this group would be generalizable to
other populations.
The eight districts represent a large section of rural
Central West Texas, and the predominate minority group for
each district is Hispanic. The districts range from
approximately 3 8% to 60% of students considered to come
from low socioeconomic families. The schools range in size
from small lA status of approximately 120 students to small
43

3AAA status with approximately 380 students. Prior to the
establishment of the Cooperative Alternative Program, none
of the schools had an organized at-risk program designed to
address the extremely complex profile of at-risk students.
Groups within the sample are described later. Subjects met
any one of the following qualifying characteristics of an
at-risk student and were officially designated by school
records as "Of Hispanic Origin."
1. Students who are two or more years behind in three
or more academic subjects as determined by grade
placement or standardized test scores.
2. Students who have been suspended or expelled from
the regular program due to behavioral misconduct.
3. Students who are pregnant or are already parents.
4. Students with substantial inability to maintain
normal social relationships as determined by the
school's counselor.
5. Students with excessive unexcused absences and are
subject to loss of academic credit.
6. Students who have left school without receiving a
diploma.
All subjects were at least fourteen years of age prior to
September 1, 1988. Each was eligible for CAP enrollment
44
during the period of time from September 1, 1988 to June 1,
1994.
Research Design
Two groups of subjects were identified: eligible
subjects participating in CAP and eligible subjects not
participating in CAP with the latter being considered
candidates for the control group. A total of 71 eligible
Hispanic students from the time parameters set who did not
participate in CAP were located. One hundred ninety-seven
eligible Hispanic students from the time parameters set who
did participate in CAP were located. In an effort to
create as large a sample size as possible, all 71 of the
nonparticipants were used. A matching number of CAP
participants was selected from the total pool of 187 by use
of a random table of numbers. Evidence to support or deny
the existence of a causal-comparative relationship between
CAP enrollment and the dependent variables was determined
by means of a chi-square analysis.
In this study, a chi-square analysis was the most
appropriate measure. The data gathered in the study was
nominal data. It was grouped into discrete and exclusive
categories and frequency counts of occurrence for each
category were made. Pogano (1986) states, "The inference
45
test most often used with nominal data is a nonparametric
test called 'chi-square'" (p. 376). Fraenkel and Wallen
(1990) also state that the chi-square test is the most
appropriate means with which to analyze categorical data
and determine if considerable difference between expected
and obtained frequencies exist. Once the chi-square values
and degrees of freedom were calculated for each variable,
the significance level was determined for each chi-square
value by means of a chi-square table (Fraenkel & Wallen,
1990, p. 471). For purpose of this study the three
dependent variables were defined as follows:
1. Dropout Rate--The number of students who completed
a high school diploma or G.E.D., remained in
school, or moved and enrolled in another district
compared to those who did not for the time period
of September 1, 1988 through June 1, 1994.
2. TAAS Mastery--The number of students who passed
the reading, writing, and math sections of the
Texas Assessment of Academic Skills or the Texas
Educational Assessment of minimal skills
simultaneously on the first attempt after
enrollment at CAP or their home campus compared to
those who failed one or more sections on their
first attempt at CAP or their home campus.
46
3. Attendance Rate--The number of students who
exceeded the State of Texas maximum number of
absences (10% of the number of days in a semester)
for any one semester while enrolled in high school
compared to those who did not exceed the maximum
number of allowable absences.
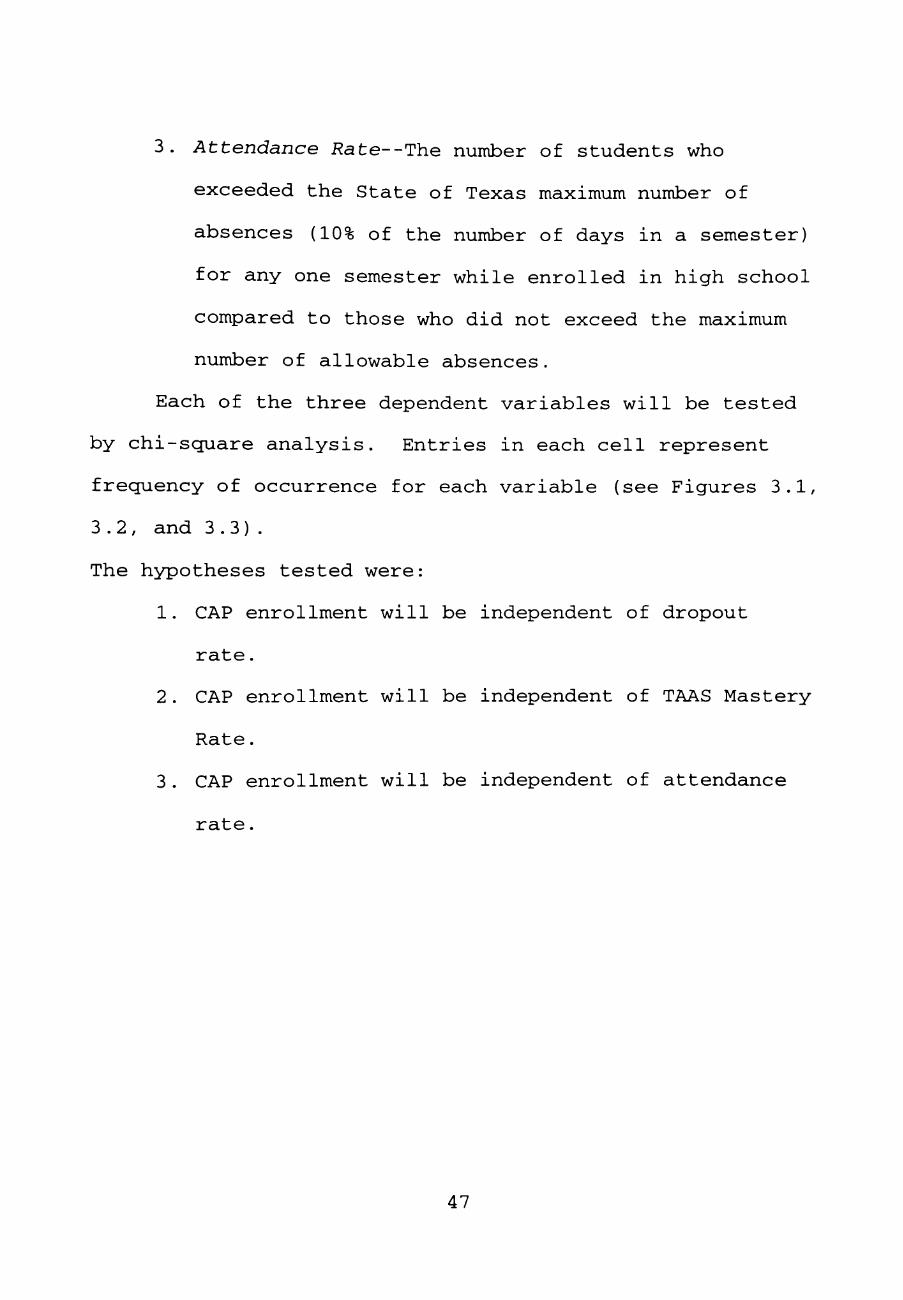
Each of the three dependent variables will be tested
by chi-square analysis. Entries in each cell represent
frequency of occurrence for each variable (see Figures 3.1,
3.2, and 3.3),
The hypotheses tested were:
1. CAP enrollment will be independent of dropout
rate.
2 . CAP enrollment will be independent of TAAS Mastery
Rate.
3 . CAP enrollment will be independent of attendance
rate.
47
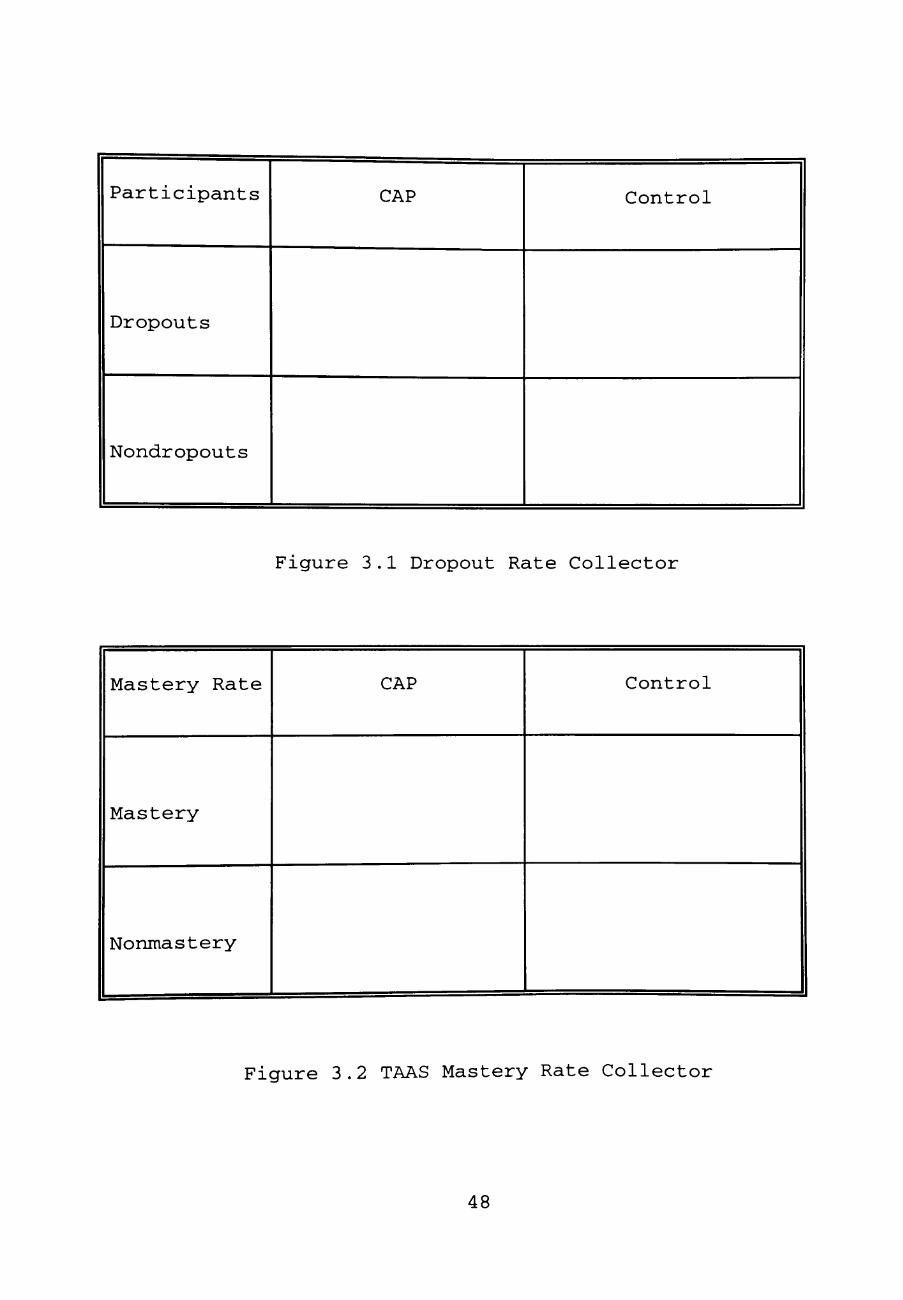
Participants
Dropouts
Nondropouts
CAP Control
Figure 3.1 Dropout Rate Collector
Mastery Rate
Mastery
Nonmastery
CAP Control
Figure 3.2 TAAS Mastery Rate Collector
48
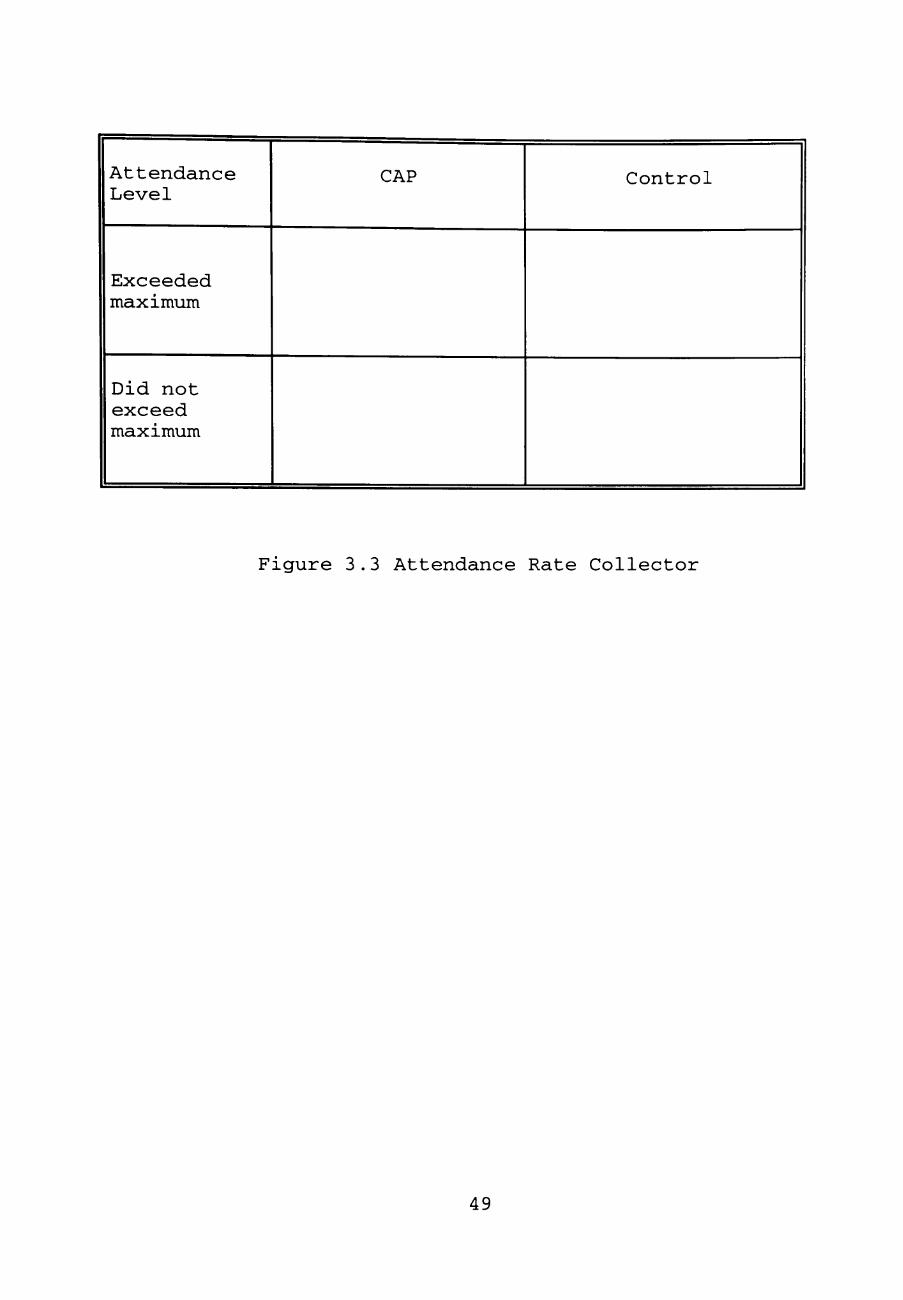
Attendance Level
Exceeded maximum
Did not exceed maximum
CAP Control
Figure 3.3 Attendance Rate Collector
49
CHAPTER IV
PRESENTATION OF DATA AND THE ANALYSIS
OF THE RESULTS
As described in Chapter III, each hypothesis was
tested by means of a chi-square analysis of the frequency
of occurrence for each variable. The analysis of each is
presented and discussed individually. The relationship to
the literature is also discussed for each.
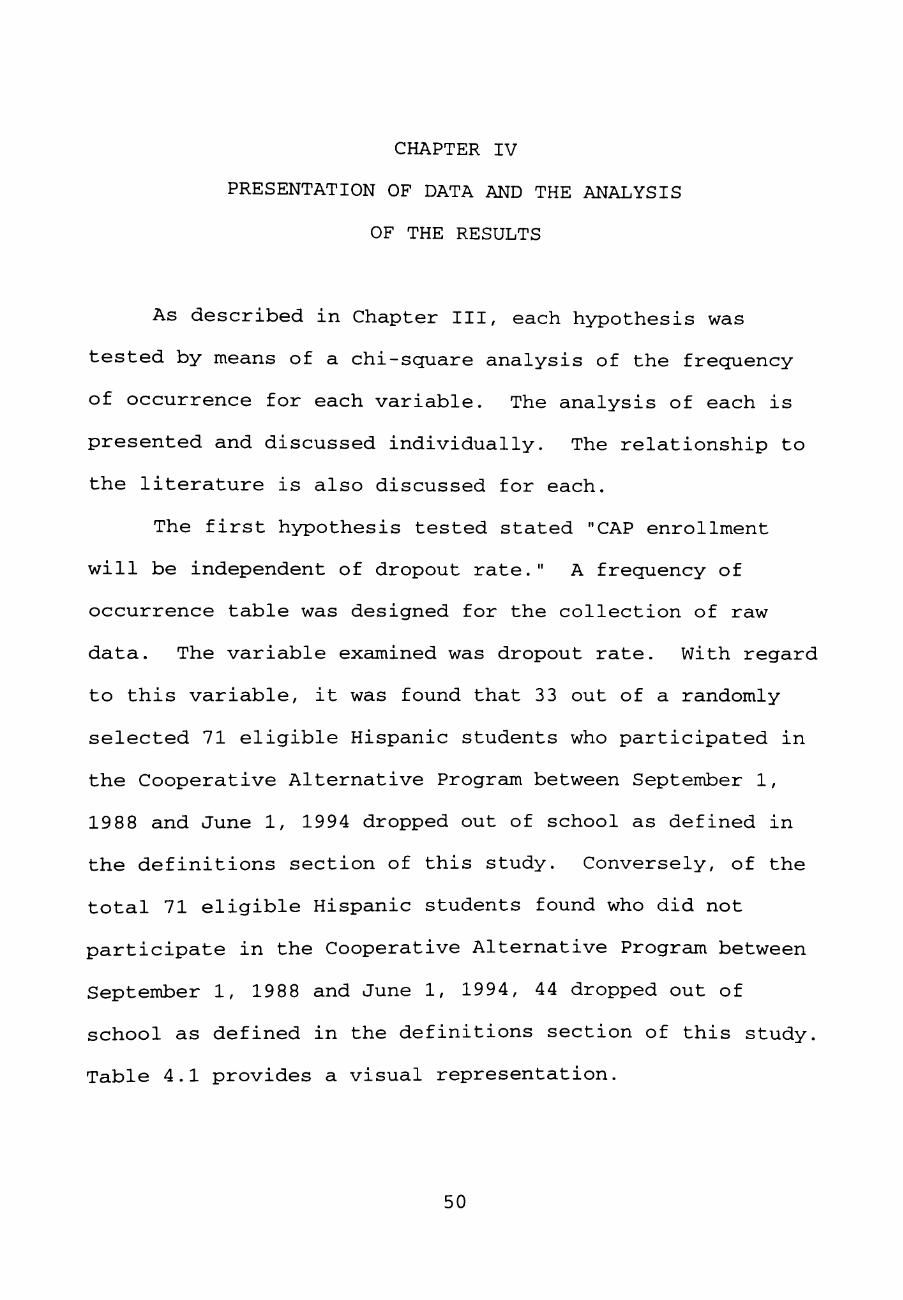
The first hypothesis tested stated "CAP enrollment
will be independent of dropout rate." A frequency of
occurrence table was designed for the collection of raw
data. The variable examined was dropout rate. With regard
to this variable, it was found that 33 out of a randomly
selected 71 eligible Hispanic students who participated in
the Cooperative Alternative Program between September 1,
19 88 and June 1, 1994 dropped out of school as defined in
the definitions section of this study. Conversely, of the
total 71 eligible Hispanic students found who did not
participate in the Cooperative Alternative Program between
September 1, 1988 and June 1, 1994, 44 dropped out of
school as defined in the definitions section of this study.
Table 4.1 provides a visual representation.
50
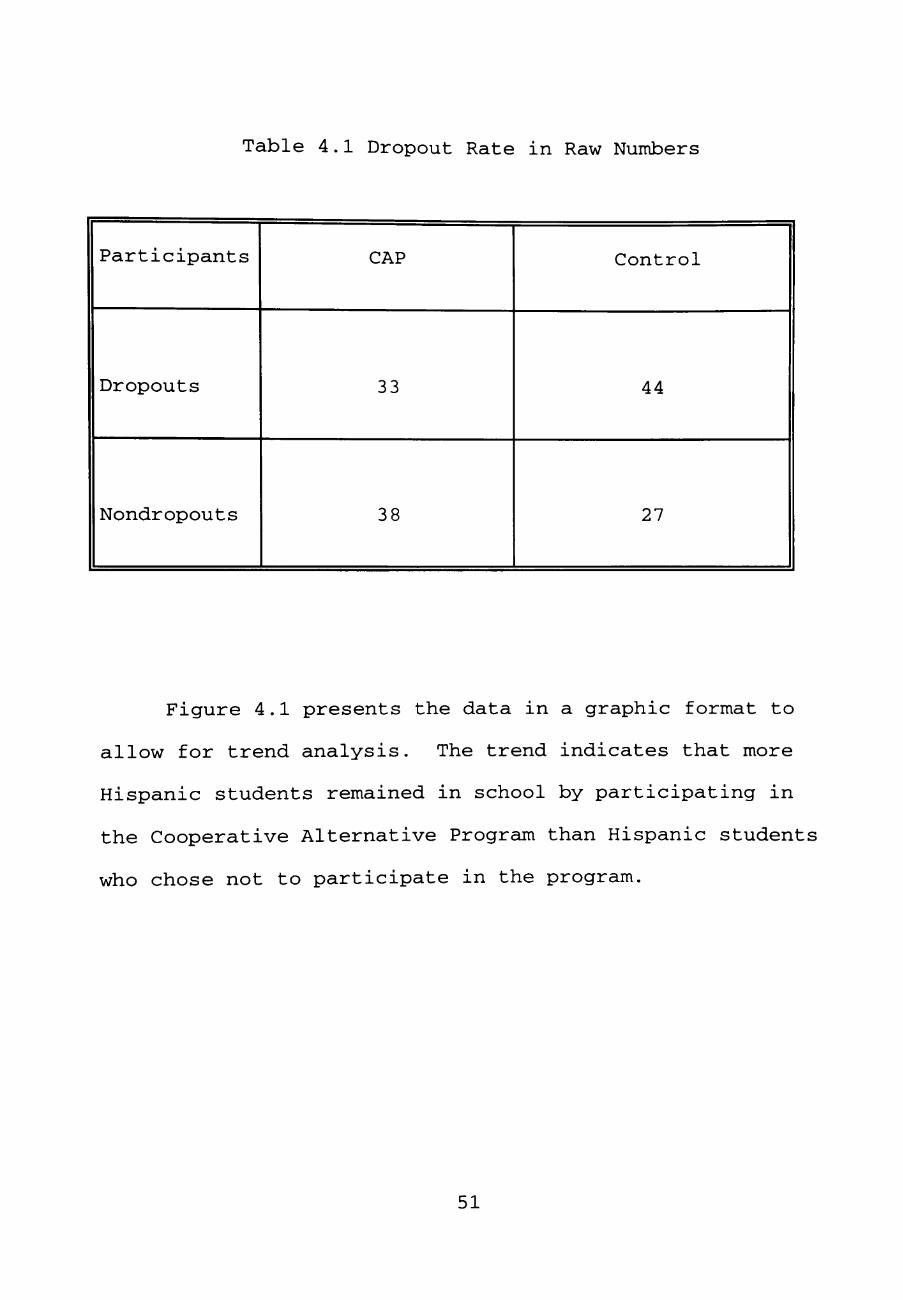
Table 4.1 Dropout Rate in Raw Numbers
Participants
Dropouts
Nondropouts
CAP
33
38
Control
44
27
Figure 4.1 presents the data in a graphic format to
allow for trend analysis. The trend indicates that more
Hispanic students remained in school by participating in
the Cooperative Alternative Program than Hispanic students
who chose not to participate in the program.
51
100
w E-" D O CU
o p
O
w pq
CAP CONTROL
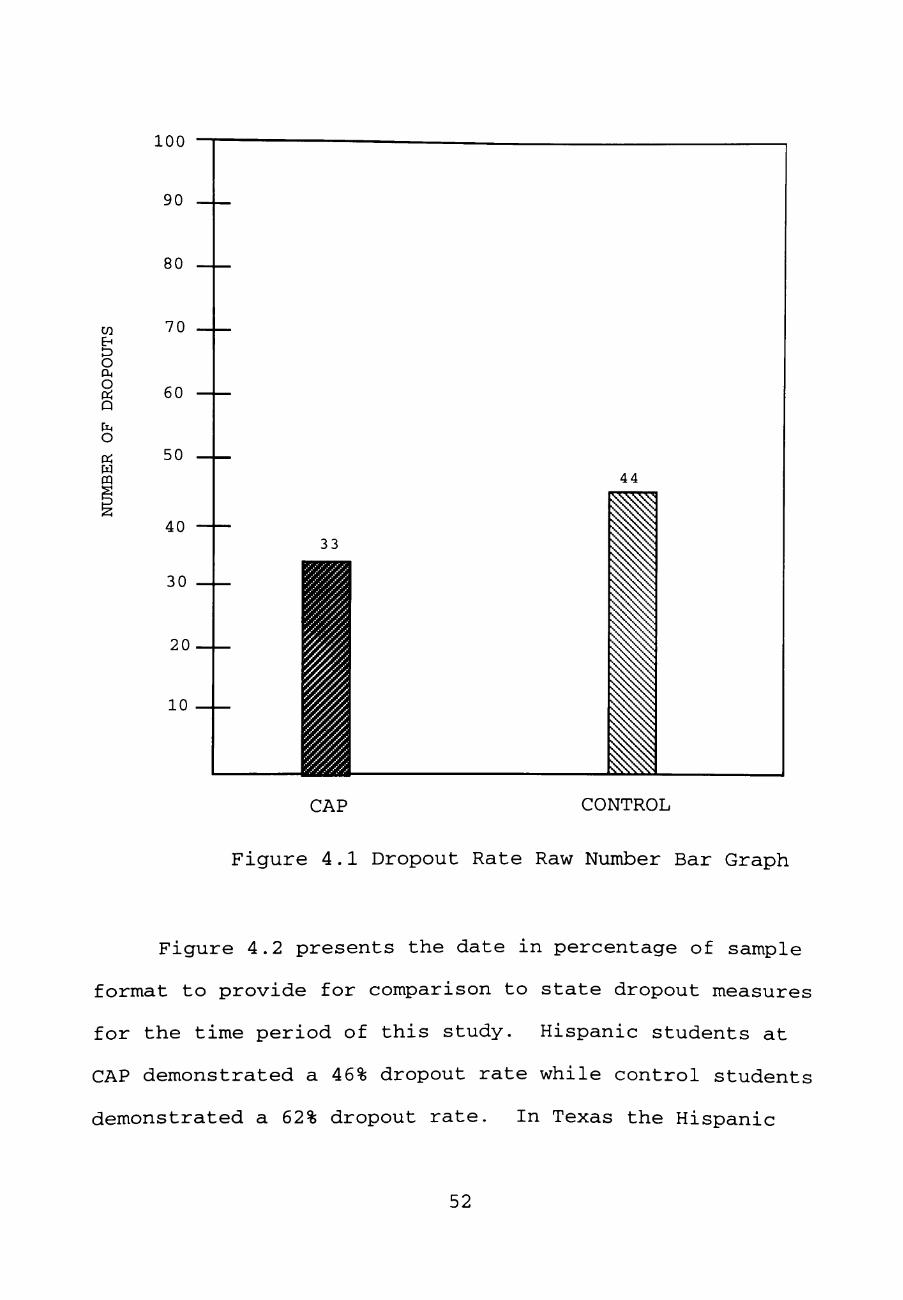
Figure 4.1 Dropout Rate Raw Number Bar Graph
Figure 4.2 presents the date in percentage of sample
format to provide for comparison to state dropout measures
for the time period of this study. Hispanic students at
CAP demonstrated a 46% dropout rate while control students
demonstrated a 62% dropout rate. In Texas the Hispanic
52
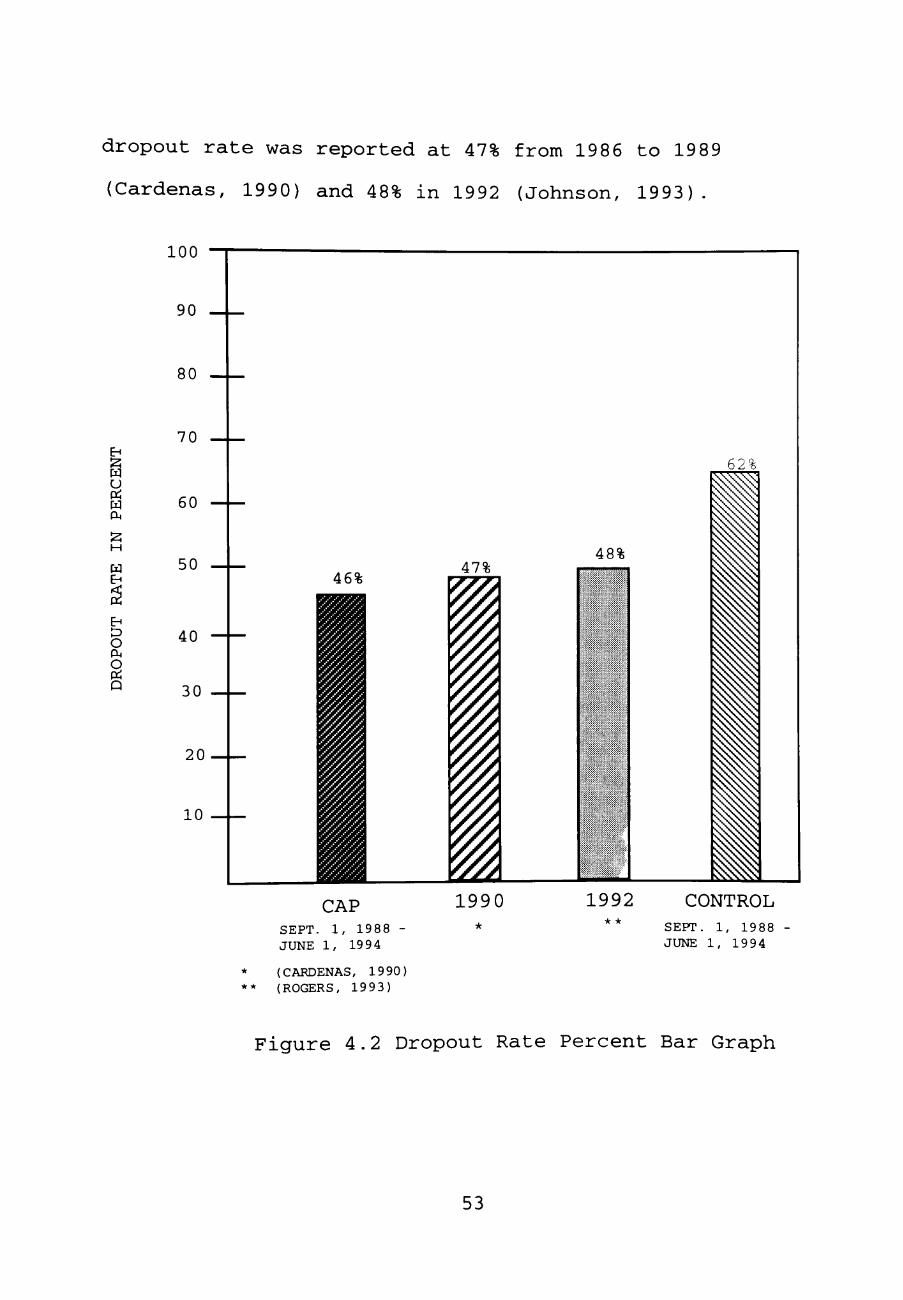
dropout rate was reported at 47% from 1986 to 1989
(Cardenas, 1990) and 48% in 1992 (Johnson, 1993).
W U rt w cu
EH
D O Pu O rt Q
100
*
* *
CAP SEPT. 1 , 1988 -JUNE 1 , 1994
(CARDENAS, 1990) (ROGERS, 1993)
1990 *
1992 • •
CONTROL SEPT. 1 , 1988 JUNE 1 , 1994
Figure 4.2 Dropout Rate Percent Bar Graph
53
The statistical chi-square analysis of the dropout
rate variable determined a chi-square value of 3.43 with 1
degree of freedom. When analyzed with a chi-square
distribution table (Fraenkel & Wallen, 1990, p. 471), it is
noted that the minimum chi-square value needed to infer
statistical significance at a level of .05 is 3.84. The
chi-square value calculated for the Dropout Rate variable
falls short of the statistically significant level;
therefore, the stated hypothesis is not upheld and CAP
enrollment cannot be considered statistically independent
of Dropout Rate.
It should be noted that while statistical significance
is not ascribed to this variable, a trend may be present as
evidenced by comparison to dropout percentages (see Figure
4.2) between CAP and Control Groups and the State of Texas
for the prescribed time period show CAP to have the lowest
percentage of dropouts.
The second hypothesis tested stated "CAP enrollment
will be independent of TAAS Mastery Rate." A frequency of
occurrence table was designed for collection of raw data.
The variable examined was TAAS Mastery Rate. With regard
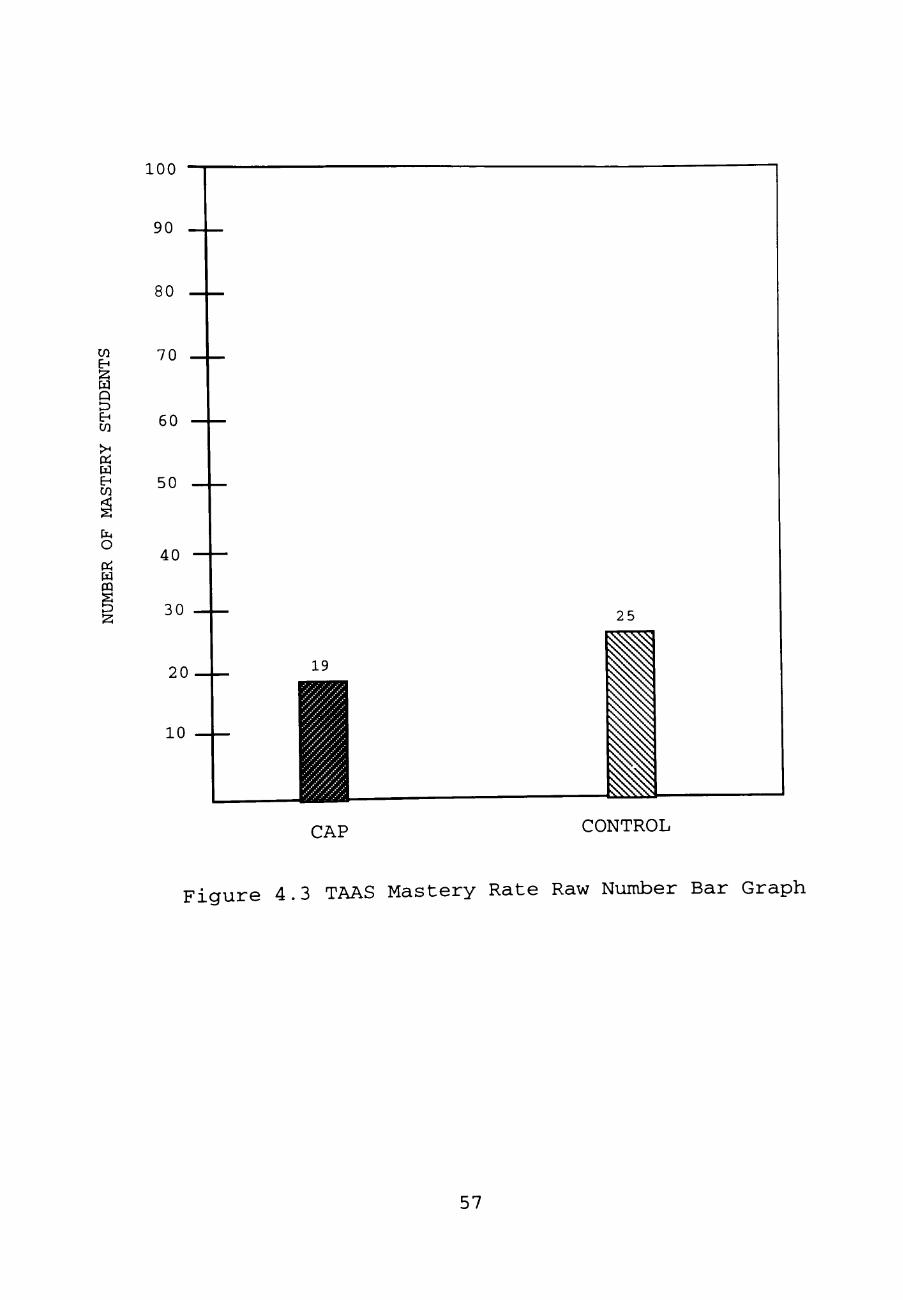
to this variable, it was found that 19 out of a randomly
selected 71 eligible Hispanic students who participated in
the Cooperative Alternative Program between September 1,
54
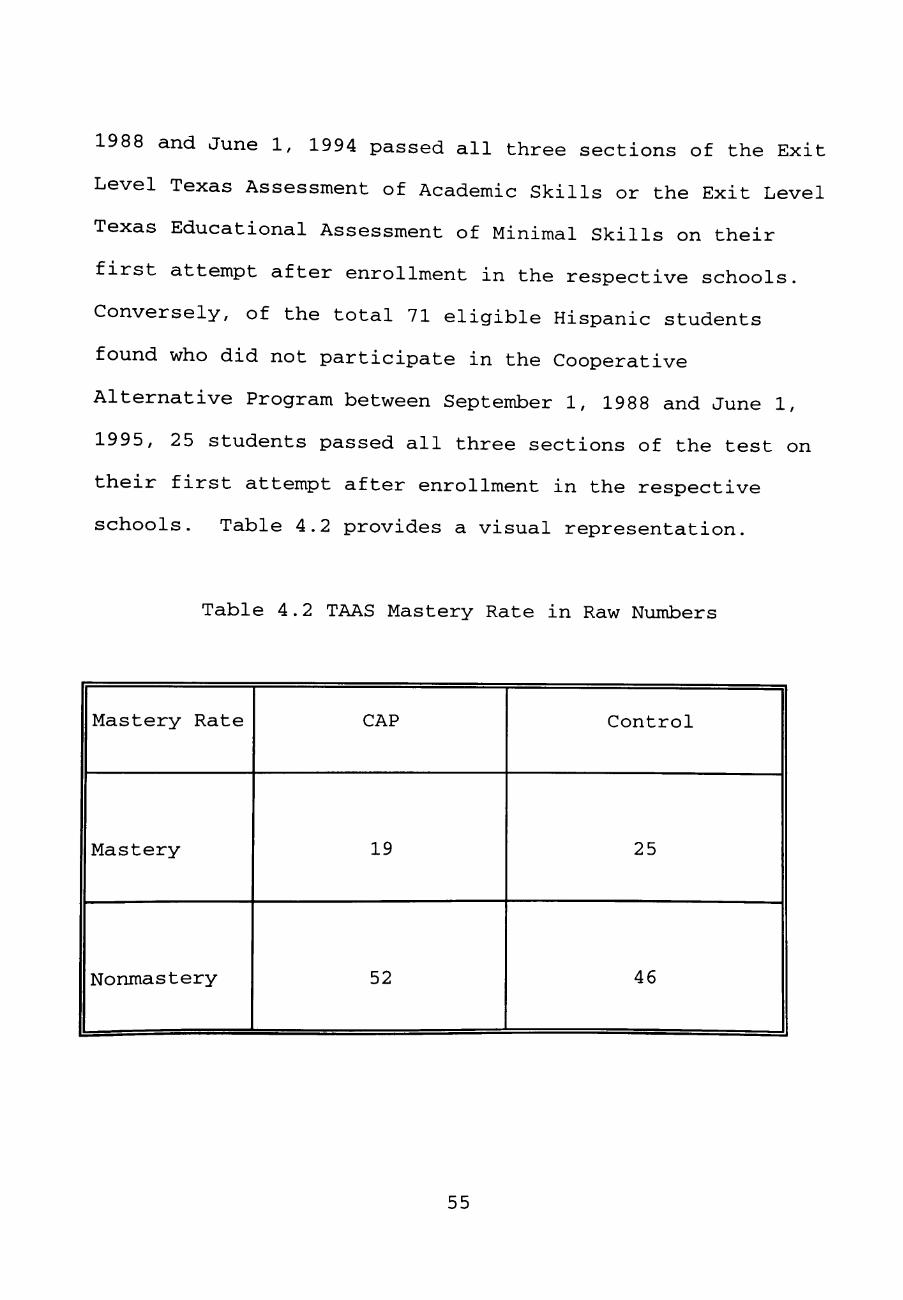
1988 and June 1, 1994 passed all three sections of the Exit
Level Texas Assessment of Academic Skills or the Exit Level
Texas Educational Assessment of Minimal Skills on their
first attempt after enrollment in the respective schools.
Conversely, of the total 71 eligible Hispanic students
found who did not participate in the Cooperative
Alternative Program between September 1, 1988 and June 1,
1995, 25 students passed all three sections of the test on
their first attempt after enrollment in the respective
schools. Table 4.2 provides a visual representation.
Table 4.2 TAAS Mastery Rate in Raw Numbers
Mastery Rate
Mastery
Nonmastery
CAP
19
52
Control
25
46
55
Figure 4.3 presents the data in a graphic format to
allow for trend analysis. The trend indicates that fewer
eligible Hispanic students passed all three sections of the
test on the first attempt after enrollment in the
Cooperative Alternative Program than eligible Hispanic
students who remained in their home schools.
The statistical chi-square analysis of the TAAS
Mastery Rate variable determined a chi-square value of
1.186 with 1 degree of freedom. When analyzed with a chi-
square distribution table (Fraenkel & Wallen, 1990, p.
471), it was noted that the minimum chi-square value needed
to infer statistical significance at a level of .05 is
3.84. The chi-square value calculated for the TAAS Mastery
Rate variable falls short of the statistically significant
level; therefore, the stated hypothesis is not upheld and
CAP enrollment cannot be considered statistically
independent of TAAS Mastery Rate.
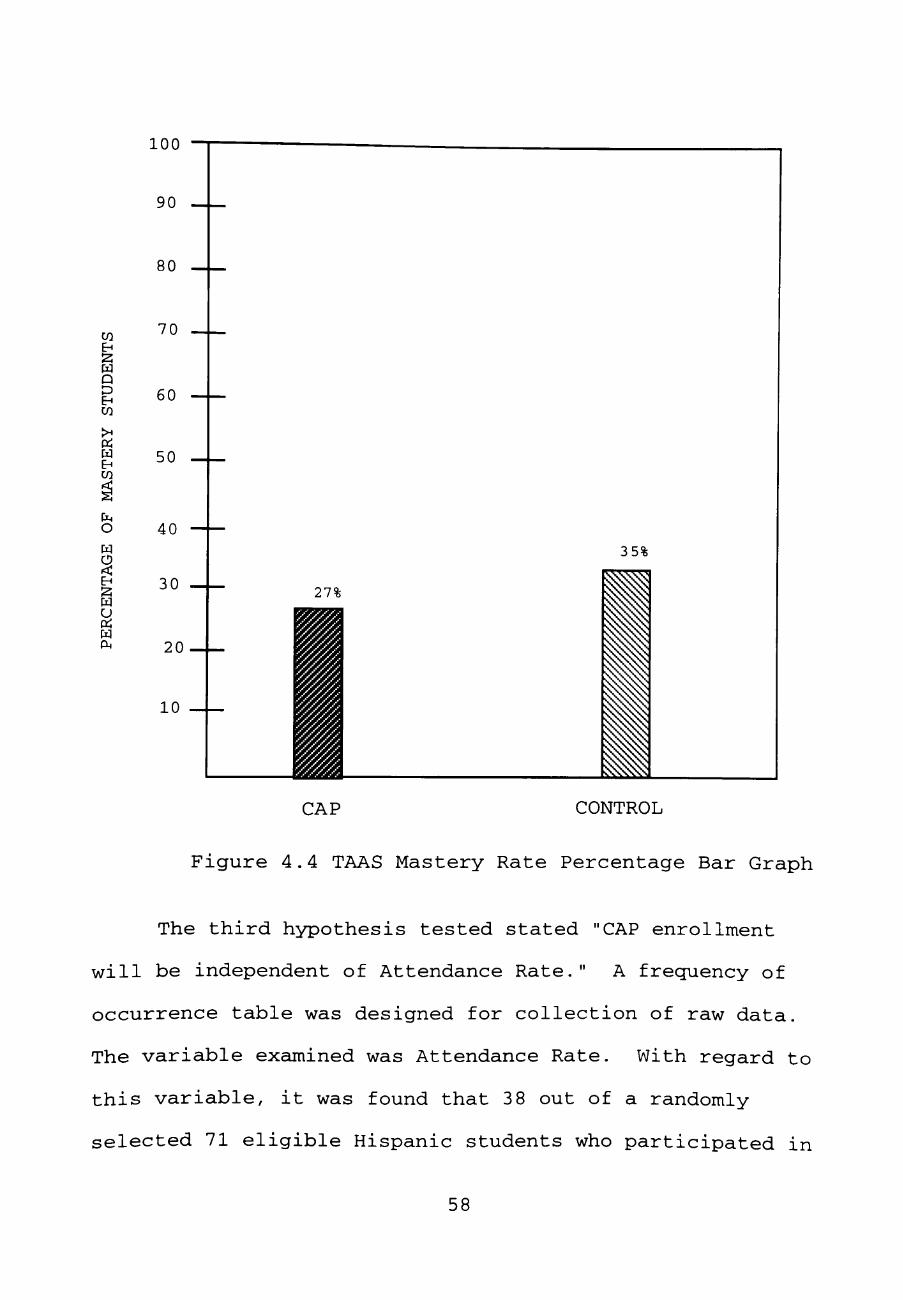
It should be noted while statistical significance was
not ascribed to this variable, the percentage of students
participating in the Cooperative Alternative Program was
within eight points of the Control Group. CAP students
held a 27% TAAS Mastery Rate while the Control Group
demonstrated a 35% TAAS Mastery Rate (Figure 4.4).
56
100
EH
w Q
EH
>H Pi W EH W
O
W PQ
CAP CONTROL
Figure 4.3 TAAS Mastery Rate Raw Number Bar Graph
57
100
CO E H
W Q D E H CO
Pi w CO
o w
E H
W U rt w rt
CAP CONTROL
Figure 4.4 TAAS Mastery Rate Percentage Bar Graph
The third hypothesis tested stated "CAP enrollment
will be independent of Attendance Rate." A frequency of
occurrence table was designed for collection of raw data.
The variable examined was Attendance Rate. With regard to
this variable, it was found that 3 8 out of a randomly
selected 71 eligible Hispanic students who participated in
58
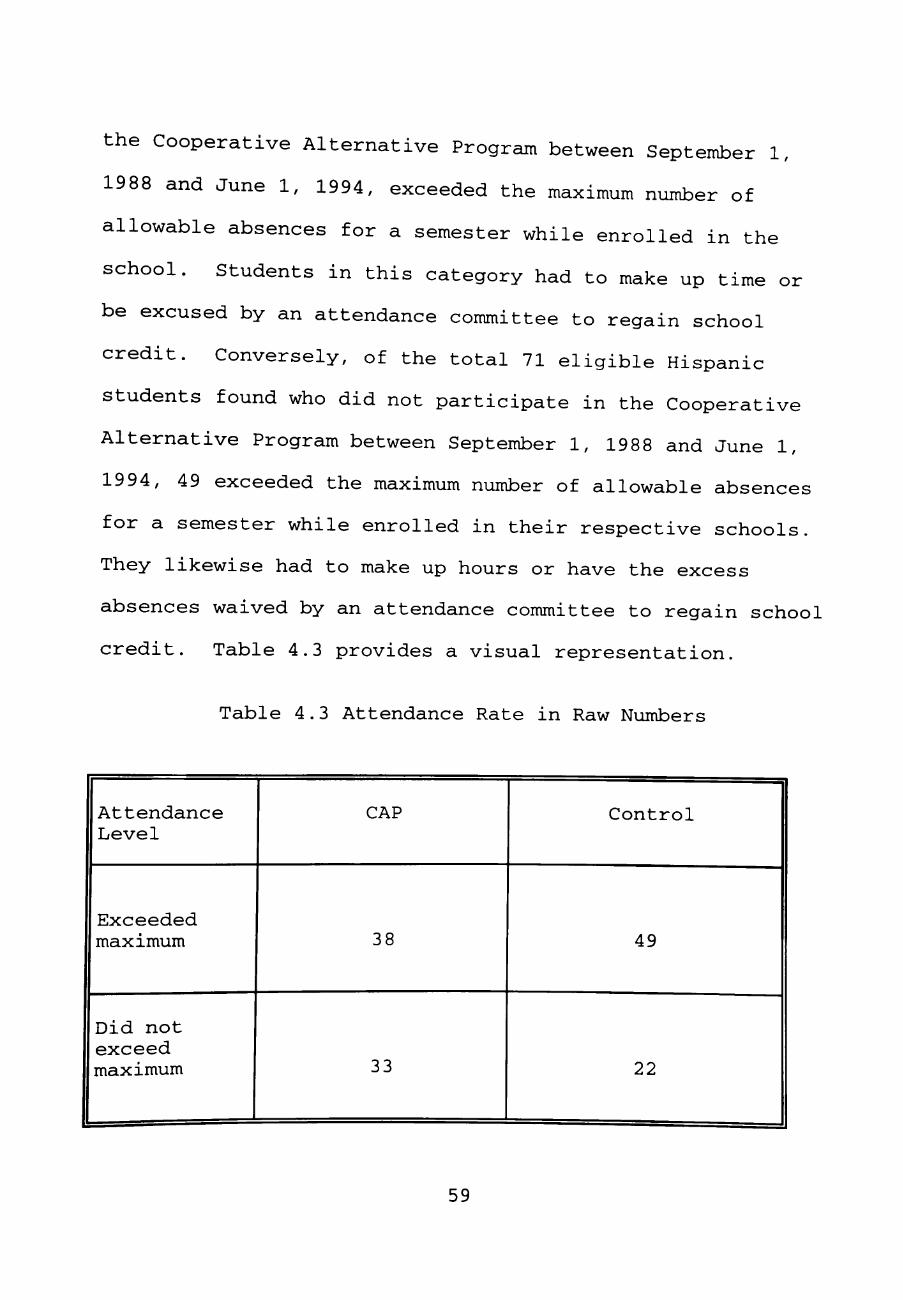
the Cooperative Alternative Program between September 1,
1988 and June 1, 1994, exceeded the maximum number of
allowable absences for a semester while enrolled in the
school. Students in this category had to make up time or
be excused by an attendance committee to regain school
credit. Conversely, of the total 71 eligible Hispanic
students found who did not participate in the Cooperative
Alternative Program between September 1, 1988 and June 1,
1994, 49 exceeded the maximum number of allowable absences
for a semester while enrolled in their respective schools.
They likewise had to make up hours or have the excess
absences waived by an attendance committee to regain school
credit. Table 4.3 provides a visual representation.
Table 4.3 Attendance Rate in Raw Numbers
Attendance Level
CAP Control
Exceeded maximum 38 49
Did not exceed maximum 33 22
59
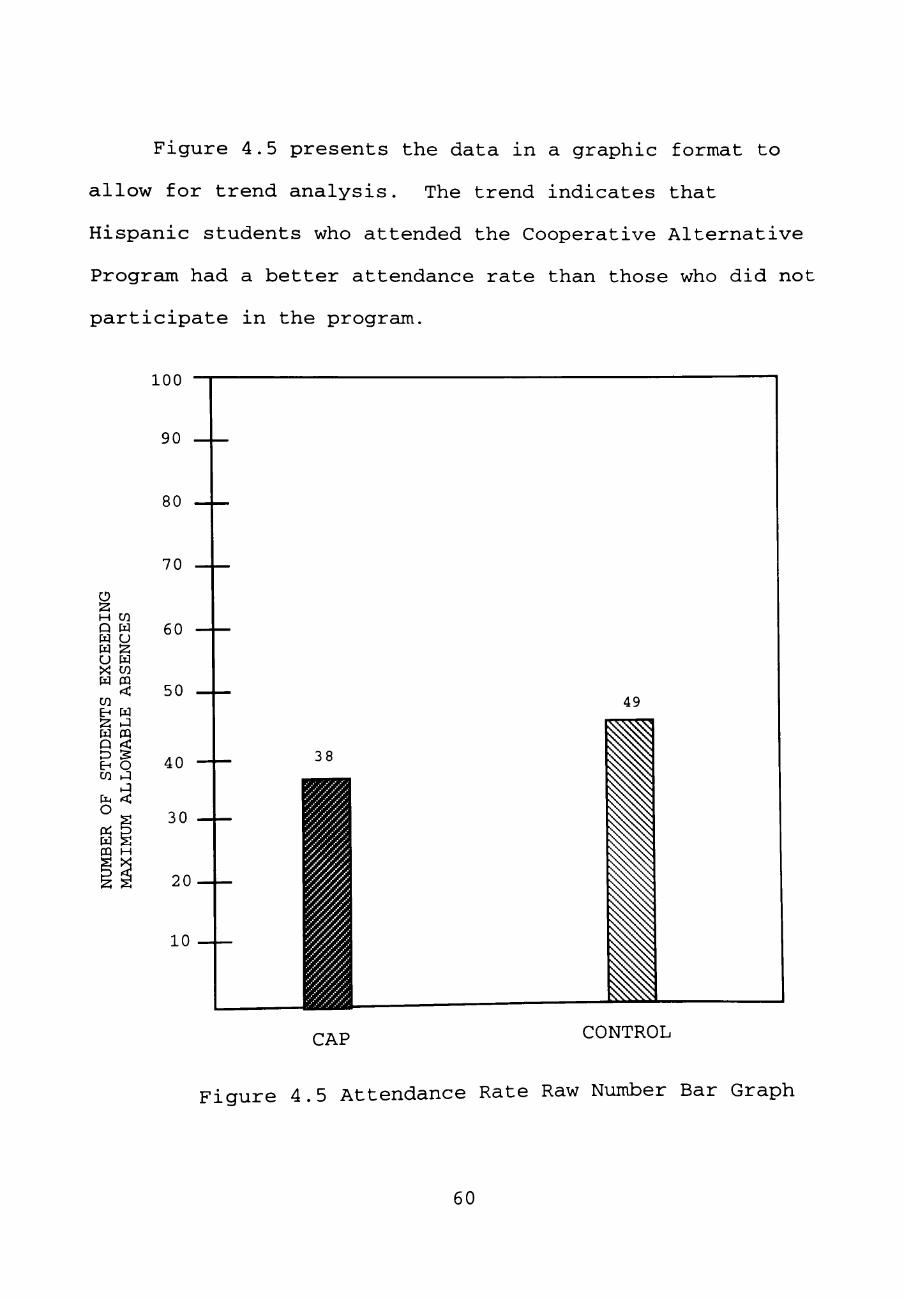
Figure 4.5 presents the data in a graphic format to
allow for trend analysis. The trend indicates that
Hispanic students who attended the Cooperative Alternative
Program had a better attendance rate than those who did not
participate in the program.
100
o H CO Q W W CJ W S u w X! CO W CQ
CO b^ w W PQ P < ED S E H O CO
rt O
rt p w s PQ H
CAP CONTROL
Figure 4.5 Attendance Rate Raw Number Bar Graph
60
The statistical chi-square analysis of the Attendance
Rate Variable determined a chi-square value of 3.591 with 1
degree of freedom. When analyzed with a chi-scjuare
distribution table (Fraenkel & Wallen, 1990, p. 471), it
was noted that the minimum chi-square value needed to infer
statistical significance at a level of .05 was 3.84. The
chi-square value calculated for the Attendance Rate
Variable falls short of the statistically significant
level; therefore, the stated hypothesis is not upheld and
CAP enrollment cannot be considered statistically
independent of Attendance Rate.
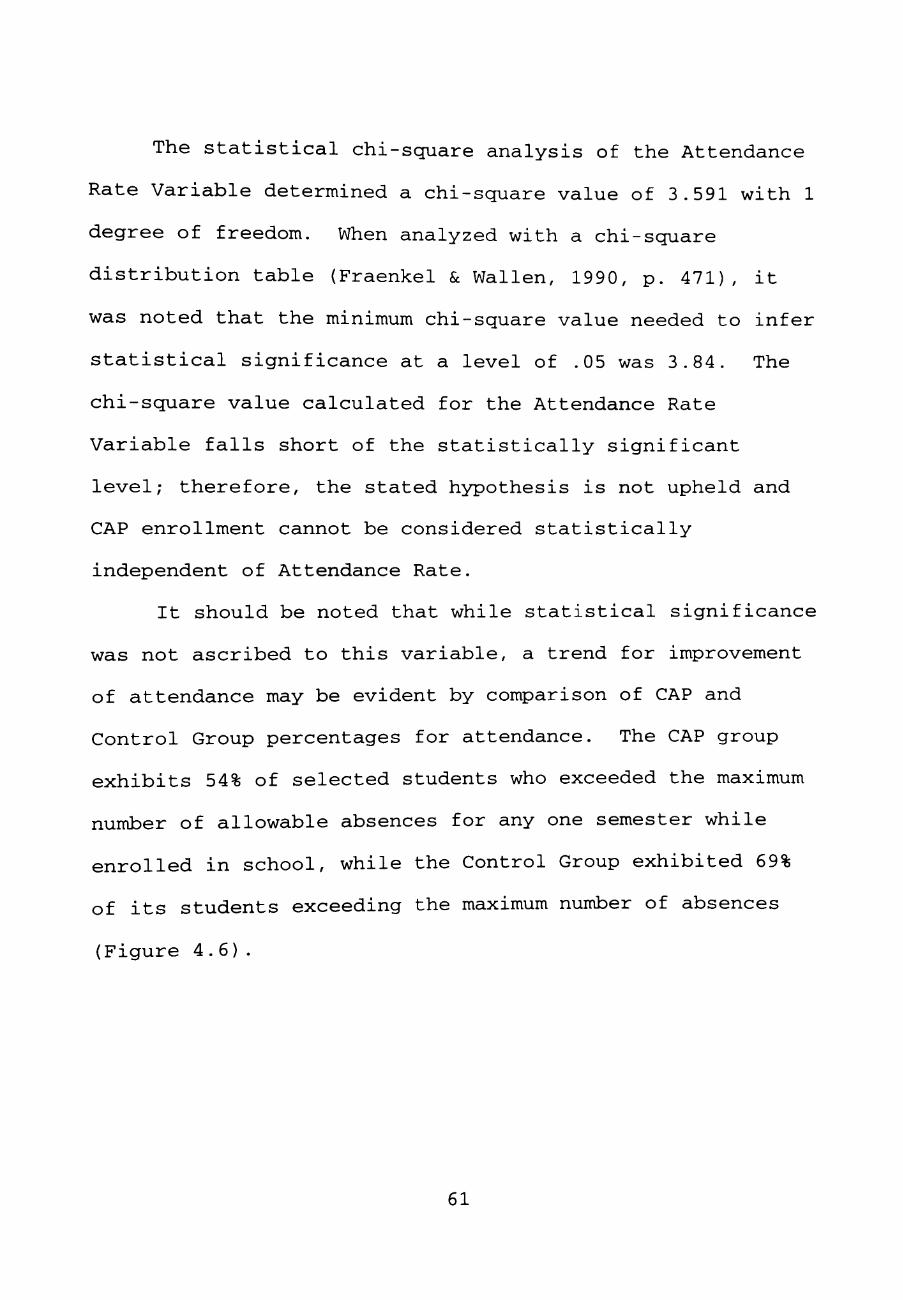
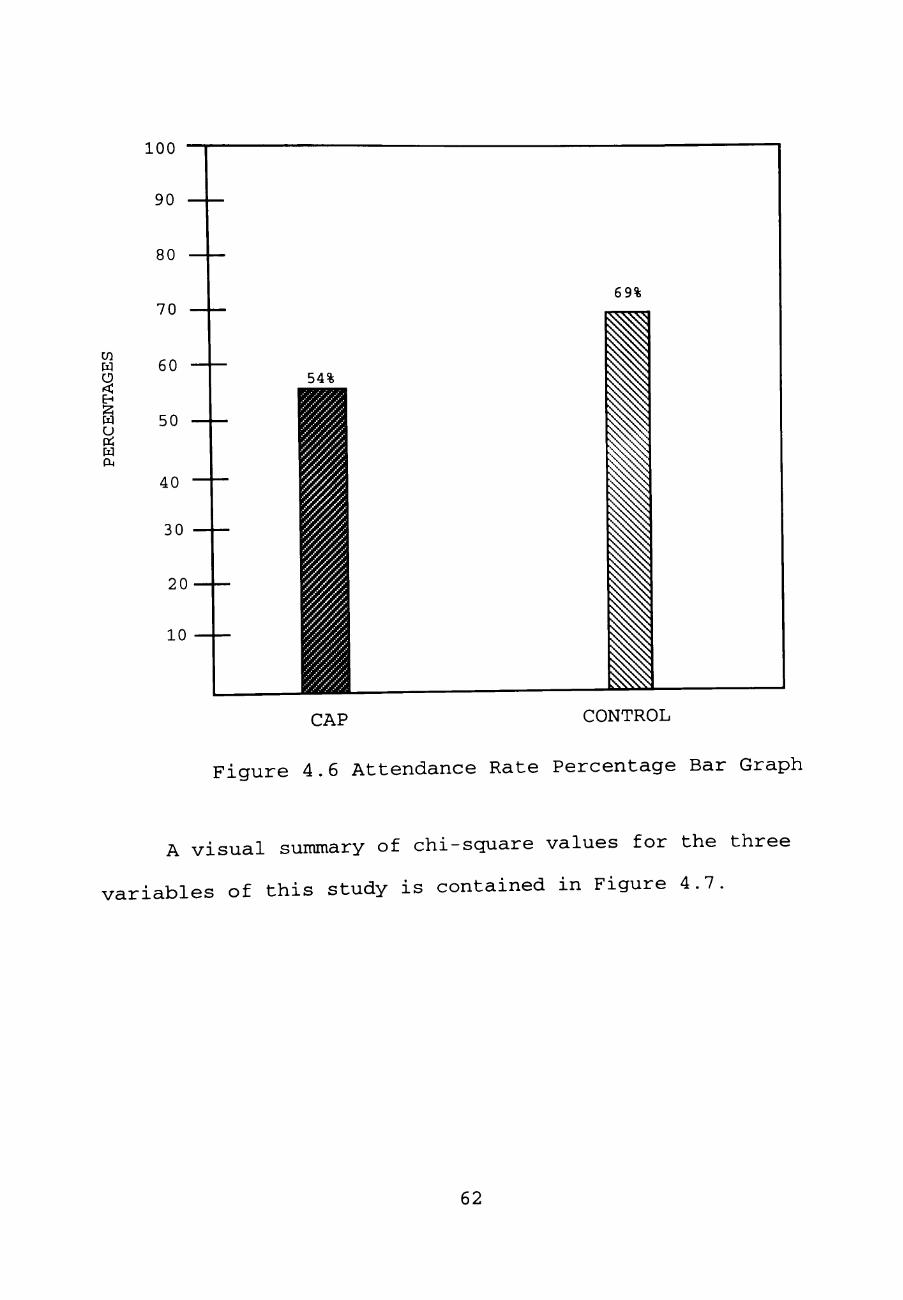
It should be noted that while statistical significance
was not ascribed to this variable, a trend for improvement
of attendance may be evident by comparison of CAP and
Control Group percentages for attendance. The CAP group
exhibits 54% of selected students who exceeded the maximum
number of allowable absences for any one semester while
enrolled in school, while the Control Group exhibited 69%
of its students exceeding the maximum number of absences
(Figure 4.6).
61
CO
w
< EH w u rt H rt
CAP CONTROL
F i g u r e 4 . 6 A t t e n d a n c e R a t e P e r c e n t a g e Ba r G r a p h
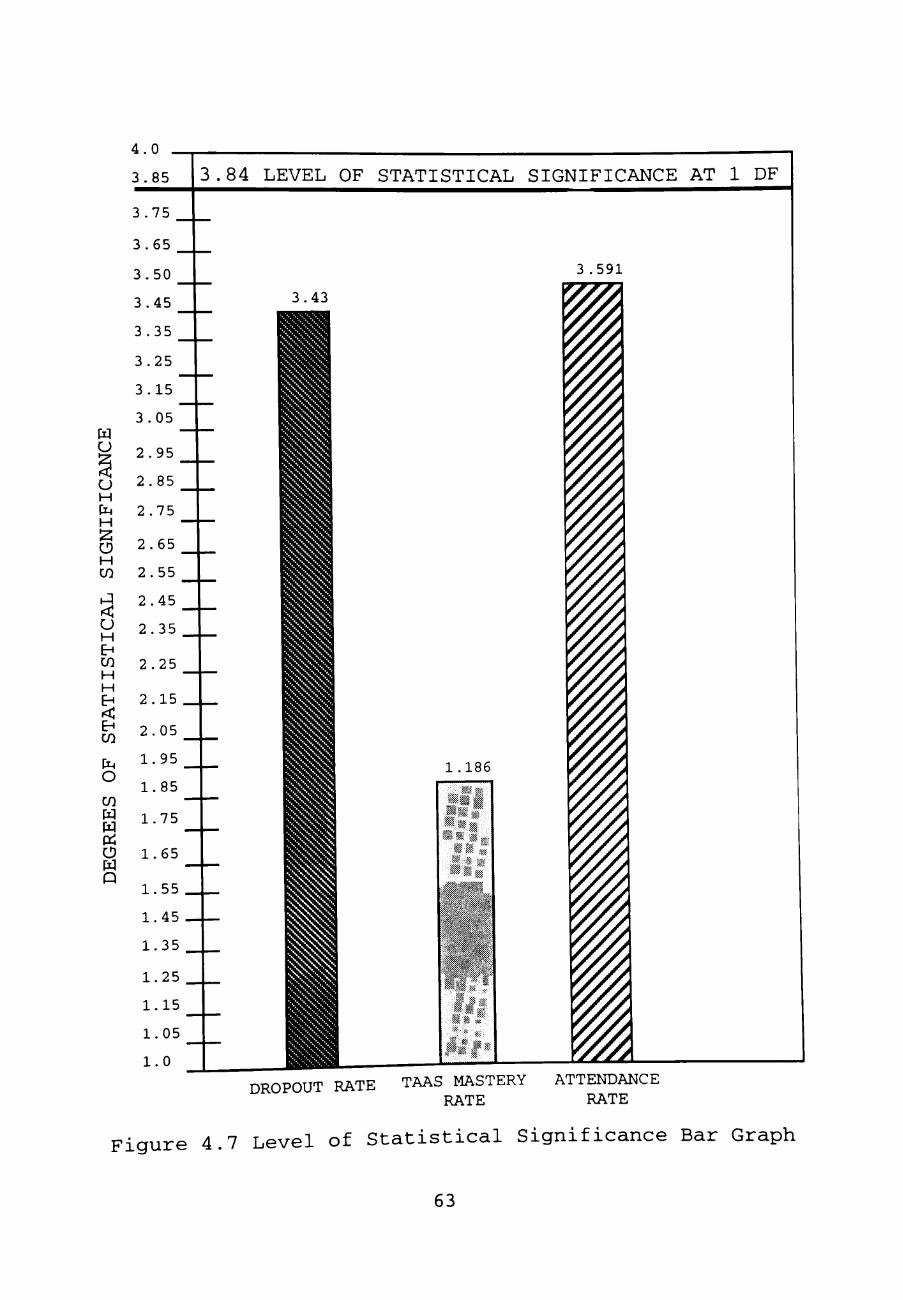
A v i s u a l summary of c h i - s q u a r e v a l u e s f o r t h e t h r e e
v a r i a b l e s of t h i s s t u d y i s c o n t a i n e d i n F i g u r e 4 . 7 .
62
4 . 0 .
3 .85 3 . 8 4 LEVEL OF STATISTICAL SIGNIFICANCE AT 1 DF
U
(J
H
H 12; O H
u H tH CO H H
<
CO
PL, O
CO w w pc: o H Q
3 . 7 5 _
3 . 6 5 _
3 . 5 0 _
3 . 4 5 _
3 . 3 5 _
3 . 2 5
3 . 1 5
3 . 0 5
2 . 9 5 _
2 . 8 5 _
2 . 7 5
2 . 6 5 _
2 . 5 5 _
2 . 4 5 _
2 . 3 5 .
2 .25
2 . 1 5 .
2 . 0 5
1 . 9 5
1 . 8 5
1 . 7 5
1 . 6 5
1 . 5 5
1 . 4 5
1 . 3 5
1 . 2 5
1 . 1 5
1 . 0 5
1 . 0
3.43
1 . 1 8 6
3 . 5 9 1
DROPOUT RATE TAAS MASTERY ATTENDANCE RATE RATE
•igure 4.7 Level of Statistical Significance Bar Graph
63
Results of this study are consistent with the issues
of self image, motivation, task avoidance, teacher
expectations, and comprehensive program design. The
complexity of the at-risk problem among Hispanics is
apparent. The social and family difficulties experienced
as identified in the literature make impact on attendance.
It is reasonable to assume that attendance is related to a
student's ability to pass recjuired exit exams and to
graduate from school. The TAAS Mastery Rate for students
at CAP is low. The literature revealed a trend of low
academic performance for at-risk students. The dropout
rate is still high at CAP and falls short of the school's
own goals. The literature revealed the dropout rate to be
high and still increasing for at-risk Hispanics across
Texas. Much of the literature referred to the aversion of
human beings to return to a difficult task. It suggested
that at-risk students may view school in a negative light
and, therefore, react in accordance with human psychology
and dropout of school or do not attend to avoid what they
perceive to be a negative situation. The inability of the
study to produce significant difference in the variables
tested would seem to suggest that the issues identified in
the literature and the complexity of those issues are
64

indeed factors that impact the lives of the subjects
tested.
65
CHAPTER V
SUMMARY, CONCLUSIONS, IMPLICATIONS,
AND RECOMMENDATIONS
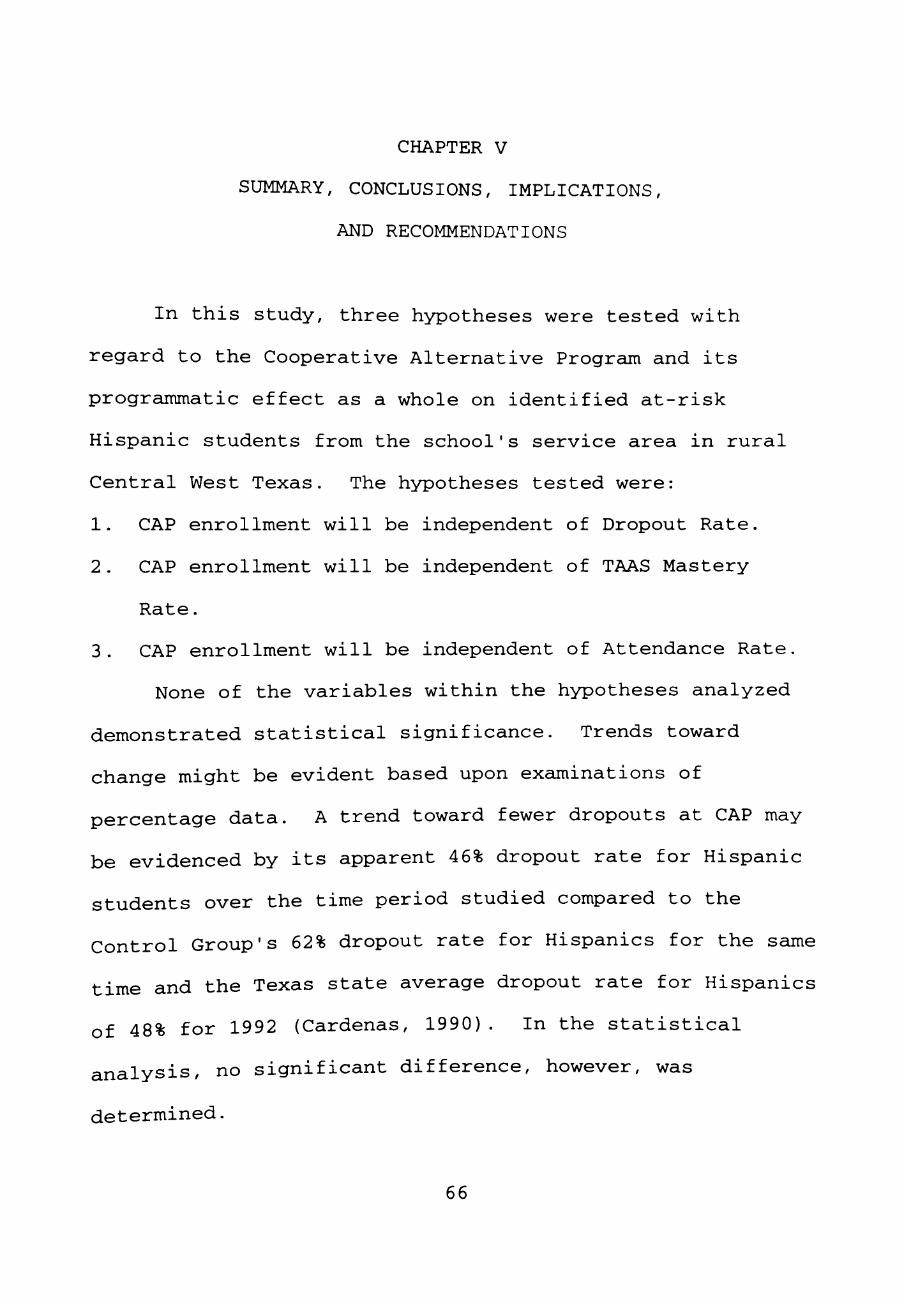
In this study, three hypotheses were tested with
regard to the Cooperative Alternative Program and its
programmatic effect as a whole on identified at-risk
Hispanic students from the school's service area in rural
Central West Texas. The hypotheses tested were:
1. CAP enrollment will be independent of Dropout Rate.
2. CAP enrollment will be independent of TAAS Mastery
Rate.
3. CAP enrollment will be independent of Attendance Rate.
None of the variables within the hypotheses analyzed
demonstrated statistical significance. Trends toward
change might be evident based upon examinations of
percentage data. A trend toward fewer dropouts at CAP may
be evidenced by its apparent 46% dropout rate for Hispanic
students over the time period studied compared to the
Control Group's 62% dropout rate for Hispanics for the same
time and the Texas state average dropout rate for Hispanics
of 48% for 1992 (Cardenas, 1990). In the statistical
analysis, no significant difference, however, was
determined.
66
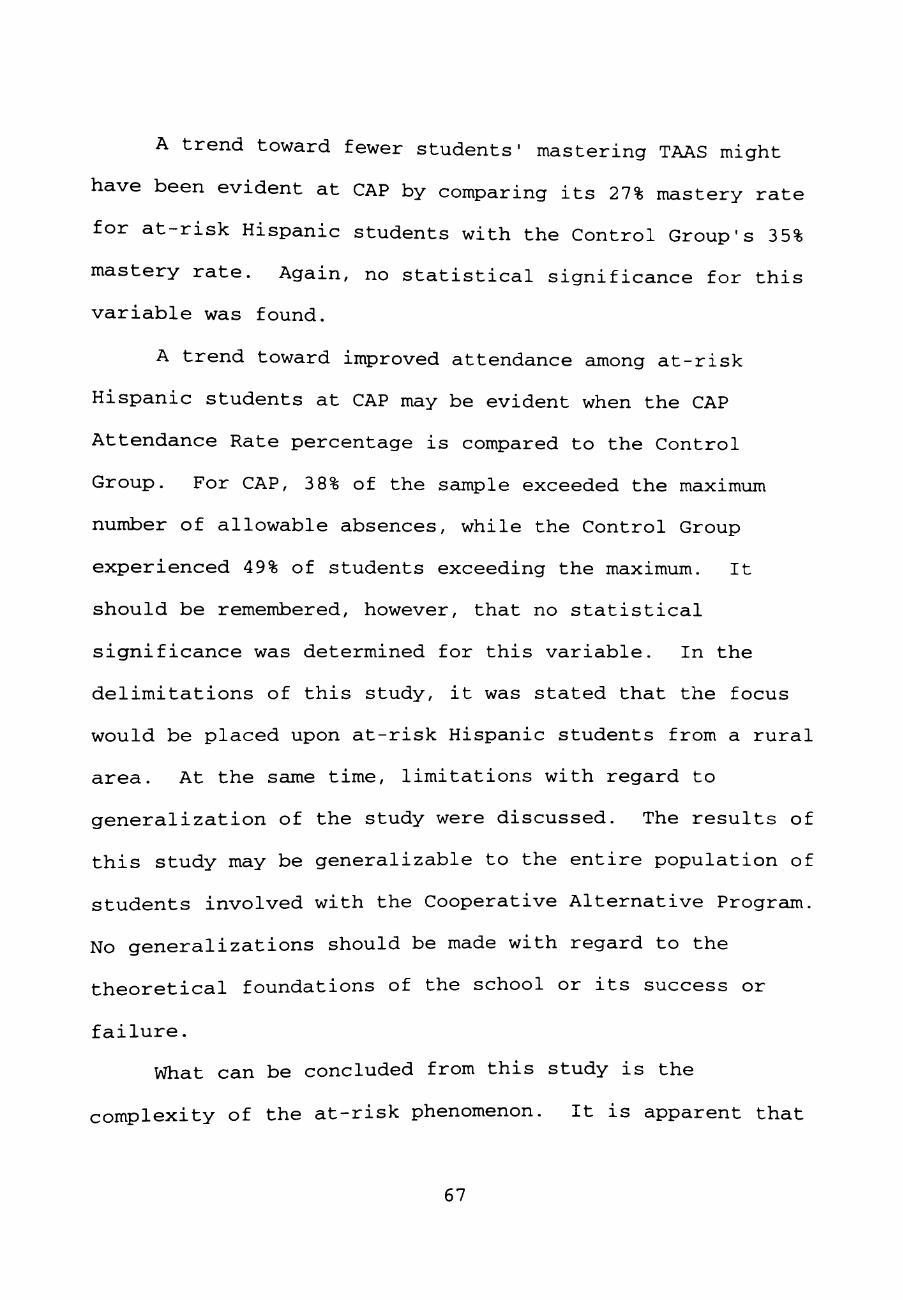
A trend toward fewer students' mastering TAAS might
have been evident at CAP by comparing its 27% mastery rate
for at-risk Hispanic students with the Control Group's 35%
mastery rate. Again, no statistical significance for this
variable was found.
A trend toward improved attendance among at-risk
Hispanic students at CAP may be evident when the CAP
Attendance Rate percentage is compared to the Control
Group. For CAP, 3 8% of the sample exceeded the maximum
number of allowable absences, while the Control Group
experienced 49% of students exceeding the maximum. It
should be remembered, however, that no statistical
significance was determined for this variable. In the
delimitations of this study, it was stated that the focus
would be placed upon at-risk Hispanic students from a rural
area. At the same time, limitations with regard to
generalization of the study were discussed. The results of
this study may be generalizable to the entire population of
students involved with the Cooperative Alternative Program.
No generalizations should be made with regard to the
theoretical foundations of the school or its success or
failure.
What can be concluded from this study is the
complexity of the at-risk phenomenon. It is apparent that
67
this phenomenon goes far beyond the ability of schools
alone to irradicate. An analysis of the literature
suggests that a negative home environment may reduce the
positive influences of any achool. The Cooperative
Alternative Program's basis and rationale for operation are
grounded in the equality schools movement and in control
theory psychology. Attention is given to the needs of
students that exceed the academic difficulties they
exhibit. With the complex nature of the problem as
identified in the literature and the complex nature of the
school as described in the introduction, specific
(Quantifiable measures may not yet be apparent. The
problems addressed by the programmatic design of CAP are
significant. More time may be necessary to make clear,
cjuantifiable measurement of change. In addition, it should
be understood that simple participation in any particular
program is not sufficient to address the totality of the
at-risk phenomenon.
This study appears at first to apply a simple design
to the analysis of a multifaceted issue. It is realized
that the problem goes far beyond the ability of any one
attempt to cjuantify. The design is intended to assess
initial impact on valid measures. A case study and further
demographic analysis approach would be a possible next
68

step. Before such an extensive project is undertaken,
however, clear direction must be established. Since the
original foundations of the school are in Glasser's work, a
validation of that philosophy under the current
acSministration would be needed. The identification of
trends in this study may also provide some direction for
future researchers. Although the presence of trends toward
change could be a precursor to a cjuantifiable measure, no
definite conclusion of that nature is possible from the
results of this study.
It is clear that further research is needed in this
area. The literature reveals significant discussion with
regard to the at-risk issue. It also reveals the
complexity of the programmatic design of the Cooperative
Alternative Program. Further research into its possible
impacts on other groups is warranted. Specific areas of
interest for further research might include the
implications of early childhood intervention through the
school's daycare and preschool facility and the possible
improved literary levels of parents who attended CAP upon
the academic performance and socialization of preschool
children served in the CAP program. In addition, further
research is needed with regard to the impact of removal of
at-risk students upon the academic performance and
69
socialization of non at-risk students remaining at home
campuses.
In the design of the Cooperative Alternative Program,
research is warranted in the area of teacher expectations
and perceptions of students. Research literature reveals a
link between academic performance and teacher perceptions
and expectations of students. The perceived difficulty
experienced by CAP students in academic performance,
possibly indicated by the analysis of the TAAS Mastery Rate
variable contained in this study, might warrant the
investigation of teacher perceptions and expectations of
CAP students. Also, with a preponderance of evidence in
the literature indicating a link between student attitudes
about school and the negative feelings at-risk students
associate with school, further research with regard to
student attitude at CAP could help reveal factors related
to the lack of statistical significance for the Dropout
Rate and Attendance Rate variables examined. Finally,
further research might be warranted with regard to parental
attitudes about their children's participation in CAP.
Research literature reveals linkages between parents'
attitudes about school and their children's success.
Research in this area would possibly be related to all
three of the variables examined.
70
This research has focused attention on a programmatic
solution based on currently used theory to impact the at-
risk problem. It has provided a foundation for further
research to help identify possible areas of programmatic
refinement that could impact the performance of CAP
students and provide more generalizable information for the
body of knowledge with regard to this issue. In
conclusion, it is clearly apparent that the at-risk issue
recjuires continued research with regard to programmatic
solutions so that positive change may be effected.
71
REFERENCES
Alderman, M. K. & Cohen, M. W. (1985) . Motivation theory and practice for preservice teachers. Teacher Education Monograph No. 4. Washington, D.C: ERIC Clearinghouse on Teacher Education, 52-65.
Azmitia, M. , Cooper, C , Garcia, E. , Ittel, A., Johanson, B., Lopez, E., Chavez, R., & Rivera, L. (1994). Links between home and school among low-income Mexican-American and European-American families. Educational practice report: 9. A Research Report from: National center for Research on Cultural Diversity and Second Language Learning, Santa Cruz, CA. ERIC File ED 370 757
Benjamin, A. (1993, August). Parent's literacy and their children's success in school: Recent reserach, promising practices, and research implications. Education research report. Office of Educational Research and Improvement. Washington, D.C. Office of Research. ERIC File ED 363 441
Beauchamp, L. (1992, Spring). Where every child is gifted. America's Agenda, pp. 32-38.
Cantor, L, & Cantor, M. (1991) . Parents on your side. Santa Monica, CA: Lee Cantor and Associates.
Cardenas, J. A. (1990, March). Texas school dropouts: 1986 to 1989. IRDA Newsletter, 17. 3, 1-5.
Casey, A. C. & McSwain, J. A. (1989, March). Cooperative alternative program: A plan for dropout prevention. A paper presented to the ACRES Conference, Tucson, AZ.
Casey, A., McSwain, J., & Beach, D. (1993, Nov.). The Cooperative Alternative Program high school: A droput prevention plan. NASSP Bulletin. 77. 556. pp. 105-
108.
Casey, S., Wiese, L., & McSwain, J. (1995, Spring). A successful alternative . . . Coleman I.S.D. - A plan for dropout prevention. Texas Study of Secondary F.diication. 4(2), 12.
72
Cohen, M. W. , Emrich, A. E. , & deCharmes, R. (1977). Training teachers to enhance personal causation in students. Interchange. 7. 34-39.
Cohen, M. W. (1979) . Student influence in the classroom. Doctoral dissertation. Washington University, 4., 748a.
Cohen, M. W. (1986) . Research on motivation: New content for the teacher preparation curriculum. Journal of Education. 37. 23-28.
Curwin, R. & Mendler, A. (1988) . Discipline with dignity. Alexandria, VA: ASCD.
Davis, D. (1990). A study of Hispanic dropouts. Research Report. ERIC File ED 322 265
Deci, E. L. & Ryan, R. M. (1980) . The empirical exploration of intrinsic motivational processes. In Advances in Experimental Social Psychology, edited by Berkowitz, L., New York: Academic Press, 3 9-80.
Deiro, J. (1994, April). A study of teacher and student bonding. Paper presented to the Annual Meeting of the American Educational Research Asociation, New Orleans, LA. ERIC File ED 369 747
Egan, T. (1992, August 2). Accelerating poor achievers. The New York Times, Education Life.
Ekstrom, R. B. , Goertz, M. E., Pollack, J. M., & Rock, D. A. (1986). Who drops out of high school and why? Findings from a national study. Teachers College Record. 87(3). 356-73.
Felker, D. W. , Stanwyck, D. J., & Kay, R. S. (1973). The effects of a teacher program in self-concept enhancement of pupil's self-concept, anxiety and intellectual achievement responsibility. Journal of Education Research. 66. 443-45.
Fraenkel, J. R. & Wallen, N. E. (1990). How to design and evaluate resea-rch in education. New York: McGraw-Hill Publishing Company.
73
Fuller, M., Ronning, M. , Van Vorhis, J., & Moore, M. (1993, August). Restructuring for student success in a rural school: Preliminary analyses. Paper presented at the Annual Convention of the American Psychological Association. Toronoto, Ontario, Canada ERIC File ED 371 917
Gage, N. L. (1990, December). Dealing with the dropout problem. Phi Delta Kappan. 72(4). 280-285.
Gardner, H. & Hatch, T. (1989, Nov.). Multiple intelligences go to school: Educational implications of the theory of multiple intelligence. Education Researcher, p. 7.
Glasser, W. (1992) . The cruality school: Managing students without coercion. New York: Harper Perennial.
Good, T. L. (1981, February). Teacher expectations and student perceptions: A decade of research. Educational Leadership. 415-422.
Gurney, P. (1987) . Enhancing self-esteem by the use of behavior modification technic^ues . Contemporary Educational Psychology. 12. 30-41.
Hahn, A. (1987, December). Reaching out to America's dropout: What to do? Phi Delta Kappan. 256-263.
Hamby, J. V. (1989). How to get an "A" on your dropout prevention report card. Educational Leadership, 4£(5), 21-28.
Harter S. (1978). Effectance motivation reconsidered: Toward a developmental model. Human Development, 21, 34-64.
Hitz, R. & Driscoll, A. (1989). Praise in the classroom. ' ERIC Clearinghouse on Elementary and Early Childhood Education Office of Educational Research and Improvement. Washington, D.C. ERIC File ED 313 108
Johnson, R. (1993, Oct.). Attrition in Texas public schools. TP^^ TJ^w.qletter. 20, 9, pp. 6-10.
74

Kammoun, B. (1991, Nov.). High school dropout programs: Elements for success. NASSP Bulletin 75(538). 9-14.
Kerman, S., Kimball, T., & Martin, M. (1980). Teacher expectations and student achievement. Bloomington, IN: Phi Delta Kappa.
Koehler, V. (1988, April). Teacher's beliefs about at-risk students. Paper presented at the Annual Meeting of the American Educational Research Association. New Orleans, LA ERIC File ED 312 359
Kremer, B. K. (1976) . Classroom evaluation, developmental level and continuing motivation. Unpublished doctoral dissertation. University of Illinois, Urbana-Champaign.
Lepper, M. R. and Green, D. (1978). Overjustification research and beyond: Toward a means-end analysis of intrinsic and extrinsic motivation. In M. R. Lepper and D. Green (Eds.), The hidden cost of reward. Hillsdale, NJ: Erlbaum, 179-182.
Lepper M. R. (1983). Extrinsic reward and intrinsic motivation: Implications for the classroom. In J. M. Levine and M. C. Wang (Eds.) Teacher and student perceptions: Implications for learning. Hillsdale, NJ: Erlbaum, 2 81-317.
Maehr, M. L. & Stallings, W. M. (1972) . Freedom from external evaluation. Child Development. 43. 177-185.
Maehr, M. L. (1976). Continuing motivation: An analysis of a seldom considered educational outcome. Review of Educational Research. 46. 443-462.
Markey, J. (1988, June). The labor market problems of today's high school dropouts. Monthly Labor Review. 36-43.
McDill, E. L., Natriello, G., & Pallas, A. M. (1987). A population at-risk: Potential consecjuences of tougher school standards for student dropouts. In G. Natriello (Ed.) -School dropouts patterns and policies. New York: Teachers College Press.
75
McDonald, R. (1991). Developmental students' processing of teacher feedback in composition instruction. Review of Research in Developmental education. 8. 5. Appalacian State University, Boone, NC. Center for Developmental Education.
Miron, C. D. (1971). Behavior modification guide for teachers. Baltimore, MD: Behavioral Information Technology.
Morgan, M. (1984) . Reward-induced decrements and increments in intrinsic motivation. Review of Educational Research. 54. 5-30.
Mosley, M. L. & Sullivan, H. J. (1983, April). "The effects of teachers' comments on the continuing motivation of boys and girls. Paper presented at the meeting of the American Educational Research Association. Montreal.
O'Leary, K. D. & O' Leary S. O. (1972). Classroom management: The successful use of behavior modification. New York: Pergamon.
Peterson, D. (1989). Parent involvement in the educational process. ERIC Digest Series Number EA 43 Office of Educational Research and Improvement. ERIC File ED 312 776
Pittman, T. S., Boggiano, A. K., & Ruble, D. N. (1983). Intrinsic and extrinsic motivational orientations: Limiting conditions on the undermining and enhancing effects of reward on intrinsic motivation. In J. M. Levine and M. C. Wang (Eds.) Teacher and student p^-rr-^ptior^- Tmplir-;:̂ ^̂ nns of learning. Hillsdale, NJ: Erlbaum, 319-340.
Poarow S (1990, Jan.). Challenging at-risk students: Findings from the HOTS program. Phi Delta Kappan. 71(5), 389-397.
Pollack S R., Costomiris, S., Sroka, S., & Pittman, T. S (1982) School experience, reward characteristics, and intrinsic motivation. Child Development, ^3, 1382-1391.
76

Rohrkemper, M. (1985) . Motivational coursework in teacher education. In M. K. Cohen (Ed.) Motivation theory and practice for preservice teachers. Teacher Education Monograph No. 4. Washington, D.C.: ERIC Clearinghouse on Teacher Education, 52064.
Rosenfield, D. , Folger, R. , & Adelman, J. F. (1980). When rewards reflect competence: A cjualification of the overjustification effect. Journal of Personality and Social Psychology. 39. 368-376.
Rumburger, R. W. (1983). The influence of race, sex, and family background. American Educational Research Journal. 20(2). 199-330.
Seligman, M. E. P. (1975). Helplessness. San Francisco: Freeman.
Slavin, R. , Karweit, N., & Wasik, B. (1993, January). Preventing early school failure: What works? Educational Leadership. 80(4). 10-18.
Stasz, C. (1994, February). Classrooms that work: Teaching and learning generic skills. Centerfocus. 4. National Center for Resarch in Vocational Education, Berkeley, CA. ERIC File ED 365 799
Story, N. 0. (1984). Factors influencing continuing motivation. Unpublished doctoral dissertation, Arizona State University, Tempe.
Story, N. O. & Sullivan, H. J. (1986). Factors that
influence continuing motivation. Journal of Education T̂ e.qearch, 80, 86-87.
Wells, D. (1987). Curbing dropout rates: An ecological model. A Technical Report. Washington, D.C: ERIC Clearinghouse on Dropout Prevention, 1-19.
Wiesz, J. R. & Stipek, D. J. (1982). Competence, contingency, the development of perceived control. Human D^yelopment. 25. 250-281.
77