cooling experiment
TRANSCRIPT

arX
iv:1
306.
1509
v2 [
phys
ics.
acc-
ph]
11 O
ct 2
013
Characterisation of the muon beams for the Muon IonisationCooling Experiment
The MICE Collaboration , D. Adams16, D. Adey23,b, A. Alekou19,c, M. Apollonio19,d,R. Asfandiyarov12, J. Back23, G. Barber19, P. Barclay16, A. de Bari5, R. Bayes17, V. Bayliss16,
R. Bertoni3, V. J. Blackmore20,a, A. Blondel12, S. Blot29, M. Bogomilov1, M. Bonesini3,C. N. Booth21, D. Bowring27, S. Boyd23, T. W. Bradshaw16, U. Bravar30, A. D. Bross25,
M. Capponi6, T. Carlisle20, G. Cecchet5, G. Charnley14, J. H. Cobb20, D. Colling19,N. Collomb15, L. Coney34, P. Cooke18, M. Courthold16, L. M. Cremaldi33, A. DeMello27,A. Dick22, A. Dobbs19, P. Dornan19, S. Fayer19, F. Filthaut10,f, A. Fish19, T. Fitzpatrick25,
R. Fletcher34, D. Forrest17, V. Francis16, B. Freemire28, L. Fry16, A. Gallagher15, R. Gamet18,S. Gourlay27, A. Grant15, J. S. Graulich12, S. Griffiths14, P. Hanlet28, O. M. Hansen11,h,
G. G. Hanson34, P. Harrison23, T. L. Hart33, T. Hartnett15, T. Hayler16, C. Heidt34, M. Hills16,P. Hodgson21, A. Iaciofano6, S. Ishimoto9, G. Kafka28, D. M. Kaplan28, Y. Karadzhov12,
Y. K. Kim29, D. Kolev1, Y. Kuno8, P. Kyberd24, W. Lau20, J. Leaver19, M. Leonova25, D. Li27,A. Lintern16, M. Littlefield24, K. Long19, G. Lucchini3, T. Luo33, C. Macwaters16,B. Martlew14, J. Martyniak19, A. Moretti25, A. Moss14, A. Muir14, I. Mullacrane14,
J. J. Nebrensky24, D. Neuffer25, A. Nichols16, R. Nicholson21, J. C. Nugent17, Y. Onel31,D. Orestano6, E. Overton21, P. Owens14, V. Palladino4, J. Pasternak19, F. Pastore6,
C. Pidcott23, M. Popovic25, R. Preece16, S. Prestemon27, D. Rajaram28, S. Ramberger11,M. A. Rayner20,j, S. Ricciardi16, A. Richards19, T. J. Roberts26, M. Robinson21, C. Rogers16,
K. Ronald22, P. Rubinov25, R. Rucinski25, I. Rusinov1, H. Sakamoto8, D. A. Sanders33,E. Santos19, T. Savidge19, P. J. Smith21, P. Snopok28, F. J. P. Soler17, T. Stanley16,
D. J. Summers33, M. Takahashi19, J. Tarrant16, I. Taylor23, L. Tortora6, Y. Torun28, R. Tsenov1,C. D. Tunnell20, G.Vankova1, V. Verguilov12, S. Virostek27, M. Vretenar11, K. Walaron17,
S. Watson16, C. White14, C. G. Whyte22, A. Wilson16, H. Wisting12, and M. Zisman27
1Department of Atomic Physics, St. Kliment Ohridski University of Sofia, Sofia, Bulgaria2Institute for Cryogenic and Superconductivity Technology, Harbin Institute of Technology,
Harbin, PR China3Sezione INFN Milano Bicocca, Dipartimento di Fisica G. Occhialini, Milano, Italy
4Sezione INFN Napoli and Dipartimento di Fisica, Università Federico II,ComplessoUniversitario di Monte S. Angelo, Napoli, Italy
5Sezione INFN Pavia and Dipartimento di Fisica Nucleare e Teorica, Pavia, Italy6Sezione INFN Roma Tre e Dipartimento di Fisica, Roma, Italy
7Kyoto University Research Reactor Institute, Osaka, Japan8Osaka University, Graduate School of Science, Department of Physics, Toyonaka, Osaka,
Japan9High Energy Accelerator Research Organization (KEK), Institute of Particle and Nuclear
Studies, Tsukuba, Ibaraki, Japan10NIKHEF, Amsterdam, The Netherlands
11CERN, Geneva, Switzerland12DPNC, Section de Physique, Université de Genève, Geneva, Switzerland
13Paul Scherrer Institut, Villigen, Switzerland14The Cockcroft Institute, Daresbury Science and Innovation Centre,Daresbury, Cheshire, UK
15STFC Daresbury Laboratory, Daresbury, Cheshire, UK
1
FERMILAB-PUB-13-602-APC
Operated by Fermi Research Alliance, LLC under Contract No. De-AC02-07CH11359 with the United States Department of Energy.

16STFC Rutherford Appleton Laboratory, Harwell Oxford, Didcot, UK17School of Physics and Astronomy, Kelvin Building, The University of Glasgow, Glasgow,
UK18Department of Physics, University of Liverpool, Liverpool, UK
19Department of Physics, Blackett Laboratory, Imperial College London, London, UK20Department of Physics, University of Oxford, Denys Wilkinson Building, Oxford, UK
21Department of Physics and Astronomy, University of Sheffield, Sheffield, UK22Department of Physics, University of Strathclyde, Glasgow, UK23Department of Physics, University of Warwick, Coventry, UK
24Brunel University, Uxbridge, UK25Fermilab, Batavia, IL, USA
26Muons, Inc., Batavia, IL, USA27Lawrence Berkeley National Laboratory, Berkeley, CA, USA
28Illinois Institute of Technology, Chicago, IL, USA29Enrico Fermi Institute, University of Chicago, Chicago, IL, USA
30University of New Hampshire, Durham, NH, USA31Department of Physics and Astronomy, University of Iowa, Iowa City, IA, USA
32Jefferson Lab, Newport News, VA, USA33University of Mississippi, Oxford, MS, USA34University of California, Riverside, CA, USA
35Brookhaven National Laboratory, Upton, NY, USA
aemail: [email protected] at Fermilab, Batavia, IL, USAcNow at CERN, Geneva, Switzerland
dNow at Diamond Light Source, Harwell Science and InnovationCampus, Didcot,Oxfordshire, UK
fAlso at Radboud University Nijmegen, Nijmegen, The NetherlandsgPermanent address Institute of Physics, Université Catholique de Louvain, Louvain-la-Neuve,
BelgiumhAlso at University of Oslo, Norway
jNow at DPNC, Université de Genève, Geneva, SwitzerlandkNow at University of Huddersfield, UK
Received: date / Accepted: date – Entered later
Abstract
A novel single-particle technique to measure emittance hasbeen developed and used to characterise seventeendifferent muon beams for the Muon Ionisation Cooling Experiment (MICE). The muon beams, whose meanmomenta vary from 171 to 281 MeV/c, have emittances of approximately 1.2–2.3π mm-rad horizontally and0.6–1.0π mm-rad vertically, a horizontal dispersion of 90–190 mm andmomentum spreads of about 25 MeV/c.There is reasonable agreement between the measured parameters of the beams and the results of simulations. Thebeams are found to meet the requirements of MICE.
1 Introduction
A future high-energy Neutrino Factory or Muon Collider willrequire an intense source of muons. The largevolume of phase space occupied by muons at production must bereduced before they are accelerated and stored.The short muon lifetime prohibits the use of conventional cooling techniques; another technique must be developedto maximise the muon flux delivered to a storage ring.
2

Target
ISISProton
SynchrotronQ1
Q2
Q3
Dipole 1(D1)
Dipole 2(D2)
DecaySolenoid
Q4 Q5 Q6 Q7 Q8 Q9 Diffuser*
*Not present
TOF0 TOF1BPM
Ckov
29.79 m
Figure 1: MICE upstream beam line.
Ionisation cooling is the only practical approach. A muon passing through a low-Z material loses energy byionisation, reducing its transverse and longitudinal momenta. The longitudinal momentum is restored by acceler-ating cavities, with the net effect of reducing the divergence of the beam and thus the transverse phase space thebeam occupies.
The muon beams at the front-end of a Neutrino Factory or Muon Collider will be similar. They are expected tohave a very large transverse normalised emittance ofεN ≈ 12–20π mm-rad and momentum spreads of 20 MeV/cor more about a central momentum of 200 MeV/c. The transverse emittance must be reduced to 2- 5π mm-rad(depending on the subsequent acceleration scheme) for a Neutrino Factory [1, 2, 3, 4]. Further transverse andlongitudinal cooling is required for a Muon Collider. Emittances of 0.4π mm-rad and 1π mm-rad are desired inthe transverse and longitudinal planes respectively, where the latter is achieved by emittance exchange [5].
The Muon Ionisation Cooling Experiment (MICE) will be the first experiment to demonstrate the practicalityof muon ionisation cooling. This paper describes measurements of the muon beams that will be used by MICE.
2 The MICE Experiment
MICE will measure the ionisation cooling efficiency of one “Super Focus-Focus” (SFOFO) lattice cell [6] basedon the cooling-channel design of Neutrino Factory Feasibility Study 2 [1]. A detailed description of the coolingcell is contained in [7]. Since ionisation cooling depends on momentum (via the dependence of energy loss andmultiple scattering in materials), the MICE experiment hasbeen designed to measure the performance of the cellfor beams of 140 to 240 MeV/c with large momentum spreads; liquid hydrogen and other low-Z absorber materialswill be studied.
The expected reduction in emittance (≈10% using liquid hydrogen) is too small to be measured conventionally,where methods typically attain 10% precision. MICE will therefore make single-particle measurements usingscintillating fibre trackers [8] inside superconducting solenoids (the “spectrometer solenoids”) at each end of thecooling cell. Cherenkov detectors and time-of-flight (TOF)detectors provide upstream particle identification; theTOFs will also allow the muons to be timed with respect to the RF phase. A pre-shower detector and a muonranger will provide particle identification downstream of the cooling section.
2.1 MICE beam requirements
For a realistic demonstration of cooling the beams used should closely resemble those expected at the front endof a Neutrino Factory,i.e., they should have a large momentum spread and a large normalised emittance. Theemittance must be variable to allow the equilibrium emittance—which depends on the absorber material and theoptics of the channel—to be measured.
The MICE beam line has been designed to produce beams of threedifferent emittances at each of three centralmomenta. These beams are named by the convention “(εN , pz)” according to their normalised transverse emittanceat the entrance to the cooling section and longitudinal momentum at the centre of the first absorber. The nominal
3

(RMS) input emittances areεN = 3, 6 and 10π mm-rad; the central momenta are 140, 200 and 240 MeV/c. Thebaseline beam configuration is(εN , pz) = (6π mm-rad, 200 MeV/c).
The beams of different emittances will be generated by meansof a “diffuser”, which allows a variable thicknessof high-Z material to be inserted into the beam at the entrance to the upstream spectrometer solenoid. Scatteringincreases the emittance of the beam to the desired values and, as a consequence of the energy lost in the material,beams with a higher emittance downstream of the diffuser must have a higher momentum upstream. An importantrequirement is that the muon beam downstream of the diffuseris correctly matched in the spectrometer solenoid.
2.2 MICE muon beam line
The new muon beam line for MICE (at the ISIS proton synchrotron, Rutherford Appleton Laboratory) is shownin Figure1 and described at length in [9]. A titanium target [10] samples the proton beam, creating pions thatare captured by the upstream quadrupoles (Q1–3) and momentum-selected by the first dipole (D1). The beam istransported to the Decay Solenoid, which focuses the pions and captures the decay muons.
The second dipole (D2) can be tuned to select muons emitted backwards in the pion rest frame to obtain ahigh purity muon beam. The final transport is through two large-aperture quadrupole triplets, Q4–6 and Q7–9,that focus the beam onto the diffuser. Each of the three quadrupole triplets is arranged to focus-defocus-focus inthe horizontal plane; the beam line can be operated in eitherpolarity. The optics of this section are determined bythe desired emittance of the beam in the cooling channel and the requirement of matching into the spectrometersolenoid.
A time-of-flight station (TOF0) and two aerogel Cherenkov detectors are located just after the Q4–6 triplet; asecond time-of-flight station (TOF1) is located after the final triplet (Q7–9). A low-mass scintillating-fibre beam-position monitor (BPM) is located close to Q7. For theµ+ beams, a variable thickness polyethylene absorber isintroduced upstream of D2 to reduce the flux of protons incident on TOF0.
The TOF detectors are described in [9, 11]. Each station consists of two perpendicular (x,y) planes of 25.4 mmthick scintillator slabs. Each end of each slab is coupled toa fast photomultiplier and subsequent electronics[12]. The measured timing resolutions areσt = 55 ps andσt = 53 ps at TOF0 and TOF1 respectively [13]. Thedifferences in the arrival times of light at each end of the slabs are used to obtain transverse position measurementswith resolutions ofσx = 9.8 mm at TOF0 andσx = 11.4 mm at TOF1 [14].
2.3 Beam line design
The initial design of the baseline(εN , pz) = (6π mm-rad, 200 MeV/c) µ+ beam was made using the TURTLE beamtransport code [15] assuming a 1 cm thick lead diffuser. The design was then optimised with G4beamline [16],with matching conditions in the upstream spectrometer solenoid of αx = αy = 0 andβx = βy = 333 mm [9]. Thebaseline beam design does not compensate for horizontal dispersion introduced at D2. The remaining(εN , pz)beam settings were obtained by scaling the magnet currents of the baseline case according to the the local muonmomentum, accounting for the energy loss of muons in the beamline material,i.e. scaled by a factorpnew/pbase.Hence, the beam line will transport 18 different beams to thecooling channel withεN = 3,6,10π mm-rad andpz = 140,200,240MeV/c, after the diffuser, in two beam polarities.
The “re-scaled” beam line settings will transport muons to the cooling channel with the desired momenta butare not necessarily matched in the first spectrometer as scattering in the diffuser changes the optical parameters.Because the diffuser is thin, the beta function will decrease by the same ratio as the emittance is increased andtherefore the final optics and diffuser thicknesses cannot be determined until the inherent emittances of the inputbeams are known.
The beam line was commissioned in MICE “Step I” in 2010–2011.Data were taken for eight positive and ninenegative beam settings to verify the beam line design and determine the characteristics of the beams, in particulartheir momentum distributions, emittances and dispersions. The result of the commissioning is presented below.
3 Characterising the MICE beams
Emittance is the area occupied by a charged particle beam, intwo, four, or six-dimensional trace-space, given byε =
√detΣ whereΣ is the covariance matrix. In two dimensions,
Σ =
(
σxx σxx′
σx′x σx′x′
)
≡(
εβ −εα−εα εγ
)
,
where, for example,σxx = xx− xx andx denotes the mean. The covariance matrix can also be expressed in termsof the Twiss parametersα,β ,γ, andε giving a full parameterisation of the beam.
4

TOF0Ckov BPM
Q7 Q8 Q9 TOF1
7.705 m
x
z
0x
1
z7
z8
z9
z0
z1
Figure 2: The time-of-flight system and beam line section used to characterise the beam.
Several different methods exist for measuring the emittance of beams [17]. Commonly, beam profile monitorsare used to measure the RMS beam size,σx, at several positions. At least three profile monitors are required todetermine the three elements of the covariance matrix and hence the emittance of the beam; the transfer matricesbetween the profile monitors must be known. These methods do not require individual particles to be tracked butare ultimately limited by the spatial resolution of the detectors and the intensity of the beam.
By contrast, the MICE muon beam is large in spatial extent andits intensity is low compared to conventionalprimary beams. The emittance and optical parameters of sucha beam can be measured if either the trace space co-ordinates,(x,x′),(y,y′) of individual particles can be measured at a single plane or,as in the new method describedhere, the spatial co-ordinates of individual particles aremeasured at two detectors and the transfer matrix betweenthe detectors is known.
In the later Steps of MICE the beam emittance will be measuredby a scintillating fibre tracker inside a 4Tsolenoid. This detector was not present during Step I and thenew method was developed to characterise the beamusing only the two TOF detectors. The relative times and(x,y) positions of single particles are measured in thetwo TOF stations and muons are selected by broad time-of-flight cuts. Each muon is tracked through the Q7–9quadrupole triplet, determining the trace space anglesx′ andy′ at each plane. Simultaneously, the muon momentais measured by time-of-flight, which is important as the beamhas a large momentum spread and the transfer matrixbetween the two detectors depends strongly on momentum. Thecovariance matrix of the beam is then obtainedfrom a large sample of muons so measured. The method is described briefly below; its detailed development isgiven in [14].
Figure2 shows the section of beam line used for the measurements. Thepole tip radius of the quadrupoles is176 mm. The two TOF detectors have active areas of 400 mm× 400 mm and 420 mm× 420 mm, respectively,and were separated by 7.705m during the 2010 commissioning;their combined time resolution of 76 ps allows themomenta of muons to be determined with a resolution ofσp = 3.7 MeV/c for pz = 230 MeV/c.
3.1 Measurement technique
The measurement algorithm proceeds iteratively. An initial estimate ofpz is made by assuming that a muon travelsalong thez-axis between the two TOF counters. This estimate is used to determine thex andy transfer matrices,Mx(pz) andMy(pz), between TOF0 and TOF1. Once the transfer matrices are known, the trace-space vectors(x0,x′0) and (y0,y′0), and(x1,x′1) and (y1,y′1), at TOF0 and TOF1 respectively, are obtained from the positionmeasurements(x0,y0) and(x1,y1) by a rearrangement of the transport equations:
(
x1
x′1
)
= Mx
(
x0
x′0
)
, (1)
(
y1
y′1
)
= My
(
y0
y′0
)
. (2)
Explicitly(
x′0x′1
)
=1
M12
(
−M11 1−1 M22
)(
x0
x1
)
, (3)
whereMi j are the (momentum dependent) elements ofMx, and similarly for(y′0,y′1). The estimates of(x0,x′0),
(y0,y′0), and pz are used to track the muon between TOF0 and TOF1 and obtain an improved estimate of thetrajectory and a correction,∆s, to the path length. To ensure convergence to a stable solution, only half thepredicted∆s was applied before recalculating the momentum from the time-of-flight; the procedure was repeatedten times for each muon although a convergent solution was found after typically five iterations. Finally, a small
5
z (mm)-3000 -2000 -1000 0 1000 2000 3000
(y=
0)/
dx
(T/m
)y
= d
B0
g
-1.5
-1
-0.5
0
0.5
1
1.5
Quadrupole centre
Focusing
Defocusing
Drift
Top hat model
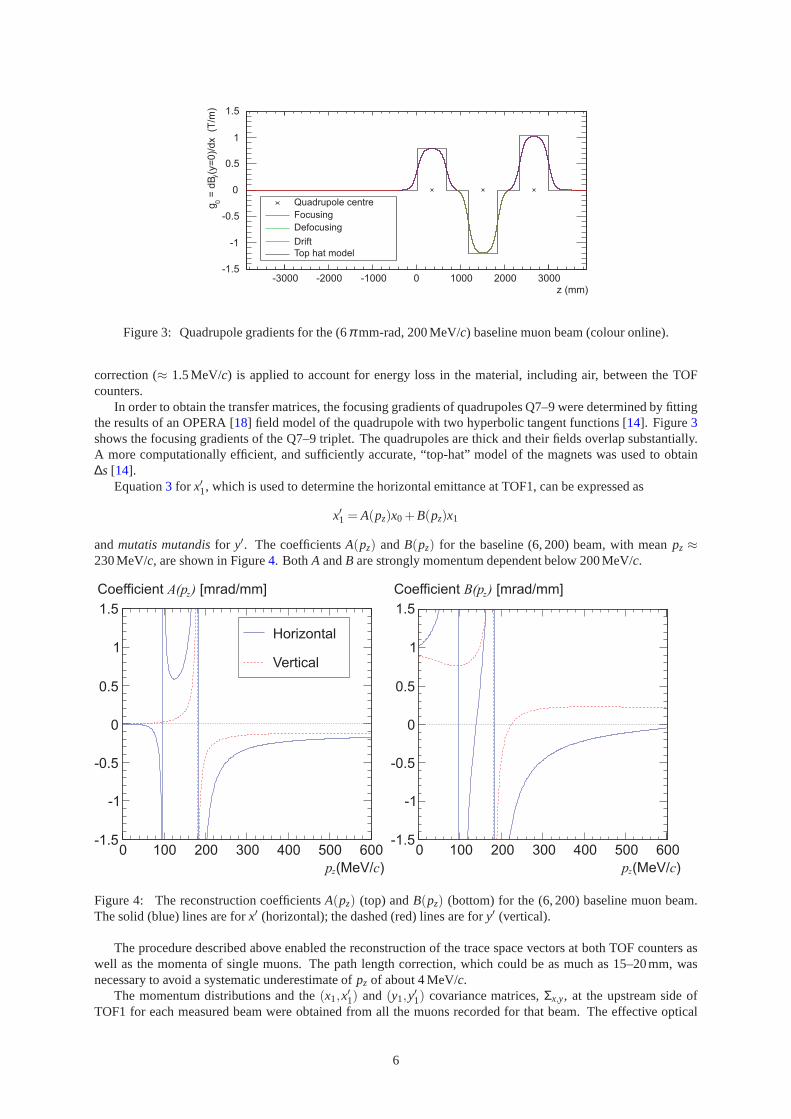
Figure 3: Quadrupole gradients for the (6π mm-rad, 200 MeV/c) baseline muon beam (colour online).
correction (≈ 1.5 MeV/c) is applied to account for energy loss in the material, including air, between the TOFcounters.
In order to obtain the transfer matrices, the focusing gradients of quadrupoles Q7–9 were determined by fittingthe results of an OPERA [18] field model of the quadrupole with two hyperbolic tangent functions [14]. Figure3shows the focusing gradients of the Q7–9 triplet. The quadrupoles are thick and their fields overlap substantially.A more computationally efficient, and sufficiently accurate, “top-hat” model of the magnets was used to obtain∆s [14].
Equation3 for x′1, which is used to determine the horizontal emittance at TOF1, can be expressed as
x′1 = A(pz)x0+B(pz)x1
andmutatis mutandis for y′. The coefficientsA(pz) andB(pz) for the baseline (6, 200) beam, with meanpz ≈230 MeV/c, are shown in Figure4. BothA andB are strongly momentum dependent below 200 MeV/c.
Horizontal
Vertical
1.5
1
0.5
0
-0.5
-1
-1.50 100 200 300 400 500 600
p c(MeV/ )z
Coefficient [mrad/mm]A(p )z
1.5
1
0.5
0
-0.5
-1
-1.50 100 200 300 400 500 600
p c(MeV/ )z
Coefficient [mrad/mm]B(p )z
Figure 4: The reconstruction coefficientsA(pz) (top) andB(pz) (bottom) for the (6, 200) baseline muon beam.The solid (blue) lines are forx′ (horizontal); the dashed (red) lines are fory′ (vertical).
The procedure described above enabled the reconstruction of the trace space vectors at both TOF counters aswell as the momenta of single muons. The path length correction, which could be as much as 15–20mm, wasnecessary to avoid a systematic underestimate ofpz of about 4 MeV/c.
The momentum distributions and the(x1,x′1) and (y1,y′1) covariance matrices,Σx,y, at the upstream side ofTOF1 for each measured beam were obtained from all the muons recorded for that beam. The effective optical
6
parameters and the emittances of each beam were deduced fromΣx,y as described in Section4.3. The systematicuncertainty on the measurements is discussed in Section4.4
3.2 Monte Carlo simulations of the MICE beam line
Monte Carlo simulations were made for six of the 18 possible beam settings to check the beam line design software.The (6π mm-rad,pz = 140, 200, 240 MeV/c) µ+ andµ− beams were simulated in two steps. G4beamline wasused to track particles from the target as far as TOF0; the G4MICE Monte Carlo [19] was then used to trackmuons between TOF0 and TOF1. Both simulations contained descriptions of the material in, and surrounding,the beam line and magnet models, including the apertures of the quadrupoles Q4–9, using the optics designed forthe corresponding beams. The simulations suggest that the final emittance of the beams before the diffuser is≈1π mm-rad, partly due to scattering in the material in the beam line but limited by the aperture of the quadrupoles.Dispersion in the horizontal plane due to D2 is expected.
3.3 Performance of the reconstruction algorithm
Reconstructed true (MeV/ )p p cz z
2000
1800
1600
1400
1200
1000
800
600
400
200
0-15 -10 -5 0 5 10 15
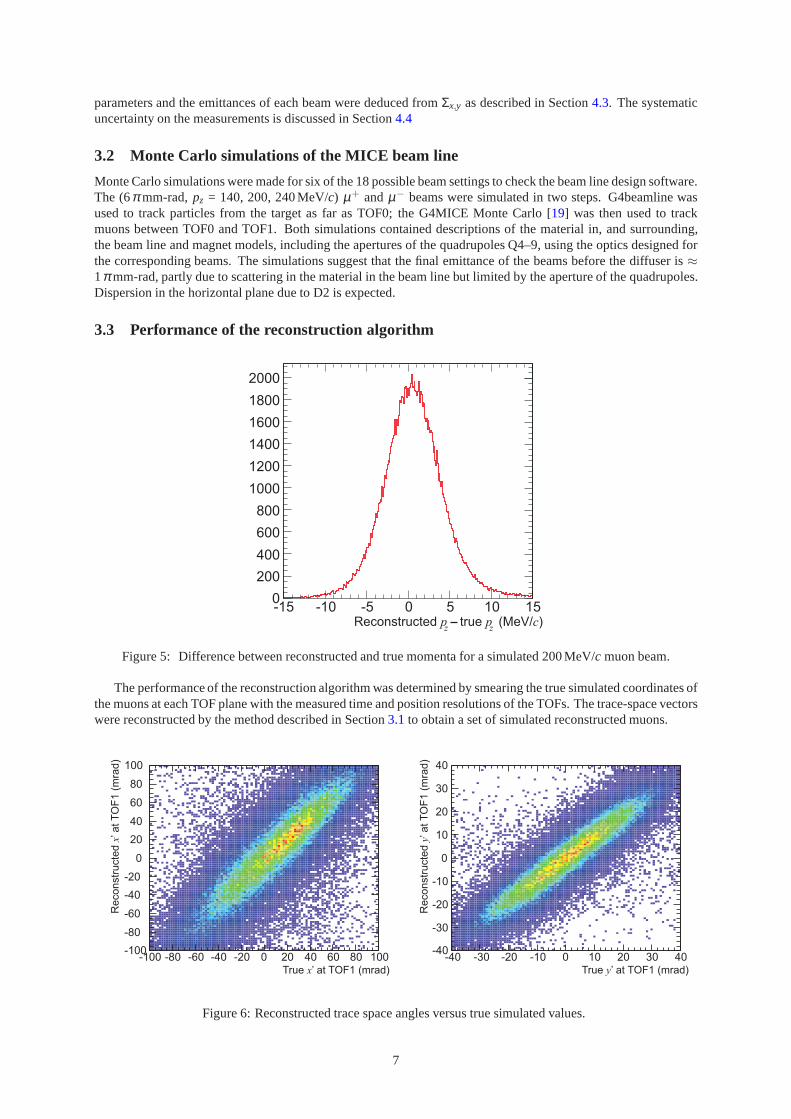
Figure 5: Difference between reconstructed and true momenta for a simulated 200 MeV/c muon beam.
The performance of the reconstruction algorithm was determined by smearing the true simulated coordinates ofthe muons at each TOF plane with the measured time and position resolutions of the TOFs. The trace-space vectorswere reconstructed by the method described in Section3.1to obtain a set of simulated reconstructed muons.
-60 -40 -20 0 20 40 60 80 100-80-100-100
-80
-60
-40
-20
0
20
40
60
80
100
-40 -30 -20 -10 0 10 20 30 40-40
-30
-20
-10
0
10
20
30
40
Reconstr
ucte
d’ a
tT
OF
1 (
mra
d)
x
Reconstr
ucte
d’ a
tT
OF
1 (
mra
d)
y
True ’ at TOF1 (mrad)x True ’ at TOF1 (mrad)y
Figure 6: Reconstructed trace space angles versus true simulated values.
7
Table 1: Mean and RMS widths of the longitudinal momentum distributions for six beams compared with thecorresponding simulations.
Data SimulationBeam Meanpz RMS pz Meanpz RMS pz
MeV/c MeV/c MeV/c MeV/c
(6,140) 176.4±2.3 22.8±0.3 173.7±2.1 19.5±0.2µ− (6,200) 232.2±2.5 23.6±0.3 229.3±0.8 21.0±0.1
(6,240) 271.0±3.7 24.5±0.3 270.5±0.9 22.2±0.1
(6,140) 176.5±2.0 24.4±0.3 176.6±3.7 25.5±0.5µ+ (6,200) 229.2±2.4 25.9±0.3 230.8±1.4 28.9±0.2
(6,240) 267.7±2.9 25.8±0.3 269.2±4.2 31.3±0.5
Figure5 shows, for a simulated(6,200)µ− beam, the difference between reconstructed and true momenta.The RMS width of the distribution of 3.7 MeV/c confirms that the momentum resolution is dominated by thetiming resolution of the TOF system. It is sufficiently smallto measure the large expected widths of approximately20 MeV/c of the momentum distributions.
Figure6shows the agreement between the true and reconstructed angles,x′1 andy′1 for the simulated(6,200)µ−
beam. The average angular resolutions,σx′1andσy′1
, for this beam are approximately 29 and 8 mrad respectively.They are determined by the position resolution of the TOF counters and multiple scattering, and depend on mo-mentum asx′1 andy′1 are obtained from position measurements using the momentum-dependent elements of thetransfer matrix. The angular resolutions are small but not negligible compared with the expected widths of thex′1andy′1 distributions.
4 Results of the measurements and comparison with simulations
Data were taken for eight positive and nine negative re-scaled beams that, when used in conjunction with thediffuser, will generate the full range of desired emittances (see Section2.3); the polarity of the decay solenoid waskept the same for both positive and negative beams. Muons in the data were selected by broad time-of-flight cutschosen for each nominal beam momentum.
The simulations used in this analysis suggest that the pion contamination at TOF0 of theµ− data is about onepercent and less than five percent for theµ+ sample [14]. Recent measurements [20] indicate a somewhat smallerpion contamination.
4.1 Longitudinal momentum
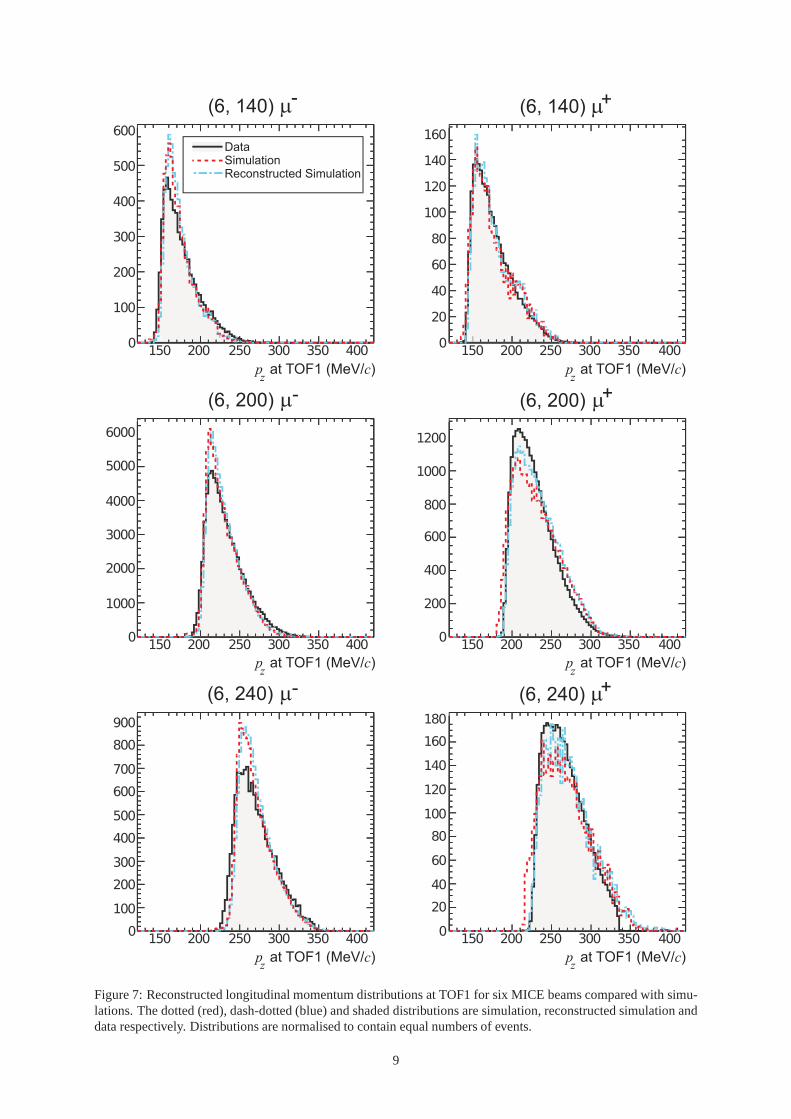
Figure7 shows the distributions ofpz at TOF1 for six beams compared with the results of the simulations. Overallthe measured and simulated distributions agree well in shape and width. Theµ+ beams have a slightly greatermomentum spread than theµ− beams, due to energy loss fluctuations in the proton absorber. The agreementbetween the measured and simulated momentum distributionsis better for theµ− beams than it is for theµ+
beams. Since the mean momentum is dictated by D2, the agreement between the measured and simulated meanmomenta at TOF1 confirms the beam line design. The mean momenta and the RMS widths of the measured beamsare given in Table1. The systematic error onpz is mainly due to the±35 ps calibration uncertainty on the absolutetime of flight value [14] and is estimated to be less than 3 MeV/c for all momenta below 300 MeV/c.
4.2 Transverse spatial distributions
Figure8 shows a comparison of the spatial distributions in the transverse plane at TOF1 for a simulated (6, 200)µ−
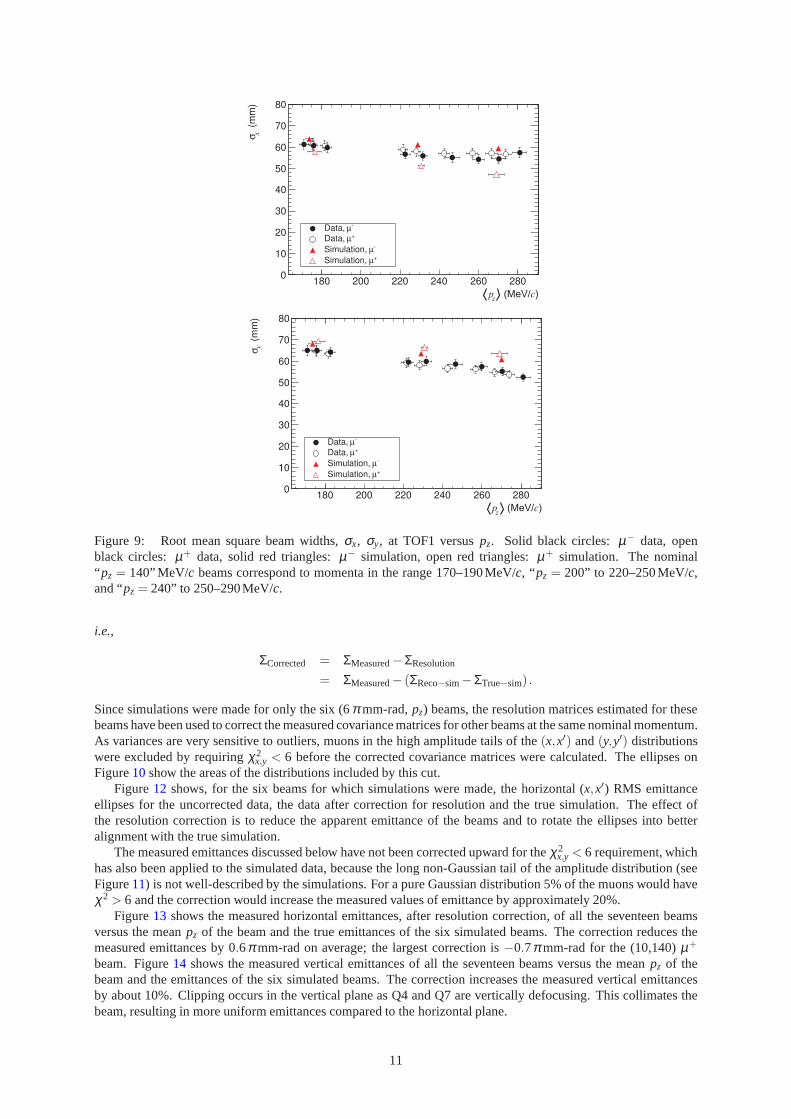
beam before and after reconstruction, and data for the same beam. The effect of smearing by the reconstructionprocedure is small. Muons crossing the shaded area are excluded from the simulation (and hence the reconstruc-tion) as they pass through uncalibrated regions of TOF1. Since muons must cross both a horizontal and verticalslab of the TOF to be counted, these regions are excluded fromthe data. Figure9 shows the RMS horizontal andvertical beam sizes,σx andσy, versus meanpz for all the measured beams and the six simulated beams. The sizesof the positive and negative muon beams are very similar bothvertically and horizontally. The measured verticalbeam size is about 10–20% smaller than suggested by the simulations. The horizontal beam size is about 10%smaller than theµ− simulations but wider than theµ+ simulations.
8
p cat TOF1 (MeV/ )z
DataSimulationReconstructed Simulation
p cat TOF1 (MeV/ )z
p cat TOF1 (MeV/ )z
p cat TOF1 (MeV/ )z
p cat TOF1 (MeV/ )z
p cat TOF1 (MeV/ )z
(6, 140) m+(6, 140) m
-
(6, 200) m+(6, 200) m-
(6, 240) m+(6, 240) m-
Figure 7: Reconstructed longitudinal momentum distributions at TOF1 for six MICE beams compared with simu-lations. The dotted (red), dash-dotted (blue) and shaded distributions are simulation, reconstructed simulation anddata respectively. Distributions are normalised to contain equal numbers of events.
9

x
y y y
x x
Figure 8: Spatial distributions in the transverse plane at TOF1 for simulation (left), reconstructed simulation(centre), and data (right) for a (6, 200)µ− beam, normalised to the same total contents. Simulated muons in theshaded area cross uncalibrated regions of TOF1 and are excluded from further analysis.
Figure10 shows the horizontal (x,x′) and vertical (y,y′) trace-space distributions at TOF1 for the (6, 200)µ−
beam and the same distributions from the simulations with and without smearing due to the reconstruction. Thereis very good qualitative agreement between data and reconstructed simulations in both the horizontal and verticaltrace spaces. The smearing due to the reconstruction is apparent. The distributions have a dense core and diffusehalo. The boundaries of the distributions reflect the apertures of the quadrupoles, principally Q9, transported to theTOF1 measurement plane downstream, and the size of TOF1. Thevertical divergence of the beam is approximatelythree times smaller than the horizontal divergence.
Figure11shows thex andy amplitude distributions of muons in the (6, 200)µ− beam at TOF1 in terms ofχ2x,y
whereχ2
x = [(x− x̄),(x′− x̄′)]Σ−1x [(x− x̄),(x′− x̄′)]T = Ax/εx ,
Ax is the amplitude of a muon in trace-spacea andεx =√
detΣx is the emittance of the ensemble. The distributionsof χ2 for the reconstructed simulation are shown for comparison.The initial exponential behaviour of the distri-bution suggests that the beam has a quasi-Gaussian core up toχ2 ≈ 6 and a non-Gaussian tail. The high amplitudetails of the distributions are slightly larger for the data than for the simulation.
4.3 Determination of emittances and effective optical parameters
The optical parameters and emittances of each beam were determined from the covariance matrices [22] as
εx =√
detΣx,
βx =Σ11
εx,
αx = −Σ12
εx,
and similarly fory. Each of the beams, however, has a large momentum spread andα andβ vary with momen-tum. The parameters determined from the measurements are therefore effective parameters which describe thedistributions in trace-space.
The reconstructed covariance matrices at TOF1 will differ from the true covariance matrices because of thefinite spatial and angular resolution of the reconstruction, and multiple scattering in the air between the TOFs(which cannot be included in the simple transfer matrices used). The finite resolution leads to a small increase inthe apparent emittance of the beams; scattering will lead toan underestimate of the emittances.
A small correction was made for the effects of resolution andscattering by subtracting a “resolution” matrixfrom each measured covariance matrix. The resolution matrices were estimated from the simulations by taking thedifference between the covariance matrices of the reconstructed and true simulated beams. These resolution ma-trices were subtracted from the measured covariance matrices to obtain corrected, measured covariance matrices,
aThis is sometimes referred to as ‘single particle emittance’ [ 21].
10
x
p c(MeV/ )z
y
p c(MeV/ )z
Figure 9: Root mean square beam widths,σx, σy, at TOF1 versuspz. Solid black circles:µ− data, openblack circles: µ+ data, solid red triangles:µ− simulation, open red triangles:µ+ simulation. The nominal“ pz = 140” MeV/c beams correspond to momenta in the range 170–190MeV/c, “ pz = 200” to 220–250MeV/c,and “pz = 240” to 250–290MeV/c.
i.e.,
ΣCorrected = ΣMeasured−ΣResolution
= ΣMeasured− (ΣReco−sim−ΣTrue−sim) .
Since simulations were made for only the six (6π mm-rad,pz) beams, the resolution matrices estimated for thesebeams have been used to correct the measured covariance matrices for other beams at the same nominal momentum.As variances are very sensitive to outliers, muons in the high amplitude tails of the(x,x′) and(y,y′) distributionswere excluded by requiringχ2
x,y < 6 before the corrected covariance matrices were calculated. The ellipses onFigure10show the areas of the distributions included by this cut.
Figure12 shows, for the six beams for which simulations were made, thehorizontal (x,x′) RMS emittanceellipses for the uncorrected data, the data after correction for resolution and the true simulation. The effect ofthe resolution correction is to reduce the apparent emittance of the beams and to rotate the ellipses into betteralignment with the true simulation.
The measured emittances discussed below have not been corrected upward for theχ2x,y < 6 requirement, which
has also been applied to the simulated data, because the longnon-Gaussian tail of the amplitude distribution (seeFigure11) is not well-described by the simulations. For a pure Gaussian distribution 5% of the muons would haveχ2 > 6 and the correction would increase the measured values of emittance by approximately 20%.
Figure13 shows the measured horizontal emittances, after resolution correction, of all the seventeen beamsversus the meanpz of the beam and the true emittances of the six simulated beams. The correction reduces themeasured emittances by 0.6π mm-rad on average; the largest correction is−0.7π mm-rad for the (10,140)µ+
beam. Figure14 shows the measured vertical emittances of all the seventeenbeams versus the meanpz of thebeam and the emittances of the six simulated beams. The correction increases the measured vertical emittancesby about 10%. Clipping occurs in the vertical plane as Q4 and Q7 are vertically defocusing. This collimates thebeam, resulting in more uniform emittances compared to the horizontal plane.
11

at TOF1 (mm)x
-200 -150-100 -500 50 100 150 200
atT
OF
1(r
ad
)x’
-0.2
-0.15
-0.1
-0.05
0
0.05
0.1
0.15
0.2
at TOF1 (mm)y
-200-150 -100 -500 50 100 150 200
atT
OF
1(r
ad
)y’
-0.06
-0.04
-0.02
0
0.02
0.04
0.06
at TOF1 (mm)x
-200 -150-100 -500 50 100 150 200
atT
OF
1(r
ad
)x’
-0.2
-0.15
-0.1
-0.05
0
0.05
0.1
0.15
0.2
at TOF1 (mm)y
-200-150 -100 -500 50 100 150 200
atT
OF
1(r
ad
)y’
-0.06
-0.04
-0.02
0
0.02
0.04
0.06
at TOF1 (mm)x
-200 -150-100 -500 50 100 150 200
atT
OF
1(r
ad
)x’
-0.2
-0.15
-0.1
-0.05
0
0.05
0.1
0.15
0.2
at TOF1 (mm)y
-200-150 -100 -500 50 100 150 200
atT
OF
1(r
ad
)y’
-0.06
-0.04
-0.02
0
0.02
0.04
0.06
Simulation
Reconstructed Simulation
Data
0
0
0
0
0
0
Figure 10: Horizontal (x) and vertical (y) trace space distributions at TOF1 for simulation (top), reconstructedsimulation (centre) and data (bottom) for a (6, 200)µ− beam. The ellipses correspond toχ2 = 6 (see text).
12

at TOF1x2χ
0 2 4 6 8 10 12 14 16 18 201
10
210
310
410
at TOF1y2χ
0 2 4 6 8 10 12 14 16 18 20
1
10
210
310
410Data
Reconstructed Simulation
Figure 11: Distributions ofχ2 for data (solid, shaded, black) and reconstructed simulation (dash-dot, blue) for the(6, 200)µ− beam. Left: horizontalχ2; right: verticalχ2 at TOF1.
Nominal (MeV/ )p cz
x at TOF1 (mm)
x’atT
OF
1 (
rad)
Simulation
Raw Data
Corrected Data
Figure 12: RMS emittance ellipses in (x,x′) trace-space for data without correction for the measurement resolution(black dotted line), corrected data (black solid line) and true simulation (red dashed line).
4.4 Systematic uncertainties
The error bars shown on Figures 13 and 14 include both statistical and systematic errors. Sources of systematicerror fall into three broad categories; those that affect the transverse position measurement, momentum reconstruc-tion, and path length corrections. The largest contribution to the uncertainty on the emittance measurement derivesfrom the effective speed of light in the TOF slabs, which directly determines the measured RMS width of thespatial and angular distributions. The various sources, summarised in Table 2, were determined by examining thechange in the reconstructed emittance and optical parameters when the positions of the TOF detectors and magnetcurrents were varied in simulation.
The TOF offsets arise from the uncertainty on their surveyedpositions in the beam line. In each instance, asimulation was produced with one TOF offset by up to 1 cm inx,y or z and the muon positions recorded. Thesepositions were input into the reconstruction procedure, which assumes the beam line elements are located as givenby survey. The largest uncertainty occurs when the TOFs are offset in the longitudinal (z) direction, which directlyaffects the momentum measurement by altering the distance∆L.
The uncertainty on the quadrupole triplet position in survey was investigated in the same manner as for theTOFs. However, since this does not affect the distance,∆L, it has a negligible effect on the momentum calculationand a plays a minor role in the path length correction assigned to a muon. The currents in the quadrupoles areknown to better than 1%, and the effect of changing these currents was determined. A change in the quadrupole
13

x
p c(MeV/ )z
Figure 13: Horizontal emittance after correction for measurement resolution and multiple scattering versus meanpz of the seventeen measured beams. Solid black circles:µ− data, open black circles:µ+ data, solid red triangles:µ− simulation, open red triangles:µ+ simulation. The nominal “pz = 140” MeV/c beams correspond to momentain the range 170–190MeV/c, “ pz = 200” to 220–250MeV/c, and “pz = 240” to 250–290MeV/c.
y
p c(MeV/ )z
Figure 14: Vertical emittance after correction for measurement resolution and multiple scattering versus meanpz
of the seventeen measured beams. Solid black circles:µ− data, open black circles:µ+ data, solid red triangles:µ− simulation, open red triangles:µ+ simulation. The nominal “pz = 140” MeV/c beams correspond to momentain the range 170–190MeV/c, “ pz = 200” to 220–250MeV/c, and “pz = 240” to 250–290MeV/c.
14

Table 2: Contributions to the errors on the emittance measurements as percentage relative error.
Source δεx δαx δβx δηx δη ′x δεy δαy δβy δ pz
TOF1 offsetsx 0.47 0.74 0.47 1.39 0.69 0.014 0.05 ≈ 0 ≈ 0y ≈ 0 0.01 ≈ 0 0.29 0.17 0.02 0.06 ≈ 0 0.71
TOF0 offsetsx 0.04 0.07 0.03 0.13 0.22 ≈ 0 0.08 0.01 ≈ 0y ≈ 0 ≈ 0 ≈ 0 0.02 ≈ 0 ≈ 0 ≈ 0 ≈ 0 ≈ 0
∆L 2.10 0.32 2.11 1.69 3.30 2.74 30.17 2.78 0.71Q789 currents 0.051 ≈ 0 0.03 0.008 0.02 0.04 0.036 0.035 0.002
Q789 offsetsx 0.08 0.13 0.08 0.17 0.99 ≈ 0 0.08 0.01 ≈ 0y ≈ 0 ≈ 0 ≈ 0 0.01 ≈ 0 ≈ 0 0.01 ≈ 0 ≈ 0
Effectivec in scintillator 4.87 0.05 5.23 2.22 1.59 4.05 41.27 4.09 0.11
Total (%) 5.32 0.82 5.66 3.14 3.87 4.89 51.12 4.94 1.02
current by 1% has a small effect on the reconstructed path length of a muon, when compared to the nominalcurrents, and is a minor source of uncertainty on the emittance measurement. The uncertainty onpz has a muchlarger effect on the transfer matrix used than any scaling due to an uncertainty on the quadrupole currents (cf.Figure4).
4.5 Results
The measured emittances and optical parameters are given inTable3. The horizontal and vertical beta functionslie in the ranges 1.49 m< βx < 2.22 m and 3.07 m< βy < 3.81 m. The values of the horizontal and verticalαparameters, 0.45< αx < 0.59 and−0.56< αy < −0.22, show that the beams converge to a horizontal focusroughly 700 mm downstream of TOF1 but diverge vertically. The emittances will be increased by scattering inTOF1.
The measured horizontal emittances and simulations agree to within 10%. Some of the emittance of the beamscan be attributed to multiple scattering in TOF0. The emittance growth inx (y) is expected to be∆ε2
x,y = σ2x,yθ 2
mswhere
θ 2ms= (13.6MeV/c)2/(p2β 2)∆X/X0
is the mean square scattering angle in the∆X = 0.125X0 of material in TOF0. For 200 MeV/c muons andσx =70 mm,∆ε = 1.9π mm-rad for a beam of zero divergence, although the effectiveemittance at TOF1 is limited bythe aperture of the Q7–9 triplet. The fall in measured emittance with increasingpz seen in Figures13 and14 canbe attributed to scattering via the dependence ofθms on pz.
There is some emittance growth in the≈ 8 m of air between TOF0 and TOF1. Since the Q7–9 triplet focusseshorizontally but is weakly defocusing vertically, this emittance growth is less in the horizontal than the verticalplane. For an on-axis beam,δεy is estimated to be less than 0.4π mm-rad. The resolution correction describedpreviously includes a small upwards correction for this emittance growth, and has the largest effect on the measuredvertical emittance. The remaining disagreement between the measured and simulated vertical emittances can beattributed to the difference in RMS vertical beam sizeb shown in Figure9.
The measured horizontal emittances shown in Figure13 include (for both data and simulation) the effect ofdispersion. The dispersion inx at the exit of the D2 bending magnet is transformed by the optics of the beamtransport into dispersion inx andx′ at the TOF1 measurement plane. The intrinsic horizontal emittances of thebeams have been obtained from the covariance matrices by subtracting the dispersion characterised byη andη ′
[23]:
Σ11 → Σ11−η2δ 2
Σ12 → Σ12−ηη ′δ 2
Σ11 → Σ11−η ′2δ 2
whereη = 〈xδ 〉/〈δ 2〉, η ′ = 〈x′δ 〉/〈δ 2〉 andδ = (pz − p̄z)/ p̄z. Figure15 showsη versus〈pz〉 for all the beamsand the simulations for the three negative beams. The dispersions are similar for theµ+ andµ− beams and arereproduced by the simulations for the negative beams. The positive beam simulations are not shown as they did notreproduce the data well. The reason for this is under investigation. The dispersion-corrected intrinsic horizontal
bThe RMS beam size in Figure9 is calculated and shown without theχ2 < 6 cut to demonstrate the physical size of the beam, whereas theemittance calculation includes it.
15

Table 3: The characterised Step I beams.
Beam 〈pz〉 (MeV/c) σpz (MeV/c) εx (π mm-rad) αx βx(m) εy (π mm-rad) αy βy (m)
εN pz
µ−
3140 171.58±2.39 22.81± 0.32 2.28±0.12 0.50±0.01 1.49±0.09 0.95±0.05 -0.55±0.28 3.62±0.18200 223.24±2.72 24.02± 0.29 1.74±0.09 0.49±0.01 1.69±0.10 0.78±0.04 -0.50±0.25 3.71±0.19240 260.55±3.24 24.49± 0.30 1.49±0.08 0.49±0.01 1.80±0.10 0.75±0.04 -0.41±0.21 3.65±0.18
6140 176.43±2.27 22.83± 0.29 2.17±0.12 0.52±0.01 1.57±0.09 0.96±0.05 -0.54±0.28 3.64±0.18200 232.22±2.51 23.62± 0.26 1.53±0.08 0.55±0.01 1.85±0.10 0.78±0.04 -0.51±0.26 3.80±0.19240 270.96±3.65 24.53± 0.33 1.51±0.08 0.48±0.01 1.80±0.10 0.73±0.04 -0.39±0.20 3.51±0.18
10140 183.46±2.35 22.75± 0.29 2.01±0.11 0.53±0.01 1.62±0.09 0.92±0.05 -0.56±-0.29 3.68±0.18200 247.23±3.56 24.20± 0.35 1.23±0.07 0.59±0.01 2.22±0.13 0.75±0.04 -0.52±-0.27 3.81±0.19240 281.89±3.65 25.28± 0.33 1.65±0.09 0.56±0.01 1.82±0.10 0.64±0.03 -0.39±0.20 3.40±0.17
µ+
3200 222.69±2.40 26.49± 0.29 1.98±0.11 0.49±0.01 1.58±0.09 0.83±0.04 -0.40±0.20 3.44±0.17240 257.97±2.83 26.37± 0.29 1.59±0.08 0.57±0.01 1.87±0.11 0.76±0.04 -0.31±0.16 3.40±0.17
6140 176.45±1.98 24.36± 0.27 2.32±0.12 0.45±0.01 1.50±0.09 0.95±0.05 -0.48±0.25 3.59±0.18200 229.16±2.36 25.87± 0.27 1.91±0.10 0.50±0.01 1.61±0.09 0.81±0.04 -0.38±0.19 3.42±0.17240 267.65±2.85 25.79± 0.28 1.69±0.09 0.54±0.01 1.76±0.10 0.76±0.04 0.26±0.14 3.23±0.16
10140 182.42±2.05 23.87± 0.27 2.16±0.12 0.47±0.01 1.56±0.09 0.92±0.05 -0.48±0.24 3.59±0.18200 243.39±2.65 26.77± 0.29 1.66±0.09 0.51±0.01 1.78±0.10 0.78±0.04 -0.38±0.19 3.37±0.17240 274.77±2.94 24.79± 0.27 1.78±0.09 0.51±0.01 1.65±0.09 0.76±0.04 -0.22±0.11 3.07±0.15
16

x(m
m)
p c(MeV/ )z
Figure 15: The horizontal dispersion coefficient,η , versus meanpz for the seventeen beams. Solid black circles:µ− data, open black circles:µ+ data, Solid red triangles:µ− simulation smeared with measurement resolution.The nominal “pz = 140” MeV/c beams correspond to momenta in the range 170–190MeV/c, “ pz = 200” to 220–250 MeV/c, and “pz = 240” to 250–290MeV/c.
emittances andη andη ′ are given in Table4. The intrinsic horizontal emittances are, on average, 0.25π mm-radsmaller than the effective horizontal emittances.
5 Summary
A single-particle method for measuring the properties of the muon beams to be used by MICE has been developed.Timing measurements using two time-of-flight counters allow the momentum of single muons to be measuredwith a resolution of better than 4 MeV/c and a systematic error of< 3 MeV/c. The ability to measurepz to thisprecision will complement the momentum measurements of thesolenoidal spectrometers. For low transverseamplitude particles, the measurement ofpz in the TOF counters is expected to have better resolution than that ofthe spectrometers, which are primarily designed for measuring pt .
The same method allows the trace-space distributions at theentrance to MICE to be measured to≈ 5% andhence the emittances and dispersions of the beams. The emittances are found to be approximately 1.2–2.3π mm-rad horizontally and 0.6–1.0π mm-rad vertically; the average horizontal dispersion,η , is measured to be 129 mm,although it depends on the nominal(εN , pz) beam setting. The positive and negative muon beams are foundto havevery similar properties.
As a final check on the suitability of the beams for use by MICE,a set of measured muons for the (6, 200)baseline beam was propagated from TOF1 to the diffuser and through a simulation of the experiment. Evenwithout further software selection (for example, on the rather asymmetric momentum distribution) the beam wasfound to be relatively well matched [24]. In practice, some further fine-tuning of the magnet currents and diffuserthickness should be sufficient to generate a well-matched beam suitable for the demonstration of ionisation coolingby MICE.
Acknowledgements
The work described here was made possible by grants from Department of Energy and National Science Founda-tion (USA), the Instituto Nazionale di Fisica Nucleare (Italy), the Science and Technology Facilities Council (UK),the European Community under the European Commission Framework Programme 7, the Japan Society for thePromotion of Science and the Swiss National Science Foundation, in the framework of the SCOPES programme,whose support we gratefully acknowledge. We are also grateful to the staff of ISIS for the reliable operation ofISIS.
17

Table 4: Horizontal dispersion and the intrinsic emittances of the Step I beams.
Beam ηx (mm) η ′x (rad) εx (π mm-rad) αx βx (m)
εN pz
µ−
3140 90.28 0.07 2.08±0.11 0.60±0.01 1.56±0.09200 123.78 0.09 1.53±0.08 0.65±0.01 1.82±0.10240 137.58 0.11 1.26±0.07 0.68±0.01 1.99±0.11
6140 89.37 0.08 1.97±0.11 0.64±0.01 1.66±0.09200 106.27 0.10 1.31±0.07 0.72±0.01 2.06±0.12240 157.91 0.11 1.26±0.07 0.68±0.01 1.98±0.11
10140 96.03 0.07 1.83±0.10 0.64±0.01 1.71±0.10200 132.78 0.08 1.04±0.06 0.79±0.01 2.47±0.14240 145.71 0.11 1.40±0.08 0.75±0.01 2.02±0.12
µ+
3200 122.96 0.03 1.85±0.10 0.56±0.00 1.58±0.09240 156.47 0.03 1.45±0.08 0.66±0.01 1.87±0.11
6140 95.91 0.04 2.18±0.12 0.52±0.00 1.51±0.09200 131.16 0.04 1.76±0.09 0.58±0.00 1.62±0.09240 172.97 0.04 1.54±0.08 0.64±0.01 1.76±0.10
10140 103.27 0.04 2.03±0.11 0.54±0.01 1.57±0.09200 138.50 0.03 1.53±0.08 0.59±0.01 1.78±0.10240 189.64 0.04 1.61±0.09 0.61±0.01 1.64±0.09
References
[1] S. Ozaki, R. Palmer, M. Zisman, J. Gallardo, FeasibilityStudy-II of a Muon-Based Neutrino Source. Tech.rep. (2001). BNL-52623
[2] J.S. Berg,et al., Phys. Rev. ST Accel. Beams9, 011001 (2006)
[3] S. Choubey,et al., International Design Study for the Neutrino Factory, Interim Design Report. Tech. rep.(2011)
[4] M. Apollonio, et al., Journal of Instrumentation4(7), 07001 (2009)
[5] M. Palmer,et al., (13th International Particle Accelerator Conference (IPAC 13), Shanghai, China, 2013)
[6] R.C. Fernow, R.B. Palmer, Phys. Rev. ST Accel. Beams10, 064001 (2007)
[7] A. Blondel,et al., Proposal to the Rutherford Appleton Laboratory: an international muon ionization coolingexperiment (MICE). Tech. rep. (2003). URLhttp://mice.iit.edu/mnp/MICE0021.pdf. MICE-NOTE-21
[8] M. Ellis, et al., Nucl. Inst. Meth. A659(1), 136 (2011)
[9] M. Bogomilov,et al., Journal of Instrumentation7(5), 05009 (2012)
[10] C.N. Booth,et al., Journal of Instrumentation8(03), 03006 (2013)
[11] R. Bertoni,et al., Nucl. Inst. Meth. A615(1), 14 (2010)
[12] M. Bonesini, R. Bertoni, A. de Bari, M. Rossella, Nucl. Inst. Meth. A693(0), 130 (2012)
[13] R. Bertoni,et al., Tech. rep. (2011). URLhttp://mice.iit.edu/mnp/MICE0337.pdf. MICE-NOTE-DET-337
[14] M.A. Rayner, Ph.D. thesis, Oxford University, University of Oxford, UK (2011)
[15] K. Tilley, D. Adams, P. Drumm, T. Roberts, K. Walaron, (10th European Particle Accelerator Conference(EPAC 06), Edinburgh, Scotland, 2006), pp. 2397–2399
18

[16] T.J. Roberts, A Swiss army knife for Geant4, optimized for simulating beam lines. URLhttp://www.muonsinternal.com/muons3/G4beamline
[17] K.T. McDonald, D.P. Russell, inFrontiers of Particle Beams; Observation, Diagnosis and Correction, Lec-ture Notes in Physics, Berlin Springer Verlag, vol. 343, ed. by M. Month, S. Turner (1989),Lecture Notes inPhysics, Berlin Springer Verlag, vol. 343, pp. 122–132. DOI 10.1007/BFb0018284
[18] C.A. Systems,Vector Fields Simulation Software. URL http://www.cobham.com
[19] C. Rogers, R. Sandstromm, (10th European Particle Accelerator Conference (EPAC 06), Edinburgh, Scotland,2006), pp. 2400–2402
[20] T.M. collaboration, Particle identification in the lowmomentum MICE muon beam. In preparation
[21] K. Wille, The Physics of Particle Accelerators (Oxford University Press, 2000)
[22] J.B. Rosenzweig,Fundamentals of beam physics (Oxford University Press, 2003)
[23] L. Merminga, P. Morton, J. Seeman, W. Spence, Conf.Proc. C910506, 461 (1991)
[24] M.A. Rayner, (12th International Workshop on Neutino Factories, Superbeams and Beta Beams (nuFACT10), Mumbai, India, 2010), pp. 193–195
19