coolidge corner study committee - brookline, ma
TRANSCRIPT

COOLIDGE CORNER STUDY COMMITTEE
Finance Subcommittee
April 24, 2017

COOLIDGE CORNER STUDY COMMITTEE
Finance Subcommittee
Subcommittee Members • Amy Anthony • Ken Lewis • Susan Roberts • Neil Wishinsky
“Ex Officio” Members • Roger Blood • Sergio Modigliani
Planning & Community Development Dept. • Andy Martineau

COOLIDGE CORNER STUDY COMMITTEE Finance Subcommittee – April 24, 2017 Disclaimer • All slides are presented for discussion purposes only
• No slides represent final conclusions or opinion of the Subcommittee
• Sample pro forma templates do not represent actual development proposals
feetmeters
1000300
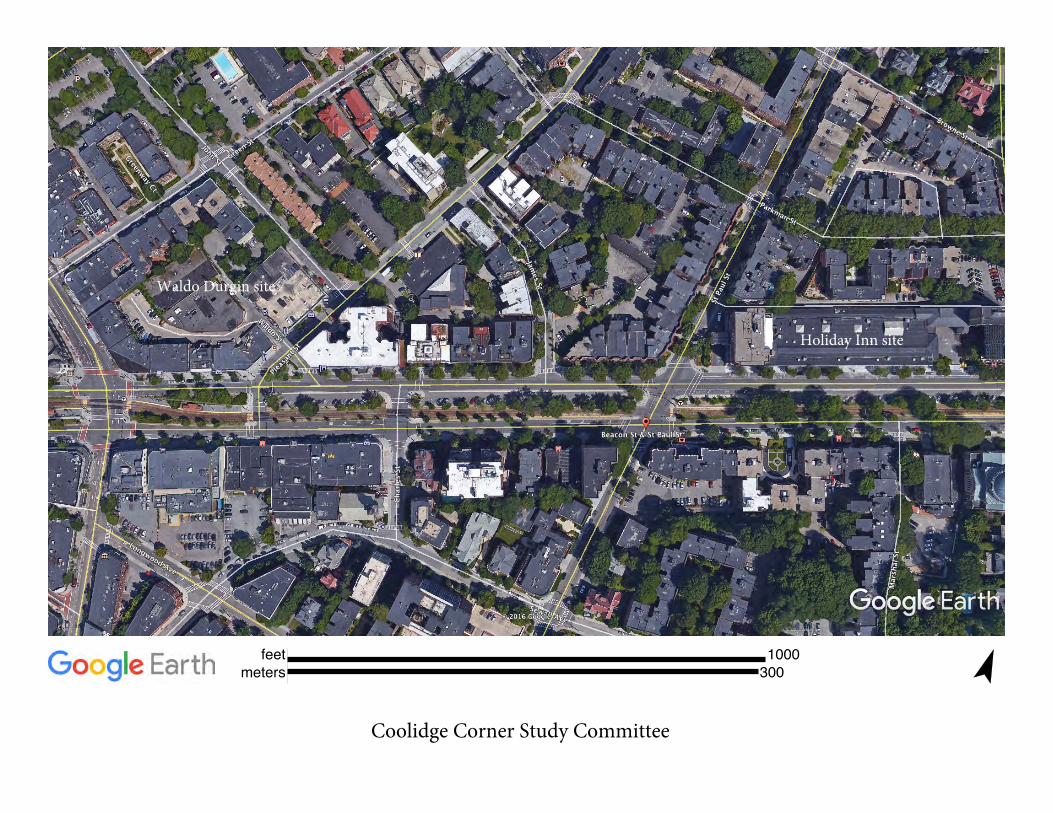
Holiday Inn site
Waldo Durgin site
Coolidge Corner Study Committee

COOLIDGE CORNER STUDY COMMITTEE Finance Subcommittee
Key Questions to Address in Financial Feasibility Analysis Quantitative Analysis • Scale required to make redevelopment of the site financially feasible?
• Uses that can afford new construction rents?
• Required parking ratios - impact on project cost and scale?
• Public benefits the development could support?
o Off-site improvements, civil spaces, etc.
• Projected tax revenues from the new development? o Comparison to existing use and 40-B option
• Alternative funding sources to subsidize Affordable Units?

COOLIDGE CORNER STUDY COMMITTEE Finance Subcommittee
Key Questions to Address in Financial Feasibility Analysis Qualitative Considerations • Impact of new commercial development on existing Brookline businesses?
• Impact of new residential development on existing Brookline businesses?
• Impact of new residential development on Town services?
• Value of additional Affordable Units – SHI threshold?

COOLIDGE CORNER STUDY COMMITTEE Finance Subcommittee - Topics • Key Questions to Address in Financial Feasibility Analysis
• Mixed Use Metrics & Ratios
• Financial Feasibility Process
• Limitations
• Real Estate Development – Few Key Concepts
• Site Specific Issues –Holiday Inn & Waldo Durgin
• Parking
• Tax Revenue
• Hotel Market Segmentation
• Sample Development Pro Forma Template

COOLIDGE CORNER STUDY COMMITTEE
Mixed Use Development - Metrics
Use
Units of Measurement & Ratios
Land
Total Square Feet Building SF / Land Area = Floor Area Ratio (FAR) Open Space Ratios
Hotel Gross Square Feet Per Room or Key Average Daily Rate x Occupancy = RevPar
Multi-Family Residential Gross Square Feet Per Unit Unit Mix by Bedrooms Rent Per Rentable SF Per Month – Apartments Price Per Square Foot - Condos
Retail Space Rentable Square Feet Annual Net Rent Per RSF Percentage Rent Pro-Rata Share of CAM & Tax
Restaurants Rentable Square Feet Number of Seats Annual Net Rent Per RSF Percentage Rent Pro-Rata Share of CAM & Tax
Parking Per Space Ratio Per 1,000 SF / Room / Unit / Seat Annual / Monthly / Daily Rate

COOLIDGE CORNER STUDY COMMITTEE
Financial Feasibility Process
• Proposed Development Program
o Mixed Use Profile – Use by Building & Floor o Parking: Total Spaces & Location o Commercial Space: Gross & Rentable SF o Hotel: Number of Keys / Brand / Food & Beverage / Meeting Space o Residential Space: Gross & Rentable SF o Residential Space: Market Rate & Affordable - Unit Mix
• Project Net Operating Income
o Revenue by Type of Space o Operating Expenses
• Development Budget
o Land Acquisition o Hard Cost o Soft Cost
• Investment Returns
o Return on Cost vs. Market Capitalization Rate o Return on Equity o Loan to Value & Debt Service Coverage Ratios
• Sensitivity Analysis

COOLIDGE CORNER STUDY COMMITTEE Financial Feasibility Process Independent Financial Consultant – Pamela S. McKinney, MAI, CRE • Professional Experience
o 35+ Years Experience in Real Estate Consulting & Valuation o President - Byrne McKinney & Associates o Senior Vice President - Leggat McCall Advisors o Senior Vice President – Minot DeBlois & Madison
• Certifications
o CRE Designation - Society of Real Estate Counselors o MAI Designation – Appraisal Institute o Qualified Expert Witness – Norfolk & Suffolk Counties, Mass Land Court
• Brookline Consulting Assignments
o River Road Study Committee o Davis Path Study Committee o Two Brookline Place Study Committee o Residential Market Study o Family Ties – Dad Lives in Coolidge Corner

COOLIDGE CORNER STUDY COMMITTEE Finance Subcommittee Limitations to Financial Analysis
Past performance is no guarantee of future results • Macro economic factors
o Capital markets – interest rates, lending regulations o Event risk
• Regional market changes
o Supply – new permits & redevelopment projects o Demand – competition for construction labor & materials
• Project specific
o Permitting requirements – Special Permit conditions o Building design and materials – Design Advisory Team o Subsurface conditions o Development and tax certainty agreements

COOLIDGE CORNER STUDY COMMITTEE Finance Subcommittee
Real Estate Development – Few Basic Concepts • Economy of scale
o Fixed & variable costs o “Staircase” declining marginal cost curve o Floor plate efficiency – depth to window line / corridor o Optimal mix of size / cost / operating efficiency
• Long cycle business – conception to completion
o Time > Uncertainty > Business risk o Town Meeting vote on ZBL > Political risk
• OPM = Other People’s Money
o Equity investors - Risk adjusted returns o Construction Lenders - Refinancing risk

COOLIDGE CORNER STUDY COMMITTEE
Real Estate Development – Cost Curves
COST
PROJECT SIZE
Total Cost ($M)
Cost PSF ($H)

feetmeters
300100
Coolidge Corner Study Committee - 1200 Beacon Street

COOLIDGE CORNER STUDY COMMITTEE Finance Subcommittee
Site Specific Issues
1200 Beacon Street - Holiday Inn • High value of existing improvements
• Value attribution to retained building components
o Six story hotel building o Underground parking
• Proximity of abutting residential
• Prominence of Beacon Street location
• Shared parking
o Across three uses o Abutter – medical office building lot?

COOLIDGE CORNER STUDY COMMITTEE
Parcel Summary - Development Sites - Brookline MA
Combined 700 Brookline AveExisting Conditions Durgin Waldo John St. Parking Lot Waldo-Durgin Holiday Inn (25 Washington)Zoning (see below) G-1.75 G-1.75 M-2.0 1.78 M-2.0 I-(EISD)Parcel SF 18,060 31,689 7,873 57,622 69,418 19,051Building SF 42,156 11,038 n/a 53,194 134,182 153,500# Rooms/Units n/a n/a n/a 225 175Parking 30 42 22 94 105 70Floors 3 1 n/a 6 11FAR 2.33 0.35 n/a 0.92 1.93 8.06FY 16 Assessed Value $6,153,800 $3,235,800 $1,395,900 $10,785,500 $41,238,600 $4,625,900FY 16 Taxes $104,553 $28,588 $23,716 $156,857 $700,644 $55,134FY 16 Taxes / Building SF $2.48 $2.59 n/a $2.50 $5.22 n/aFY 16 Taxes / Land SF $5.79 $0.90 $3.01 $2.72 $10.09 $2.89Purchase Price $11,000,000 $2,500,000 $63,000 $13,563,000 $74,000,000 $5,600,000Price Per SF of Land $609 $79 $8 $235 $1,066 $294Price Per Hotel Room n/a n/a n/a n/a $328,889 $32,000Acquisition Date 2/1/13 2/9/05 1/3/78
Higher of Price or A/V $11,000,000 $3,235,800 $1,395,900 $15,631,700Price Per SF of Land $609 $102 $177 $271
Additional SF dedicated for internal right of way 3,378 Total Land Area 61,000
Footnotes(1) W-D combined zoning FAR based on weighted average(2) W-D combined taxes per building SF weighed average of Durgin & Waldo (3) FY 16 A/V and taxes for 700 Brookline Ave. prio to up-zoning approval for 153,500 SF(4) Price per hotel room for HI based on existing rooms; for 700 Brookline based on land price only(5) Site includes easement for shared internal right of way with adjacent retail buildings(6) Data for 700 Brookline Ave. provided for comparison; recent ZBL amendment(7) Sources: Town of Brookline Assessor's data base; Brookline ZBL

feetmeters
300100
Coolidge Corner Study Committee - Waldo Durgin Site

COOLIDGE CORNER STUDY COMMITTEE Finance Subcommittee
Site Specific Issues
Waldo-Durgin • Proximity to CBD 100% corner
o Significantly underutilized site o Integration with surrounding uses o External mitigation requirements o Absence of primary commercial street frontage
• Proximity of abutting residential
• Internal circulation - queuing capacity, shared easement
• Demolition scope & cost
• Shared parking across three uses
• 40-B Comprehensive Permit Application filing

COOLIDGE CORNER STUDY COMMITTEE
Parking Issues

COOLIDGE CORNER STUDY COMMITTEE
Parking Issues
• Seeking the Goldilocks solution
• Alternative perspectives regarding ratioso Field of Dreams – Build it and they will come (by car!)o Musical Chairs – Trolling to find a space (in my neighborhood!)
• Expensive to build especially underground spaces
• Market demand – demographics, condo vs. apt.
• Lender requirements
• Hotel brand requirements
• Brookline’s ZBL existing minimum ratios
• Technology changes – Zip Car, Uber, Lyft, Self driving cars
• MBTA capacity – Transit Oriented Development (TOD)
• Overnight street parking ban

COOLIDGE CORNER STUDY COMMITTEE Finance Subcommittee
Tax Revenue Projections – New Development Use Formula Estimated Range
Multi-Family Residential (a) Market Rate Units (b) Affordable Units
1.0% of A/V 1.0% of A/V
$5.00 - $6.00 PSF $3.00 - $4.00 PSF
Commercial Space 1.7% of A/V $9.00 - $10.00 PSF
Hotels (a) Property Tax (b) Excise Tax
1.7% of A/V 6.0% of Room Revenue
$9.00 - $10.00 PSF $2,500 - $3,500 Per Room Per Year $3.50 - $5.00 PSF
A/V = Assessed Value

COOLIDGE CORNER STUDY COMMITTEE
Hotel Market Segmentation
Price – Service Matrix
AVERAGE DAILY RATE
LUXURY
UPPER UPSCALE Brookline
UPSCALE Brookline
UPPER MIDSCALE
MIDSCALE
ECONOMY
SERVICE LEVEL LIMITED SELECT FULL RESORT

Brands/Chains are slotted by Chain Scale based on the previous year’s annual system wide (global) Average Daily Rate. Rate ranges defining each Chain Scale are determined by STR. The STR Chain Scales – North America and Caribbean is a subsetof the larger Global Chain Scale list. Brand Chain Scale pairings are consistent with each list. Brands listed above are located in U.S., Mexico, Caribbean and Canada. If you have any questions about the Chain Scales, please email [email protected]. Copyright 2016. STR, Inc. Publishing or reproducing this information is strictly prohibited. www.str.com +1 (615) 824 8664. Last updated May 2016.
STR Chain Scales – North America and Caribbean Luxury21c Museum Hotels AKA Andaz Belmond Conrad Dorchester Collection Edition Fairmont Four Seasons Grand Hyatt InterContinental JW Marriott Langham Loews Luxury Collection Mandarin Oriental Montage Palace Resorts Park Hyatt Ritz-Carlton RockResorts Rosewood Sixty Hotels Sofitel St Regis Taj The Peninsula Thompson Hotels Trump Hotel Collection Valencia Group Viceroy W Hotel Waldorf Astoria
Upper UpscaleAce HotelAffiniaAutograph CollectionClub QuartersCurio CollectionDeltaDolceEmbassy SuitesGaylordHard RockHiltonHyattHyatt Centric
Hyatt RegencyJoie De VivreKimptonLe MeridienMagnolia HotelMarriottMarriott Conference CenterMillenniumOmniOutriggerPan Pacific Hotel GroupPestanaPullmanRadisson BluRenaissanceSheratonStarhotelsSwissotelTribute PortfolioWarwick HotelsWestinWyndham
UpscaleAC Hotels by Marriottaloft HotelAscend CollectionAston HotelBest Western PremierCambria SuitesCanad InnCitizenM HotelsClub MedCoast Hotels & Resorts USACourtyard Crowne PlazaDisney HotelsDouble TreeelementEVEN HotelsFour PointsGraduate HotelsGrand AmericaGreat Wolf LodgeHilton Garden InnHomewood Suites
Hotel IndigoHyatt HouseHyatt PlaceLarkspur LandingLegacy Vacation ClubMeliaMiyako HotelsNovotelNYLO HotelPrince HotelRadissonResidence InnRoom MateShell Vacations ClubSonesta HotelSpringhill SuitesStaybridge SuitesStoney CreekVacation Condos by Outrigger
Upper MidscaleAyresAqua HotelsBest Western PlusBoarders Inn & SuitesCenterstone HotelsChase SuitesClarionCobblestoneComfort InnComfort SuitesCountry Inn & SuitesDoubletree ClubDrury InnDrury Inn & SuitesDrury Plaza HotelDrury SuitesFairfield InnGolden TulipHampton InnHampton Inn & SuitesHoliday InnHoliday Inn ExpressHome2 Suites by HiltonIsle of CapriLexingtonMOXY
OHANAOxford SuitesPark InnPhoenix InnRamada PlazaRed Lion HotelsSilver CloudSonesta ES SuitesTryp by WyndhamTownePlace SuitesWestmarkWyndham Garden HotelXanterra
Midscale3 Palms Hotels & ResortsA Victory HotelsAmericInnBaymont Inn & SuitesBest WesternCandlewood SuitesClubHouseCrossings by GrandStayCrystal InnFairBridge InnGrandStay Residential SuitesHawthorn Suites by WyndhamInnSuites HotelLakeview Distinctive HotelsLa Quinta Inn & SuitesMainStay SuitesOak Tree InnQuality InnRamadaRed Lion Inn & SuitesSettle InnShilo InnSleep InnVagabond InnVistaWingate by WyndhamYotel
EconomyAffordable Suites of AmericaAmerica’s Best InnAmerica’s Best Value InnBudget HostBudget Suites of AmericaBudgetelCountry Hearth Inn Crestwood SuitesCrossland SuitesDays InnEcono LodgeExtended Stay AmericaE-Z 8Family Inns of AmericaGood Nite InnGuestHouse InnHome-Towne SuitesHoward JohnsonInTown SuitesJameson InnKey West InnKnights InnLite HotelsMasters InnMicrotel Inn & Suites by WyndhamMotel 6National 9Passport InnPear Tree InnRed Carpet InnRed Roof InnRodeway InnSavannah SuitesScottish InnSelect InnStudio 6Suburban Extended StaySun Suites HotelsSuper 8TravelodgeValue PlaceWoodSpring Suites
COOLIDGE CORNER STUDY COMMITTEE
Smith Travel Research

COOLIDGE CORNER STUDY COMMITTEE
Hotel Market Segmentation (continued)
Other Market Niche Distinctions
• Business Traveler - Awards Programs• Boutique / Lifestyle• All Suites• Extended Stay• Micro Rooms• Vacation Ownership / Timeshare• Co-locating Two Brands

COOLIDGECORNERSTUDYCOMMITTEE
Kimpton Hotels – InterContinental Hotel Group

COOLIDGE CORNER STUDY COMMITTEE

COOLIDGE CORNER STUDY COMMITTEE
Marriott Autograph Collection

COOLIDGECORNERSTUDYCOMMITTEE
EVEN Hotels by InterContinental Hotel Group
COOLIDGE CORNER STUDY COMMITTEE
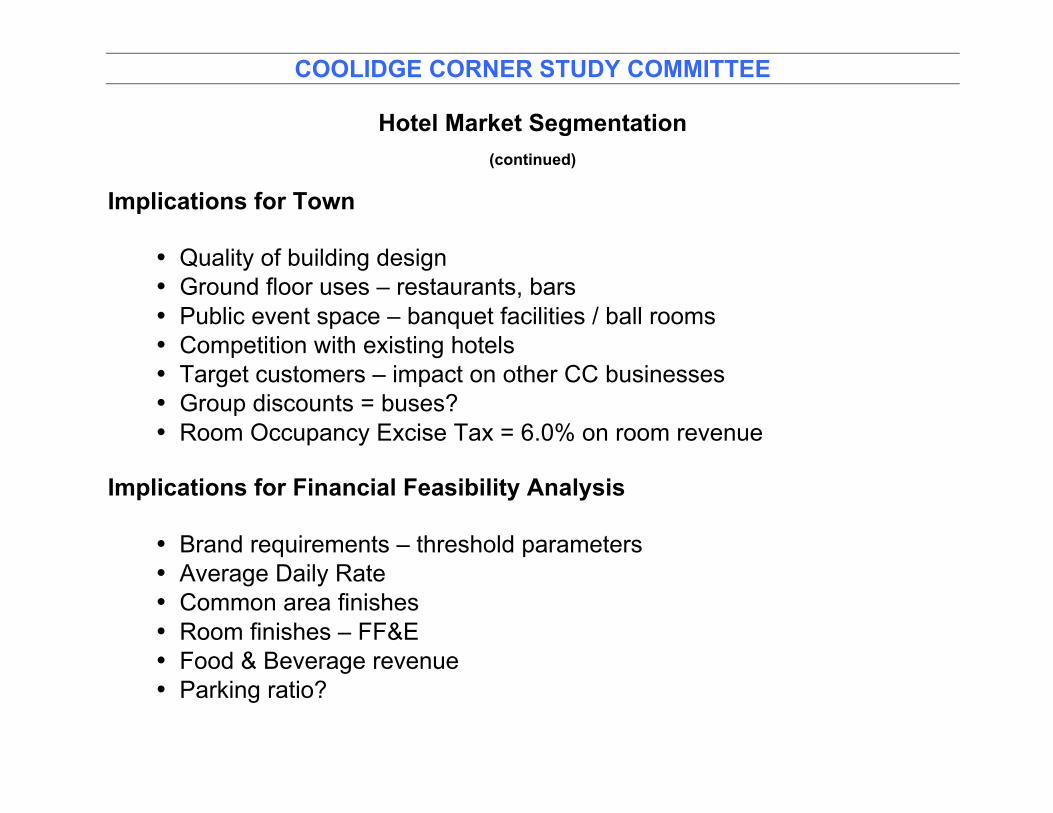
Hotel Market Segmentation (continued)
Implications for Town
• Quality of building design• Ground floor uses – restaurants, bars• Public event space – banquet facilities / ball rooms• Competition with existing hotels• Target customers – impact on other CC businesses• Group discounts = buses?• Room Occupancy Excise Tax = 6.0% on room revenue
Implications for Financial Feasibility Analysis
• Brand requirements – threshold parameters• Average Daily Rate• Common area finishes• Room finishes – FF&E• Food & Beverage revenue• Parking ratio?
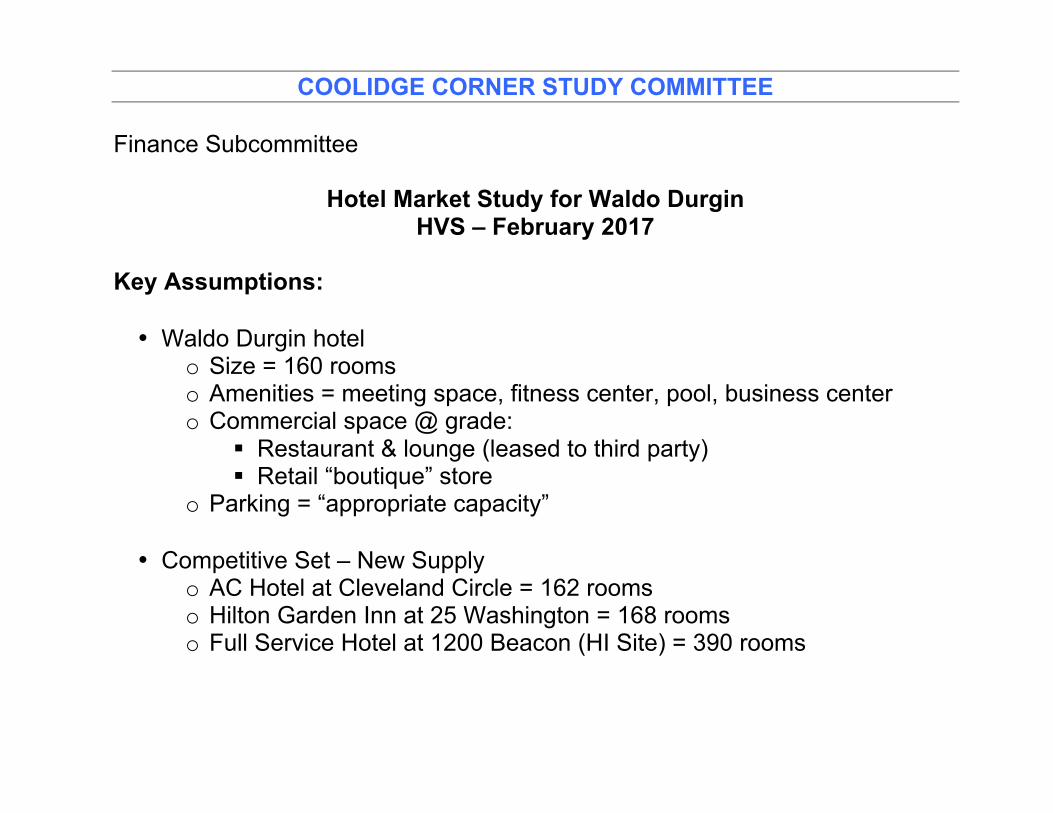
COOLIDGE CORNER STUDY COMMITTEE
Finance Subcommittee
Hotel Market Study for Waldo Durgin HVS – February 2017
Key Assumptions:
• Waldo Durgin hotelo Size = 160 roomso Amenities = meeting space, fitness center, pool, business centero Commercial space @ grade:
§ Restaurant & lounge (leased to third party)§ Retail “boutique” store
o Parking = “appropriate capacity”
• Competitive Set – New Supplyo AC Hotel at Cleveland Circle = 162 roomso Hilton Garden Inn at 25 Washington = 168 roomso Full Service Hotel at 1200 Beacon (HI Site) = 390 rooms

Hotel Market Study for Waldo Durgin HVS – February 2017
Key Findings & Recommendations:
• Brookline hotel marketo “Diversified and robust demand generators”o “Capable of absorbing the next cycle of new inventory”
• Hotel brand segmento Upper-upscale select serviceo Brand options: Canopy by Hilton, Kimpton, Hyatt Centric
• Revenue Projections – Competitive Submarketo Stabilized Occupancy = +/- 75%o Average Daily Rate 2016 = $234o ADR Growth Rate = 3.0 – 5.0% per annumo Subject Property ADR 2016 = $265 (113% of market average)

COOLIDGE CORNER STUDY COMMITTEE
Hotel - "Back of the Envelope" Pro Forma
Per Room NOI & Cost Daily Annual Daily Annual
Average Daily Rate $234.00 $265.00
Occupancy 75% 75%
RevPar $175.50 $64,058 $198.75 $72,544
Other Net Income 5% $8.78 $3,203 $9.94 $3,627
Total Income (1) $184.28 $67,260 $208.69 $76,171
Operating Expenses (2) 68% ($125.31) ($45,737) ($141.91) ($51,796)
Net Operating Income $58.97 $21,523 $66.78 $24,375
Development Cost (3) $300,000 $350,000
Return on Cost 7.2% 7.0%
Footnotes1 Excluding Food & Beverage, Banquet, Retail Space Rental2 Departmental, Undistributed, Fixed Expenses & Replacement Reserves3 Land, Building & Site, Soft Costs, FF&E, Pre-Opening Expenses

COOLIDGE CORNER STUDY COMMITTEE
Finance Subcommittee
Hotel Market Study for 1200 Beacon Street Pinnacle Advisory Group – April 2017
Key Assumptions:
• Mixed Use Developmento Dual branded select service hotel
§ Transient hotel = 234 rooms § Extended stay hotel = 156 rooms§ Total size = 390 rooms § Hotel restaurant = 5,000 SF§ Shared Amenities = meeting space, fitness center
o Residential building = 155 unitso Other retail & restaurant space @ grade = 17,500 SFo Parking = “adequate parking for hotel quests”
• Competitive Set – New Supply (beyond 1200 Beacon expansion)o AC Hotel at Cleveland Circle = 162 roomso Hilton Garden Inn at 25 Washington = 168 roomso Waldo Durgin site = 0 rooms

Hotel Market Study for 1200 Beacon Street Pinnacle Advisory Group – April 2017
Key Findings & Recommendations:
• Brookline hotel marketo “Expansion of LMA will drive growth to the local market”o “Large institutions (BC, BU) provide stability and growth potential”o “New supply will limit market occupancy potential”
• Hotel brand segmento Upscale select serviceo Brand options:
§ Aloft & Element§ Hyatt House & Hyatt Place§ EVEN & Staybridge
• Revenue Projections – Proposed Hotelo Stabilized Occupancy = 73%o Average Daily Rate 2022 = $273o ADR Growth Rate = 3.0% per annumo ADR 2016 (PV) @ 3.0% discount rate = $229

COOLIDGE CORNER STUDY COMMITTEE
Finance Subcommittee
Sample Development Pro Forma
Financial Feasibility Process - Recap
• Proposed Development Program
• Net Operating Income
• Development Budget
• Investment Returns
• Sensitivity Analysis - TBD

COOLIDGE CORNER STUDY COMMITTEE
Finance Subcommittee
Sample Development Pro Forma
• Mixed Use = Apartments with Commercial Space at Grade
• Land Area = 40,000 SF
• Gross Square Feet = 200,000
• Number of Floors = 10
• Apartments = 145 Units
• Commercial Space = 12,000 SF
• Parking = 100 Spaces in Underground Garage

COOLIDGE CORNER STUDY COMMITTEE
SAMPLE DEVELOPMENT PRO FORMA TEMPLATE DISCUSSION DRAFT
Development Scenario: Mixed Use - Apartments with Commercial Space at Grade
Development SiteLocation N/ALand Area - Square Feet 40,000
Building SummaryTotal Floors 10Height (feet) 105Floor Area Ratio 5.0
Space Allocation Floor Lobby & Amenities Commercial SF Residential SF Total Gross SF1 8,000 12,000 0 20,0002 0 0 20,000 20,0003 0 0 20,000 20,0004 0 0 20,000 20,0005 0 0 20,000 20,0006 0 0 20,000 20,0007 0 0 20,000 20,0008 0 0 20,000 20,0009 0 0 20,000 20,000
10 0 0 20,000 20,000Total 8,000 12,000 180,000 200,000
Excluded ExcludedType of Space Gross SF Common Area % Common Area Rentable SFLobby & Amenities 8,000 N/A N/A 0Commercial 12,000 N/A N/A 12,000Residential 180,000 15% (27,000) 153,000Total SF 200,000 (27,000) 165,000
Residential Units Number of Units Percent of Total Rentable SFMarket Rate 123 85% 130,050Affordable 22 15% 22,950Total 145 100% 153,000
Parking Total Spaces Parking RatiosUnderground Garage 100 Per 1,000 RSF: 0.6Grade 0 Per Apt. Unit 0.7 (exluding commercial space)Above Grade Garage 0Total 100

NET OPERATING INCOME
Base Rent Rentable SF Monthly Rent / RSF Annual Rent PSF Total Per Total SFCommercial 12,000 $4.17 $50.00 $600,000Residential - Market Rate 130,050 $4.55 $54.55 $7,093,845Residential - Affordable 22,950 $1.46 $17.52 $402,028Subtotal 165,000 $8,095,873 $40.48
Reimbursable Income - Commercial SpaceReal Estate Taxes 12,000 $10.00 $120,000Common Area Maintenance 12,000 $7.00 $84,000Subtotal $17.00 $204,000 $1.02
Miscellaneous Income - Residential 153,000 $1.00 $153,000 $0.77
Parking Revenue # New Spaces Rent Per Month TotalUnderground 100 $350.00 $420,000 $2.10Grade 0 $200.00 $0 $0.00Garage 0 $325.00 $0 $0.00Subtotal 100 $420,000 $2.10
Total Potential Revenue $8,872,873 $44.36
Vacancy Allowance 5.0% ($443,644) ($2.22)
Adjusted Gross Income $8,429,229 $42.15
Expenses Rentable SF Per RSFOperating Expense 165,000 ($7.00) ($1,155,000) ($5.78)Real Estate Tax 165,000 ($5.25) ($866,250) ($4.33)Subtotal ($12.25) ($2,021,250) ($10.11)
Net Operating Income $6,407,979 $32.04

COOLIDGE CORNER STUDY COMMITTEE
Finance Subcommittee
Sample Development Pro Forma
Apartment Rent Calculation
• Gross Square Feet to Net Square Feet
• Unit Mix by Number of Bedrooms
• Allocation of Market Units (85%) and Affordable Units (15%)
• Affordable Unit Maximum Rent by Bedroom – HUD & Town Scheduleo Affordability Ratio = 30% of gross income (SMSA median)o 80% Average Median Income = 10% of totalo 100% Average Median Income = 5% of total
• Rent Matrix – Monthly Rent PSFo Market Units – competitive analysiso Affordable Units – ZBL Section 4.08 inclusionary zoning requirements

APARTMENT SCHEDULE
Unit Mix by SizeUnit Type Total No. Units RSF Per Unit Total RSFStudio 10 600 6,000 1-Bedroom 65 800 52,000 2-Bedroom 50 1,250 62,500 3-Bedroom 20 1,625 32,500 Totals & Averages 145 1,055 153,000
Unit Mix by Category Market Rate Affordable Units Market Rate Affordable UnitsUnit Type Total No. Units Number of Units Number of Units Rentable SF Rentable SFStudio 10 9 2 5,100 900 1-Bedroom 65 55 10 44,200 7,800 2-Bedroom 50 43 8 53,125 9,375 3-Bedroom 20 17 3 27,625 4,875 Totals & Averages 145 123 22 130,050 22,950
Percent of Total 85% 15% 85% 15%
Rent Schedule Market Rate Market Rate Market Rate Affordable Units Affordable Units Affordable UnitsUnit Type RSF Per Unit Monthly Rent PSF Monthly Rent/Unit Total Annual Rent Monthly Rent PSF Monthly Rent/Unit Total Annual RentStudio 600 $4.85 $2,910 $296,820 $2.12 $1,273 $22,9081-Bedroom 800 $4.75 $3,800 $2,519,400 $1.81 $1,448 $169,3772-Bedroom 1,250 $4.50 $5,625 $2,868,750 $1.29 $1,616 $145,4703-Bedroom 1,625 $4.25 $6,906 $1,408,875 $1.10 $1,785 $64,272Totals & Averages 1,055 $4.55 $7,093,845 $1.46 $402,028
Rent Projection Rentable SF Monthly Rent PSF Annual RentMarket Rate Units 130,050 $4.55 $7,093,845Affordable Units 22,950 $1.46 $402,028Totals & Averages 153,000 $7,495,873
Affordable Unit Rent Schedule per Town Inclusionary Zoning Requirements
Affordable Units Affordable Units Affordable UnitsMonthly Rent/Unit Monthly Rent/Unit Monthly Rent/Unit
Unit Type 80% AMI 100% AMI Weighted AverageStudio $1,158 $1,502 $1,2731-Bedroom $1,317 $1,709 $1,4482-Bedroom $1,469 $1,911 $1,6163-Bedroom $1,622 $2,112 $1,785
Percent Affordable Units 66.67% 33.33% 100.00%
Percent of Total Units 10.00% 5.00% 15.00%

DEVELOPMENT BUDGET
Total Cost Cost Per SFLAND ACQUISITION Land Area PSF of LandPurchase Price 40,000 $300.00 $12,000,000 $60.00Commission $0 $0.00Tenant Relocation $0 $0.00Closing Costs 0.50% $60,000 $0.30Land Acquisition Total $12,060,000 $60.30
HARD COSTS Land Area PSF of Land Site Work 40,000 $30.00 $1,200,000 $6.00
Parking Total Spaces Cost Per Space Underground Garage 100 $100,000 $10,000,000 Grade 0 $20,000 $0 Above Grade Garage 0 $40,000 $0 Total 100 $10,000,000 $50.00
Building Construction Gross SF Cost PSF First Floor 20,000 $250.00 $5,000,000 Residential Floors 180,000 $280.00 $50,400,000 Subtotal 200,000 $55,400,000 $277.00
Tenant Improvement Allowance RSF Per RSF Commercial 12,000 $30.00 $360,000 $1.80
Subtotal $66,960,000 $334.80
General Requirements 5.0% $3,348,000 $16.74GC Overhead & Profit 8.0% $5,356,800 $26.78
Subtotal Before Contingency $75,664,800 $378.32
Hard Cost Contingency 5.0% $3,783,240 $18.92
Hard Cost Total $79,448,040 $397.24

DEVELOPMENT BUDGET (continued)
SOFT COSTS Total Cost Cost Per SFFees & OverheadProfessional Fees (A&E, legal, etc.) $2,650,000 $13.25Building Permit Fees 2.0% $1,588,961 $7.94Public Benefits Allowance 1.0% $794,480 $3.97Miscellaneous Fees $50,000 $0.25Developer Fees & Overhead 5.0% $4,874,574 $24.37Subtotal $9,958,015 $49.79
Marketing CostsMarketing & Leasing Commissions $900,000 $4.50Apt. Lease Up- Rent Concession $591,154 $2.96Subtotal $1,491,154 $7.46
Financing & Carrying Costs Construction Period Interest & Taxes $5,065,000 $25.33Lease Up / Operating Reserve $1,182,308 $5.91Insurance $100,000 $0.50Subtotal $6,347,308 $31.74
Soft Cost Contingency 5.0% $889,824 $4.45
Soft Cost Total $18,686,300 $93.43
TOTAL PROJECT COST $110,194,340 $550.97

INVESTMENT ANALYSIS
Return on Cost 5.82%
Value Created at Stabilization Cap Rate Fair Market Value Value Created VC % Equity6.00% $106,799,652 ($3,394,689) -8.8%5.50% $116,508,711 $6,314,370 16.4%5.00% $128,159,582 $17,965,242 46.6%4.50% $142,399,535 $32,205,195 83.5%4.00% $160,199,477 $50,005,137 129.7%
Loan to Value Cap Rate Fair Market Value Loan Principal LTV5.50% $116,508,711 $71,626,321 61.5%
Debt Service Coverage Ratio 1.33
Capitalization Assumptions: Total Per SFEquity Investors 35.0% $38,568,019 $192.84Construction Mini Perm Loan 65.0% $71,626,321 $358.13
100.0% $110,194,340 $550.97
Debt Service Coverage Ratio
Net Operating Income $6,407,979
Debt Service ($4,830,409) Principal $71,626,321 Interest Rate 4.50% Amortization Period (yrs.) 25
Net Cash Flow After Debt Service $1,577,570
Debt Service Coverage Ratio 1.33

COOLIDGE CORNER STUDY COMMITTEE
Meeting with Pam McKinney – Proposed Topics
• Market conditions and parameters for new development o Multi-Family Residential
§ Apartments § Condominiums
o Hotels o Restaurants o Retail o Other uses
• Scale & density
• Parking ratios • Development mitigation & public benefits
• Capital markets – Interest rates, ROC, cap rates
• Sensitivity analysis – what if we changed _________________?
• Other topics?