controlling the amount of co-catalyst as a critical factor
TRANSCRIPT

Accepted Manuscript
Title: Controlling the Amount of Co-catalyst as a CriticalFactor in Determining the Efficiency of Photoelectrodes: TheCase of Nickel (II) Hydroxide on Vanadate Photoanodes
Authors: Javier Quinonero, Roberto Gomez
PII: S0926-3373(17)30548-9DOI: http://dx.doi.org/doi:10.1016/j.apcatb.2017.06.005Reference: APCATB 15745
To appear in: Applied Catalysis B: Environmental
Received date: 16-3-2017Revised date: 31-5-2017Accepted date: 3-6-2017
Please cite this article as: Javier Quinonero, Roberto Gomez, Controlling the Amountof Co-catalyst as a Critical Factor in Determining the Efficiency of Photoelectrodes:The Case of Nickel (II) Hydroxide on Vanadate Photoanodes, Applied Catalysis B,Environmentalhttp://dx.doi.org/10.1016/j.apcatb.2017.06.005
This is a PDF file of an unedited manuscript that has been accepted for publication.As a service to our customers we are providing this early version of the manuscript.The manuscript will undergo copyediting, typesetting, and review of the resulting proofbefore it is published in its final form. Please note that during the production processerrors may be discovered which could affect the content, and all legal disclaimers thatapply to the journal pertain.
1
Controlling the Amount of Co-catalyst as a Critical Factor in Determining
the Efficiency of Photoelectrodes: The Case of Nickel (II) Hydroxide on
Vanadate Photoanodes
Javier Quiñonero, Roberto Gómez*
Departament de Química Física i Institut Universitari d’Electroquímica
Universitat d’Alacant, Apartat 99, E-03080 Alicante, Spain
*Corresponding author. Tel: +34 96 590 3748; email address: [email protected]

2
HIGHLIGHTS
Nickel hydroxide behaves as an efficient co-catalyst for bismuth vanadate and iron
vanadate photoanodes for water oxidation.
Chemical bath deposition of nickel hydroxide allows for a fine control of the co-catalyst
loading on the photoanode surface.
Co-catalyst loading is critical for its performance, being optimal values of the order of
only one monolayer.
Electrochemical methods can be used to estimate the co-catalyst loading provided
that it experiences a reversible redox behavior.

3
Abstract
A commonly followed strategy to enhance the performance of photoelectrodes for
achieving viable water splitting devices consists in the use of co-catalysts. However,
fine control of the amount of co-catalyst deposited on the electrode surface usually does
not receive much attention, although it is an essential factor that crucially determines the
efficiency of photoelectrodes. In this context, this study illustrates how the dark
electrochemical characterization of co-catalyst-modified photoanodes may provide
valuable information on the precise amount of electroactive co-catalyst present on the
surface, facilitating our understanding of the manner in which co-catalysts work and
paving the way for their optimization. For this purpose, ultrathin Ni(OH)2 layers were
deposited on either doped or pristine BiVO4 and FeVO4 photoanodes by a cost-effective
and versatile chemical bath deposition method in which the deposition time allows to
control the Ni(OH)2 loading. The deposited Ni(OH)2 is demonstrated to successfully
catalyze the photoelectrochemical water oxidation process on both BiVO4 and FeVO4
electrodes, by improving the effective transfer of photogenerated holes from the
semiconductor to solution. In fact, the electrocatalytic activity of the Ni(OH)2-modified
photoanodes rapidly increases with the amount of deposited Ni(OH)2 until an optimum
value is reached equivalent to only 0.46 and 1.68 Ni(OH)2 monolayers for BiVO4 and
FeVO4 electrodes, respectively. Under these conditions, Ni(OH)2 enhances the
photocurrent generation by a factor of 2 for BiVO4 and of 1.2 for FeVO4 photoanodes in
contact with slightly alkaline solutions. The small loadings of Ni(OH)2 leading to an
optimum photoanode behavior indicate that hole transfer is favored on vanadate active
surface sites, which would also be the preferential sites for Ni(OH)2 deposition.
Additional amounts of co-catalyst deposited for longer times induce a drastic decrease

4
in the Ni(OH)2 photoelectrocatalytic activity due to charge recombination at the
semiconductor/Ni(OH)2 interface, probably enhanced by the low carrier mobility in
Ni(OH)2. On the other hand, this study demonstrates that the preparation of efficient
photoanodes for oxygen evolution with an extremely small amount of co-catalyst
through a facile and scalable method is possible.
Keywords: nickel hydroxide, chemical bath deposition, oxygen evolution reaction,
photoelectrocatalysis, BiVO4 photoanodes, FeVO4 photoanodes.
1. Introduction
In order to overcome the current global warming caused by the employment of fossil
fuels and the continuously growing energy consumption, the development of green,
non-polluting and renewable alternative technologies for energy supply is desirable. In
particular, since its discovery by Fujishima and Honda in 1972 [1], producing H2 as a
solar fuel from photoelectrochemical (PEC) water decomposition methodologies on
semiconductor electrodes using only sunlight as input energy has been considered as an
interesting goal [2–4]. In this context, the search for efficient semiconductor materials
with potential application in the development of photoanodes capable of photooxidizing
water has mainly focused on binary metal oxides for the last few decades, basically on
TiO2 (Eg = 3.2 eV, for the anatase phase) [5,6], WO3 (Eg = 2.7 eV) [7,8] and Fe2O3 (Eg =
2.2 eV) [9–11]. However, this research has now been directed in part toward several
ternary oxides, such as some tantalates [12–14], titanates [15–18] and wolframates [19–
21], among others. These also include certain vanadates (BiVO4 [22–25], FeVO4 [26–
28] and InVO4 [29,30]), which are characterized by their electrical n-type properties,
their relatively low cost and toxicity, intrinsic visible light activity, and acceptable
chemical and photochemical stability in aqueous electrolytes.

5
Among the vanadates, BiVO4 stands out as one of the most promising photoanode
materials due to its convenient valence band edge, located at approximately 2.4 V (vs.
RHE), which provides the necessary overpotential for photogenerated holes to oxidize
water. It is also important to consider for visible light absorption its relatively narrow
bandgap (2.4 eV for the monoclinic variety; although several other values are reported
for other crystalline phases [22,31]). In addition, the poor carrier mobility observed for
this semiconductor is compensated by a long carrier lifetime, which translates into a
relatively long diffusion lengths for electrons and holes [32,33]. Similarly, iron
vanadate (FeVO4) is also a low bandgap semiconductor (for the triclinic structure, the
Eg value is close to 2.06 eV), which facilitates the absorption of around 45% of the
incident solar energy. In addition, it is composed of earth-abundant elements [28]. In
any case, the actual conversion efficiency achieved with unmodified BiVO4 and FeVO4
is well below expectations. In fact, they present extremely poor photogenerated carrier
transport properties, especially for electron transport in BiVO4. The slow rates for
driving complex reactions such as oxygen evolution, motivated by its high kinetic
barrier and the extremely poor catalytic properties of the BiVO4 and FeVO4 surfaces are
other important drawbacks for the use and applicability of these vanadates in
photoelectrochemical devices [22,26,31].
Morphology control [34–36], heterojunction structure formation [37–39], and
composition tuning have resulted in an enhancement of charge separation and transport
in BiVO4- [25,40–42] and FeVO4-based [28] materials. However, the sluggish transfer
of photogenerated holes to solution due to poor catalytic properties still remains as the
main limiting factor for their use in water splitting. In addition, the resulting hole
accumulation at the photoanode/electrolyte interface often results in photooxidation of
the electrode (photocorrosion) [22]. In this way, the modification of the BiVO4 surface

6
with oxygen evolution catalysts (OECs) has led to a dramatic improvement in the
performance of the BiVO4 photoanodes by accelerating the surface PEC water oxidation
reaction kinetics and also by favoring charge separation through collection of
photogenerated holes [43]. However, only a limited number of OECs are effective for
BiVO4 in PEC water oxidation, including certain transition metals and metal oxides
(RuO2 [43], Pt [44], IrOx [44] PdOx [45], CoOx [46], NiO [47], Co3O4 [48] and RhO2
[49]) and oxyhydroxides (such as FeOOH and NiOOH [50]) and some complex, ill-
defined structures known as ‘cobalt phosphate’ (Co-Pi) [51], ‘cobalt carbonate’ (Co-Ci)
[52] and ‘nickel-borate’ (Ni-Bi) [53]. To the best of our knowledge, no OEC
incorporation has been reported to date in the case of FeVO4 photoanodes.
The interest in Ni3+-based OECs for (photo)electrocatalysis, such as NiOOH/Ni(OH)2,
is due to the fact that Ni3+ is particularly catalytic for a wide range of redox processes
[54]. In fact, the electrocatalytic properties of NiOOH have been studied and confirmed,
not only for oxygen evolution reaction (OER) in PEC water splitting [50,55,56], but
also in a wide range of reactions, such as the oxidation of alcohols to yield carbonyl
compounds [57–60], the direct electrooxidation of carbohydrates [61] and urea [62] and
a green route oxidation of sulfide ions [63]. The electrocatalytic effect has been
primarily attributed by Trotochaud et al. to Fe contamination, which plays a critical role
in enhancing the activity of the Ni-based OER electrocatalysts [64], but it is also
thought to be motivated by the low degree of occupancy of the d orbitals associated
with the Ni oxidized form (NiOOH). In fact, the metal ion in its high valence state has
more activity for bond formation with adsorbed species, thus facilitating electrocatalytic
activity [65–67]. The importance of studying the OER over Ni(OH)2 in alkaline media
derives from the fact that the best OECs in acid media (RuO2 and IrO2) suffer from poor
chemical stability in basic solutions [68]. Although Ni(OH)2 possesses a lower
7
electrocatalytic activity, it displays excellent long term corrosion resistance in basic
solutions and it has the added advantage of being relatively inexpensive.
In this work, transparent Ni(OH)2 ultrathin films have been deposited on pristine and
doped BiVO4 as well as on FeVO4 photoanodes by a chemical bath deposition (CBD)
method to study their activity as OEC in PEC water oxidation. The deposition method,
besides being cost-effective, is scalable and extremely versatile since it should also be
practical for large-area deposition and successfully applicable in the case of a wide
range of materials beyond bismuth and iron vanadates. It offers the possibility of
achieving a well-defined Ni(OH)2 structure by controlling the amount of deposited co-
catalyst in an effective way by changing only the deposition time and monitoring the
amount of deposited Ni(OH)2 by cyclic voltammetry. In such a way, it is possible to
quantify the surface density of co-catalyst needed for an optimum electrode PEC
performance. Surface modification of BiVO4 and FeVO4 with Ni(OH)2 layers also
enhances their chemical and photoelectrochemical stability in alkaline solutions, a much
more convenient working media from the standpoint of their practical applicability in
water splitting devices [69].
2. Experimental section.
2.1. Preparation of BiVO4 photoanodes. Pristine BiVO4 thin film photoanodes were
prepared on fluorine-doped tin oxide (F:SnO2, FTO, U-type 12 Ω2, Asahi Glass Co.) by
a previously reported procedure based on a modified metal-organic decomposition
method (MOD) followed by a thermal degradation of the corresponding metal-organic
precursor [70]. Bi and V precursor solutions were prepared by dissolving
Bi(NO3)3·5H2O (Sigma-Aldrich, 98%) 0.2 M and VO(C5H7O2)2 (Fluka Analytical,
97%) 0.03 M in acetic acid (Scharlau, 99%) and acetylacetone (Fluka Analytical,
99.5%), respectively. They were mixed in a 1:1 mole ratio of Bi to V to obtain the

8
corresponding BiVO4 precursor solution. Then, 40 μL of the mixed solution was
dropped onto an FTO glass plate (area to be covered: 1 cm2), previously cleaned by 15-
min sonication (Selecta Ultrasonics) in acetone (Panreac, P.A.) and ethanol (VWR
Prolabo Chemicals, 96%), and spread over it with a spin-coater (Chemat Technology,
KW-4A) at a spin rate of 1500 rpm for 10 s. Finally, the electrodes were annealed at
500ºC for 30 min in air, with a heating rate of 5ºC·min-1, using a programmable furnace
(Conatec, 7800). This procedure was repeated six times to achieve the optimum BiVO4
film thickness.
2.2. Preparation of doped BiVO4 photoanodes. La (1 at%)- and Ce (2 at%)-doped
BiVO4 thin film photoanodes were obtained following the same procedure described
above, but incorporating the doping element in the BiVO4 precursor solution at the
desired concentration (in at% with respect to either Bi or V content) [70]. In this case,
La(NO3)3·6H2O (Fluka Analytical, 99%) and Ce(NO3)3·6H2O (Strem Chemicals, 99%)
were employed as La and Ce precursors, respectively.
2.3. Preparation of FeVO4 photoanodes. FeVO4 thin film photoanodes were also
synthesized by layer-by-layer coating over conducting FTO glass substrates through a
modified MOD method followed by a thermal treatment [28]. The FeVO4 precursor
solution was prepared by mixing Fe(NO3)3·9H2O (Merck, 99%) and VO(C5H7O2)2
(Fluka Analytical, 97%), in equimolar 0.2 M concentration, in a 10-mL solution of
acetic acid (Scharlau, 99%) and acetylacetone (Fluka Analytical, 99.5%) (1:8.25 by v/v)
that was magnetically stirred for 24 h. The resulting solution was then spun on clean
FTO glass substrates (40 μL for an area to be covered of 1 cm2) at 1000 rpm for 30 s
and subsequently annealed at 250ºC for 10 min (heating rate: 5ºC·min-1). This process
was repeated five times, and then, the films were annealed in two stages: a first
annealing at 500ºC for 30 min was applied to combust the organic compounds and to
9
improve the contact among the particles and with the substrate, and a second annealing
at 550ºC for 1 h to obtain the final films. These heat treatments were also done in air
with a heating rate of 5ºC·min-1.
2.4. Ni(OH)2 surface deposition on pristine and doped BiVO4 and FeVO4
photoanodes. Ni(OH)2 was deposited on pristine and doped BiVO4 and FeVO4
photoanodes by a CBD procedure [56]. The deposition solution contained 25 mL of 0.5
M NiSO4·6-7H2O (Riedel-de Haën, for nickel plating), 12.5 mL of 1 M urea (Sigma-
Aldrich, P.A.) and 12.5 mL of H2O (Millipore, Essential Elix 3). The FTO substrates
were vertically supported with the conducting side (either bare or covered with BiVO4
or FeVO4) faced against the beaker wall, and the solution was heated up to 100ºC in a
stove (Memmert, 100-800). Different deposition times (from 10 to 50 min) were
assayed as to control the amount of deposited Ni(OH)2. After deposition, the samples
were rinsed with distilled water, air dried and annealed at 200ºC in air for 1 h (heating
rate: 5ºC·min-1). This heat treatment does not induce the dehydrogenation of the
deposited Ni(OH)2 [71].
2.5. Photoanode characterization and photoelectrochemical measurements. A SEM
study was carried out to characterize the surface morphology of the films using a ZEISS
Merlin VP Compact field emission scanning electron microscope (FESEM). TEM
micrographs were obtained with a JEOL transmission electron microscope JEM-2010.
For the surface composition study of the films, XPS experiments were done with a
Thermo-Scientific K-Alpha XPS spectrometer equipped with a monochromatic Al-Kα
source (1486.6 eV), operating at 15 kV and 10 mA.
PEC measurements were conducted at room temperature in a home-made Pyrex glass
cell with a fused silica window and a computer-controlled potentiostat-galvanostat
(Autolab, PGSTAT30). A Pt wire and an Ag/AgCl/KCl(3 M) electrode were used as the
10
counter and reference electrodes, respectively. Unless otherwise stated, all the potentials
are referred to this Ag/AgCl electrode. An N2-purged NaBi (pH = 10.0) buffer solution
was used as the working electrolyte for the (photo)electrochemical measurements. The
light source was an ozone-free 1000 W Xe(Hg) lamp (Newport Instruments, 66921)
equipped with a water filter to minimize the infrared contribution of the beam, and all
the PEC measurements were carried out by irradiating the prepared photoanodes
through the electrolyte/electrode interface (EE illumination). The photon flux intensity
was measured by means of a photodiode power meter (Thorlabs, PM100D), and the
typical value was approximately 100 mW·cm-2.
3. Results and discussion.
3.1. Pristine and La- and Ce-doped BiVO4 photoanodes modified with Ni(OH)2. Fig. 1
shows the electrochemical characterization in the dark for BiVO4/Ni(OH)2 photoanodes
prepared for different Ni(OH)2 deposition times (from 10 to 50 min), together with the
corresponding response for FTO/Ni(OH)2 electrodes synthesized for the same
deposition times. The voltammetric behavior of the BiVO4 substrate is characterized by
the appearance of quasi-reversible pseudocapacitive signals at potentials below -0.2 V,
which is attributed to redox processes undergone by V surface atoms. Importantly, the
voltammetric profiles are stable over a wide potential range, which suggests stability of
the BiVO4 film. Voltammograms for bare pristine and doped BiVO4 electrodes are
shown in Fig. S1. As the Ni(OH)2 deposition proceeds, a cathodic peak grows at
approximately 0.65 V, which is associated with the redox process:
NiOOH + H2O + e− ⟶ Ni(OH)2 + OH− Eq. (1)
Doped BiVO4 electrodes show the same voltammetric behavior for different Ni(OH)2
deposition times as shown in Figs. S2 and S3.

11
As expected, the charge associated to the Ni reduction peak (qNi) increases with the
Ni(OH)2 deposition time (Fig. 2a). The deposition of Ni(OH)2 on the BiVO4 and FTO
surfaces has a direct effect on the electrochemical behavior of these electrodes in the
region of positive potentials. In fact, immediately above 0.7 V, significant faradaic
currents, attributable to oxygen evolution in the dark, are observed. These currents
increase with the amount of deposited Ni(OH)2 (Fig. 2b). From the curves in Fig. 2a, it
is evident that the nucleation rate of Ni(OH)2 on both surfaces is rather slow and their
subsequent growth is significantly faster for the FTO substrate. On the other hand, the
OER activity tends to saturate for relatively large amounts of Ni(OH)2. Interestingly, for
low Ni(OH)2 amounts, the vanadate substrate slightly enhances the OER catalytic effect
over that of the bare FTO case, which is particularly relevant for the use of Ni(OH)2 as a
co-catalyst.
Linear scan voltammograms recorded under transient illumination for
BiVO4/Ni(OH)2, La (1 at%)-BiVO4/Ni(OH)2 and Ce (2 at%)-BiVO4/Ni(OH)2 prepared
for different Ni(OH)2 deposition times (from 0 to 50 min) (Fig. 3 and Fig. S4) are
characterized by the existence of very small dark currents together with stable anodic
photocurrents whose magnitude is clearly deposition-time dependent. The maximum
value of the photocurrent is obtained for a deposition time of 20 min. For longer times
(30 min and beyond), a drastic decrease in the magnitude of the photocurrent is
observed. This reduction in photocurrent is accompanied by a significant intensification
of the anodic and cathodic spikes observed upon illumination/light interruption. This is
a clear sign of electron-hole recombination induced by hole trapping in the relatively
thick Ni(OH)2 layer deposited on the photoanode surface: although initially the
separation of the photogenerated charges takes place, holes are trapped likely at the
BiVO4/Ni(OH)2 interface, favoring recombination. In fact, charge transport through

12
Ni(OH)2 is not efficient due to its low electrical conductivity, which implies that
ultrathin Ni(OH)2 layers are required for a fast hole transfer to solution and a subsequent
good (photo)electrocatalytic performance. It is also worth noting that the incorporation
of the catalyst does not induce any displacement of the photoonset value, which is
located at around -0.8 V vs. Ag/AgCl (0.0 V vs. RHE).
Chronoamperometric measurements for pre-optimum (10 min), optimum (20 min)
and post-optimum (30 min) Ni(OH)2 deposition times for BiVO4/Ni(OH)2 (Fig. 4a-c) at
-0.5 V (i. e., close to the photocurrent onset) confirm the tendencies already observed in
the voltammetric experiments. Concretely, Fig. 4d shows a plot of the photocurrent
recorded at -0.5 V for BiVO4/Ni(OH)2 photoanodes vs. the charge density
corresponding to the reduction of NiOOH. The same tendency, although less marked, is
observed for other values of applied potential. This plot shows how the photocurrent
magnitude varies as a function of the amount of Ni, which, in turn, is dependent on the
Ni(OH)2 deposition time. The optimum is located at a qNi of approximately 125 μC·cm-2
(for a deposition time equal to 20 min). This value corresponds to a Ni atom surface
density of 5.4·1014 cm-2. By using the qNi value corresponding to one monolayer (ML)
as defined in a previous study [56], a second x-axis is added to Fig. 4d, indicating in an
explicit way the number of equivalent monolayers for the different studied samples.
Strikingly, the optimum co-catalyst coverage is as low as 0.46 ML. We should
emphasize that the coverage calculation is done by assuming that the surface is perfectly
flat, which is not the case (see below). The actual coverage that would be calculated on
the basis of the real surface area would be substantially smaller. Such a low optimum
coverage clearly illustrates the concept of active site as only a minor fraction of the
BiVO4 surface sites seems to be relevant in the trapping and transfer of holes to the
electrolyte. On the other hand, the low optimum Ni(OH)2 coverage is also a result of the

13
poor charge transport properties of Ni(OH)2/NiOOH. The existence of a region with a
Ni(OH)2 deposit with a thickness equivalent to several monolayers would be deleterious
for the final hole transfer to solution.
In the same way, the surface density of co-catalyst needed for an optimum electrode
PEC performance is estimated to be around 1.2·1015 and 1.4·1015 Ni atoms/cm2 for La
(1 at%)- and Ce (2 at%)-doped BiVO4 photoanodes, which corresponds to 0.99 and 1.2
ML, respectively. The significant difference in the optimum Ni atom surface density
between pristine and doped electrodes could be attributed to the fact that, in the doped
samples, there would be more surface active centers as a consequence of the doping
procedure than in the case of pristine BiVO4.
Fig. 5a-d displays top view FESEM images for a bare BiVO4 sample and BiVO4
samples modified with Ni(OH)2 for deposition times of 10, 20 and 30 min (see Fig. S5a
for a BiVO4 cross-sectional FESEM image showing a vanadate film thickness of about
0.4 µm). From the comparison of these FESEM micrographs, no significant differences
are observed in the electrode morphology upon modification with Ni(OH)2 for the
studied deposition times. Only in the case of the BiVO4 sample modified with Ni(OH)2
(deposition time of 30 min), the appearance of an overstructure in the form of acicular
particles corresponding to the Ni(OH)2 deposit on the relatively rough surface of the
BiVO4 substrate starts to be discerned (see encircled area in Fig. 5d). It is also important
to note that Fig. 5a-d and particularly Fig. S5a evince the compact nature of the BiVO4
film, which precludes the existence of Ni(OH)2 in direct contact with the substrate.
Selected TEM micrographs (Fig. 5e-h) do reveal the existence of the Ni(OH)2 deposit
more clearly. Comparing images obtained for a bare BiVO4 sample (Fig. 5e) with those
corresponding to samples modified with Ni(OH)2 for deposition times of 10, 20 and 30
min (Fig. 5f-h), the existence of Ni(OH)2 deposits of different thickness on the surface
14
of BiVO4 photoanodes can be verified. This Ni(OH)2 deposit grows as the deposition
time increases and it consists of particles with an elongated morphology and small
dimensions. It is worth noting that the selected TEM images in Fig. 5 are those
revealing more clearly the existence of the Ni(OH)2 deposit. In any case, it should be
emphasized that the average Ni(OH)2 layer thickness for deposition times of 10, 20 and
30 min is extremely low (that is, only ultrathin films are generated). In fact, EDX
analysis of the samples could not detect the presence of Ni whose concentration is thus
below the detection limit of the equipment.
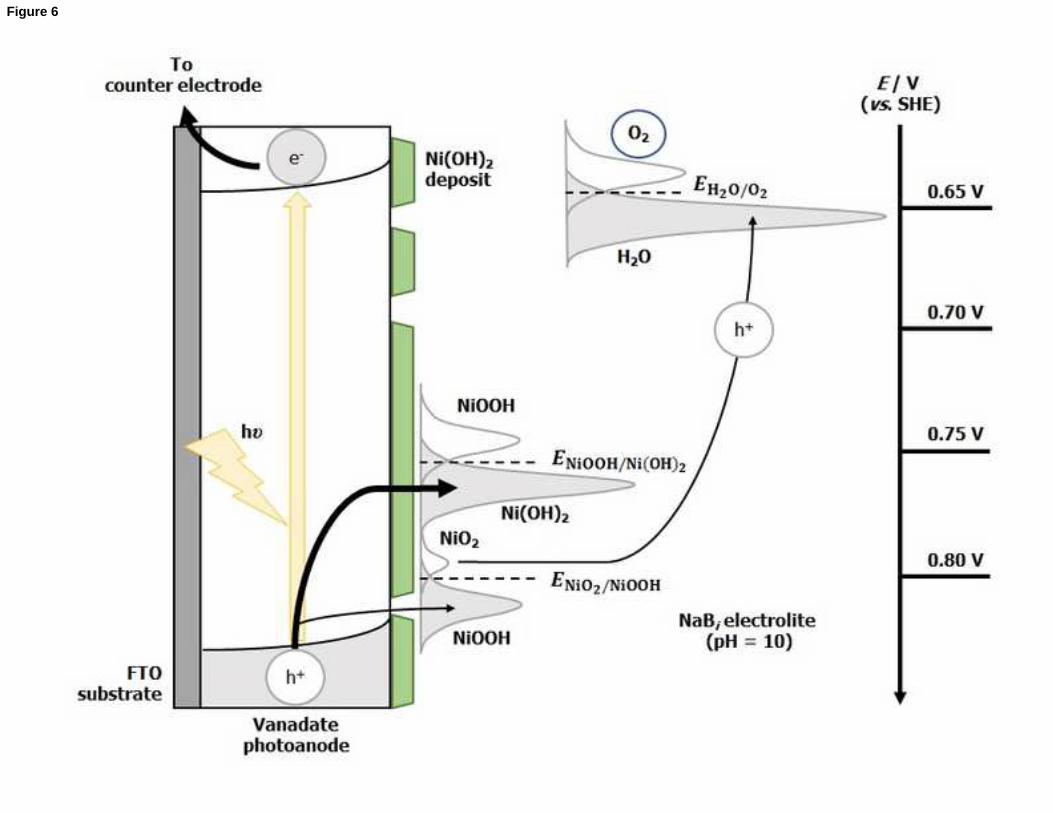
It can then be assumed that, for submonolayer and monolayer coverages, most of the
deposited nickel atoms are distributed in small clusters or islands. These isolated
Ni(OH)2 islands would be able to quickly exchange photogenerated holes with the
electrolyte as the fraction of nickel atoms exposed to the electrolyte would be
maximum. By trapping holes photogenerated in the semiconductor, surface Ni2+ would
locally oxidize to Ni3+. Only a minor fraction of these Ni3+ centers would be further
oxidized to Ni4+ due to the trapping of a second photogenerated hole. The Ni4+ species
are supposed to act as the actual electrocatalytic centers, finally transferring the hole to
solution and participating in the oxidation of water to O2, with its subsequent reduction
to Ni3+ (Fig. 6). However, as coverage grows (for Ni(OH)2 deposition times of 30 min
and beyond), an increasing fraction of the deposited Ni atoms would be in second and
successive monolayers, not in direct contact with the electrolyte, being thus less
effective for promoting the OER. This fact, together with the rather low electrical
conductivity of the increasingly thick Ni(OH)2 deposit, would cause a drastic decrease
in their activity as co-catalyst, preventing the exchange of charges with solution and
enhancing electron-hole recombination. It is finally relevant to mention that with a very
15
low deposited amount, invoking a preferential transfer of the holes to the Ni(OH)2 phase
is not sound, being the role of the Ni(OH)2 (sub)monolayer almost exclusively catalytic.
Fig. 7 shows a comparison between the initial and final (before and after the
photoelectrochemical characterization, respectively) voltammetric measurements in the
dark for these electrodes in an N2-purged NaBi buffer solution (pH = 10.0). No
important differences in the shape of the corresponding voltammograms are observed,
and the charge density exchanged in the NiOOH reduction process remains almost
constant before and after the photoelectrochemical characterization. This is particularly
significant on account of the very low amounts of deposited Ni(OH)2. These results
point to a significant stability of the electrodes in alkaline solutions.
Fig. 8 contains Ni 2p XPS spectra for BiVO4/Ni(OH)2, La (1 at%)-BiVO4/Ni(OH)2
and Ce (2 at%)-BiVO4/Ni(OH)2 photoanodes, prepared for a Ni(OH)2 deposition time
of 20 min. In the three cases, the XPS spectrum of Ni shows two main peaks with
binding energies (Eb) of around 855.9 eV and 873.5 eV, corresponding to the Ni 2p3/2
and 2p1/2 transitions [56], respectively, and one 2p satellite band [53] at 862 eV. The
accurate determination of the specific Ni oxidation state is usually difficult as there are
diverse binding energies for the same Ni oxidation state (Ni2+ and Ni3+) within a range
of 1 eV [53]. However, in this case, the clear shift of Ni 2p3/2 peaks to higher Eb values
with respect to those typical for NiO [72–74] and the absence of peaks attributable to Ni
in its oxidized form (NiOOH) provide evidence that, as expected, the deposit over the
prepared samples is completely composed of Ni(OH)2. According to the XPS
quantitative analysis, the Ni content (in at%) on the BiVO4/Ni(OH)2, La (1 at%)-
BiVO4/Ni(OH)2 and Ce (2 at%)-BiVO4/Ni(OH)2 studied samples is 1.22, 1.63 and 2.06
at%, respectively. These results are consistent with the amounts of Ni obtained from
electrochemical measurements, which are larger for the doped samples than for pristine

16
BiVO4. XPS spectra for Bi 4f, V 2p, O1s, La 3d and Ce 3d are given in the
Supplementary Materials (Figs. S6-S8).
3.2. FeVO4 photoanodes modified with Ni(OH)2. The XRD pattern for FeVO4
deposited on FTO (Fig. S9) presents weak reflections corresponding to the main lines of
the triclinic polymorph, thus confirming its crystalline structure. As shown in Fig. 9a, a
FESEM image of the FeVO4 surface reveals that the deposit exhibits the typical
morphology of a thin film characterized by a low porosity and a high compactness (see
Fig. S5b for a FeVO4 cross-sectional FESEM image). The linear scan voltammogram
under transient illumination presented in Fig. 9b shows the existence of small dark
currents (in agreement with the cyclic voltammogram also shown in Fig. 9b) together
with anodic photocurrents over a wide potential range. The photocurrent, whose
magnitude increases with increasing applied potentials, confirms an n-type electrical
character for the prepared semiconductor film, which is remarkably stable. The
photoonset potential is located, approximately, at -0.1 V, which agrees with previous
studies [28].
The deposition of Ni(OH)2 on FeVO4 photoanodes has also been studied (Fig. 10).
Upon depositing different amounts of Ni(OH)2, an electrochemical behavior similar to
that discussed for BiVO4 electrodes is observed. In fact, a growing cathodic peak in the
corresponding cyclic voltammetry in the dark linked to the NiOOH reduction process
appears at approximately 0.65 V as Ni(OH)2 deposition proceeds (Fig. 10a-e). This
leads to a subsequent improvement in the magnitude of the photocurrents for the
FeVO4/Ni(OH)2 electrode until a maximum enhancement is reached for a Ni(OH)2
deposition time of 20 min. For Ni(OH)2 deposition times above 30 min, a significant
decrease in the magnitude of the photocurrent is observed, together with the appearance
of anodic and cathodic spikes upon illumination/light interruption. The deposition of

17
Ni(OH)2 does not induce any displacement of the photoonset, which remains located at
-0.1 V (Fig. 10f-j).
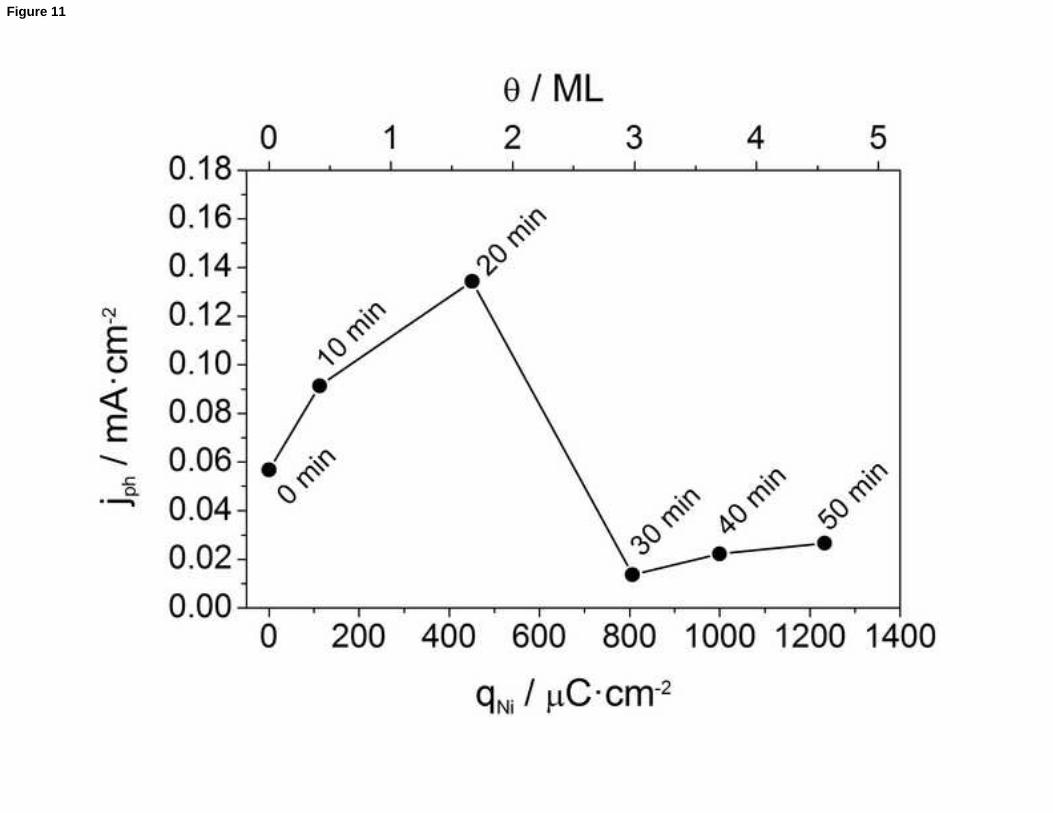
As previously discussed, the voltammetric signals for the presence of Ni(OH)2 which
are present in the cyclic voltammograms in the dark in Fig. 10a-e allows for an accurate
determination of the deposited co-catalyst amount. In this way, Fig. 11 shows a plot of
the photocurrent recorded at 0.1 V for FeVO4/Ni(OH)2 photoanodes vs. the charge
density corresponding to the reduction of NiOOH for samples with different loadings of
Ni(OH)2. The optimum coverage (see Fig. S10 for a FESEM image) corresponds to a
charge density of approximately 450 μC·cm-2 (for a deposition time equal to 20 min),
which is equivalent to around 1.68 Ni(OH)2 ML. It is worth noting that the amount of
deposited Ni(OH)2 inducing the maximum enhancement in the photocurrent values is
significantly larger than that required for pristine BiVO4. This could be simply linked to
the fact that the surface roughness of FeVO4 appears to be larger than that of BiVO4.
4. Conclusions.
This study aims to illustrate the need for a careful control of the amount of co-catalyst
deposited on the photoelectrode surface as a key factor determining its efficiency, as
well as the usefulness of electrochemical methods for monitoring such an amount. For
this purpose, ultrathin Ni(OH)2 layers have been deposited on pristine and doped BiVO4
as well as on pristine FeVO4 photoanodes by means of a urea-based chemical bath
deposition method that allows for a straightforward and fine control of the quantity of
deposited co-catalyst. By controlling the deposition time, photoanodes surface-modified
with different amounts of Ni(OH)2 have been prepared and their electrocatalytic activity
studied and discussed as a function of the amount of deposited Ni(OH)2. Cyclic scan

18
voltammograms in the dark provide clear voltammetric signals associated with
Ni(OH)2, allowing for an accurate determination of its loading, while linear scan
voltammograms under transient illumination offer insights into the photoactivity for the
oxygen evolution reaction of the as-fabricated photoanodes.
The electrocatalytic activity of the Ni(OH)2-modified BiVO4 photoanodes rapidly
increases with the amount of deposited Ni(OH)2 until an optimum value is reached (for
20 min of Ni(OH)2 deposition in all cases). The coverage values that enable an optimum
PEC performance have been calculated to be 0.46, 0.99 and 1.2 equivalent Ni(OH)2
monolayers, for pristine, La (1 at%)- and Ce (2 at%)-doped BiVO4 photoanodes,
respectively. In the case of the FeVO4 electrodes, the highest enhancement in the values
of the recorded photocurrents is achieved with 1.68 equivalent Ni(OH)2 monolayers.
The enhancement observed upon Ni(OH)2 deposition results from the fact that the
Ni(OH)2 deposit acts as an oxygen evolution catalyst, favoring the transfer of
photogenerated holes through the electrode/electrolyte interface. In fact, when the
amount of co-catalyst over the photoanode surface is low, most of the deposited nickel
atoms act as active catalytic centers for hole transfer to solution as they should be
distributed in monolayer-high islands and directly exposed to the electrolyte. However,
thicker Ni(OH)2 layers, obtained for longer deposition times (above 30 min), induce a
drastic decrease in the electrocatalytic activity. This is attributed to the fact that an
increasing number of deposited Ni atoms would not act as active catalytic centers but as
recombination centers, as they are not in direct contact with the electrolyte. This
together with the poor charge transport capabilities of the Ni(OH)2 deposit leads to
enhanced charge recombination at the semiconductor/Ni(OH)2 interface. It is worth
noting that the low value of the optimum Ni(OH)2 coverage also illustrate clearly the
concept of surface active site in photoelectrocatalysis.

19
In more general vein, this study shows that the modification of vanadate electrodes
with optimized Ni(OH)2 loadings enables their potential practical application as
efficient photoanodes in water splitting devices while using minimum amounts of Ni-
based co-catalyst. In fact, the possibility of using a method that allows the slow and
controlled deposition of extremely small amounts of co-catalyst, as shown here, can
also enable the practicality of more expensive co-catalysts, such as IrOx or RhO2.
Acknowledgements.
Financial support of the Spanish Ministry of Economy and Competitiveness through
project MAT2015-71727-R (FONDOS FEDER) is gratefully acknowledged. J. Q.
thanks the Generalitat Valenciana CEICE as well as the Spanish Ministry of Education,
Culture and Sport for the award of ACIF and FPU predoctoral grants, respectively.
References.
[1] A. Fujishima, K. Honda, Nature. 238 (1972) 37–38.
[2] T. Bak, J. Nowotny, M. Rekas, C. Sorrell, Int. J. Hydrogen Energy. 27 (2002)
991–1022.
[3] A. B. Murphy, P. R. F. Barnes, L. K. Randeniya, I. C. Plumb, I. E. Grey, M. D.
Horne, J. A. Glasscock, Int. J. Hydrogen Energy. 31 (2006) 1999–2017.
[4] M. G. Walter, E. L. Warren, J. R. McKone, S. W. Boettcher, Q. Mi, E. A.
Santori, N. S. Lewis, Chem. Rev. 110 (2010) 6446–6473.
[5] T. Berger, D. Monllor-Satoca, M. Jankulovska, T. Lana-Villarreal, R. Gómez,
ChemPhysChem. 13 (2012) 2824–2875.
[6] F. Han, V. S. R. Kambala, M. Srinivasan, D. Rajarathnam, R. Naidu, Appl. Catal.
A. 359 (2009) 25–40.
[7] J. A. Seabold, K. S. Choi, Chem. Mater. 23 (2011) 1105–1112.

20
[8] C. Santato, M. Odziemkowski, M. Ulmann, J. Augustynski, J. Am. Chem. Soc.
123 (2001) 10639–10649.
[9] K. Sivula, F. L. Formal, M. Grätzel, ChemSusChem. 4 (2011) 432.
[10] I. Cesar, K. Sivula, A. Kay, R. Zboril, M. Grätzel, J. Phys. Chem. C. 113 (2009)
772–782.
[11] I. Cesar, A. Kay, J. A. G. Martinez, M. Grätzel, J. Am. Chem. Soc. 128 (2006)
4582–4583.
[12] H. Kato, A. Kudo, J. Phys. Chem. B. 105 (2001) 4285–4292.
[13] H. Kato, A. Kudo, Chem. Phys. Lett. 295 (1998) 487–492.
[14] H. Kato, A. Kudo, Catal. Letters. 58 (1999) 153–155.
[15] T. Watanabe, A. Fujishima, K. Honda, Bull. Chem. Soc. Jpn. 49 (1976) 355–358.
[16] M. S. Wrighton, A. B. Ellis, P. T. Wolczanski, D. L. Morse, H. B. Abrahamson,
D. S. Ginley, J. Am. Chem. Soc. 98 (1976) 2774–2779.
[17] H. G. Kim, O. S. Becker, J. S. Jang, S. M. Ji, P. H. Borse, J. S. Lee, J. Solid State
Chem. 179 (2006) 1214–1218.
[18] J. H. Kennedy, J. K. W. Frese, J. Electrochem. Soc. 123 (1976) 1683–4686.
[19] K. J. Pyper, T. C. Evans, B. M. Bartlett, Chinese Chem. Lett. 26 (2015) 474–478.
[20] J. Zhu, W. Li, J. Li, Y. Li, H. Hu, Y. Yang, Electrochim. Acta. 112 (2013) 191–
198.
[21] J. Yourey, K. Pyper, J. Phys. Chem. 117 (2013) 8707–8718.
[22] Y. Park, K. J. McDonald, K.-S. Choi, Chem. Soc. Rev. 42 (2013) 2321–2337.
[23] S. P. Berglund, D. W. Flaherty, N. T. Hahn, A. J. Bard, C. B. Mullins, J. Phys.
Chem. C. 115 (2011) 3794–3802.
[24] Z.-F. Huang, L. Pan, J.-J. Zou, X. Zhang, L. Wang, Nanoscale. 6 (2014) 14044–
14063.

21
[25] K. Sayama, A. Nomura, T. Arai, T. Sugita, R. Abe, T. Oi, Y. Iwasaki, Y. Abe, H.
Sugihara, J. Phys. Chem. B. 110 (2006) 11352–11360.
[26] C. D. Morton, I. J. Slipper, M. J. K. Thomas, B. D. Alexander, J. Photochem.
Photobiol. A Chem. 216 (2010) 209–214.
[27] H. Mandal, S. Shyamal, P. Hajra, A. Bera, D. Sariket, S. Kundu, S. Bhattacharya,
RSC Adv. 6 (2016) 4992–4999.
[28] S. K. Biswas, J. O. Baeg, Int. J. Hydrogen Energy. 38 (2013) 14451–14457.
[29] C. S. Enache, D. Lloyd, M. R. Damen, J. Schoonman, R. Van De Krol, J. Phys.
Chem. C. 113 (2009) 19351–19360.
[30] J. Ye, Z. Zou, M. Oshikiri, A. Matsushita, Chem. Phys. Lett. 356 (2002) 221–
226.
[31] Z.-F. Huang, L. Pan, J.-J. Zou, X. Zhang, L. Wang, Nanoscale. 6 (2014) 14044–
14063.
[32] F. F. Abdi, T. J. Savenije, M. M. May, B. Dam, R. Van De Krol, J. Phys. Chem.
Lett. 4 (2013) 2752–2757.
[33] A. J. E. Rettie, W. D. Chemelewski, D. Emin, C. B. Mullins, J. Phys. Chem. Lett.
7 (2016) 471–479.
[34] W. Luo, Z. Wang, L. Wan, Z. Li, T. Yu, Z. Zou, J. Phys. D. Appl. Phys. 43
(2010) 405402.
[35] G. Xi, J. Ye, Chem. Commun. 46 (2010) 1893–1895.
[36] J. Su, L. Guo, N. Bao, C. A. Grimes, Nano Lett. 11 (2011) 1928–1933.
[37] Y. H. Ng, A. Iwase, A. Kudo, R. Amal, J. Phys. Chem. Lett. 1 (2010) 2607–
2612.
[38] P. Chatchai, Y. Murakami, S. Kishioka, A. Y. Nosaka, Y. Nosaka, Electrochim.
Acta. 54 (2009) 1147–1152.

22
[39] X. Liu, Y. Kang, Mater. Lett. 164 (2016) 229–231.
[40] W. Yao, H. Iwai, J. Ye, Dalton Trans. 11 (2008) 1426–1430.
[41] H. W. Jeong, T. H. Jeon, J. S. Jang, W. Choi, H. Park, J. Phys. Chem. C. 117
(2013) 9104–9112.
[42] X. Zhang, X. Quan, S. Chen, Y. Zhang, J. Hazard. Mater. 177 (2010) 914–917.
[43] J. Yang, D. Wang, H. Han, L. Can, Acc. Chem. Res. 46 (2013) 1900–1909.
[44] H. Ye, H. S. Park, A. J. Bard, J. Phys. Chem. C. 115 (2011) 12464–12470.
[45] J. H. Kim, J. W. Jang, H. J. Kang, G. Magesh, J. Y. Kim, J. H. Kim, J. Lee, J. S.
Lee, J. Catal. 317 (2014) 126–134.
[46] M. F. Lichterman, M. R. Shaner, S. G. Handler, B. S. Brunschwig, H. B. Gray,
N. S. Lewis, N. S. Spurgeon, J. Phys. Chem. Lett. 4 (2013) 4188–4191.
[47] S. Xie, T. Zhai, Y. Zhu, W. Li, R. Qiu, Y. Tong, X. Lu, Int. J. Hydrogen Energy.
39 (2014) 4820–4827.
[48] M. Long, W. Cai, H. Kisch, J. Phys. Chem. C. 112 (2008) 548–554.
[49] Z. Li, W. Luo, M. Zhang, J. Feng, Z. Zou, Energy Environ. Sci. 6 (2013) 347–
370.
[50] T.W. Kim, K.-S. Choi, Science 343 (2014) 990–994.
[51] T. H. Jeon, W. Choi, H. Park, Phys. Chem. Chem. Phys. 13 (2011) 21392–21401.
[52] C. Ding, J. Shi, D. Wang, Z. Wang, N. Wang, G. Liu, F. Xiong, Phys. Chem.
Chem. Phys. 15 (2013) 4589–4595.
[53] S. K. Choi, W. Choi, H. Park, Phys. Chem. Chem. Phys. 15 (2013) 6499–507.
[54] J. Rossmeisl, A. Logadottir, J.K. Nørskov, Chem. Phys. 319 (2005) 178–184.
[55] M. Zhong, T. Hisatomi, Y. Kuang, J. Zhao, M. Liu, A. Iwase, Q. Jia, H.
Nishiyama, T. Minegishi, M. Nakabayashi, N. Shibata, R. Niishiro, C. Katayama,
H. Shibano, M. Katayama, A. Kudo, T. Yamada, K. Domen, J. Am. Chem. Soc.

23
137 (2015) 5053–5060.
[56] D. Cibrev, M. Jankulovska, T. Lana-Villarreal, R. Gómez, Int. J. Hydrogen
Energy. 38 (2013) 2746–2753.
[57] M. Amjad, D. Pletcher, C. Smith, J. Electrochem. Soc. 124 (1977) 203–206.
[58] J. Kaulen, H. J. Schäfer, Tetrahedron. 38 (1982) 3299–3308.
[59] B. E. Conway, M. A. Sattar, D. Gilroy, Electrochim. Acta. 14 (1969) 677–694.
[60] B. Ballarin, R. Seeber, D. Tonelli, A. Vaccari, J. Electroanal. Chem. 463 (1999)
123–127.
[61] V. Ganesh, S. Farzana, S. Berchmans, J. Power Sources. 196 (2011) 9890–9899.
[62] D. Wang, W. Yan, G.G. Botte, Electrochem. Commun. 13 (2011) 1135–1138.
[63] A. Andreev, V. Ivanova, K. Kirilov, G. Passage, Appl. Catal. A, Gen. 107 (1994)
189–199.
[64] L. Trotochaud, S. L. Young, J. K. Ranney, S. W. Boettcher, J. Am. Chem. Soc.
136 (2014) 6744–6753.
[65] Y. L. Lo, B. J. Hwang, J. Electrochem. Soc. 142 (1995) 445–450.
[66] D. Pletcher, J. Appl. Electrochem. 14 (1984) 403–415.
[67] P. Cox, D. Pletcher, J. Appl. Electrochem. 20 (1990) 549–554.
[68] K. Kinoshita, Electrochemical oxygen technology, Wiley-Interface, New York,
1992.
[69] M. F. Lichterman, K. Sun, S. Hu, X. Zhou, M. T. McDowell, M. R. Shaner, M.
H. Richter, E. J. Crumlin, A. I. Carim, F. H. Saadi, B. S. Brunschwig, N. S.
Lewis, Catal. Today. 262 (2016) 11–23.
[70] J. Quiñonero, T. Lana–Villarreal, R. Gómez, Appl. Catal. B Environ. 194 (2016)
141–149.
[71] E. Kádár, L. Sors, S. Kulcsár, E. Kánya, Thermochim. Acta. 107 (1986) 27–35.

24
[72] K.S. Kim, Surf. Sci. 43 (1974) 625-643.
[73] M. C. Biesinger, B. P. Payne, L. W. M. Lau, A. Gerson, R. S. C. Smart, Surf.
Interface Anal. 41 (2009) 324–332.
[74] A. P. Grosvenor, M. C. Biesinger, R. S. C. Smart, N. S. McIntyre, Surf. Sci. 600
(2006) 1771–1779.
Figure captions.
Figure 1. Cyclic voltammograms (scan rate: 10 mV·s-1) in the dark for BiVO4/Ni(OH)2
(black line) and FTO/Ni(OH)2 electrodes (red line), corresponding to deposition times
of (a) 10 min, (b) 20 min, (c) 30 min, (d) 40 min and (e) 50 min. Insets in (a) and (b):
detail of the voltammetric curves in the high potential region.
Figure 2. (a) Charge density associated with the NiOOH reduction peak vs. Ni(OH)2
deposition time, for BiVO4/Ni(OH)2 (black line) and FTO/Ni(OH)2 electrodes (red
line). (b) Current density attributable to the oxygen evolution reaction in the dark,
measured at 0.9 V vs. the charge density associated to the NiOOH reduction peak, for
BiVO4/Ni(OH)2 (black line) and FTO/Ni(OH)2 electrodes (red line).
25
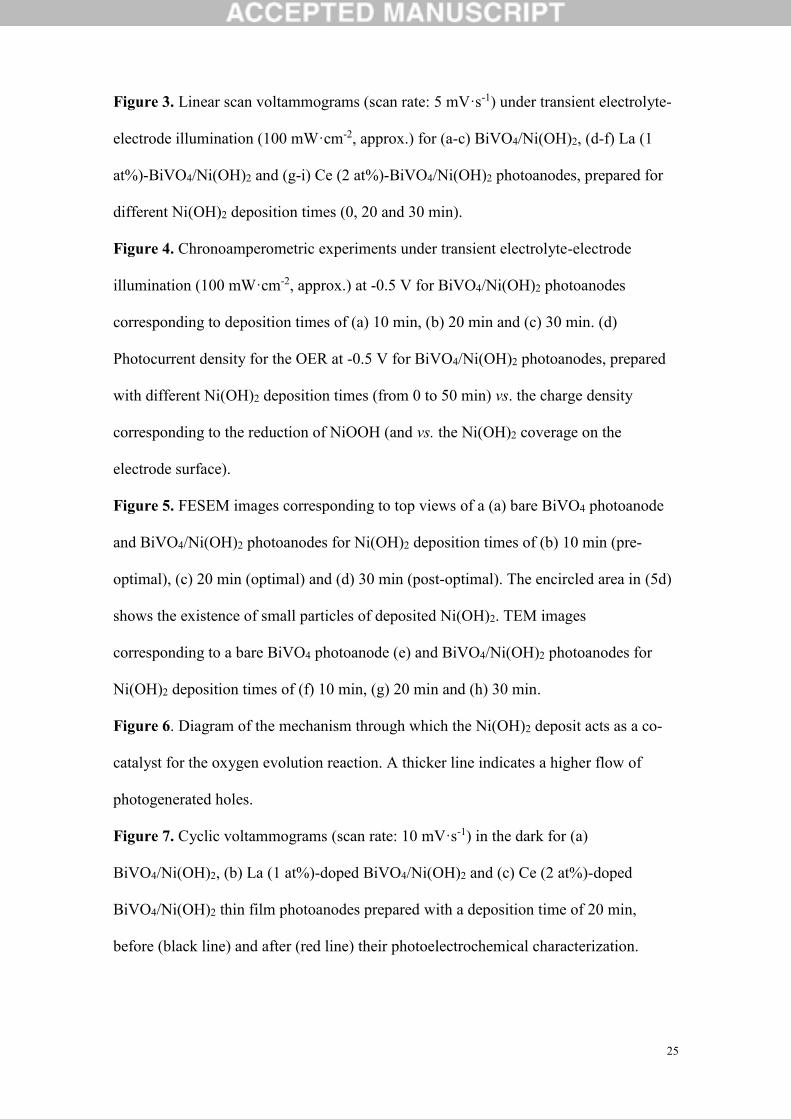
Figure 3. Linear scan voltammograms (scan rate: 5 mV·s-1) under transient electrolyte-
electrode illumination (100 mW·cm-2, approx.) for (a-c) BiVO4/Ni(OH)2, (d-f) La (1
at%)-BiVO4/Ni(OH)2 and (g-i) Ce (2 at%)-BiVO4/Ni(OH)2 photoanodes, prepared for
different Ni(OH)2 deposition times (0, 20 and 30 min).
Figure 4. Chronoamperometric experiments under transient electrolyte-electrode
illumination (100 mW·cm-2, approx.) at -0.5 V for BiVO4/Ni(OH)2 photoanodes
corresponding to deposition times of (a) 10 min, (b) 20 min and (c) 30 min. (d)
Photocurrent density for the OER at -0.5 V for BiVO4/Ni(OH)2 photoanodes, prepared
with different Ni(OH)2 deposition times (from 0 to 50 min) vs. the charge density
corresponding to the reduction of NiOOH (and vs. the Ni(OH)2 coverage on the
electrode surface).
Figure 5. FESEM images corresponding to top views of a (a) bare BiVO4 photoanode
and BiVO4/Ni(OH)2 photoanodes for Ni(OH)2 deposition times of (b) 10 min (pre-
optimal), (c) 20 min (optimal) and (d) 30 min (post-optimal). The encircled area in (5d)
shows the existence of small particles of deposited Ni(OH)2. TEM images
corresponding to a bare BiVO4 photoanode (e) and BiVO4/Ni(OH)2 photoanodes for
Ni(OH)2 deposition times of (f) 10 min, (g) 20 min and (h) 30 min.
Figure 6. Diagram of the mechanism through which the Ni(OH)2 deposit acts as a co-
catalyst for the oxygen evolution reaction. A thicker line indicates a higher flow of
photogenerated holes.
Figure 7. Cyclic voltammograms (scan rate: 10 mV·s-1) in the dark for (a)
BiVO4/Ni(OH)2, (b) La (1 at%)-doped BiVO4/Ni(OH)2 and (c) Ce (2 at%)-doped
BiVO4/Ni(OH)2 thin film photoanodes prepared with a deposition time of 20 min,
before (black line) and after (red line) their photoelectrochemical characterization.

26
Figure 8. Ni 2p XPS spectra for (a) BiVO4/Ni(OH)2, (b) La (1 at%)-BiVO4/Ni(OH)2
and (c) Ce (2 at%)-BiVO4/Ni(OH)2 photoanodes, prepared with a Ni(OH)2 deposition
time of 20 min.
Figure 9. (a) FESEM image corresponding to a top view of a FeVO4 photoanode. (b)
Cyclic voltammogram (scan rate: 10 mV·s-1) in the dark (black line) and linear scan
voltammogram (scan rate: 5 mV·s-1) under transient electrolyte-electrode illumination
(100 mW·cm-2, approx.) (red line) for a FeVO4 thin film photoanode.
Figure 10. (a-e) Cyclic voltammograms (scan rate: 10 mV·s-1) in the dark and (f-j)
linear scan voltammograms (scan rate: 5 mV·s-1) under transient electrolyte-electrode
illumination (100 mW·cm-2, approx.) for FeVO4/Ni(OH)2 electrodes corresponding to
Ni(OH)2 deposition times of (a, f) 10 min, (b, g) 20 min, (c, h) 30 min, (d, i) 40 min and
(e, j) 50 min. Red line in (g) corresponds to the linear scan voltammogram for a bare
FeVO4 photoanode.
Figure 11. Photocurrent density for the OER at 0.1 V for FeVO4/Ni(OH)2 photoanodes,
prepared with different Ni(OH)2 deposition times (from 0 to 50 min) vs. the charge
density corresponding to the reduction of NiOOH (and the Ni(OH)2 coverage on the
electrode surface).


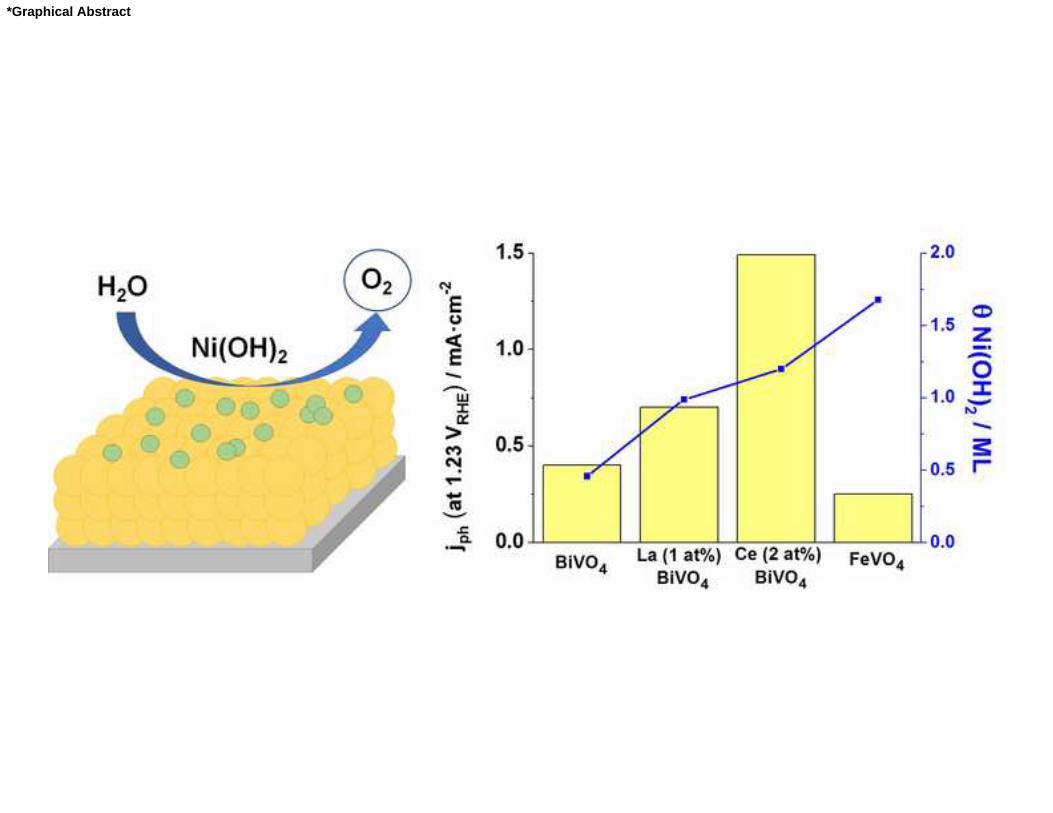
*Graphical Abstract