controlling iron defecieny anemia and … · waqas ullah khan graduate department of nutritional...
TRANSCRIPT

i
CONTROLLING IRON DEFICIENCY ANEMIA AND PREVENTING CALCIUM
DEFICIENCY IN BANGLADESHI CHILDREN: A NOVEL APPROACH USING A
MULTI-MICRONUTRIENT POWDER (MNP) FORMULATION
by
Waqas Ullah Khan
A thesis submitted in conformity with the requirements
for the degree of Masters of Science
Graduate Department of Nutritional Sciences
University of Toronto
© Copyright by Waqas Ullah Khan (2011)

ii
CONTROLLING IRON DEFICIENCY ANEMIA AND PREVENTING CALCIUM DEFICIENCY IN BANGLADESHI CHILDREN: A NOVEL APPROACH USING A
MULTI-MICRONUTRIENT POWDER (MNP) FORMULATION
Master of Science, 2011
Waqas Ullah Khan Graduate Department of Nutritional Sciences
University of Toronto
ABSTRACT
Iron deficiency anemia (IDA) and calcium deficiency affect millions of children globally.
Sprinkles is a multi-micronutrient powder (MNP) that has successfully treated anemic infants
and can be modified to include additional micronutrients. The efficacy for treating IDA and
preventing calcium deficiency requires evaluation due to potential nutrient interactions. We
assessed the efficacy of Sprinkles MNP including iron with and without calcium on
hemoglobin (Hb) response in 100 anemic rural Bangladeshi infants for 2 months. Sprinkles
MNP with and without calcium resulted in a significantly higher Hb concentrations in both
groups (P<0.0001 and P<0.0001). However, infants who received Sprinkles MNP without
calcium had a significantly higher change in Hb concentration (P=0.024) and rate of recovery
from anemia (P=0.008). No differences in socio-demographic or dietary characteristics were
documented between groups. Although both groups had an improvement in Hb status, the
antagonistic interaction between iron and calcium requires further study.

iii
To my mother (Shahida Khan), father (Rajab Khan), brother (Imran), sisters (Sofia, Saema,
and Shafia), Dr. Zlotkin, and the wonderful people of Bangladesh

iv
Acknowledgements
First, and foremost, I would like to thank God for blessing me with this life learning
experience and keeping me safe during my adventures.
I would like to acknowledge all of the infants and their mothers, fathers, and villages
who participated in our study. Without them, the work presented in this thesis would not
have been possible. With them, we were able to fill the knowledge gap on two global health
concerns plaguing not only millions of Bangladeshi children, but many others around the
world. I hope we have made a positive impact on the lives we touched just as they have
made on mine.
I would also like to thank my supervisor Dr. Stanley H. Zlotkin for all of his support
throughout my Masters career. He has been a source of inspiration, an excellent role model,
and I am extremely grateful to him for trusting and believing in me, and giving me this
opportunity to mature scientifically and otherwise. I would also like to express my deepest
gratitude to my thesis advisory committee: Dr. Daniel Sellen, Dr. Pauline Darling, Dr.
Harvey Anderson, and Dr. Zia Hyder for bringing their expertise and support to this project.
I am grateful to our colleagues at BRAC for their hospitality and support. I thank all
of the data collectors, community health workers, and field managers Azad Bhai and Bashir
Bhai for their extraordinary work throughout this study. It was truly an honour to be apart of
such a highly motivated, hard working, and sincere group of people. The warmth of their
faces will always be engrained in my memory. Also, I would like to thank the following
people at the BRAC head office: Jalal, Turjo, Raniya, Anindita, Rehnuma, and Sabia. One

v
person whom I would especially like to thank at BRAC is Hasina Shikder (Aka “Super
Mohilla #2”) for the important role she played in this study. Her guidance and support
throughout my stay in Bangladesh are greatly appreciated and I am truly honoured to have
met such a wonderful, intelligent, and caring person.
To my colleagues and friends Sohana Shafique (aka “Super Mohilla #1”) and Yaseer
Shakur, your wisdom, intelligence, and kindness have truly been appreciated throughout
these past years. I look forward to seeing big things coming from the both of you in the
future and can’t wait to hear about your adventures! I would also like to thank my good
friends Greg Staios, Fawad Chughtai, Ali Shahzada, Kristy Hackett (aka “Super Mohilla
#3”), Kevin Ferreira, Paul E. Kwan, Laszlo Csampai, Andre Dos Santos, Bawa Prashar,
Brian Caceras, Adrian Nicolucci, Lilatool Shakur, and Heather Miller for being there for me
during the good, the bad, and the ugly times of my Masters career.
Lastly, I would like to extend my deepest thanks to my family for always supporting
and motivating me. To my siblings Sofia, Saema, Imran, and Shafia, although we all have
our own unique personalities, I don’t think I could get along with anyone better than you
guys. To my brother-in-law Sameel, your friendship has been appreciated, to many more
NHL and table tennis games to come! I would especially like to thank my parents for their
love and support, and sacrificing so much for my siblings and I. They have given us the
opportunity to pursue our dreams and I shall always be grateful to them. Mommy your
guidance, lessons, and warmth are always going to be apart of me. Likewise, Baba your
words of wisdom have always been appreciated.

vi
This research was funded by a grant from the H.J. Heinz Company Foundation.
Personal support was from the Ontario Ministry of Training, Colleges, and Universities
Ontario Graduate Scholarship (OGS).
vii
Table of Contents
Abstract _________________________________________________________________ ii
Dedication _______________________________________________________________ iii
Acknowledgements ________________________________________________________ iv
Table of Contents ________________________________________________________ vii
List of Tables _____________________________________________________________ x
List of Figures ___________________________________________________________ xii
List of Abbreviations _____________________________________________________ xii
Chapter 1.0 Introduction ___________________________________________________ 1
Chapter 2.0 Review of the literatrue 4
2.1 Micronutrients_______________________________________________________ 4 2.1.1 Importance of Micronutrients ________________________________________ 4 2.1.2 Definition of Micronutrients _________________________________________ 4 2.1.3 Micronutrient Deficiency____________________________________________ 5 2.1.4 Populations at Risk of Developing Micronutrient Deficiencies ______________ 5 2.1.5 Global Burden of Micronutrient Deficiencies ____________________________ 5
2.2 Anemia _____________________________________________________________ 6 2.2.1 Definition of Anemia _______________________________________________ 6 2.2.2 Global Burden of Anemia ___________________________________________ 7 2.2.3 Etiology of Anemia ________________________________________________ 8
2.3 Iron_______________________________________________________________ 10 2.3.1 The Importance of Iron in the Body __________________________________ 10 2.3.2 Iron in the Body __________________________________________________ 11 2.3.3 Regulation of Iron Metabolism ______________________________________ 11 2.3.4 Absorption, Uptake, and Transport of Iron _____________________________ 12 2.3.5 Cellular and Systemic Regulation of Iron Homeostasis ___________________ 13 2.3.6 Souces and Bioavailability of Iron ___________________________________ 13 2.3.7 Iron Status During Infancy _________________________________________ 14 2.3.8 Stages of Iron Deficiency __________________________________________ 14 2.3.9 Etiology of Iron Deficiency Anemia in Infants 6 months and Older _________ 15 2.3.10 Health and Socioeconomic Implications of Iron Deficiency Anemia _______ 17 2.3.11 Global Prevalence of Iron Deficiency Anemia _________________________ 20 2.3.12 Prevalence of Iron Deficiency Anemia in Bangladesh ___________________ 21 2.3.13 Screening Methods for Iron Deficiency Anemia _______________________ 21 2.3.14 Hemoglobin Cut-Off Value ________________________________________ 22
2.4 Calcium ___________________________________________________________ 23 2.4.1 The Importance of Calcium in the Body _______________________________ 23 2.4.2 Calcium in the Body ______________________________________________ 24
viii
2.4.3 Calcium Absorption, Uptake, and Transport ____________________________ 24 2.4.4 Calcium Excretion _______________________________________________ 25 2.4.5 Regulation of Calcium Homeostasis __________________________________ 25 2.4.6 Sources and Bioavailability of Calcium _______________________________ 26 2.4.7 Calcium Status During Infancy ______________________________________ 27 2.4.8 Calcium Deficiency ______________________________________________ 27 2.4.9 Etiology of Calcium Deficiency _____________________________________ 28 2.4.10 Health and Economic Implications of Calcium Deficiency _______________ 29 2.4.11 Global Prevalence of Calcium Deficiency ____________________________ 31 2.4.12 Prevalence of Calcium Deficiency in Bangladesh ______________________ 32 2.4.13 Screening Methods for Calcium Deficiency ___________________________ 33
2.5 The Interaction between Iron and Calcium _____________________________ 34 2.5.1 Studies Examining the Interaction between Iron and Calcium ______________ 34 2.5.2 Mechanisms of Iron and Calcium’s Nutrient-Nutrient Interaction ___________ 37 2.5.3 Other Nutrient-Nutrient Interactions of Importance 38
2.6 Strategies for Preventing and Treating Micronutrient Deficiencies __________ 38 2.6.1 Strategies for Preventing and Treating Micronutrient Deficiencies __________ 38 2.6.2 Multiple Micronutrient Powder (MNP) Formulation – “Sprinkles Home-Forticiation __________________________________________________________ 42
Chapter 3.0 Rationale, Objectives and Hypotheses_____________________________ 46
3.1 Rationale __________________________________________________________ 46
3.2 Objectives ________________________________________________________ 47
3.3 Hypotheses_________________________________________________________ 47
Chapter 4.0 Thesis Study ___________________________________________________ 48
4.1 Introduction__________________________________________________________ 48
4.2 Methods _________________________________________________________ 50 4.2.1 Study Setting ____________________________________________________ 50 4.2.2 Study Collaborative Partner - BRAC_________________________________ 51 4.2.3 Study Subjects _______________________________________________ 51 4.2.4 Ethical Approval _______________________________________________ 52 4.2.5 Multi-Micronutrient Powder (MNP) Formulations 52 4.2.6 Sample Size ___________________________________________________ 53 4.2.7 Study Design ____________________________________________________ 54 4.2.8 Study Logistics, Data Collection, and Compliance _______________________ 54 4.2.9 Anthropometric and Biochemical Measurements ________________________ 57 4.2.10 Study Questionnaires ____________________________________________ 57 4.2.11 Statistical Analysis_______________________________________________ 60
4.3 Results __________________________________________________________ 61 4.3.1 Study Attrition _________________________________________________ 61 4.3.2 Infant Baseline Characteristics ______________________________________ 61 4.3.3 Household Socio-demographic Characteristics __________________________ 62

ix
4.3.4 Primary Outcome: Effects on Infants Hemoglobin Concentration ___________ 63 4.3.5 Infant Food Consumption with an Emphasis on Dietary Intake of Iron and Calcium ____________________________________________________________ 64 4.3.6 Adherence and Side Effects_________________________________________ 65 4.3.7 End-line Anthropometric Characteristics ______________________________ 65
4.4 Discussion ________________________________________________________ 77
4.5 Study Limitations ___________________________________________________ 85
Chapter 5.0 Conclusions and Future Considerations 87
5.1 Conclusions 87
5.2 Future Considerations _____________________________________________ 88
References ____________________________________________________________ 90
Appendices ___________________________________________________________ 107
Appendix A: Baseline Questionnaires_____________________________________ 107
Appendix B: Morbidity, Monitoring, and Compliance Forms_________________ 135
Appendix C: Self-Coaching Material _____________________________________ 140
Appendix D: End-line Questionnaires ____________________________________ 144

x
List of Tables
Table 2.2.1 Public health significance of anemia in populations based on the estimated prevalence of anemia _______________________________________________________ 7 Table 4.2.5 Sprinkles MNP formulations used for the control and intervention treatments 53 Table 4.2.6 Sample size calculation using different parameters _____________________ 54 Table 4.3.2.1 Infant characteristics at baseline by treatment group __________________ 67 Table 4.3.3.1 Household socio-demographic characteristics by treatment group at baseline 69 Table 4.3.4.1 Hemoglobin concentration and the percentage of non-anemic children by treatment group, at baseline, and after 2 months of treatment _______________________ 70 Table 4.3.4.5 Correlations between covariates and change in infants' hemoglobin _______ 73 Table 4.3.4.6 Univariate analysis of variables associated with change in infants’ hemoglobin _________________________________________________________________________74 Table 4.3.4.7 Multivariate analysis of variables associated with change in infants’ hemoglobin ______________________________________________________________ 74 Table 4.3.5.1 Mean baseline iron and calcium nutrient intakes from complementary foods and breastmilk compared with recommended1 nutrient intakes for infants 6 to 11 months of age _____________________________________________________________________ 75
Table 4.3.5.2 Mean end-line iron and calcium nutrient intakes from complementary foods and breastmilk compared with recommended nutrient intakes for infants 6 to 11 months of age_____________________________________________________________________ 75 Table 4.3.5.3 Proportion of infants who met the recommended dietary allowance for iron and adequate intake for calcium based on treatment group ____________________________ 76

xi
List of Figures
Figure 2.2.2 WHO geographic distribution of anemia prevalence _____________________ 8 Figure 4.3.1 Study design and attrition _______________________________________ 66 Figure 4.3.2.1 Box plots of hemoglobin concentration for the two treatment groups at baseline of the study _____________________________________________________ 68 Figure 4.3.4.2 Box plots of hemoglobin concentration for the two treatment groups at the end-line of the study _____________________________________________________ 71 Figure 4.3.4.3 Box plots of the change in hemoglobin concentration between the two treatment groups ________________________________________________________ 72 Figure 4.3.4.4 Number of children remaining anemic (hemoglobin < 100 g/L) in each group at the end of the 2 month treatment period ____________________________________ 73

xii
List of Abbreviations
AI Adequate Intake
ALP Alkaline Phosphatase
CHW Community Health Worker
DASH Dietary Approaches to Stop Hypertension
DC Data Collector
DRI Dietary Reference Intake
FAO Food and Agriculture Organization
FFQ Food Frequency Questionnaire
FSNSP Food Security and Nutrition Surveillance Project
Hb Hemoglobin
IDA Iron Deficiency Anemia
INACG International Nutritional Anemia Consultative Group
IOM Institute of Medicine
MNP Micronutrient Powder
PR Principal Researcher
PTH Parathyroid Hormone
RA Research Assistant/Translator Receptor
RCT Randomized Controlled Trial
RDA Recommended Dietary Allowance
RNI Recommended Nutrient Intake
SES Socioeconomic Status
TNO Thana Nirbahi Officer
UN United Nations

xiii
UNICEF United Nations Children’s Fund
WAZ Weight-for-Age Z-score
WB World Bank
WHO World Health Organisation

1
Chapter 1.0 Introduction
Evidence suggests that micronutrient deficiencies are associated with problems in early
development and behaviour (Grantham-McGregor and Ani 2001). Iron deficiency is the most
common nutritional deficiency in the world and is considered a major cause of anemia,
particularly during infancy and early childhood when there is rapid growth and high nutritional
demand (Stoltzfus 2001; UNICEF 2001; Zlotkin 2003; Zlotkin, Arthur et al. 2003; Dewey 2007).
In terms of absolute numbers, the World Health Organization (WHO) and United Nations
Children’s Fund (UNICEF) estimate that approximately 750 million children suffer from iron
deficiency anemia (IDA), with the majority coming from developing countries (Stoltzfus 2001;
Yip 2002; Shamah and Villalpando 2006). Less is known about the prevalence of calcium
deficiency, but epidemiological studies and supplementation trials in both developed and
developing countries suggest low calcium intake among infants and children (Thacher, Fischer et
al. 1999; Flynn 2003; Pettifor 2004; Combs, Hassan et al. 2008). This leads to the consensus
that both iron and calcium deficiency are major public health problems (Viteri 1997; UNICEF
2001; Flynn 2003; WHO 2004; Pettifor 2008).
In low income countries, providing a diet that is nutritionally adequate and safe for
children 6 to 24 months of age is difficult to achieve (Mensah and Tomkins 2003). This is
because the majority of complementary foods consumed are based on plants, cereals, or roots
that have a low micronutrient content, poor micronutrient bioavailability, and contain high
amounts of phytates, oxalates, dietary fibre, and polyphenols which are known inhibiters of iron
and calcium (Gibson, Ferguson et al. 1998; Lind, Lonnerdal et al. 2003; Mensah and Tomkins
2003). Due to these conditions, the WHO has raised concerns about the ability of local
complementary foods to meet the dietary requirements of iron and calcium (Lutter 2003). This,

2
in turn, has helped push the agenda for supplementation, food fortification, and home-
fortification strategies to guarantee the adequate intake of micronutrients that are otherwise
lacking in the diet of the general public (Latham, Ash et al. 2003; Shamah and Villalpando 2006;
Dewey 2007; Hettiarachchi, Liyanage et al. 2008).
Most randomized controlled supplementation trials have examined the effect of single
nutrients, either iron or calcium, on infants’ development and behaviour. Short-term studies
examining iron supplementation among anemic infants have shown no differences in motor or
mental performance (Black, Baqui et al. 2004). In contrast, long-term iron supplementation
trials have shown a significant improvement in children’s development and behaviour
(Idjradinata and Pollitt 1993; Stoltzfus, Kvalsvig et al. 2001; Lozoff, De Andraca et al. 2003).
Calcium supplementation studies have also shown beneficial effects on reducing bone fractures,
hypertension, and rickets in children (Appel, Moore et al. 1997; Cumming and Nevitt 1997;
Obarzanek and Moore 1999; Thacher, Fischer et al. 1999; Shea, Wells et al. 2002; Pettifor 2004;
Combs, Hassan et al. 2008).
Although single nutrient studies allow investigators to isolate the effects associated with
specific nutrients, infants with low-nutrient diets often have multiple deficiencies (Black, Baqui
et al. 2004; Borwankar, Sanghvi et al. 2007). There is a large body of literature supporting an
inhibitory effect of dietary calcium on iron absorption (Kletzein 1935; Greig 1952; Barton,
Conrad et al. 1983; Deehr, Dallal et al. 1990; Hallberg, Brune et al. 1991; Preziosi, Hercberg et
al. 1994; Gleerup, Rossander-Hulthen et al. 1995). However, very few of these studies were
conducted in a pediatric population and none to our knowledge have examined this nutrient-
nutrient interaction in infants diagnosed with anemia and calcium deficiency. Moreover, the
studies performed were often short-term (single-meal) trials, used interventions that are not
readily available in the developing world (iron-fortified infant formula), and included healthy

3
subjects with adequate iron and calcium intakes (Dalton, Sargent et al. 1997; Hallberg 1998;
Ames, Gorham et al. 1999; Lynch 2000). Although highly informative, many of the conditions
do not adequately reflect the realities seen in most developing countries.
Micronutrient powders (MNP) are an innovative home-fortification strategy to increase
the dietary intake of iron and other micronutrients in complementary foods with no significant
changes in their colour, flavour, or taste (Schauer and Zlotkin 2003; Zlotkin, Antwi et al. 2003).
Community-based trials have shown that using Sprinkles MNP containing iron, Vitamin A, zinc,
Vitamin C, and folic acid over an 8 week period either once/day, weekly, or flexibly can treat
IDA infants and young children aged 6 to 24 months (Zlotkin, Schauer et al. 2005; Christofides,
Asante et al. 2006; Hyder, Haseen et al. 2007; Ip, Hyder et al. 2009). Interestingly, the Sprinkles
MNP formulation has never included calcium (Zlotkin and Tondeur 2007).
In this study, we incorporated calcium in the Sprinkles MNP formulation. Our primary
objective was to compare the hemoglobin (Hb) status of infants’ age 6 to 11 months with anemia
that are receiving Sprinkles MNP (containing iron) with and without calcium. Our secondary
objective was to investigate whether calcium intake can be increased to its AI in anemic infants
(age 6-11 months) via calcium and iron-containing Sprinkles MNP without interfering in the
absorption of iron.
4
Chapter 2.0 Review of the Literature
This review of the literature begins with a brief discussion on micronutrients and their
importance. This section is followed by an overview of anemia, its global burden, and etiology.
A more in-depth analysis of iron and calcium’s importance, bodily stores, regulation,
deficiencies, consequences of deficiencies, diagnoses, and treatments follows. Subsequently,
there is a discussion on nutrient-nutrient interactions with an emphasis on calcium and iron. The
review concludes with an examination of the current strategies used to prevent and treat
micronutrient deficiencies.
2.1 Micronutrients
2.1.1 Importance of Micronutrients
When a panel of the world’s leading economists were asked how $75 billion should be
invested for advancing global welfare, particularly of the developing countries, they ranked
providing “micronutrient supplements for children” first. In their opinion, providing
micronutrients would offer a better cost/benefit ratio than trade liberalization, new agricultural
technologies, reducing the cost of education programs, climate change, water and sanitation
programmes, and addressing other global concerns (Consensus 2004; Consensus 2008).
2.1.2 Definition of Micronutrients
Called “micronutrients” because they are required only in small amounts, they consist of
vitamins and minerals that are necessary for the body to produce enzymes, hormones, and other
substances. As miniscule as their amounts may be, the absence of micronutrients in one’s diet
can have severe consequences on growth, development, and survival (Sanghvi, Ross et al. 2007;
WHO 2010).
5
2.1.3 Micronutrient Deficiency
According to the WHO, one out of three people in developing countries are affected by
micronutrient deficiencies (WHO 2010). Deficiencies are caused by habitually low dietary
consumption of micronutrients in relation to their physiological need or excessive losses due to
illness, poor absorption, or bleeding. In most environments, deficiencies are often due to a
combination of both low micronutrient intake and micronutrient exhaustion; conditions found in
every region of the world (Tontisirin, Nantel et al. 2002; Borwankar, Sanghvi et al. 2007)
2.1.4 Populations at Risk of Developing Micronutrient Deficiencies
Countries in sub-Saharan Africa and South Asia have the highest prevalence and absolute
numbers of people suffering from micronutrient deficiencies in the world. Additionally,
countries in East Asia, Central Asia, Eastern Europe, and Latin America have sizeable
populations with a high prevalence of micronutrient deficiencies. Interestingly, economic
prosperity does not always protect communities or countries against these deficiencies.
However, it is often the poorest segments (both urban and rural) of a population that suffer from
the more severe forms of micronutrient deficiencies. Moreover, deficiencies usually cluster in
individuals, households, and communities with the same populations often affected by more than
one micronutrient deficiency at a time. This, in turn, creates a need to address multiple-
micronutrient deficiencies (Borwankar, Sanghvi et al. 2007).
2.1.5 Global Burden of Micronutrient Deficiencies
Although all age groups are vulnerable to the harmful effects of micronutrient
deficiencies, they are particularly damaging and difficult to reverse when they occur during fetal
development and early childhood (Sanghvi, Ross et al. 2007). Micronutrient deficiencies in
infants and young children increase the risk of acquiring an infectious illness and death from
6
diarrhoea, measles, malaria, and pneumonia (West 2002). In addition to affecting the morbidity
and mortality of infants and children, micronutrient deficiencies cause an immeasurable burden
on families, healthcare services, education systems, and economies. Studies conducted by the
World Bank (WB) have found that countries whose populations suffer from a high prevalence of
micronutrient deficiencies can experience economic losses as high as 5% of their gross domestic
product (Mannar and Sankar 2004). With substantial evidence supporting the negative impact of
micronutrient deficiencies and the availability of proven cost-effective interventions, there has
been a global commitment to address this concern. In May 2002, the United Nations (UN)
General Assembly held a “Special Session on Children” where former UN Secretary General
Kofi Annan, 70 heads of state, and high ranking government officials from 187 countries
committed to reducing vitamin and mineral deficiencies among children. Unfortunately, only a
small percentage of these vulnerable populations have been reached with effective interventions
and, thus, the magnitude of micronutrient deficiencies continues to grow (Sanghvi, Ameringen et
al. 2007).
2.2 Anemia
2.2.1 Definition of Anemia
Anemia is a condition characterized by a reduction in the oxygen carrying capacity of
blood. In a clinical setting, it is observed by reduced levels of hemoglobin (Hb) and red cell
mass (hematocrit). To better assess the prevalence of anemia for various population groups, the
WHO has recommended specific cut-off points of Hb. Concerning children between the ages of
6 months to 5 years, an Hb concentration below 110 g/L is considered anemic (WHO, UNICEF
et al. 2001). An epidemiological criterion for measuring the public health significance of anemia
has also been developed. When the number of individuals with Hb values below normal is

7
greater than 5.0% in a given population, anemia is considered a public health concern
(Zimmermann and Hurrell 2007). The criteria for assessing the magnitude of anemia in relation
to its public health significance are shown in Table 2.2.1:
Table 2.2.1. Public health significance of anemia in populations based on the estimated prevalence of anemia.
Public health significance Prevalence of anemia (%)
Severe ≥ 40
Moderate 20.0 – 39.9
Mild 5.0 – 19.9
Normal ≤ 4.9
Adapted from WHO Guidelines (WHO, UNICEF et al. 2001).
2.2.2 Global Burden of Anemia
Anemia is a major public health concern and is the most prevalent nutrition problem in
the world (Solon, Sarol et al. 2003; Gera, Sachdev et al. 2007). Recently, the WHO estimated
that over 2.15 billion people suffer from anemia, with women and children predominantly
affected (Solon, Sarol et al. 2003; WHO 2004). Although it has been recognized as a public-
health problem for many years, little progress has been made towards improvement and its
prevalence in children and non-pregnant women has declined only in some countries. However,
from a global perspective, the overall prevalence of anemia has remained steady over the past 20
years and is still unacceptably high (Figure 2.2.2)(Borwankar, Sanghvi et al. 2007; Jamil,
Rahman et al. 2008). The most affected populations are found in the developing countries of
Africa and Asia where the WHO estimates 39% of children younger than 5 years old, 48% of
children between 5 and 14 years of age, 42% of all women, and 52% of pregnant women are
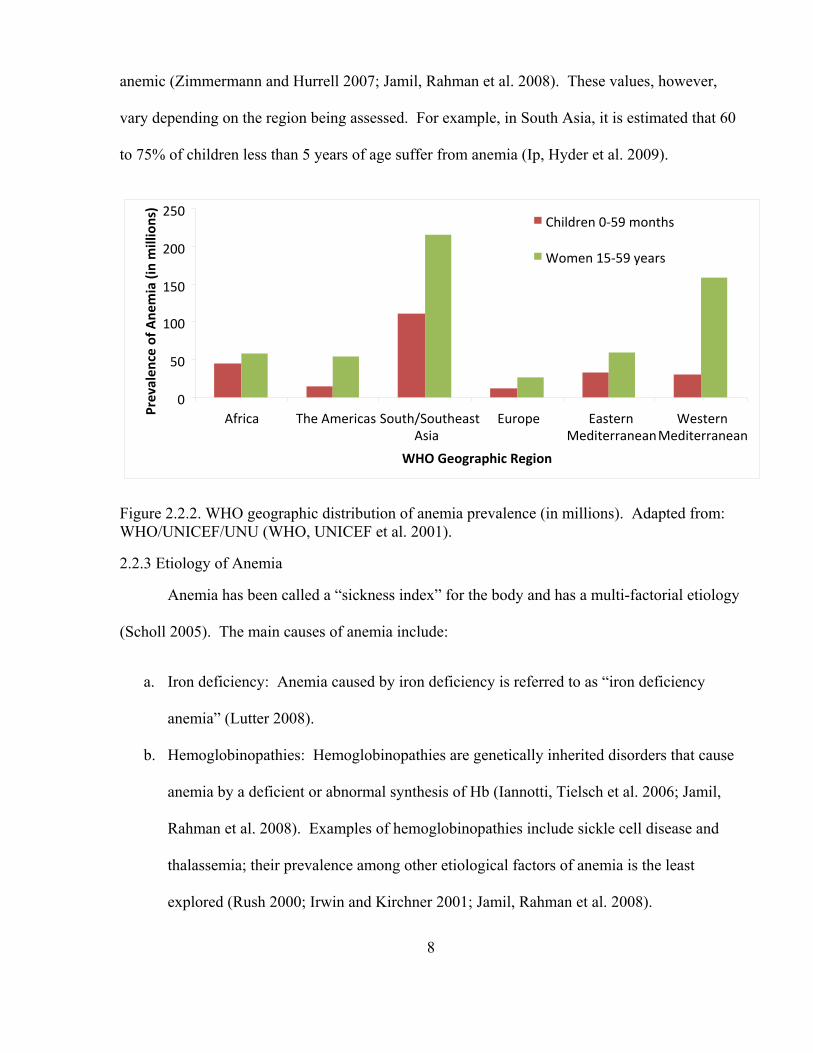
anemic (Zimmermann and Hurrell 2007; Jamil, Rahman et al. 2008). These values, however,
vary depending on the region being assessed. For example, in South Asia, it is estimated that 60
to 75% of children less than 5 years of age suffer from anemia (Ip, Hyder et al. 2009).
0
50
100
150
200
250
Africa The Americas South/SoutheastAsia
Europe Eastern Mediterranean
WesternMediterranean
WHO Geographic Region
Prevalen
ce of A
nemia (in millions)
Children 0‐59 months
Women 15‐59 years
Figure 2.2.2. WHO geographic distribution of anemia prevalence (in millions). Adapted from: WHO/UNICEF/UNU (WHO, UNICEF et al. 2001).
2.2.3 Etiology of Anemia
Anemia has been called a “sickness index” for the body and has a multi-factorial etiology
(Scholl 2005). The main causes of anemia include:
a. Iron deficiency: Anemia caused by iron deficiency is referred to as “iron deficiency
anemia” (Lutter 2008).
b. Hemoglobinopathies: Hemoglobinopathies are genetically inherited disorders that cause
anemia by a deficient or abnormal synthesis of Hb (Iannotti, Tielsch et al. 2006; Jamil,
Rahman et al. 2008). Examples of hemoglobinopathies include sickle cell disease and
thalassemia; their prevalence among other etiological factors of anemia is the least
explored (Rush 2000; Irwin and Kirchner 2001; Jamil, Rahman et al. 2008).
8

9
c. Other Nutritional Deficiencies: Vitamins B-12, B-6, A, riboflavin, and folic acid are all
essential in directly or indirectly promoting hematopoiesis (Rush 2000; Cook 2005;
Iannotti, Tielsch et al. 2006; Lutter 2008). Similar to hemoglobinopathies, the magnitude
of their effect on anemia prevalence is unclear (UNICEF 2004).
d. Conditions that Cause Blood Loss or Hemolysis:
• Hookworm/Parasite Infection: Hookworm/parasite infections cause anemia by
way of chronic intestinal bleeding (Rush 2000). Adult hookworms attach to the
mucosa in the upper small intestine where they ingest the host’s tissue and blood.
Blood is primarily lost when it passes through the hookworm’s intestinal tract and
is expelled during feeding, but can also occur through the host’s damaged mucosa
(Stoltzfus, Dreyfuss et al. 1997).
• Malaria: Malarial disease causes destruction of the red blood cells while
preventing erythropoiesis (Stoltzfus, Chwaya et al. 1997).
e. Chronic Disease: In some countries anemia as a result of chronic disease ranks second to
iron deficiency in prevalence. This form of anemia develops as part of a host response to
a wide range of disorders that involve the body’s red blood cells. While often associated
with an underlying condition, anemia of chronic disease can also develop when an
infection or inflammatory process is acute (Scholl 2005).
Although there are numerous causes of anemia, from a public-health perspective, iron
deficiency is the primary etiological factor worldwide and particularly effects children living in
developing countries (Surico, Muggeo et al. 2002; Sachdev, Gera et al. 2005; Mahoney 2008).
As a global average, the WHO estimates that approximately 50% of all anemia cases are
diagnosed as IDA (Qu, Huang et al.). However, in some populations, as much as 90% of anemia

10
cases can result directly from iron deficiency (Stoltzfus 2001). Moreover, when other causes of
anemia are recognized, iron deficiency is still often seen as the predominant nutritional
deficiency causing anemia (WHO, UNICEF et al. 2001).
2.3 Iron
2.3.1 The Importance of Iron in the Body
Iron is an essential micronutrient because it plays a vital role in several physiological
functions including: transporting and storing oxygen (as a heme cofactor in hemoglobin and
myoglobin), enzymatic transfer of electrons (in cytochromes, ribonucleotide reductase, and
enzymes that manage oxygen radicals), ATP production, DNA synthesis, mitochondrial
functions, protection of cells from oxidative damage, and cellular proliferation (Bendich 2001;
Andrews 2004; McCann and Ames 2007; Nair and Iyengar 2009). Moreover, iron is a redox
metal and participates in many reversible one-electron oxidation-reduction reactions by
switching between two oxidation states, ferrous and ferric. This redox activity of iron allows it
to produce free radicals responsible for cell signalling processes and iron mediated toxicity (Nair
and Iyengar 2009). Regarding specific organs, iron is required by enzymes in the brain that are
involved in the myelination of neurons used in sensory systems (visual and auditory) and
learning and interactive behaviours. The synthesis of the neurotransmitters dopamine (tyrosine
hydroxylase) and serotonin (tryptophan hydroxylase) are also sensitive to changes in the body’s
iron status (Iannotti, Tielsch et al. 2006; McCann and Ames 2007). Similar to humans,
pathogens also require iron to survive and many have developed complex mechanisms for its
acquisition and proliferation in iron deficient environments. In response to this threat from
pathogens and free radicals, the human body has thus developed its own intricate mechanisms to
regulate iron supply for cellular growth and function (Nair and Iyengar 2009).

11
2.3.2 Iron in the Body
Iron in the body can be classified into two categories: functional or storage iron.
Functional iron refers to the iron used by Hb, myoglobin, and enzymatic reactions. Iron in its
functional form accounts for approximately 80% of the total body iron, with the majority being
found in Hb (roughly 65%) (Yip and Dallman 1996). Hb is a tetrameric hemeprotein present in
erythrocytes and is responsible for oxygen transport in the blood. Approximately 10 to 12% of
functional iron is located in myoglobin, which is a monomeric hemeprotein found in the muscles
and is responsible for fixing oxygen supplied by Hb. Only a small percentage of the body’s
functional iron (roughly 3%) is used for enzymatic activities (Yip and Dallman 1996; Oliveira
and Osorio 2005). Storage iron accounts for the remaining 20% of iron in the body and has no
physiological function. It is found in the form of ferritin and hemosiderin, serves only as a
reserve to replace losses of functional iron, and is present in the liver, spleen, and bone marrow
(Oliveira and Osorio 2005).
2.3.3 Regulation of Iron Metabolism
The primary function of iron metabolism is to recycle the iron released from destroyed
erythrocytes and incorporate it into the Hb of newly formed erythrocytes (erythropoiesis). Iron
is tightly conserved as it moves from circulating red blood cells (Hb) to iron stores (ferritin).
The main iron carrier in the blood is transferrin, which is located in the extracellular fluid and
plasma. Transferrin carries iron to the bone marrow where it is incorporated into newly formed
erythrocytes. Moreover, it also transfers iron from the monocyte and macrophage system where
iron is released from the erythrocyte. Once iron is released from the erythrocyte, it binds again
to transferrin and is taken to the bone marrow. During each cycle, a small amount of iron is
added to the stores as ferritin while a small percentage of the storage iron is passively released

12
into the plasma. Although the body tightly regulates the iron metabolic system, it is not 100%
efficient and iron is lost daily through urine, sweat, feces, and blood (Bendich 2001).
2.3.4 Absorption, Uptake, and Transport of Iron
In a healthy individual who has negligible iron loss, iron balance is regulated by the
control of iron absorption. Iron absorption occurs in the small intestine, where it is taken up by
the mucosal cells lining the intestinal lumen. Once exiting these cells, iron enters the capillaries
where it is bound to transferrin. Transferrin carries iron in the blood and delivers it to cells via
the transferrin receptor. Iron can remain bound to transferrin in the blood, within cells as
intracellular iron, or stored as ferritin. When iron intake is low and is not available for
absorption, ferritin iron is released to maintain optimal levels of iron needed for erythropoiesis
(Bendich 2001). Regarding the intestinal absorption of iron, there are at least four conditions
that can result in measureable changes: abnormal iron availability caused by iron overload or
deficiency, accelerated erythropoiesis, hypoxia, and inflammation. When the body experiences
iron overload and inflammation, iron absorption and plasma availability must be decreased.
Conversely, iron absorption and plasma availability are increased in response to iron deficiency,
accelerated erythropoiesis, and hypoxia. Overall, situations that require decreased iron
availability are coordinated with an interruption of intestinal absorption and retention of iron by
recycling macrophages. Conversely, when the situation requires an increase in iron availability,
there is an increase in intestinal absorption and enhanced macrophage iron release (Andrews
2004). Recently, hepcidin (a peptide protein produced by the liver) has been identified as
playing a vital role in iron homeostasis by controlling its absorption from the small intestine,
export from macrophages, and release from bodily stores. Hepcidin activation inhibits iron
absorption and release from stores and its synthesis is decreased by anemia and hypoxia, but

13
increased by inflammation and iron overload (Brittenham 2007; Borgna-Pignatti and Marsella
2008).
2.3.5 Cellular and Systemic Regulation of Iron Homeostasis
Approximately 20-25 mg/day of iron is required to allow erythropoiesis to occur at an
optimal rate for adults. With only 0.5-2.0 mg of iron obtained through intestinal absorption, the
majority comes from the recycling of iron already present in the body. The main contributor of
this source of iron is a specialized population of tissue macrophages that phagocytose damaged
erythrocytes, scavenge the iron from their Hb, and return it into circulation. The amount of iron
acquired through the macrophage recycling system enables the body to meet its daily iron needs.
Additional iron can also be obtained through the mobilization of cellular iron stores, especially
hepatocytes (Andrews 2004).
2.3.6 Sources and Bioavailability of Iron
Humans obtain their iron from food, which is in the form of heme or nonheme iron.
Heme iron is found in meat, poultry, and fish, accounts for approximately 5 to 10% of the daily
iron intake in most developed countries, and is 2 to 3 times more readily absorbed than nonheme
iron. Additionally, its absorption is less influenced by iron stores and the only dietary factor that
can inhibit heme iron absorption is calcium (Olivares, Walter et al. 1999; Panagiotou and Douros
2004). The main sources of nonheme iron are plant-based foods (fruits, vegetables, grains, and
nuts), eggs, dairy products, and iron fortified foods (Yip and Dallman 1996; Nair and Iyengar
2009). During digestion, nonheme iron is reduced from the ferric to ferrous form, which is more
readily absorbed. Nonheme iron absorption is enhanced by ascorbic acid and hydrochloric acid,
but is inhibited by polyphenols (found in certain vegetables and legumes), phytates (in cereals),
tannins (in tea), calcium, oxalic acid, and phosphate (Panagiotou and Douros 2004). In South-

14
East Asia, nonheme iron accounts for almost 95% of the total daily iron intake with cereals,
pulses, vegetables, and fruits being the main sources. As a result of this dietary pattern, many
South-East Asians are plagued by low iron content and absorption (Nair and Iyengar 2009).
2.3.7 Iron Status during Infancy
Due to the rapid rate of growth and subsequent doubling of the blood volume (from 4 to
12 months after birth), iron requirements during infancy are very high (Zlotkin 2003; Dewey
2007). To ensure appropriate iron requirements are obtained, the WHO has recommended iron
intakes for infants 6 to 12 months of age at 9.3 mg/day. However, only 0.8 mg of this amount
needs to be absorbed to support normal growth and prevent iron deficiency (Carley 2003; Dewey
2007). Breastmilk provides approximately 0.2 mg/day of iron, which means the remaining 9.1
mg/day has to be supplied by other sources. Although some infants have sufficient iron stores at
birth (if they had a normal birth weight, were born to an iron-replete mother, and received
optimal placental transfer of blood via delayed umbilical cord clamping) that can last until 8 to 9
months of age, most infants exhaust their iron stores by 6 months and depend on fortified
complementary foods for the majority of their iron intake after that (Yip 2002; Dewey 2007). In
developing countries, however, the majority of infants consume unfortified complementary foods
that are cereal based and have low iron content and bioavailability. Even when foods containing
meats and vegetables are fed, daily iron requirements for 6 to 24 month old children are seldom
met, making iron the most limiting nutrient at this age (Yip 2002; Giovannini, Sala et al. 2006;
Dewey 2007).
2.3.8 Stages of Iron Deficiency
Three stages of iron deficiency have been described to better assess individual health.
The first stage is marked by iron depletion, which occurs when iron stored in the bone marrow

15
diminishes due to an insufficient supply. This stage is typically asymptomatic, has no major
effect on erythropoiesis, and often escapes detection by Hb and hematocrit screening. Continued
depletion of iron stores results in the second stage called “iron deficiency.” Iron deficiency is
observed when iron storage levels become significantly reduced and Hb synthesis is affected.
The third, and final stage, is called “iron deficiency anemia” and occurs when iron stores are
insufficient to maintain Hb production. IDA is reflected by Hb levels that are two standard
deviations below the distribution mean in an otherwise normal population of the same gender
and age (WHO, UNICEF et al. 2001; Carley 2003). When the prevalence of IDA exceeds 40%
in a given population, the WHO recommends daily iron supplementation of 12.5 mg for all
infants between the ages of 6 to 24 months (Duncan, Schifman et al. 1985; INACG, WHO et al.
1998).
2.3.9 Etiology of Iron Deficiency Anemia in Infants 6 months and Older
IDA can result from one or a combination of factors. The four primary causes of IDA
are:
a. Inadequate Dietary Intake or Low Dietary Bioavailability of Iron: During periods of
rapid growth, such as infancy, the body’s blood volume expands with a corresponding
increase in iron requirement. If there is a negative balance between the dietary intake of
iron and iron loss during this stage, IDA can ensue (Yip 1994). However, a high dietary
intake of iron does not necessarily protect one from developing IDA. In many
developing countries, iron intake is relatively high and, in some cases, meets the
recommended dietary allowance (RDA) for the United States. Unfortunately, most of the
iron ingested in developing countries is derived from cereals and legumes with little meat
consumed. In meat, 30 to 70% of iron is heme iron, which has an absorption rate of 15 to

16
35%. Conversely, cereals and legumes contain nonheme iron, which has an absorption
rate of less than 10%. Moreover, cereals and legumes often contain high levels of
phytates and polyphenols, which impede iron absorption by binding to it in the gut and
forming complexes that cannot be absorbed. The intake of foods that can enhance iron
absorption such as fruits and vegetables containing vitamin C or meat is often limited in
these countries (Hurrell 1997; Hurrell 2002; Zimmermann, Chaouki et al. 2005). Of the
2.15 billion individuals affected by anemia, it is believed that approximately 85% suffer
from an inadequate dietary intake of iron or low iron dietary bioavailability (Boccio and
Iyengar 2003).
b. Increased Iron Needs: The most critical period at which IDA develops is between 6 to 18
months of age. This period in life is where iron requirements are the greatest and
according to some estimates are approximately 10 times higher by body weight when
compared to an adult man (Ahmed 2000; Yip and Ramakrishnan 2002).
c. Chronic Iron Loss Due to Infection: Infections can block iron utilization in the body and
cause infants to develop IDA. Upon infection, it is believed that iron is sequestered in the
macrophages and hepatocytes while iron absorption is reduced. This response by the
body is designed to limit the supply of iron to invading pathogens and hinder their spread.
However, this process can also cause a decrease in plasma iron levels which can lead to
reduced erythropoiesis and ultimately IDA (Nair and Iyengar 2009). Helicobacter pylori
infection is one of the most common infections in the developing world, although the
mechanism in which it causes IDA is still not fully known (Sarker, Mahmud et al. 2008).
d. Impaired Iron Utilization after Absorption: Impaired iron utilization after absorption can
occur due to chronic and repeated infections as well as other vitamin and micronutrient
deficiencies (Ahmed 2000).

17
IDA during infancy is also dependent on other conditions (birth weight, maternal iron status,
cord-clamping practices, and exclusive breastfeeding), but these risk factors are almost
universally compounded by a diet that is low in bioavailable iron (Hutton and Hassan 2007;
Chaparro 2008; Stoltzfus 2008).
2.3.10 Health and Socioeconomic Implications of Iron Deficiency Anemia
The effects of IDA can be categorized according to its negative impact on childhood
development and behaviour, morbidity and mortality, and work performance and productivity.
a. Childhood Behaviour and Development: For many years researchers have focused on the
relationship between iron status and cognitive, motor, and behavioural development.
Consistently, children with IDA were found to have lower test scores in psychomotor
development and impaired cognitive performance when compared to children with
sufficient iron stores (Yip 1994; WHO, UNICEF et al. 2001). This finding has been
conclusively seen in studies conducted on IDA infants in Chile, Costa Rica, Guatemala,
and Indonesia (WHO, UNICEF et al. 2001). When standardized cognitive tests were
used, infants with IDA averaged 6 to 15 points lower than those who had an optimal iron
status (Lozoff 2007). Although short-term iron treatment has been shown to reverse
some aspects of cognitive effects, the few long-term studies conducted suggest that IDA
in early childhood can lead to irreversible developmental damage (Yip 1994; Lozoff
2007; Walker, Wachs et al. 2007). In ten follow-up studies that compared children who
had IDA during infancy to those without, former IDA individuals often had a lower IQ
(approximately 1.73 points lower for every 10 g/L decrease in hemoglobin), a higher
likelihood of repeating grades, attention difficulties, and a reduction in cognitive scores in

18
early adulthood (Lozoff, Jimenez et al. 2000; Lozoff, Beard et al. 2006; Lozoff, Jimenez
et al. 2006).
Regarding motor development, IDA infants have significantly reduced gross
motor control. This is often seen by their lower performance scores in tests such as the
Peabody Developmental Motor Scales, Infant Neurological Battery, the motor quality
factor of the Bayley Scales of Infant Development, and the bimanual coordination toy
retrieval task. Achieving low scores in these tests indicate that motor skill development
and the related ability to explore and interact with the environment are both affected by
IDA (Beard 2008). Similar to motor control studies, there is a strong relationship
between IDA and the behaviour of infants. Infants diagnosed with IDA are often more
wary, hesitant, irritable, less happy, and easily tired. They are also less engaged with
others and stay closer to their caregivers. It has been suggested that these behaviours
may contribute to impaired development through functional isolation (Lozoff, Klein et al.
1998; Grantham-McGregor and Ani 2001; Zlotkin 2003). Although the mechanism by
which IDA affects brain development is not fully known, evidence from animal and
human studies indicate that IDA affects cognitive, motor, and behavioural development
by impairing myelination, altering neurotransmitter receptor (primarily dopamine)
function, and hindering neuronal metabolism (2007; Collard 2009; Geltman, Hironaka et
al. 2009).
b. Morbidity and Mortality: IDA reduces the oxygen-carrying capacity of the blood, which
interferes with aerobic functions of the body. Very severe IDA is associated with
increased infant and maternal mortality and is listed as an underlying cause of death.
Deaths associated with severe IDA often occur during periods of increased physiological
stress when oxygen delivery and cardiovascular function are compromised by a reduced

19
hemoglobin level (Yip 1994). The WHO estimates that approximately 800,000 deaths
worldwide are attributed to IDA and lists this condition among the 15 leading
contributors to the global burden of disease (Gleason and Scrimshaw 2007). Pregnant
women with IDA have a significantly higher risk of maternal mortality, prenatal infant
loss, and premature delivery. According to some estimates, roughly 18.4% of global
maternal deaths and 23.5% of global perinatal deaths are caused by IDA. Moreover,
infants born to mothers that suffer from IDA are more likely to be low birth weight
babies, have poorer iron stores and subsequently develop IDA before 6 months of age,
and have an increased risk of morbidity and mortality (Gleason and Scrimshaw 2007;
Sanghvi, Ross et al. 2007). In Bangladesh, approximately 26% of maternal deaths are
caused by IDA and postpartum hemorrhaging (Ahmed 2000). Regarding morbidity, IDA
predisposes individuals to diseases through reduced immune function. For example,
humoral, cell-mediated and nonspecific immunity as well as cytokine activity (which
plays an important role in various immunogenic mechanisms) are all influenced by IDA
(Ahmed 2000). The type of infection that predominantly affects children with IDA are
upper respiratory tract in nature (Zimmermann and Hurrell 2007).
c. Work Performance and Productivity: IDA can reduce physical work performance by
negatively affecting aerobic capacity, which reduces endurance capacity, voluntary
activity, and work productivity (Zhu and Haas 1997; Haas and Brownlie 2001). In
developing countries, a large proportion of economic output is based on physical labour
and, thus, a reduction in work capacity can have severe economic consequences (Yip
1994). To address this concern, iron supplementation studies were conducted among
anemic rubber tappers in Indonesia, tea pickers in Sri Lanka, agricultural workers in
India, Guatemala, and Colombia, and industrial workers in Kenya and China. The results

20
from these studies revealed that an increase in work productivity can be achieved through
iron supplementation (WHO, UNICEF et al. 2001). Current estimates by Dr. Susan
Horton, a health economist at the Wilfrid Laurier University, reveal that the worldwide
economic impact of childhood iron deficiency is a 4.5% reduction in gross domestic
product (Horton and Ross 2003). Concerning Bangladesh, the annual per capita loss due
to iron deficiency is roughly 1.9% of the gross domestic product (Ahmed 2000).
2.3.11 Global Prevalence of Iron Deficiency Anemia
Most infants, children, and women of childbearing age, particularly in the developing
countries, are iron deficient. Over time, more than half of these individuals will develop IDA,
the most advanced stage of iron deficiency (Hurrell, Lynch et al. 2004). As mentioned before,
approximately 2.15 billion people suffer from anemia with 85% of these cases attributed to iron
deficiency (Viteri 1997; WHO 2004). According to the UN, the prevalence of IDA in
developing countries is approximately 42% and 17% in developed countries. In Africa and Asia
the prevalence of IDA is higher at 42% and 53% respectively, whereas in Central America it is
30% and 26% in South America. The lowest prevalence of IDA is found in Europe and North
America where only 2 to 5% of the population is affected (Shamah and Villalpando 2006).
Regarding infants and children, IDA is a major public health problem and remains the most
prevalent nutritional deficiency affecting them worldwide (Domellof, Dewey et al. 2002;
Yurdakok, Temiz et al. 2004). According to some estimates, IDA affects up to 60% of children
globally (Cole, Grant et al.). Once more, Africa and South Asia experience the highest
prevalence rates of IDA with some countries reporting up to 80% of young children affected. In
terms of absolute numbers, the WHO and UNICEF estimate that approximately 750 million
children have IDA (Stoltzfus 2001; Yip 2002). As a result of these stark findings, the

21
“UNICEF/WHO Joint Committee on Health Policy” endorsed a strategy for reducing IDA
among children (Chang, El Arifeen et al.).
2.3.12 Prevalence of Iron Deficiency Anemia in Bangladesh
In Bangladesh, anemia is prevalent among both genders and all age groups. However,
women (both pregnant and non-pregnant) and children are most susceptible (Jamil, Rahman et
al. 2008). According to studies conducted by “Hellen Keller International” and Kimmons et al.,
more than two-thirds of Bangladeshi children are anemic. More specifically, there is a 92%
prevalence rate among infants 6 to 11 months of age and an 85% prevalence rate among children
between the ages of 12 to 23 months. Similar to global trends, the major causes of anemia in
Bangladesh are an inadequate intake of iron rich foods and poor bioavailability of iron in foods
consumed (Kimmons, Dewey et al. 2005; International 2006).
2.3.13 Screening Methods for Iron Deficiency Anemia
The adverse affects of IDA on growth and development provide the rationale to screen all
children for this nutritional deficiency (Bogen, Krause et al. 2001). Hematologic tests commonly
used to assess iron status include measuring the Hb, hematocrit, mean cell volume, and red blood
cell distribution width. Biochemical tests that are used include serum iron, serum ferritin,
transferrin receptor, total iron-binding capacity, transferrin saturation, and erythrocyte
protoporphyrin. Of all the tests available, measuring Hb is most often used to screen for anemia
(as a proxy indicator for iron deficiency) because of its low cost, simplicity, speed of the
procedure, and better performance when compared with hematocrit assessment (Mei, Parvanta et
al. 2003). In developing countries where iron deficiency is highly prevalent and the major cause
of anemia, Hb levels can be used quite effectively as a simple and inexpensive indicator of iron
status. Moreover, other screening methods may not be feasible for developing countries because
22
their results can be affected by a high prevalence of infections and financial and technical
challenges associated with them (Yip and Ramakrishnan 2002; Mungen 2003). The only
methods generally recommended for use in surveys to determine the prevalence of anemia by
hemoglobinometry are the cyanomethoglobin method in the laboratory and the HemoCue
system. The HemoCue system is a reliable quantitative method for determining Hb
concentrations in field surveys (WHO, UNICEF et al. 2001). This screening tool consists of a
portable battery-operated photometer and supply of treated disposable cuvettes where blood is
collected. What makes the HemoCue system unique is that it can be used for surveys conducted
in remote environments or urban laboratories, it is easy to transport and use, requires short
training time and does not require staff to have specialized laboratory training, it always gives
consistent results, does not require a large sample of blood making it less stressful on the patient,
and, when compared to standard laboratory methods, it provides satisfactory accuracy and
precision (Bhargava, Bouis et al. 2001; Sari, de Pee et al. 2001; WHO, UNICEF et al. 2001;
Lara, Mundy et al. 2005; Munoz, Romero et al. 2005).
2.3.14 Hemoglobin Cut-Off Values
Normal Hb distributions vary according to age, gender, stage of pregnancy, and altitude
(WHO, UNICEF et al. 2001). Regarding infants, the reference cut-off values for Hb are based
on data from older age groups and, thus, may not be accurate (Aggett, Agostoni et al. 2002;
Domellof, Dewey et al. 2002). Numerous studies have also shown that Hb concentrations in
individuals (men, women, and children) of African descent are often 4 to 10 g/L lower than those
of European backgrounds (Perry, Byers et al. 1992; Sullivan, Mei et al. 2008). Based on these
findings many researchers have proposed a lower recommended Hb cut-off for people of African
descent and several studies have applied this criteria to define anemia (Dallman, Barr et al. 1978;

23
Perry, Byers et al. 1992; Johnson-Spear and Yip 1994; Asobayire, Adou et al. 2001; Zlotkin,
Arthur et al. 2001; Zlotkin, Antwi et al. 2003; Zlotkin, Arthur et al. 2003; Beutler and West
2005). In addition to reducing the values for individuals of African descent, there is growing
support for lowering the WHO Hb cut-off values for all infants due to the negative effects of
IDA on development. In the study conducted by Sherriff et al., different developmental
outcomes were observed only when Hb concentrations were lower than 98 g/L at eight months of
age (Sherriff, Emond et al. 2001). Moreover, Domell et al. concluded in their study assessing
breastfed iron-replete infants in Honduras and Sweden that Hb cut-off values of 105 g/L be used
at six months of age and 100 g/L at nine months of age to define anemia (Domellof, Cohen et al.
2001). Overall, there seems to be a need to re-evaluate the definition of anemia in infants as the
current WHO cut-off value may result in many misdiagnoses and over-reporting.
2.4 Calcium
2.4.1 The Importance of Calcium in the Body
Calcium is an essential nutrient required for many vital biological functions such as nerve
transmission, muscle contraction, mediating vascular contraction and vasodilation, blood
coagulation, and glandular secretion (Miller, Jarvis et al. 2001; Flynn 2003). However, the most
important role of calcium is bone formation. Bone mass increases at a rate of 150 mg/day from
birth until approximately 20 years of age. At birth, an infant has approximately 20 to 30 g of
calcium, but this amount gradually increases to roughly 1200 g by adulthood. Rates of calcium
accretion are highest during infancy (especially in the first year of life) and puberty, but lower in
other periods of childhood (Prentice, Bonjour et al. 2003; Chan, McElligott et al. 2006). Linear
growth stops when puberty ends but bone mass continues to increase, reaching its peak during
adulthood. The age at which peak bone mass is achieved varies between different regions of the

24
body and populations. Regardless, after this period is complete, bone mass slowly declines.
This decline is accelerated in post-menopausal women who often average 1 to 3% bone mineral
loss per year (Prentice, Bonjour et al. 2003). Thus, maintaining an adequate calcium intake is
critical for achieving optimal peak bone mass and helps modify the rate of bone loss associated
with ageing (Cashman 2002).
2.4.2 Calcium in the Body
Calcium is the most abundant mineral in the human body, with approximately 99% found
in bone and teeth. Of the 99% found in mineralized tissues, calcium is predominantly present as
calcium phosphate with the remaining amount in the calcium carbonate form (Nordin 1997). In
addition to the skeletal system, calcium is also located in the blood, extracellular fluid, muscles,
and other tissues (Flynn 2003; Lanham-New 2008). In these systems, calcium is referred to as
“serum calcium,” accounts for 1% of the total body calcium, and is found in three forms:
albumin bound (40%), inactivated (bound to anions like phosphorus, citrate, sulphate, and
lactate; accounts for 10%), and free ionized (50%). Free ionized calcium is the only bioavailable
form in the body and is responsible for calcium’s many biochemical processes mentioned above
(Jain, Agarwal et al. 2008; Williford, Pare et al. 2008).
2.4.3 Calcium Absorption, Uptake, and Transport
Calcium absorption predominantly occurs in the jejunum, but also takes place in the
ileum and colon. Absorption is determined by the amount of calcium ingested and the solubility
of the calcium salt consumed (Bass and Chan 2006; Oramasionwu, Thacher et al. 2008).
Calcium absorption requires it to be in its ionized form. Dissolved calcium that is bound to or
forms complexes with certain nutrients, such as fats or phytates, reduces and inhibits calcium
absorption (Bass and Chan 2006). Although uncommon in most developed countries, a

25
reduction in the efficiency of parathyroid hormone (PTH) and vitamin D metabolism can also
reduce intestinal absorption of calcium (Lanham-New 2008).
In infants, the rate of calcium absorption approximates calcium retention or bone
accumulation (Abrams, Esteban et al. 1991; Hillman, Johnson et al. 1993). During the first six
months of a full-term infant’s life, bone mass acquisition is directly related to mineral uptake.
Calcium uptake in the small intestine occurs by active transport or simple passive diffusion.
When there is a low intake of calcium, active transport predominates. However, as intake
increases, more calcium is absorbed by passive diffusion. Regarding calcium transport, the
metabolite vitamin D stimulates its movement across intestinal cells by promoting the production
of calcium binding protein (Bass and Chan 2006; Lanham-New 2008).
2.4.4 Calcium Excretion
Calcium is mainly lost through renal excretion, but can also be released via feces, sweat,
skin, hair, and nails. Approximately 97% of the filtered calcium load is reabsorbed by the renal
tubules, while the remaining 3% is excreted in urine and represents obligatory loss. The major
determinant of urinary calcium excretion is dietary calcium intake. Urinary calcium excretion is
also higher when protein and sodium intakes are high, but the effects of excess protein can be
mediated by a higher phosphorus intake (Abrams 2005).
2.4.5 Regulation of Calcium Homeostasis
Unlike other nutrients, calcium requirement does not depend on the maintenance of its
metabolic function. Instead, its requirement is based on the maintenance of an optimal reserve
and the support of the reserve’s function in providing structural rigidity to the skeleton (Heaney
1997). Bone acts as a metabolic reservoir for the maintenance of serum calcium homeostasis.
Serum calcium levels are maintained within narrow limits (usually 8.5 to 10.5 mg/dL or 2.1 to

26
2.6 mmol/L) by the concerted actions of three calciotropic hormones: PTH, vitamin D, and
calcitonin. When the body’s serum calcium concentration decreases, calcium sensing receptors
on the parathyroid glands detect the change and stimulate an increase in PTH secretion. PTH
acts on bone to release calcium (bone resorption), on the kidney to increase renal calcium
reabsorption, and increases the conversion of 25(OH)D to 1,25-dihydroxyvitamin D in the
kidney. The newly converted 1,25-dihydroxyvitamin D then acts on the intestine to increase
calcium absorption and on bone to stimulate further calcium release (Cashman and Flynn 1999;
Prentice, Bonjour et al. 2003; Moe 2008). When serum calcium levels return to normal, further
increases are reversed by calcitonin (which is released by the thyroid gland) and negative
feedback by 1,25-dihydroxyvitamin D on the secretion of PTH (Cashman and Flynn 1999;
Prentice, Bonjour et al. 2003).
2.4.6 Sources and Bioavailability of Calcium
The largest source of dietary calcium for most individuals is milk and other dairy
products. In the United States, 65% of the dietary calcium intake for children is supplied by
dairy products (Subar, Krebs-Smith et al. 1998). Although dairy products provide the highest
bioavailability of calcium and are the most calcium rich foods, alternative sources of calcium are
available for individuals who do not consume these items. Most vegetables contain calcium but,
due to their low calcium density, large servings are required to equal the total intake obtained
from a serving of dairy products. Moreover, fish with bones and some green leafy vegetables
(providing their oxalate content is low) can also provide a high bioavailability of calcium. Foods
that are high in phytates (e.g. spinach, cereal based foods, etc.) can be calcium rich, but have a
low bioavailability (Miller, Jarvis et al. 2001; Greer and Krebs 2006). For individuals who do
not consume adequate amounts of calcium from dietary sources, the use of calcium supplements

27
is often recommended. Although the bioavailability of calcium varies in supplements, it can be
greater than or comparable with the amount in dairy products (Miller, Smith et al. 1988). Most
supplements contain calcium carbonate because of its high bioavailability (relative to other
calcium salts) and provide roughly 300 to 600 mg per dosage (Bass and Chan 2006; Greer and
Krebs 2006).
2.4.7 Calcium Status during Infancy
Calcium requirements vary throughout an individual’s life, with higher needs during
periods of rapid growth. Infants and children, pregnant and lactating women, and the elderly all
require high intakes of calcium to ensure optimal development and bodily functions. In addition
to periods of growth, calcium intake is also dependent on age, gender, genetic and ethnic
variability, physical activity, and other dietary factors. Due to the interaction of all these
conditions, it is impossible to recommend a specific calcium intake for infants, children,
adolescence, and adults (Cashman 2002). Thus, it is not surprising that various health
organizations have different recommendations for calcium intake. For example, according to the
Institute of Medicine (IOM), the recommended calcium intake for infants 6 to 11 months of age
is 270 mg/day (Lutter and Dewey 2003). Conversely, the Food and Agriculture Organization
(FAO) and WHO recommend infants 6 to 11 months of age receive 400 mg/day of calcium
(Consultation 2002). Currently, no tolerable upper intake level for calcium in infants between
the ages of 0 to 12 months has been defined (Greer and Krebs 2006).
2.4.8 Calcium Deficiency
When the body experiences low serum calcium levels, there is an increase in PTH
synthesis and release. PTH acts on three target organs to restore serum calcium levels. Within
the kidney, PTH promotes the reabsorption of calcium in the distal tubule. The intestine is

28
indirectly affected by PTH, which stimulates the production of vitamin D and thereby causes an
increase in calcium absorption. Finally, PTH induces bone resorption, which releases calcium
into the blood. Due to the actions of PTH and vitamin D, serum calcium levels can be restored
within minutes to hours. However, when the body experiences chronic calcium deficiency,
serum calcium levels are maintained at the expense of the skeletal mass. A PTH mediated
increase in bone resorption is one of several major causes of reduced bone mass and
osteoporosis. If left untreated, the cumulative affect of calcium depletion on the body’s skeletal
system can result in an increasing frequency of osteoporotic fractures with age (Cashman 2002).
2.4.9 Etiology of Calcium Deficiency
Calcium deficiency is primarily caused by an inadequate intake or poor absorption of
calcium (Cashman 2002). Another factor that can induce or exacerbate calcium deficiency is
fluoride ingestion. Excess amounts of fluoride are often found in the drinking water of rural
communities in South Asia. When consumed, fluoride can induce skeletal fluorosis with
symptoms similar to rickets. The toxic effects of fluoride are more severe in calcium deficient
children because their calcium intake is not sufficient to counteract it and suppress the PTH
mediated bone loss that occurs. Even marginally high intakes of fluoride (> 2.5 mg/day) can
have severe consequences on the body’s homeostasis of calcium. In rural India, it is estimated
that 45% of the drinking water contains high fluoride content (Teotia, Teotia et al. 1998;
Thacher, Fischer et al. 2006). In addition to fluoride, high levels of arsenic in drinking water has
been recognized for many years in some regions of the world, notably South Asia. Although
millions of people are at risk of cancer due to arsenic exposure, it has also been implication in
causing calcium homeostasis disturbances (Florea, Yamoah et al. 2005). Regarding foods, items
that contain high amounts of oxalates, phytates, protein, and sodium can reduce the retention of

29
dietary calcium. Dietary protein increases urinary calcium excretion by increasing the total acid
load from protein metabolism. Although adjusting calcium consumption on the basis of protein
intake can correct this, it is not recommended for children and adolescents. Similarly, dietary
sodium increases the renal excretion of calcium as both share the same transport system in the
proximal tubule. However, like dietary protein, the calcium intake recommendations for
children and adolescents do not differ on the basis of sodium intake (Greer and Krebs 2006).
2.4.10 Health and Economic Implications of Calcium Deficiency
Calcium deficiency can result in many disorders that not only increase the risk of
morbidity and mortality, but are also costly to individuals and governments:
a. Peak Bone Mass and Osteoporosis: Osteoporosis has been called the “pediatric disease
with geriatric consequences” (Nicklas 2003). Accumulating scientific evidence indicates
that consuming an adequate intake of calcium or calcium-rich foods from infancy to early
adulthood helps optimize peak bone mass, slow age-related bone loss, and reduce
osteoporotic fracture risk in later adult years (Miller, Jarvis et al. 2001). A recent review
of 139 articles relating to calcium intake and bone health highlighted the beneficial role
of calcium in skeletal health. In 52 of the 54 randomized, controlled intervention trials
(RCT), increasing calcium intake led to increased calcium balance, increased bone gain
during growth, reduced bone loss in later years, and lowered fracture risk. Six of these
studies used dairy sources of calcium and all had positive effects on bone status. Sixty-
four out of 86 observational studies in this review also showed a positive correlation
between calcium intake and bone mass in children, young adults, and post-menopausal
women, with the majority using food sources of calcium (Heaney 2000). Two meta-
analyses of RCTs have also demonstrated that calcium supplementation reduces the risk

30
of hip fracture by 25 to 70%, vertebral fractures by 23%, and non-vertebral fractures by
14% (Cumming and Nevitt 1997; Shea, Wells et al. 2002). Currently, 44 million men
and women in the United States suffer from osteoporosis and low bone mass. This figure
is expected to increase to over 60 million by 2020 (Nicklas 2003).
b. Hypertension: After nearly 20 years of debate, there is now sufficient evidence
supporting the beneficial role of calcium or calcium-rich dairy foods in blood pressure
regulation (Nicklas 2003). In the United States government sponsored “Dietary
Approaches to Stop Hypertension” (DASH) study, it was found that intake of a low fat
diet containing almost three servings of dairy foods (mostly in the form of low fat milk)
in combination with fruits and vegetables significantly reduced blood pressure in persons
with high normal blood pressure. More importantly, this change was seen in only two
weeks of dietary modification. Systolic and diastolic blood pressures were reduced by
5.5 and 3.0 mm Hg respectively in adults who consumed the DASH diet compared to the
control diet. Moreover, in hypertensive participants, the blood pressure lowering effects
of the DASH diet were even greater with reductions of 11.4 mg Hg in systolic and 5.5
mm Hg in diastolic pressure compared to the control diet (Appel, Moore et al. 1997;
Obarzanek and Moore 1999). Researchers from the first DASH study believe that if
Americans followed this diet, coronary heart disease and stroke could be reduced by 15%
and 27% respectively (Appel, Moore et al. 1997).
c. Rickets: Nutritional rickets causes considerable disability among infants and young
children. Although it has been virtually eliminated from Europe and North America by
fortifying certain foods with vitamin D, nutritional rickets remains prevalent in many
developing countries of Africa, Asia, and the Middle East. In fact, rickets has been
ranked among the five most prevalent diseases affecting children in the developing
31
world. However, with ample amounts of sunlight, the etiology of rickets in tropical
countries remained a mystery until recently (Thacher, Fischer et al. 1999). Studies
conducted in the sunny nations of South Africa, Nigeria, and Bangladesh found that a
dietary deficiency of calcium (characteristic of their cereal-based diets with limited
variety and access to dairy products) is the main cause of rickets. Most of the children in
these studies had normal serum 25-hydroxyvitamin D concentrations and high levels of
serum 1,25-dihydroxyvitamin D, which indicate an adequate intake of vitamin D.
Moreover in all three countries, rickets was treated with calcium supplementation
(Thacher, Fischer et al. 1999; Pettifor 2004; Combs, Hassan et al. 2008).
d. Economic Impact: Although the global economic impact of calcium deficiency is not
known, it undoubtedly creates a severe burden on the health and economic sectors of
many nations. When assessing the direct health care costs for the treatment of
osteoporotic fractures in America alone, estimates of $10 to $15 billion per year are
reported (Nicklas 2003).
2.4.11 Global Prevalence of Calcium Deficiency
In the absence of reliable indicators for calcium adequacy, estimates of calcium
deficiency are predominantly based on optimal dietary intake relative to estimated requirements
(Cashman and Flynn 1999). As mentioned before, this approach is complicated by a lack of
agreement between expert groups on calcium requirements (Flynn 2003). Nevertheless, even
when using the lower calcium recommended intake values, there is a considerable amount of
evidence suggesting that a high prevalence of calcium deficiency exists in both developed and
developing countries. For example, in the United Kingdom it is estimated that 13 to 18% of
women between the ages of 14 to 34 and 8 to 15% of those over 65 years are calcium deficient.
32
Moreover, it is believed that 45% of 11 to 18 year old British girls fail to consume the average
requirement for calcium intake (Flynn 2003). Regarding the developing world, habitual calcium
intake is estimated at only 25 to 33% of the AI for many populations and age groups (Pettifor
2008). Although the number of people affected by calcium deficiency in the developing world is
not certain, based on these findings, it is likely to affect the vast majority of individuals in these
countries.
2.4.12 Prevalence of Calcium Deficiency in Bangladesh
Studies assessing the habitual calcium intake in Bangladesh report that all age groups
obtain only 30% of the adequate intake (AI)(Arnaud, Pettifor et al. 2007). When assessing
specific populations, this figure varies drastically. For example, in Islam et al’s study conducted
on women living in northern (Betagair Union) and central regions (Dhaka City) of Bangladesh, it
was found that 95% of low-income women and 47% of high-income women did not meet the
WHO’s AI for calcium (Islam, Lamberg-Allardt et al. 2003). When determining the impact of
calcium deficiency in infants and children, a similar trend of low dietary calcium intake was
observed. In the Cox’s Bazaar district of south-eastern Bangladesh (which is not among the
poorest regions of Bangladesh), the “Bangladesh Institute of Mother and Child Health” reported
that 9 to 22% of children display signs or symptoms of rickets. When the diets of the families
living in this district were examined, it was found that most consumed few, if any, calcium-rich
foods and that all family members had low dietary intakes of calcium. In particular, the children
consumed approximately 160 mg of calcium per day (with rice and small fish being the main
sources at 45% and 41% respectively), which is less than half of their calcium AI. Upon further
examination, the children diagnosed with rickets were found to have normal plasma 25-
hydroxycholecalciferol levels. This suggests that rickets in the Cox’s Bazaar district is caused

33
by calcium deficiency, similar to the cases reported in Nigeria and South Africa (Combs, Hassan
et al. 2008). Currently, it is estimated that rickets affects approximately 5,000,000 children in
Bangladesh with more than half of the country’s sub-districts reporting cases (Combs and
Hassan 2005; Craviari, Pettifor et al. 2008). This estimate is however, not based on a strict
diagnosis of rickets, which would include radiologic and biochemical assessment as well as
specific physical findings.
Calcium deficiency in Bangladesh is believed to be the result of a change in agricultural
production caused by the introduction of irrigation. Within the past three decades, when the first
cases of rickets began to emerge, a greater emphasis on increasing the production of rice has
been observed. This shift in farming practices has had negative effects on many segments of the
agricultural industry and resulted in a decrease in the rotation and variation of foods produced
(Craviari, Pettifor et al. 2008; Pettifor 2008; UNICEF and (SARPV) 2009). Milk and dairy
production were especially affected, which caused an excessive price hike for these items. As a
result, milk and dairy products are no longer considered part of the typical Bangladeshi diet and
calcium intake is primarily obtained from cereals, vegetables, and fish (Islam, Lamberg-Allardt
et al. 2003).
2.4.13 Screening Methods for Calcium Deficiency
When laboratory resources are available, serum calcium, phosphorus, PTH, vitamin D
(1,25-dihydroxyvitamin D), and alkaline phosphatase (ALP) can be used to confirm calcium
deficiency. However, since serum calcium levels only account for 1% of the total body calcium,
it is often viewed as a poor biomarker for a health assessment (Oginni, Sharp et al. 1999; Moe
2008). There has been an improvement and development of methods to measure total body and
regional bone mineral content by using various bone density techniques. The most widely used
34
technique is the dual-energy x-ray absorptiometry. This tool can rapidly measure the bone
mineral content and bone mineral density of the entire skeleton or of regional sites with a
negligible level of radiation exposure. Furthermore, recent enhancements in the precision of the
technique have made it particularly suitable for assessing the effects of calcium supplementation
on bone mass in children of all ages (Baker, Cochran et al. 1999; Abrams and Atkinson 2003).
However, in settings where these techniques are not available or feasible, calcium deficiency can
be assessed using dietary questionnaires (Greer and Krebs 2006).
2.5 The Interaction between Iron and Calcium
2.5.1 Studies Examining the Interaction between Iron and Calcium
Since the 1940’s researchers and public health officials have known that calcium,
whether in the form of supplements or in food, can inhibit both heme and nonheme iron
absorption (Cook, Dassenko et al. 1991; Whiting 1995). Numerous animal, epidemiologic,
prospective, and RCT studies have since been conducted to gain further incite on the inhibitory
effects of this nutrient-nutrient interaction. The significance of calcium and iron’s negative
interaction is that it creates a dilemma for researchers and public health officials trying to
increase the consumption of both nutrients without suppressing their absorption (Hallberg 1998;
Ames, Gorham et al. 1999).
a. Animal Studies: The first animal studies to demonstrate that calcium (in the form of
calcium carbonate) inhibited iron absorption were conducted by Kletzein in 1935 and
1938 (Kletzein 1935; Kletzein 1938; Lynch 2000). Subsequent animal experiments have
shown that several other forms of calcium (calcium chloride, calcium lactate, calcium
phosphate) can reduce iron retention and the rate of Hb production (Lynch 2000).
Regarding specific health implications of this nutrient-nutrient interaction, Fuhr and

35
Steenbock found that IDA could be induced in weaning rats when given large amounts of
calcium carbonate in their diet (Fuhr and Steenbock 1943). This finding was reinforced
in a more recent study that found both young female mice and their litters could develop
IDA when the dams were fed high doses of calcium carbonate (Greig 1952). Recently,
radioisotope-labelling techniques have been used in animal models to confirm the
inhibitory effect of calcium on iron absorption (Manis and Schachter 1962; Greenberger,
Balcerzak et al. 1969; Amine and Hegsted 1971; Barton, Conrad et al. 1983).
b. Epidemiological Studies: Several epidemiological studies suggest that calcium interferes
with iron absorption. In an extensive study conducted in France (n = 1108), serum
ferritin and Hb concentrations were negatively and significantly correlated with the
intake of calcium (Preziosi, Hercberg et al. 1994). These trends were also observed in
other studies assessing adolescent girls and women in other European countries (Galan,
Hercberg et al. 1985; Hallberg 1998; Lynch 2000).
c. Single-Meal Human Studies: In single-meal studies conducted on children and adults,
both heme and nonheme iron absorption were inhibited by calcium supplements (calcium
chloride, calcium phosphates, calcium carbonate, or calcium citrate-malate) and dairy
products (Dawson-Hughes, Seligson et al. 1986; Deehr, Dallal et al. 1990; Cook,
Dassenko et al. 1991; Hallberg, Brune et al. 1991; Hallberg 1998). However, the
quantitative effect changed according to the form of calcium administered (calcium
phosphates and milk had the greatest negative impact on iron absorption, while calcium
carbonate had the least) and with the presence of other dietary factors (phosphate,
ascorbic acid, and phytate) known to affect iron bioavailability. However, it is important
to mention that the effects of factors that change the bioavailability of iron are often
exaggerated in single-meal studies (the experimental designs used often ensure a

36
maximum inhibitory effect), and measurements based on the consumption of multiple-
meals are more likely to reflect the true nutritional impact of this nutrient-nutrient
interaction (Lynch 2000).
d. Multiple-Meal Human Studies: The results of multiple-meal studies conducted on healthy
infants, young children, and adult females suggest that calcium supplementation had only
a small effect on iron absorption unless habitual calcium consumption was very low
(Turnlund, Smith et al. 1990; Gleerup, Rossander-Hulthen et al. 1995; Dalton, Sargent et
al. 1997; Reddy and Cook 1997; Ames, Gorham et al. 1999; Lynch 2000; Abrams,
Griffin et al. 2001). Outcome analyses revealed that calcium supplements had no effect
on the iron status in infants fed iron-fortified formula, lactating women, adolescent girls,
and adult men and women that had adequate bioavailable dietary iron and relatively high
habitual calcium intakes (Lynch 2000).
e. Dosage of Calcium: Hallberg et al. reported a dose-effect between the amount of calcium
given and the degree of iron absorption inhibited (Hallberg, Brune et al. 1991). For
example, no effect on iron absorption is seen when less than 40 mg of calcium is present
in a meal, while no further inhibition occurs when the calcium content of the meal
exceeds 300 mg. In practice, this means that adding 200 mg of calcium to a meal
containing 100 mg of calcium would theoretically reduce iron absorption, whereas no
additional effect would be observed if the meal already contained more than 300 mg of
calcium (Hallberg 1998).
f. Timing Schedules of Iron and Calcium Intake: The timing of calcium consumption in
relation to iron is another factor to consider when assessing this nutrient-nutrient
interaction. In a study by Gleerup et al., iron absorption from two 10 day periods were
compared when the same amount of dietary calcium was distributed either during

37
breakfast and an evening snack (meals that typically contain low amounts of iron) or
more evenly throughout the day. Results from this study revealed that approximately
45% more iron (0.44 mg) was absorbed when calcium was ingested with low iron meals
as opposed to high iron containing meals. The authors estimate that if this additional
amount of iron was absorbed, it could reduce iron deficiency by 14% in many young
women (Gleerup, Rossander-Hulthen et al. 1995).
2.5.2 Mechanism of Iron and Calcium’s Nutrient-Nutrient Interaction
Nutrients with chemical similarities can compete for transport proteins or other uptake
mechanisms, which can hinder their absorption. The quantitative consequences of these
interactions often depends on the relative concentrations of the nutrients available for absorption
(Sandstrom 2001). The exact mechanism by which calcium negatively affects the absorption of
iron is unknown. However, there are 2 possible explanations for this nutrient-nutrient interaction
(Whiting 1995):
a. Interference on the Mucosal Surface of the Small Intestine: Since both heme and
nonheme iron are absorbed by different receptors on the mucosal surface of the upper
small intestine, inhibition by calcium must be located within the mucosal cell at some
transfer step common to both forms of iron (Hallberg 1998).
b. Transfer between the Enterocyte and Plasma: Calcium may inhibit the transfer of iron
from the enterocyte to the plasma since both heme and nonheme iron absorption are
affected. These two dietary forms of iron enter the duodenal enterocytes via separate
pathways, but are thought to form a common cellular pool prior to being transferred to
the plasma. It is in this cellular pool where calcium is believed to negatively interact with
iron (Lynch 2000).

38
2.5.3 Other Nutrient-Nutrient Interactions of Importance
Interactions between other micronutrients include:
a. Calcium and Zinc: A high intake of calcium can have a negative impact on zinc
absorption. This is because calcium and zinc both compete for the divalent cation
channel across the brush border membrane of the small intestine. However, for this
adverse interaction to occur, the ratio of calcium to zinc would need to be 20:1 to 50:1 by
weight. This interaction is especially important for infants and children that have a diet
marginally adequate in zinc (Abrams and Atkinson 2003).
b. Iron and Zinc: Due to similar absorption and transport mechanisms, it is currently
believed that iron and zinc compete for absorptive pathways (Fischer Walker, Kordas et
al. 2005). Studies examining iron fortification have found a negative effect on zinc
absorption, but only when the iron: zinc molar ratio is equal to or greater than 25:1
(Lutter and Dewey 2003). In many developing countries, where infants and children are
often deficient in both of these nutrients, this nutrient-nutrient interaction further
complicates treatment programs (Chang, El Arifeen et al. ; Domellof 2007).
2.6 Strategies for Preventing and Treating Micronutrient Deficiencies
2.6.1 Strategies for Preventing and Treating Micronutrient Deficiencies
Despite the high global prevalence and devastating consequences of micronutrient
deficiencies, the same 3 approaches to control them have remained for the last 3 decades. They
include (Latham, Ash et al. 2003):
a. Dietary Diversification: Food-based approaches represent the most desirable method of
preventing micronutrient deficiencies (WHO, UNICEF et al. 2001). The objectives of
this approach are to improve the availability, access, and utilization of foods that contain

39
a high content and bioavailability of micronutrients throughout the year. In order to
effectively implement this strategy, changes in food production practices, food selection,
and traditional household methods of preparing and processing foods are needed.
Moreover, knowledge of the local dietary patterns, food beliefs, and the ability to change
attitudes and practices are also required on the part of organizations promoting this
agenda (Gibson and Hotz 2001). To accomplish these tasks, dietary diversification
strategies must be supported with nutrition education and communication programs.
Nutrition education programs help consumers understand the association between the
food consumed and nutritional status, while communication programs create demand for
and increased consumption of available micronutrient-rich foods (Tontisirin, Nantel et al.
2002; Verrall and Gray-Donald 2005). In developing countries, providing a diet that is
nutritionally adequate and safe for children 6 to 24 months of age is difficult to achieve
(Mensah and Tomkins 2003). This is because the majority of complementary foods
consumed are based on plants, cereals, or roots that have a low micronutrient content,
poor micronutrient bioavailability, and contain high amounts of phytates, oxalates,
dietary fibre, and polyphenols that are known to inhibit the absorption of iron, calcium,
and zinc (Gibson, Ferguson et al. 1998; Lind, Lonnerdal et al. 2003; Mensah and
Tomkins 2003). With many families in the developing world not having the financial
capacity to change their diets and program implementers having difficulty in achieving
behavioural changes in consumption patterns, it is unlikely that dietary diversification
strategies will have an impact on alleviating micronutrient deficiencies in the near future
(Latham, Ash et al. 2003; Hurrell, Lynch et al. 2004; Santika, Fahmida et al. 2009). As a
result of these setbacks, the WHO has raised concerns about the ability of local

40
complementary foods to meet the requirements of iron, calcium, and zinc in developing
countries (Lutter 2003).
b. Food Fortification: Fortified foods are products that have their original composition
modified via the addition of an essential micronutrient. The purpose of enriching a food
item is to guarantee an adequate intake of micronutrients that are otherwise lacking in the
diet of the general public (Shamah and Villalpando 2006). At the global level, many
staples such as wheat, flour, salt, sugar and other condiments have been enriched with
iron, vitamin A, iodine, and other micronutrients. In addition to being able to enrich a
variety of foods with micronutrients, food fortification is also appealing because it is the
most cost-effective and sustainable approach to eliminating micronutrient deficiencies
(Salgueiro, Zubillaga et al. 2002). Moreover, specific segments of the population can be
targeted with fortification programs. Regarding infants and children, infant formulas and
cereal-based complementary foods have already been enriched with iron in some
countries (Hurrell, Lynch et al. 2004). However, salt iodization (which was adopted
worldwide in 1990) is often cited as the most successful fortification programme to date.
Currently, iodized salt is available to 1.5 billion consumers and prevents millions of
children from developing neurological disorders each year (Shamah and Villalpando
2006). Conditions required for successful fortification vary depending on the foods
primarily consumed in a country and the nutrients being considered for enrichment.
Moreover, fortification programmes must be supported by adequate food regulations and
labelling, quality assurance and monitoring to ensure shelf-life and sufficient levels of
micronutrients, public education, compliance, and desired effect (Sanghvi, Dary et al.
2007). This, in turn, requires a committed partnership between governmental
organizations, the foods industry, the scientific community, and consumers (Tontisirin,

41
Nantel et al. 2002). Foods that are regularly consumed by those greatest at risk of
developing a deficiency (often children and women in poor families), are affordable, and
have a high stability and bioavailability of the micronutrients added are factors to
consider when choosing a food item to enrich (Latham, Ash et al. 2003; Baltussen, Knai
et al. 2004). Within the developing world, constraints that have plagued fortification
programmes include: their effectiveness in young children since the consumption of an
enriched food is often not enough to significantly increase the intake of the specific
micronutrient, accessibility of target populations (especially those living in rural areas
who lack access to the centrally processed fortified foods), cost effectiveness since most
enriched foods are often only affordable to the middle and high-income earning families
who are not always at risk of micronutrient deficiencies, less developed commercial
markets and technology, and low consumer awareness and demand (Mora 2002;
Baltussen, Knai et al. 2004; Sanghvi, Dary et al. 2007).
c. Medicinal Supplementation: Supplementation involves the distribution of a
micronutrient, often through a healthcare system, in the form of a pill, liquid, or injection.
Administration of the medicinal supplement may include periodic mega-doses (at
intervals of 4 to 24 months) or regular provision (daily or at frequent intervals) of
medicinal amounts that are greater than the recommended daily intakes (Latham, Ash et
al. 2003). Although identified as the most effective strategy for populations that have a
high prevalence of a micronutrient deficiency and in target groups where the requirement
for a nutrient is difficult to attain through normal dietary means, supplementation
programmes can be difficult to implement (Latham, Ash et al. 2003; Hettiarachchi,
Liyanage et al. 2008). Poor compliance, low participation rates (especially when
supplements are administered over a long period of time), and high costs of delivery

42
systems to reach those at risk are common concerns in medicinal supplementation
programmes (Latham, Ash et al. 2003). Concerning the developing world, iron
supplementation is the most common strategy used to control iron deficiency and treat
IDA (WHO, UNICEF et al. 2001; Mungen 2003). The target groups in these countries
are often women of childbearing age, infants older than 6 months, preschool children, and
adolescent girls (WHO, UNICEF et al. 2001). Calcium supplementation studies have
also been conducted in developing countries and have shown a beneficial effect on bone
mineral acquisition and treating rickets in children (Dibba, Prentice et al. 2000;
Oramasionwu, Thacher et al. 2008). However, populations in developing countries often
experience multiple micronutrient deficiencies (such as iron, vitamin A, zinc, calcium,
riboflavin, etc...) and, thus, more appropriate measures to address all of these concerns
are needed (Solon, Sarol et al. 2003; Jamil, Rahman et al. 2008).
2.6.2 Multiple Micronutrient Powder (MNP) Formulation – “Sprinkles Home-Fortification”
A review of the 3 commonly used micronutrient deficiency strategies conducted by the
WB found that they all had significant problems hindering their feasibility. The concerns
included a lack of appropriate consumer demand, lack of access and appropriate delivery system
for poor and isolated populations, and a lack of honest, efficient, and technically competent
regulatory systems for fortification programmes specifically (Latham, Ash et al. 2003). Home-
fortifications using MNPs provides a fourth approach that differs from medicinal
supplementation in that several micronutrients can be provided at one time, several micronutrient
deficiencies can be controlled for with a single intervention, the micronutrients are provided in
physiologic amounts and not mega-doses, and the MNPs can be purchased in a marketplace
rather than obtaining them through a healthcare provider. This strategy is also appealing because

43
it requires little change in dietary practices and, thus, allows families to continue using
complementary foods that they are accustomed to feeding their children. Lastly, the cost of
home-fortification products are typically lower than that of commercially produced
complementary foods, which makes them more accessible to the poor segments of a population
(Dewey 2007).
Sprinkles single-dose sachets are a micronutrient powder (MNP) that were developed at
the Hospital for Sick Children by Dr. Stanley Zlotkin. The contents of each sachet are sprinkled
onto any complementary homemade or unfortified food in a process referred to as “home
fortification” (Zlotkin 2004). The iron (ferrous fumarate) found in each sachet is encapsulated
with a thin lipid layer to prevent it from interacting with food it is added to and minimizes
changes to the taste, colour, and texture of the food. In addition to iron, other essential
micronutrients such as zinc, iodine, vitamin C, D, and A, and folic acid can be added to each
Sprinkles sachet (Sharieff, Horton et al. 2006). Regarding the efficacy, bioavailability,
acceptability, and safety of Sprinkles, numerous community-based clinical trials have been
conducted in North America (Canada and Mexico), South America (Bolivia), Asia (Pakistan,
India, Bangladesh, and Cambodia), and Africa (Ghana) to assess these factors. Regarding
efficacy, Sprinkles usage was associated with a 58% cure rate of anemia in a malarial endemic
area of Ghana. Several other trials in non-malarial regions found cure rates much higher with up
to 91% of participants displaying a statistically significant increase in their mean hemoglobin
level (Zlotkin and Tondeur 2007). Bioavailability of the microencapsulated iron and zinc in
Sprinkles was determined in stable-isotope studies. The results from these experiments found
that both iron and zinc in Sprinkles are adequately absorbed with IDA infants absorbing iron
approximately twice as efficiently as iron deficient non-anemic infants. From these studies it

44
was also found that 12.5 mg of iron per day given in the form Sprinkles for 2 months was
adequate for treating anemia. Although the majority of these clinical studies had small to
moderate sample sizes (62 to 557 infants), several large-scale studies have been conducted to
assess its effectiveness. From 2001 to 2004, 15,000 Mongolian children (6 months to 3 years of
age) were given Sprinkles containing vitamin D and iron. In partnership with a non-
governmental organization (World Vision Canada), distribution was found to be
programmatically feasible and well accepted by the target-population and caregivers (Zlotkin
and Tondeur 2007). No cultural barriers were identified that would hinder the use of Sprinkles
and the prevalence of anemia decreased from 46 to 25% within program areas. There was also a
significant reduction in vitamin D induced rickets (from 43 to 33%) observed in this study.
More recent large-scale projects conducted in Pakistan and Bangladesh found similar successful
results with anemia being reduced from 86 to 51% and 77 to 38% respectively. Compliance in
both studies was high with 73% of Pakistani and 88% of Bangladeshi participants consuming the
sachets accordingly. The high acceptability and adherence of Sprinkles is attributed to its
simplicity (you do not need to be literate to use it and there are no special utensils required to
handle it) and because it does not change the taste, colour, and consistency of the food to which
it is added. Approximately 70% of the total Sprinkles sachets assigned to each child during
study trials have been consumed and specific questionnaires to assess its acceptability by
mothers found that the majority of them liked the product. Safety is another important factor to
consider when assessing a health intervention, especially with iron since excessive amounts can
be lethal. However, the potential for an iron overdose with Sprinkles is unlikely because
numerous individual sachets (approximately 20) would need to be opened and consumed for this
to occur. Other advantages of the Sprinkles MNP strategy include its weight (sachets are
lightweight making them simple to store, transport, and distribute), storage (Sprinkles have a

45
long shelf-life even in hot or humid environments, roughly 2 years), and cost (ranging from
$0.015 to 0.035 USD per sachet depending on the volume produced and production site) (Zlotkin
and Tondeur 2007).

46
Chapter 3.0 Rationale, Objectives, and Hypothesis
3.1 Rationale
With IDA and dietary calcium deficiency both prevalent in the Bangladeshi pediatric
population, it is imperative that an effective intervention and prevention strategy be developed to
limit the impact of these disorders. Currently, very few studies have been conducted on the
nutrient-nutrient interaction between calcium and iron in healthy children, and none to our
knowledge have examined its effect on infants diagnosed with anemia (Ames, Gorham et al.
1999). Moreover, the studies performed were in developed countries, often short-term (single-
meal) trials, used interventions that are not readily available in the developing world (iron-
fortified infant formula), and included healthy subjects with adequate iron and calcium intakes
(Dalton, Sargent et al. 1997; Hallberg 1998; Ames, Gorham et al. 1999; Lynch 2000). Although
highly informative, many of the conditions do not adequately reflect the realities seen in most
developing nations.
Previous studies have clearly established that the provision of Sprinkles MNP (containing
iron) to anemic infants for 2 or 6 months will result in beneficial outcomes when assessing their
Hb status. Sprinkles MNP is also a cost-effective and easy to use home-fortification vehicle
whereby iron and calcium can both be delivered to an individual deficient in these nutrients.
Interestingly, the combination of iron and calcium in a single intervention has never been
assessed in the developing world and the Sprinkles formulation has never included calcium
(Zlotkin and Tondeur 2007). In this study, we incorporated both calcium and iron in the
Sprinkles MNP formulation.

47
3.2 Objectives
a. Primary Objective: To compare the Hb status of infants age 6-11 months with anemia
(likely due to iron deficiency) who are receiving Sprinkles MNP (containing iron) with
and without calcium.
b. Secondary Objective: To investigate whether the calcium AI can be achieved in anemic
infants (age 6-11 months) via calcium and iron-containing Sprinkles without interfering
with the absorption of iron.
3.3 Hypothesis
a. Hypothesis #1: The reversal of anemia through the use of iron-containing Sprinkles will
not be depressed by the concurrent provision of calcium in children with anemia.
b. Hypothesis #2: It is possible to meet the recommendations for calcium intake in anemic
infants (age 6-11 months) through a combination of dietary sources including a new
Sprinkles iron and calcium formula.

48
Chapter 4.0 Thesis Study
4.1 Introduction
Evidence suggests that micronutrient deficiencies might be associated with problems in
early development and behaviour (Grantham-McGregor and Ani 2001). Iron deficiency is the
most common nutritional deficiency in the world and is considered a major cause of anemia,
particularly during infancy and early childhood when there is rapid growth and high nutritional
demand (Stoltzfus 2001; UNICEF 2001; Zlotkin 2003; Zlotkin, Arthur et al. 2003; Dewey 2007).
In terms of absolute numbers, the World Health Organization (WHO) and United Nations
Children’s Fund (UNICEF) estimate that approximately 750 million children suffer from iron
deficiency anemia (IDA), with the majority coming from developing countries (Stoltzfus 2001;
Yip 2002; Shamah and Villalpando 2006). Less is known about the prevalence of calcium
deficiency, but epidemiological studies and supplementation trials in both developed and
developing countries suggest low calcium intake among infants and children (Thacher, Fischer et
al. 1999; Flynn 2003; Pettifor 2004; Combs, Hassan et al. 2008). This leads to the consensus
that both iron and calcium deficiency are major public health problems (Viteri 1997; UNICEF
2001; Flynn 2003; WHO 2004; Pettifor 2008).
In low income countries, providing a diet that is nutritionally adequate and safe for
children 6 to 24 months of age is difficult to achieve (Mensah and Tomkins 2003). This is
because the majority of complementary foods consumed are based on plants, cereals, or roots
that have a low micronutrient content, poor micronutrient bioavailability, and contain high
amounts of phytates, oxalates, dietary fibre, and polyphenols which are known inhibiters of iron
and calcium (Gibson, Ferguson et al. 1998; Lind, Lonnerdal et al. 2003; Mensah and Tomkins
2003). Due to these conditions, the WHO has raised concerns about the ability of local
complementary foods to meet the dietary requirements of iron and calcium (Lutter 2003). This,

49
in turn, has helped push the agenda for supplementation, food fortification, and home-
fortification strategies to guarantee the adequate intake of micronutrients that are otherwise
lacking in the diet of the general public (Latham, Ash et al. 2003; Shamah and Villalpando 2006;
Dewey 2007; Hettiarachchi, Liyanage et al. 2008).
Most randomized controlled supplementation trials have examined the effect of single
nutrients, either iron or calcium, on infants’ development and behaviour. Short-term studies
examining iron supplementation among anemic infants have shown no differences in motor or
mental performance (Black, Baqui et al. 2004). Conversely, long-term iron supplementation
trials have shown a significant improvement in children’s development and behaviour
(Idjradinata and Pollitt 1993; Stoltzfus, Kvalsvig et al. 2001; Lozoff, De Andraca et al. 2003).
Calcium supplementation studies have also shown beneficial effects on reducing bone fractures,
hypertension, and rickets in children (Appel, Moore et al. 1997; Cumming and Nevitt 1997;
Obarzanek and Moore 1999; Thacher, Fischer et al. 1999; Shea, Wells et al. 2002; Pettifor 2004;
Combs, Hassan et al. 2008).
Although single nutrient studies allow investigators to isolate the effects associated with
specific nutrients, infants with low-nutrient diets often have multiple deficiencies (Black, Baqui
et al. 2004; Borwankar, Sanghvi et al. 2007). There is a large body of literature supporting an
inhibitory effect of dietary calcium on iron absorption (Kletzein 1935; Greig 1952; Barton,
Conrad et al. 1983; Deehr, Dallal et al. 1990; Hallberg, Brune et al. 1991; Preziosi, Hercberg et
al. 1994; Gleerup, Rossander-Hulthen et al. 1995), however, very few of these studies were
conducted in a pediatric population and none to our knowledge have examined this nutrient-
nutrient interaction in infants diagnosed with anemia and calcium deficiency. Moreover, the
studies performed were in developed countries, often short-term (single-meal) trials, used
interventions that are not readily available in the developing world (iron-fortified infant

50
formula), and included healthy subjects with adequate iron and calcium intakes (Dalton, Sargent
et al. 1997; Hallberg 1998; Ames, Gorham et al. 1999; Lynch 2000). Although highly
informative, many of the conditions do not adequately reflect the realities seen in most
developing countries.
Sprinkles is an innovative home-fortification strategy to increase the dietary intake of
iron and other micronutrients in complementary foods with no significant changes in their
colour, flavour, or taste (Schauer and Zlotkin 2003; Zlotkin, Antwi et al. 2003). Community-
based trials have shown that using Sprinkles multi-micronutrient powder (MNP) containing iron,
Vitamin A, zinc, Vitamin C, and folic acid over an 8 week period either once/day, weekly, or
flexibly can treat anemic infants and young children aged 6 to 24 months (Zlotkin, Schauer et al.
2005; Christofides, Asante et al. 2006; Hyder, Haseen et al. 2007; Ip, Hyder et al. 2009).
Interestingly, the Sprinkles MNP formulation has never included calcium (Zlotkin and Tondeur
2007).
In this study, calcium was incorporated in the Sprinkles MNP formulation. Our primary
objective was to compare the hemoglobin (Hb) status of infants’ age 6 to 11 months with anemia
that are receiving Sprinkles MNP (containing iron) with and without calcium. Our secondary
objective was to investigate whether calcium intake can be increased to its AI in anemic infants
(age 6-11 months) via calcium and iron-containing Sprinkles without interfering in the
absorption of iron.
4.2 Methods
4.2.1 Study Setting
The study was conducted in 26 villages of Kaliganj, a rural sub-district in the Gazipur
region of Bangladesh, from April to June 2010. Kaliganj is situated approximately 40 km
northeast of Dhaka, the capital of Bangladesh, and is a fair representation of rural Bangladesh

51
with its high population density, fertile agricultural land, susceptibility to seasonal flooding, and
limited access to healthcare and education services. Similar to other rural settings of
Bangladesh, the study area is known to have widespread malnutrition and poverty, with women
and children bearing most of the burden. Kaliganj is not malaria or hookworm endemic,
(hookworm affects fewer than 2% of children under the age of 2), but does have a high
prevalence of anemia (approximately 72%) among infants 6 months of age (Shakur, Choudhury
et al.).
4.2.2 Study Collaborative Partner – BRAC
The study was conducted as collaborative project between the Hospital for Sick Children
and BRAC (formerly known as the Bangladesh Rural Advancement Committee). BRAC was
founded in Bangladesh in 1972 as a development organization dedicated to alleviating poverty
by empowering the poor. Currently, it operates in 9 countries across Africa and Asia, provides
services and conducts research in human rights, education, healthcare, social and economic
empowerment, finance and enterprise development, agriculture, environmental sustainability,
and disaster preparedness. What makes BRAC an effective collaborative partner is its reach.
With a staff size of over 60,000 and an additional 60,000 self-employed health, agricultural, and
teaching agents/volunteers, BRAC is the largest development organization in the world and
reaches an estimated 110 million people (BRAC 2010). Our study was implemented with the
help of the Research and Evaluation Division of BRAC.
4.2.3 Study Subjects
Infants were recruited from a survey of 32 villages in the Kaliganj sub-district. Over 350
infants were screened, but only 100 were selected based on the following inclusion criteria:
• Age 6 to 11 months at baseline
• Hb concentration between 70 to 100 g/L

52
• No history of iron or calcium supplementation prior to 2 weeks of recruitment
• Free from acute or chronic illnesses and afebrile
• Consuming complementary food in addition to breastmilk at least once per day
• Residing in the study area for the given study period
• Obtained written informed consent from each infant’s mother after providing a
detailed explanation of the study
Children with an Hb concentration <70g/L or >100 g/L, presenting with any chronic illness, or
severely malnourished (weight-for-age Z-score <-3 of the WHO growth standard) were excluded
from the study. All infants diagnosed with severe anemia (Hb < 70 g/L) were referred to a local
healthcare facility for treatment.
4.2.4 Ethical Approval
Ethics approval for the study was obtained from the Research Ethics Committees at the
Hospital for Sick Children (Toronto, Canada) and BRAC University (Dhaka, Bangladesh).
Consent to conduct the study in each village was obtained from village leaders and elders, while
individual consent was obtained from the mothers of the infants participating in the study.
4.2.5 Multi-micronutrient Powder (MNP) Formulations
Two formulations of Sprinkles MNP were used in the study. The composition of the
control treatment included iron, ascorbic acid, folic acid, zinc, and vitamin A. The composition
of the intervention treatment included the same micronutrients, but with the addition of calcium.
The level of nutrients used in both treatments is based on previous bioavailability and dose-
response studies using Sprinkles MNP and the Recommended Nutrient Intakes (RNI) published
by the WHO/FAO and Dietary Reference Intakes (DRI) of the IOM (Lutter and Dewey 2003;
Zlotkin and Tondeur 2007). The micronutrient dosages used in these formulations did not

53
exceed the tolerable upper intake level set by the IOM (Zlotkin and Tondeur 2007). Fortitech
Inc. was responsible for the product formulation and Renata Inc. conducted the production and
quality control of the MNPs used in the study.
Table 4.2.5: Sprinkles MNP formulations used for the control and intervention treatments
Micronutrient Sprinkles MNP Control Sprinkles MNP Intervention
Iron 12.5 mg 12.5 mg
Zinc 5 mg 5 mg
Folic Acid 160 ug 160 ug
Vitamin A 300 ug RE 300 ug RE
Vitamin C 30 mg 30 mg
Calcium 0 mg 400 mg
Note: calcium carbonate and ferrous fumarate are the forms of calcium and iron used
4.2.6 Sample Size
The sample size calculation is based on the primary outcome of the study, a change in Hb
concentration. With a type I error of 5% and a power of 90%, a total of 100 infants (50 per
treatment group) were needed for the study. This sample size was designed to detect group
differences of 10.5 g/L Hb with a standard deviation of 15.1 g/L Hb within groups. Moreover, it
allowed for a dropout rate of 10%.

54
Table 4.2.6: Sample size calculation using different parameters
Mean & SD 80% Power + 10% Attrition
90% Power +10% Attrition
109.8 vs. 99.3
(SD 15.1)
33
37
44
49
Note: mean and standard deviations were taken from a Sprinkles study (Ip, Hyder et al. 2009) assessing infants from Bangladesh of the same age and health status. 4.2.7 Study Design
The study was a randomized, double-blinded, controlled trial with an intervention period
of 8 weeks. Infants were randomly assigned to 1 of 2 treatment groups after completing the
baseline assessment. As it would be unethical to provide a placebo to a child with anemia, we
did not include a placebo control. Individual randomization was done with sealed opaque
envelopes containing treatment group designations that were generated randomly by computer
with Microsoft Excel 2007 (Microsoft Corporation, Seattle). Sprinkles MNP sachets were also
labeled with one of two codes to indicate the formulation inside. All individuals involved in the
study (including parents, field workers, and research staff) were blinded to group assignments
and Sprinkles MNP sachets codes until the completion of the study. The primary outcome of the
study was change in Hb concentration and secondary outcomes included infant dietary
assessment using a Food Frequency Questionnaire (FFQ) and 24-Hours Recall questionnaire
(with special emphasis on calcium and iron intake), treatment adherence, and side-effects
(diarrhea, darker stools, etc.).
4.2.8 Study Logistics, Data Collection, and Compliance
The study was conducted in 3 consecutive phases. All staff who participated in the study
were hired and trained by the principal researcher (PR; Waqas Ullah Khan). In addition to hiring

55
and training the research staff, all training manuals, study questionnaires, and self-coaching
guides were developed by the PR. The PR was also responsible for devising and overseeing the
implementation of the study and performing all study-related analyses (WAZ-scores and dietary
intakes). All data collected was reviewed by the PR, and field managers to check for accuracy
and completion. All research staff were females to accommodate cultural sensitivities when
interacting with and interviewing the mothers of the participating infants.
a. Community Mobilization and Recruitment Phase: Between March and April 2010, the
first phase of the study was completed with the successful mobilization of 26
villages/communities and recruitment of 100 infants. Community mobilization and
approval were obtained through discussions with thana (sub-district) executives, thana
nirbahi officer (TNO), and village elders and leaders. The study’s PR, research
assistant/translator (RA), and field managers were responsible for completing this task.
Recruitment was based on the study’s inclusion criteria and completion of baseline
questionnaires, which focused on mother and infant anthropometric measurements, infant
Hb measurement, infant dietary intake using a FFQ and 24-Hour Recall, infant
breastfeeding practices, demographic information, and socioeconomic status (SES; see
Appendix A). Immediately following recruitment, each infant was assigned an
identification code and randomized to receive 1 of 2 interventions. Randomization was
carried out by the PR and RA, while the baseline data collection was performed by the
study’s data collectors (DCs) and field managers.
b. Intervention Phase: The second phase of the study was the 8-week intervention, which
lasted from April to June 2010. The intervention phase focused on the weekly
distribution of Sprinkles MNP sachets to the mothers of the infants participating in the

56
study and the completion of a “Monitoring, Morbidity, and Compliance Questionnaire”
(see Appendix B). Community health workers (CHWs) were hired and used to perform
these tasks. Sprinkles MNP sachets were distributed weekly along with the
administration of a short questionnaire to better monitor the adherence and safety of the
treatments. To test for compliance, mothers of participating infants were asked to return
both used and unused sachets from the previous week before receiving their new
consignment. At the end of each week, a child-proof zip-lock bag containing the
Sprinkles MNP treatment was distributed and the old bag was collected. During the
week, a CHW would visit each mother every other day to coach them on how to use the
MNP, reinforce the importance of their child consuming the MNP, and inquire about the
infant’s health. On the days that the mothers were not seen, a self-coaching guide using
pictures and a compliance calendar were created and distributed to ensure proper use of
the Sprinkles MNP and adherence (See Appendix C). CHWs handled questions when
possible, while the PR and field managers helped with problem cases. All CHWs were
hired from villages participating in the study, which helped build trust and rapport among
the communities involved. The rationale for using different workers during the
community mobilization and intervention phase was to eliminate any study biases and
ensure blinding procedures were maintained.
c. End-line Data Collection: The third phase of the study was dedicated to collecting each
infant’s final blood sample for Hb concentration post-treatment, dietary information
using a FFQ and 24-Hour Recall questionnaire, and their anthropometric measurements
along with their mother’s (see Appendix D for end-line questionnaires). This phase took

57
approximately 2 weeks to complete and was performed (after being re-trained) by the
DCs used in the study’s initial phase.
4.2.9 Anthropometric and Biochemical Measurements
Anthropometric and biochemical measurements were completed during baseline and end-
line study visits. An adjustable wooden length-board was used to measure height to the nearest
0.1 cm with mothers standing in an upright position and infants lying horizontally on the board.
All weight measurements were performed using the UNISCALE (UNICEF Supply Division,
Copenhagen, Denmark), which is accurate to 100g. Mothers were weighed both separately and
with their infants to determine infant weight. To exclude individual variation, all anthropometric
measurements were performed twice and taken by the same 3 DCs. The anthropometric data and
age of the child were used to calculate the weight-for-age Z-score (WAZ) using the WHO
Anthro version 3.0.1 software package (WHO Anthro 2010, Geneva Switzerland). Children with
a WAZ score of -3 or less were classified as severely underweight, excluded from the study, and
referred to a local healthcare facility for further assessment. Hb was the only biochemical
measurement performed in the study and was assessed on capillary blood obtained from a finger
prick using aseptic techniques. Hb concentration was determined directly in the field using a
portable HemoCue B-Hemoglobin photometer (Hemocue, Angelholm, Sweden) by trained DCs
using standardized techniques (Cohen and Seidl-Friedman 1988). Anemia was defined as an Hb
concentration between 70 to 100 g/L.
4.2.10 Study Questionnaires
Questionnaires were developed to collect information on socioeconomic status (SES),
personal characteristics, dietary intake and food habit, and child morbidity, mortality, and
treatment compliance. All questionnaires were written in English, translated into Bangla, back-

58
translated into English, and pre-tested before finalization. The data were collected by face-to-
face interviews in the home of each participating infant.
a. Demographic and SES Questionnaire (see Appendix A): Household data were collected
only at baseline to determine possible maternal, familial, and SES factors associated with
infant HB concentration and dietary intake. Mothers were asked about their age, level of
education, the number of live children they have, the study participant’s birth order,
household food sharing practices, number of individuals residing in their home, money
available for purchasing food, and the availability of water and electricity. Background
information on the household SES focused on the number of income earners residing in
the home, the main source of household income, home ownership, household
landholding, and perceived household economic status. To obtain information on
perceived economic status, mothers were asked whether they considered their
household’s situation in the preceding year to have been always in deficit, occasionally in
deficit, balanced, better than balanced, or surplus. A household was categorized as in
“deficit” if the mother answered either always or occasionally in deficit. The
questionnaire used in the study was based on the “Food Security and Nutrition
Surveillance Project” (FSNSP) survey developed by Hellen Keller International and
BRAC University.
b. Dietary Questionnaires (see Appendix A): Infant food consumption was assessed by FFQ
and 24-Hour Recall methods at both baseline and end-line. The FFQ was designed to
collect information on the intakes of foods likely to provide iron and calcium in infants 6
to 11 months of age. Foods included in the FFQ were taken from the “Tables of Nutrient
Composition of Bangladesh Foods” and input was obtained from village families with a 6
to 11 month old infant (International. and Programme. 1988). Both the FFQ and 24-Hour

59
Recall were pretested with 10 mothers with infants of the same age range who were
recruited from a local slum. The 24-Hour Recall and FFQ were created in tandem to
make sure that the FFQ included all the foods eaten. The final FFQ contained 279 food
items (spanning 15 food categories) and was designed to record what and how much food
was consumed during the past month, week, and day. A blank box was provided on both
the FFQ and 24-Hour Recall for recording foods and portion sizes other than those stated.
Additionally, questions were asked on the use of vitamin and mineral supplements and
whether the questionnaires were administered on a typical day. Regarding the 24-Hour
Recall questionnaire specifically, standardized measuring utensils including cups and
spoons were used to determine the estimated portion sizes of food consumed by each
infant. Mothers were asked to measure their food by themselves in front of a DC and
were requested to report the foods consumed at morning, mid-morning, lunch, evening,
and night. Information regarding the type of food, recipes of home-prepared foods, and
any brand-name products used were also asked. The recorded food items were coded by
the DCs and the equivalent weight of raw food was calculated using a conversion table
for Bangladeshi foods developed by Hellen Keller International (International. and
Programme. 1988). The nutritional content for a single feeding of breast milk was also
provided in this table and mixed dishes were disaggregated into individual foods prior to
analysis. To correct for errors, the PR, RA, and field managers thoroughly checked the
measured and coded items for accuracy and completion. In order to analyze the calcium
and iron micronutrient content of foods, data collected from the 24-Hour Recall was
cross-referenced with the “Tables of Nutrient Composition of Bangladesh Foods”
database (International. and Programme. 1988) by using Microsoft Excel 2007 (Microsoft

60
Corporation, Seattle). These values were than compared with the RNIs provided by the
FAO/WHO for calcium and iron (WHO 2002).
c. Morbidity, Mortality, and Compliance Questionnaire (see Appendix B): Throughout the
8-week intervention phase, a weekly morbidity, mortality, and compliance questionnaire
was conducted. During the home visits, mothers were asked if their infant experienced
any episodes of fever, coughing, difficulty breathing, nausea vomiting, loose motion,
constipation, black stool, and lack of appetite over the past week. Treatment side-effects
including nausea, vomiting, retching or dry heaves stool consistency concerns, and stool
colour changes within the past 12 hours were also asked of the mothers. Compliance was
assessed by counting the number of used and unused Sprinkles MNP sachets provided
from the preceding week and through specific questions regarding the sharing and daily
use of sachets.
4.2.11 Statistical Analysis
All data forms collected were manually checked for completeness, consistency, and range
before entered into the storage database. Data cleaning was performed at the BRAC head office
in Dhaka and subsequently in Toronto. Completed forms were coded and data were analyzed
using SAS (version 9.1; SAS Institute Inc., Carey, North Carolina) statistical software.
Statistical analyses were performed on an intention-to-treat basis. A one-sample Kolmogorov-
Smirnov test was used to determine whether the change in Hb concentration from baseline to
end-line, the main outcome measure, and other continuous variables collected were normally
distributed. To compare the change in mean Hb concentration, dietary intake of calcium and
iron, reported health complications, treatment adherence, anthropometric measurements, and
SES and demographic characteristics between groups, independent samples Student’s t-tests (on
continuous variables) and chi-square tests (for categorical variables) were performed. Pearson

61
and Spearman correlation matrices were generated to identify continuous and non-normal
variables associated with the difference in Hb concentration between treatment groups.
Differences between the groups in terms of Hb, anthropometric measurements, and other factors
potentially affecting Hb values at the baseline and end-line were assessed by ANOVA (Proc
GLM). An interaction between treatment group and baseline Hb were entered in the final model
to examine whether the difference in Hb was independently associated with treatment group and
Hb baseline status, or whether baseline Hb status modifies the association between the difference
in Hb and treatment group. The effect of potential confounding variables was assessed for all
models. Hb concentration was treated as a dichotomous variable (anemic vs. non-anemic) and
the prevalence of anemia post-treatment was compared between groups using logistic regression.
Linear regression analysis of factors associated with dietary iron and calcium intake was also
conducted. If the distribution of a dependent variable in a linear regression model was skewed,
log transformation was performed. In all analyses, statistical significance was defined as P <
0.05.
4.3. Results
4.3.1 Study Attrition
Of the 100 children enrolled in the study, 5 (5.0%) were lost to follow-up (Figure 4.3.1).
Losses were similar among the two treatment groups with family migration being the main
cause. Consequently, a total of 95 infants (48 in the control group and 47 in the intervention
group) completed the final assessment, including Hb and anthropometric measurements.
4.3.2 Infant Baseline Characteristics
At baseline, there were no significant differences between infants in the control and
intervention groups (Table 4.3.2.1). The mean infant age for the control and intervention group

62
was 8.8 (SD 1.6) and 8.7 (SD 1.6) months respectively, with a roughly equal distribution of
children between the ages of 6 to 11 months. Sex, weight, daily dietary intake of calcium and
iron, and birth order were also comparable between the treatment groups. Hb distribution ranged
from 72 to 100 g/L, but the mean value (control group 90.6 ± 6.7, intervention group 90.8 ± 7.8)
did not differ between treatment groups at baseline (Figure 4.3.2.2). Approximately three-
quarters (n = 71; 74.7%) of infants enrolled in the study were underweight (WAZ score < 0), and
only 24 (25.3%) had a WAZ score > 0. Despite a high prevalence of poor nutritional status, all
infants (n = 95) were breastfeeding and consuming complementary foods daily as recommended
by the WHO (WHO 2002).
4.3.3. Household Socio-demographic Characteristics
Household socio-demographic characteristics of the study population are given in Table
4.3.3.1. There were no significant differences among treatment groups based on mother’s age,
BMI, education, and number of children. More than 60 mothers (n = 64, 67.4%) were 25 years
or younger and this was the first child for 37 (38.9%) of them. Information regarding education
was missing for 15 mothers, but for those who did report attending school their distribution was
as follows: 8 (8.4%) with 1 to 4 years, 42 (44.2%) with 5 to 8 years, and 30 (31.6%) with > 9
years of schooling. The average household size was 5.1 (SD 2.2; Range = 3 to 13) in the control
group and 5.8 (SD 2.5; Range = 3 to 13) in the intervention group. Sixty (63.2%) mothers
reported that there was only one income-earning family member, while 19 (20.0%) stated that
there were two, and 16 (16.8%) reported that there were three or more. Household income was
mainly generated from: agriculture (n = 13; 13.7%), business (n = 25; 26.3%), labour (n = 38;
40.0%), fishing/pottery/weaving (n = 2; 2.1%), and other (n = 17; 17.9%) sources. Eighty-eight
mothers (92.6%) reported that their family owned the house they lived in and, when asked about
63
their economic status, 17 (17.9%) said they were in deficit, 48 (50.5%) said they were balanced,
11 (11.6%) said they were slightly better than balanced, and 19 (20.0%) stated they had an
income surplus. Only 4 mothers (4.2%) reported that less than half of their household income
was used on food, while 36 (37.9%) said approximately half, 50 (52.6%) said more than half,
and 5 (5.3%) said almost all. All families (n = 95) used a tube well/borehole as their main source
of drinking water and none of the mothers reported treating their drinking water.
4.3.4 Primary Outcome: Effects on Hemoglobin Concentration
A significant increase in the mean Hb concentration from baseline to the end of the study
was observed in both the control (Sprinkles MNP containing iron without calcium) (13.3 ± 12.6 g/L;
paired t-test P < 0.0001) and intervention groups (7.6 ± 11.6 g/L; paired t-test P < 0.0001) (Table
4.3.4.1). Figure 4.3.4.2 shows the end-line HB concentration difference within the two treatment
groups. The change in mean Hb concentration was also significantly different between the
groups, with infants who received the control Sprinkles MNP having a higher end-line Hb
concentration than those in the intervention group (5.7 ± 12.1 g/L; unpaired Student’s t-test P =
0.024; Figure 4.3.4.3).
Fifty-three percent (50 of 95) of infants improved from an anemic to a non-anemic state
(Hb > 100 g/L) at the end of the study. The rate of recovery between treatment groups was
significantly higher in the control group (67.7%; 32 of 48 subjects) compared to the intervention
group (38.3%; 18 of 47) (Fisher’s exact test P = 0.008) (Figure 4.3.4.4). After the 2 month
study, infants in the intervention group were more likely to remain anemic (OR 3.2; CI 1.4 - 7.5)
than in the control group.
Correlation matrices were also generated to identify factors associated with the difference
in the change of Hb between treatment groups (Table 4.3.4.5). Baseline Hb (Pearson r = -0.53;

64
P < 0.0001), baseline dietary iron intake (Pearson r = 0.29; P = 0.004), treatment group
(Spearman’s rho coefficient = -0.25; P = 0.017), and the change in iron intake from baseline to
end-line (Pearson r = -0.24; P = 0.025) were some of the variables significantly correlated with a
change in Hb between treatment groups. Candidate variables were then tested for an association
with the difference in the change of Hb between treatment groups in univariate analyses (Table
4.3.4.6). A final model was then generated using multivariate regression (Table 4.3.4.7). The
variables from this analysis included: baseline Hb (P = 0.004), treatment group (P = 0.019),
baseline iron intake (P = 0.015), and an interaction term (baseline Hb x treatment group; P =
0.032).
4.3.5 Infant Food Consumption with an Emphasis on Dietary Intake of Iron and Calcium
In this analysis, feeding episodes included all meals reported to have been given by
mothers to their child during the morning, mid-morning, afternoon, evening, and night. The
mean total number of meals per day was 3.6 (SD 1.2) for infants at baseline and 4.0 (SD 1.1) at
end-line. Foods consumed included: cereals which were found in 39.7% of meals at baseline and
38.0% at end-line, meat accounted for 1.4% and 3.5%, dairy products represented 10.9%, and
13.4%, fruits and vegetables were found in 24.4% and 23.6%, and miscellaneous items
accounted for the remaining 24.1% and 21.5% of foods consumed at baseline and end-line
respectively. Regarding the dietary intake of calcium and iron, there was no significant
difference between treatment groups at baseline and end-line. Additionally, the change in
dietary calcium and iron intake within treatment groups did not differ. Comparisons between the
total calcium and iron intakes at baseline and end-line with the WHO RNIs for infants 6-11
months of age are shown in Tables 4.4.5.1 and 4.4.5.2. Both the mean iron and calcium intakes

65
obtained from the complementary food and breastmilk fell significantly short of the WHO/FAO
recommended amounts at baseline and end-line.
4.3.6 Adherence and Side Effects
Adherence was determined by calculating the percentage of unused sachets out of the
total assigned. On the basis of the combined data from the 8 treatment monitoring visits,
adherence in the control group was 98.1% (SD 3.3%) and 98.4% (SD 2.8%) in the intervention
group. Adherence between the treatment groups was not significantly different. Mothers of
infants who were not adherent gave the following reasons: child developed fever, child vomited,
and child developed loose bowel movement. In the weekly monitoring surveys, none of the
mothers reported giving more than one sachet a day to their child. Giving or sharing the sachets
with a non-study child was also not reported by any of the mothers.
The occurrence of reported side effects between treatment groups was as follows: control
group, 27 of 48 (56.3%) and intervention group 28 of 47 (59.6%). Reported side-effects were
predominantly mild to moderate in nature and consisted of constipation, darkened stool, nausea,
vomiting, and retching.
4.3.7 End-line Anthropometric Characteristics
The mean WAZ scores at the start and end of the study period were similar between
treatment groups. The overall mean baseline and end-line WAZ scores were -0.78 ± 1.19 and
-0.99 ± 1.06 respectively (p>0.05). Although non-significant, there were 8 more infants
diagnosed as underweight at the end of the study when compared to the baseline.

263 excluded (ineligible)
intervention = 50
2 dropped out
completedstudy = 48
control = 50
100 randomized
363 infants screened
3 dropped out
completed study = 47
Figure 4.3.1. Study design and attrition.
66

67
Table 4.3.2.1 Infant characteristics at baseline by treatment group
Sprinkles MNP Treatment Group1 Characteristic
Control - MNP without Calcium (n = 48)
Intervention - MNP with Calcium (n = 47)
Age (mo) 8.8 ± 1.6 8.7 ± 1.6
Sex (M/F) 26/22 20/27
Weight (kg) 7.8 ± 1.0 8.1 ± 1.3
Weight-for-age Z-scores -1.0 ± 1.2 -0.6 ± 1.2
Hemoglobin (g/L) 90.6 ± 6.7 90.8 ± 7.8
Daily calcium intake2 (mg) 149 ± 172 184 ± 223
Daily iron intake2 (mg) 3.5 ± 3.0 3.5 ± 3.3
Birth order 2.0 ± 1.0 2.3 ± 1.4
Breastfed (Yes/No) 48/0 47/0
1 Values are mean ± SD. Treatment groups were compared using independent samples Student’s t-tests for all variables except sex, for which a Chi-square test was performed. Groups did not differ for any of the variables (P < 0.05). 2 Data on baseline calcium and iron intake were missing from one subject in each treatment group.

InterventionControl
Treatment Group
100
95
90
85
80
75
70
Bas
elin
e H
b (
g/L
)
Figure 4.3.2.1. Box plots of hemoglobin concentration for the two treatment groups at baseline of the study. No significant difference in mean hemoglobin concentration was observed between the two treatment groups. Lower and upper edge, line, and upper edge of the box represent the 25th, 50th, and 75th percentiles, respectively. Endpoints of lower and upper whiskers represent the minimum and maximum values for hemoglobin concentrations, respectively.
68
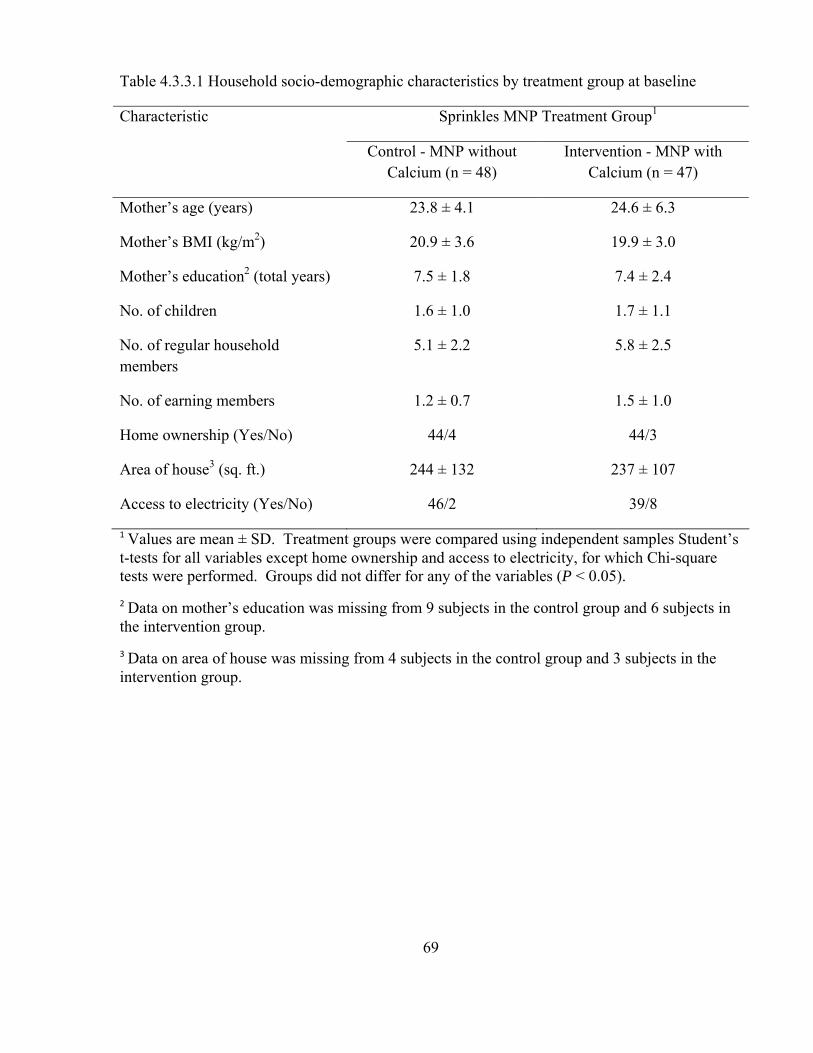
69
Table 4.3.3.1 Household socio-demographic characteristics by treatment group at baseline
Sprinkles MNP Treatment Group1 Characteristic
Control - MNP without Calcium (n = 48)
Intervention - MNP with Calcium (n = 47)
Mother’s age (years) 23.8 ± 4.1 24.6 ± 6.3
Mother’s BMI (kg/m2) 20.9 ± 3.6 19.9 ± 3.0
Mother’s education2 (total years) 7.5 ± 1.8 7.4 ± 2.4
No. of children 1.6 ± 1.0 1.7 ± 1.1
No. of regular household members
5.1 ± 2.2 5.8 ± 2.5
No. of earning members 1.2 ± 0.7 1.5 ± 1.0
Home ownership (Yes/No) 44/4 44/3
Area of house3 (sq. ft.) 244 ± 132 237 ± 107
Access to electricity (Yes/No) 46/2 39/8
1 Values are mean ± SD. Treatment groups were compared using independent samples Student’s t-tests for all variables except home ownership and access to electricity, for which Chi-square tests were performed. Groups did not differ for any of the variables (P < 0.05). 2 Data on mother’s education was missing from 9 subjects in the control group and 6 subjects in the intervention group. 3 Data on area of house was missing from 4 subjects in the control group and 3 subjects in the intervention group.

70
Table 4.3.4.1 Hemoglobin concentration and the percentage of non-anemic children by treatment group, at baseline, and after 2 months of treatment1
Sprinkles Treatment Group Characteristic
Control Intervention P-value across groups3
Baseline Hb2 (g/L) 90.6 ± 6.7 90.8 ± 7.8 0.903
End-line Hb2 (g/L) 103.9 ± 9.6 98.3 ± 10.8 0.010
Difference2 (g/L) 13.3 ± 12.6 7.6 ± 11.6 0.024
P-value for difference4
< 0.0001 < 0.0001
Non-anemic infants post-treatment (%)
67 38 0.008
1n values in brackets 2Values are mean ± SD 3Treatment groups were compared using independent samples Student’s t-tests 4Within group analysis performed used paired t-tests

*
Figure 4.3.4.2 Box plots of hemoglobin concentration for the two treatment groups at end of the study. The observed change in mean hemoglobin concentration within both treatment groups was significant. Lower and upper edge, line, and upper edge of the box represent the 25th, 50th, and 75th percentiles, respectively. Endpoints of lower and upper whiskers represent the minimum and maximum values for hemoglobin concentrations, respectively. * Paired t-test P < 0.001 for both control and intervention groups.
71

72
Figure 4.3.4.3 Box plots of the change in hemoglobin concentration between the two treatment groups. The observed change in mean hemoglobin concentration between the two treatment groups was significant. Lower and upper edge, line, and upper edge of the box represent the 25th, 50th, and 75th percentiles, respectively. Endpoints of lower and upper whiskers represent the minimum and maximum values for hemoglobin concentrations, respectively. * Unpaired Students’s Test P = 0.024.

Figure 4.3.4.4. Number of children remaining anemic (hemoglobin < 100 g/L) in each group at the end of the 2 month treatment period. * Chi-square P-value 0.0076
Table 4.3.4.5 Correlations between covariates and change in infants’ hemoglobin1
Factor Correlation coefficient P-value
Baseline hemoglobin (g/L) -0.53 < 0.0001
Baseline iron intake (mg) 0.29 0.004
Endline hemoglobin (g/L) 0.83 < 0.0001
Treatment group2 -0.25 0.017
Change in iron intake from baseline to endline (mg)
-0.24 0.025
Sex3 -0.18 0.080
1 Pearson r correlation coefficients are presented for all variables except intervention group and sex, for which Spearman’s rho correlation coefficients are presented 2 Control group = 1, intervention group = 2 3 Male = 1, female = 2
73

74
Table 4.3.4.6 Univariate analysis of variables associated with change in infants’ hemoglobin1
Variable Estimate Std Err t-value P-value R2
Baseline iron intake (mg)
1.18 0.40 2.93 0.005 8.3%
Treatment2 (control group)
5.97 2.50 2.38 0.019 5.4%
Baseline haemoglobin (g/L)
-0.91 0.15 -5.98 < 0.0001 27.8%
End-line haemoglobin (g/L)
0.96 0.07 13.40 < 0.0001 66.1%
Change in iron intake from baseline to end-line (mg)
-0.80 0.35 -2.28 0.025 5.8%
1 Separate model for each variable.
2 Control group change in infants’ hemoglobin = 13.3 g/L; intervention group change in infants’ hemoglobin = 7.6 g/L; difference between the two groups = 5.7 g/L.
Table 4.3.4.7 Multivariate analysis of variables associated with change in infants’ hemoglobin1
Variable Estimate Std Err t-value P-value
Baseline haemoglobin (g/L) -0.57 0.19 -3.01 0.003
Treatment2 (control group) 62.50 26.00 2.40 0.018
Baseline iron intake (mg) 0.81 0.34 2.41 0.018
Baseline hemoglobin (g/L) x treatment (control group)
-0.63 0.29 -2.20 0.030
1 All listed variables included in final model; model R2 = 40.8% 2 Control group change in infants’ hemoglobin = 13.1 g/L; intervention group change in infants’ hemoglobin = 7.4 g/L; difference between the two groups = 5.7 g/L
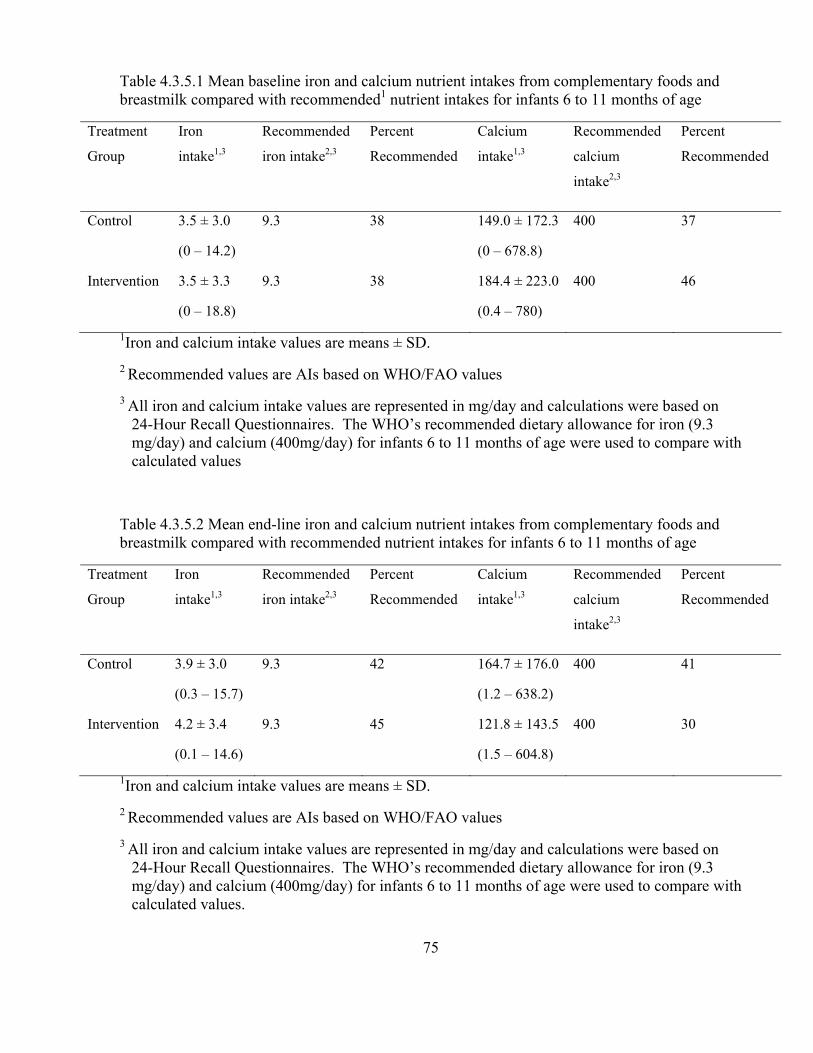
75
Table 4.3.5.1 Mean baseline iron and calcium nutrient intakes from complementary foods and breastmilk compared with recommended1 nutrient intakes for infants 6 to 11 months of age
Treatment
Group
Iron
intake1,3
Recommended
iron intake2,3
Percent
Recommended
Calcium
intake1,3
Recommended
calcium
intake2,3
Percent
Recommended
Control 3.5 ± 3.0
(0 – 14.2)
9.3 38 149.0 ± 172.3
(0 – 678.8)
400 37
Intervention 3.5 ± 3.3
(0 – 18.8)
9.3 38 184.4 ± 223.0
(0.4 – 780)
400 46
1Iron and calcium intake values are means ± SD. 2 Recommended values are AIs based on WHO/FAO values 3 All iron and calcium intake values are represented in mg/day and calculations were based on
24-Hour Recall Questionnaires. The WHO’s recommended dietary allowance for iron (9.3 mg/day) and calcium (400mg/day) for infants 6 to 11 months of age were used to compare with calculated values
Table 4.3.5.2 Mean end-line iron and calcium nutrient intakes from complementary foods and breastmilk compared with recommended nutrient intakes for infants 6 to 11 months of age
Treatment
Group
Iron
intake1,3
Recommended
iron intake2,3
Percent
Recommended
Calcium
intake1,3
Recommended
calcium
intake2,3
Percent
Recommended
Control 3.9 ± 3.0
(0.3 – 15.7)
9.3 42 164.7 ± 176.0
(1.2 – 638.2)
400 41
Intervention 4.2 ± 3.4
(0.1 – 14.6)
9.3 45 121.8 ± 143.5
(1.5 – 604.8)
400 30
1Iron and calcium intake values are means ± SD. 2 Recommended values are AIs based on WHO/FAO values 3 All iron and calcium intake values are represented in mg/day and calculations were based on
24-Hour Recall Questionnaires. The WHO’s recommended dietary allowance for iron (9.3 mg/day) and calcium (400mg/day) for infants 6 to 11 months of age were used to compare with calculated values.

Table 4.3.5.3 Proportion of infants who met the WHO’s recommended dietary allowance for iron and adequate intake for calcium based on treatment group1
Proportion of infants (%) Group Baseline Iron End-line Iron Baseline Calcium End-line CalciumControl 4.5 4.5 9.1 13.6
Intervention 2.4 9.5 16.7 4.8
1The WHO’s recommended dietary allowance for iron (9.3 mg/day) and calcium (400mg/day) for infants 6 to 11 months of age were used to compare with calculated values.
76

77
4.4 Discussion
There is a large body of literature supporting an inhibitory effect of dietary calcium on
iron absorption. However, to the best of our knowledge, no previous study has examined the
effects of calcium on Hb concentration in a population deficient in both nutrients and in a
developing world setting. We demonstrated a significant increase in mean Hb concentration
from baseline to end-line in both groups, but a significantly lower Hb response in the group
receiving Sprinkles MNP with calcium. The overall rate of successful anemia reversal in the
current study (53%) was comparable to a previous Sprinkles MNP study conducted in a similar
setting and population (53-54%)(Hyder, Haseen et al. 2007).
When comparing the two treatment groups, combined home-fortification with iron and
calcium was found to be less effective in reversing anemia than iron alone (38.3 vs. 67.7%, P =
0.008). This finding was also evident when examining the interaction of calcium and iron
Sprinkles MNP on Hb concentration (P = 0.032). There are many possible explanations for
these observations. In young infants, malaria and Helicobacter pylori have been shown to be
significant contributors to the etiology of anemia, especially in highly endemic areas (Stoltzfus,
Chwaya et al. 2000; Sarker, Mahmud et al. 2008). We believe this was unlikely, however,
because the prevalence of malaria in our study region is known to be low and Helicobacter
pylori infection has been proven to be neither a cause of IDA nor reason for treatment failure of
iron supplementation in young Bangladeshi children (Hyder, Haseen et al. 2007; Sarker,
Mahmud et al. 2008). Differences in baseline Hb concentration, demographic characteristics,
and family SES could also not account for the discrepancy in the change in Hb concentration and
cure rate of anemia as they were comparable between treatment groups. These findings are
similar to those made in a recent national anemia survey that reported villages in the Kaliganj
sub-district to be relatively homogenous with the mean Hb concentration not differing

78
significantly between sites (Hyder, Haseen et al. 2007). Another possibility is that anemia in
some children might have been due to acute infections or chronic disease rather than iron
deficiency. Endemic infections, such as gastroenteritis or respiratory illnesses, and chronic
diseases can interfere with the utilization of absorbed iron. As a result, children with these
conditions would not be expected to respond to the iron in both treatments (Ahluwalia 1998;
Zlotkin, Arthur et al. 2001). In this study, all infants were screened during enrolment for chronic
diseases and those displaying any signs or symptoms were excluded. Regarding acute infections,
some children became sick during the study. However, these episodes were primarily minor in
nature and, again, there were no significant differences between treatment groups. After
adjusting for age, gender, infant baseline Hb, baseline dietary iron and calcium intake,
demographic characteristics, SES, treatment compliance, side effects, and change in dietary
intake of iron and calcium, the difference in the change in Hb concentration and cure rate of
anemia between treatment groups remained. These results suggest an antagonistic interaction
between iron and calcium.
The site of action and precise molecular basis of the dietary effect of calcium on iron
absorption is not fully understood. Nevertheless, investigators have proposed two possible
mechanisms to explain this nutrient-nutrient interaction (Minihane and Fairweather-Tait 1998).
To account for the inconsistency between short-term effects of calcium on iron absorption and
the lack of long-term effects on iron status, Minihane and Fairweather-Tait suggested that an
adaptive mechanism in the intestinal mucosal cell was responsible. They hypothesized that when
mature mucosal cells are exposed to an iron deficient environment, they are stimulated to
produce high-affinity proteins, which result in more efficient iron absorption by the enterocytes
(Minihane and Fairweather-Tait 1998). Hallberg et al. refute this theory on the basis that there
has not been sufficient time for the evolution of intestinal mechanisms regulating iron absorption

79
to adapt to low iron intakes often seen in populations at risk for iron deficiency (Hallberg and
Rossander-Hulten 1999). However, a study using labelled iron in an animal model provided
further evidence to support the existence of an adaptive response to high calcium intake. Using
infant piglets fed high diets of calcium (liquid piglet formula fortified with 4666 mg of calcium
glycerophosphate per litre) for 2 weeks, Wauben and Atkinson reported that a high calcium
intake did not affect either iron status or the percentage of iron absorbed. Their explanation for
this finding was that there is an up-regulation of iron transfer across the intestinal brush border in
the presence of high calcium intake (Wauben and Atkinson 1999). Interestingly, they also
considered this as a reflection of the effects of calcium in an environment of marginal iron status.
This suggests that even when there is low iron status, calcium supplementation would not reduce
it any further (Bendich 2001). Conversely, on the basis that calcium inhibits heme iron
absorption to the same extent as non-heme iron absorption, several researchers have suggested
that the effect is enterocyte based rather than being a luminal cause (Barton, Conrad et al. 1983;
Hallberg, Brune et al. 1991). Hallberg et al. proposed that there is competitive inhibition
between calcium and iron in a final transport step within the enterocyte common for both dietary
sources of iron (Hallberg, Rossander-Hulten et al. 1992). Since both dietary forms of iron enter
the duodenal enterocytes via separate pathways, it is thought that they form a common cellular
pool prior to being transferred to the plasma. It is in this cellular pool where calcium is believed
to negatively interact with iron (Lynch 2000).
Another important factor to consider when assessing the effects of diet on iron absorption
is that individual body iron status is the main determinant of the efficiency of mucosal cell
uptake and transfer (Cook, Dassenko et al. 1991; Hallberg, Hulten et al. 1997). Thus, iron
absorption in individuals with sufficient iron stores will be relatively unaffected by dietary
modulators of iron availability such as calcium (Minihane and Fairweather-Tait 1998). In two

80
randomized studies, no detrimental effects on iron absorption or status were observed in healthy
iron-replete full-term infants fed calcium and phosphorus fortified formulas to the age of 9
months, or in healthy iron-replete children fed calcium-fortified breakfast cereal (Dalton, Sargent
et al. 1997; Abrams, Griffin et al. 2001). Ames et al. also found no adverse effect in the
incorporation of iron into red blood cells in healthy preschool children, 3 to 5 years of age,
following a high calcium diet. On the contrary, their study showed that increasing calcium
intake from 500 to 1200 mg/day resulted in significant absorption of calcium without the
impairment of iron status (Ames, Gorham et al. 1999). In this study, infants in both groups had
similar baseline Hb concentrations (an indirect measure of iron status) that were below normal
and, thus, were susceptible to dietary modulators of iron absorption. Although both groups
responded well to the treatments, the infants who received Sprinkles MNP with calcium
displayed a significantly lower increase in Hb concentration when compared to the subjects in
the Sprinkles MNP without calcium group. Additionally, infants who received Sprinkles MNP
with calcium were more likely to remain anemic (OR 3.2; CI 1.4 - 7.5), have a significantly
lower change in their Hb concentration post-treatment (5.7 ± 12.1 g/L, P = 0.024), fail to achieve
a positive response from their treatment, and have a lower rate of anemia recovery (P = 0.008).
Moreover, a significant association was observed between the change in Hb and infants’ baseline
Hb concentration and dietary intake of iron (P = 0.004 and P = 0.025, respectively). These
findings suggest that calcium has an adverse effect on iron absorption in individuals with low
iron status (Sandstrom 2001). Conversely, individuals with IDA but a baseline Hb closer to
normal range and a dietary intake of iron approaching the RDA may be at an advantage when
consuming additional dietary calcium since the negative interaction between iron and calcium
may be reduced although not completely eliminated.
Hallberg et al. suggest that a dose-related reduction of iron absorption with increases in

81
calcium consumption should also be considered when examining the interaction between these
two micronutrients (Hallberg, Brune et al. 1991). According to their findings, no effect on iron
absorption is seen when less than 40 mg of calcium is present in a meal, while no further
inhibition occurs when the calcium content exceeds 300 mg. In practice, this means that adding
200 mg of calcium to a meal containing 100 mg of calcium would reduce iron absorption,
whereas no additional effect would be observed if the meal already contained more than 300 mg
of calcium (Hallberg 1998). In the current study, infants in the Sprinkles MNP intervention
group received 400 mg of calcium/day (added to a single meal), in addition to their mean daily
dietary calcium intake. If iron absorption is maximally inhibited by 300 mg of calcium, then the
results we observed in the intervention group are consistent with Hallberg’s theory. However,
we did not test for a calcium dose-response and the amounts of calcium and iron used were based
on the RNI published by the WHO/FAO and International Nutritional Anemia Consultative
Group (Stoltzfus and Dreyfuss 1998; Lutter and Dewey 2003). It is important to mention that
previous studies showing calcium inhibition of iron absorption in a dose-related manner were
conducted on healthy individuals in either a single-meal or short-term study (Galan, Cherouvrier
et al. 1991; Hallberg, Brune et al. 1991; Gleerup, Rossander-Hulthen et al. 1995). As mentioned
in Lynch’s article, the effects of factors that change the bioavailability of iron are often
exaggerated in single-meal studies (the experimental design is often used to ensure a maximum
inhibitory effect), and measurements based on the consumption of multiple-meals are more
likely to reflect the true nutritional impact of this nutrient-nutrient interaction (Lynch 2000). Our
study was conducted for over two months and reflects a habitual intake of calcium unlike the
single-meal studies mentioned above. Under the circumstances of the current study, we believe
the impact of calcium on iron status to be quite robust. However, it must be highlighted that the
daily calcium intake was not spread out across three meals, but provided in a single daily meal.

82
Had the same dose of calcium been divided into three meals, the results may have been different.
Regarding the adequacy of micronutrient intakes, conclusions depend on assumptions
made regarding breastmilk composition and infant nutrient requirements. Breast milk
micronutrient values potentially affected by maternal status include Vitamin A, riboflavin,
thiamine, Vitamin B-6, Vitamin B-12, and selenium values. However, folic acid, Vitamin D,
calcium, iron, copper, and zinc content in breastmilk are not likely to be affected by maternal
intake or reserves (Kimmons, Dewey et al. 2005). In this study, the mean total intakes of iron
and calcium (from both breastmilk and complementary food) were well below their RNI (WHO
2002). Nevertheless, they were comparable with other studies examining food intake in iron and
calcium deficient children in Bangladesh (Ahmed 2000; WHO 2002; Combs and Hassan 2005;
Kimmons, Dewey et al. 2005; Dewey 2007; Combs, Hassan et al. 2008). Food intake data also
revealed a lack of diversity in infant diets, with plant foods based on cereals, vegetables, and
fruits being the main items consumed. A similar dietary pattern has also been reported in
Bangladeshi adolescent female factory workers and male rickshaw pullers (Ahmed and
Khandker 1997; Khan and Ahmed 2005). The primary concern with these diets is that they
contain foods with a poor bioavailability of iron and calcium, while also containing high levels
of phytates and oxalates. These compounds are known to interfere with the absorption of iron
and calcium and, thus, provide very little health benefits to the individual (Hels, Kidmose et al.
2003; Mensah and Tomkins 2003; Zimmermann, Chaouki et al. 2005; Oramasionwu, Thacher et
al. 2008). Interestingly, an increase in the mean total number of meals consumed per day from
baseline to end-line was seen, but with a subsequent decrease in the amount of food given per
feeding episode. Moreover, there was no significant difference in the dietary intake of calcium
and iron from baseline to end-line both within and between treatment groups. Inadequate
weaning practices resulting from a lack of education, unfounded cultural beliefs, and, most

83
importantly, inadequate access to nutrient-dense foods due to financial barriers might account for
these findings (Bhargava, Bouis et al. 2001; Islam, Lamberg-Allardt et al. 2003; Zlotkin,
Christofides et al. 2004).
Low adherence to micronutrient supplementation programs have been widely reported
and attributed to numerous factors, including inadequate program support, insufficient delivery
of services, and patient factors. Patient factors include adverse side effects and
misunderstanding of the supplementation schedule (Allen, Rosado et al. 2000; Gross, Diaz et al.
2006). In this study, the high rates for adherence in both groups (98.1% in the control group and
98.4% in the intervention group) are consistent with those of our previous research (Zlotkin,
Schauer et al. 2005; Christofides, Asante et al. 2006). We believe that the high adherence
achieved may in part be explained by the frequent visits to households (3-4/week) by the trained
CHWs and a reliable supply of Sprinkles MNP. All CHWs were locally recruited (living and
working in the same village) because they understood the native language, customs, and
environmental conditions of the area. This, in turn, made it easier for them to establish good
rapport with the mothers of our study subjects and encourage them to administer the Sprinkles
MNP as recommended. As Tontisirin et al. suggested, a minimal number of CHWs (1 for
roughly 10 households) can easily inform, encourage, and train households to make proper use of
the treatment provided (Tontisirin, Nantel et al. 2002). In keeping with these recommendations,
we recruited 1 CHW for approximately every 8 households. In addition, the communication
materials (Sprinkles self-coaching guide and compliance calendar) given to each participating
household at baseline and our weekly monitoring, morbidity, and compliance system helped
avoid any mismanagement and frustration within the study. Although these items increased the
cost of the study, as shown by Lechtig et al., they were likely indispensible to securing
participation and compliance (Lechtig, Gross et al. 2006). A recent study in Mali found similar

84
results as women were more likely to take micronutrient supplements if access were guaranteed
and if they were provided with minimum, consistent, relevant, and easily understandable
information and counselling (Ayoya, Bendech et al. 2007). The high acceptability and adherence
can also be attributed to the simplicity of using Sprinkles MNP. One does not need to be literate
and there are no special utensils required to handle it. Moreover, it mixes well with any semi-
solid food and does not change the taste, colour, or consistency of the food to which it is added
(Christofides, Asante et al. 2006; Zlotkin and Tondeur 2007).
In the present study, infant constipation was the most frequently reported side-effect by
mothers. Darker stool was also common, but nausea, vomiting, and retching were rare. It is
likely that many of the side effects reported were due to factors other than the Sprinkles MNP
treatments. Acute illness and disease may have caused these conditions, but since a placebo
group was not included in this study, it was not possible to determine whether the reported side
effects were due to the treatments or other causes. Nevertheless, side effects were mild to
moderate in nature and none of the subjects required medical care or hospitalization. Moreover,
the occurrence of adverse effects did not appear to affect compliance as it was very high in both
treatment groups.
Growth profile did not differ among Sprinkles MNP treatment groups and the overall
WAZ score showed a progressive impairment from baseline to the end of the study. This result
is not unexpected and is in agreement with findings by other authors (Zlotkin, Arthur et al. 2003;
Giovannini, Sala et al. 2006). Indeed, cereal and plant-based complementary foods commonly
consumed in developing countries are inadequate sources of nutrients for infant development
(Brown, Dewey et al. 1998).

85
4.5 Study Limitations
The study findings need to be viewed within some contextual limitations. It was a
randomized controlled “efficacy” trial and should not be viewed as an “effectiveness” study. A
placebo group was not included for ethical reasons, but it is highly unlikely that infant Hb and
calcium status would improve had no treatment been provided. This is because complementary
foods in rural Bangladesh are typically low in bioavailable iron and calcium (Ahmed 2000;
Islam, Lamberg-Allardt et al. 2003; Combs and Hassan 2005; Kimmons, Dewey et al. 2005;
International 2006; Arnaud, Pettifor et al. 2007). Due to limited resources, serum calcium levels
and other indicators of iron status were not measured. However, since serum calcium levels only
account for 1% of the total body calcium, it is often viewed as a poor biomarker for overall
calcium assessment (Oginni, Sharp et al. 1999; Moe 2008). Regarding iron status, of all the
testing methods available, measuring Hb concentration is most often used to screen for anemia
(as a proxy indicator for iron deficiency) because of its low cost, simplicity, speed of the
procedure, and better performance when compared with hematocrit assessment (Mei, Parvanta et
al. 2003). We also assume that iron deficiency is the primary cause of anemia in Bangladesh
since the typical foods consumed by infants are low in bioavailable iron and not fortified
(Kimmons, Dewey et al. 2005). Moreover, neither Helicobacter pylori infection or malaria are
endemic to our study region and, thus, can be ruled-out as etiological factors contributing to
prevalence of anemia (Hyder, Haseen et al. 2007; Sarker, Mahmud et al. 2008). Another study
limitation is that estimates of calcium deficiency were based largely on adequacy of dietary
intake relative to recommendations. This approach is further complicated by the lack of
agreement between expert groups on calcium requirements (Flynn 2003). In our study, only
WHO/FAO recommendations for dietary intake of calcium were used.
Dietary questionnaires also have limitations that must be taken into consideration.

86
Although interviewers are trained for the task, there might be some biases in the data collection.
It should also be noted that estimates of calcium and iron intake from foods may not reflect
actual dietary intake due to under and over-reporting. One advantage in this study was that the
study subjects were from a fairly homogenous socioeconomic class. Thus, the range of food
items consumed by them was relatively limited and similar between groups.

87
Chapter 5.0 Conclusions and Future Considerations
5.1 Conclusions
This study examined whether infants diagnosed with IDA would have a similar
improvement in Hb concentration when given combined iron and calcium Sprinkles MNP
compared with iron Sprinkles MNP alone. The significant Hb response seen in both Sprinkles
MNP groups suggested good adherence to the protocol and the efficacy of both treatments.
However, the significant difference between treatment groups demonstrated that Sprinkles MNP
with iron alone is more effective than if combined with calcium in improving rates of anemia.
Thus, the findings from our study did not support the hypothesis that the reversal of anemia
through the use of iron-containing Sprinkles will not be depressed by the concurrent provision of
calcium in children with anemia. As the doses of calcium and iron were equal to or slightly
greater than their AI and RDA respectively, this outcome does not support our secondary
hypothesis that it is possible (at the doses used in the current study) to improve dietary calcium
intake through Sprinkles MNP with iron and calcium without interfering in the absorption of
iron.
Although the addition of calcium had a significant negative effect on the change in Hb
concentration, one must not over interpret these results. When combined with iron in the
Sprinkles MNP, the group receiving calcium still displayed a significant improvement in Hb
status. Perhaps this formulation of MNP can be used as an efficacious arm of a multifaceted
approach targeting specific calcium deficient infant groups that are mildly or at risk of becoming
anemic. However, a risk/benefit ratio regarding the health outcomes would need to be explicitly
defined before proceeding with this treatment approach. Alternately, a dose response study with
a similar iron dose but lower amounts of calcium would be worth pursuing. To our knowledge,

88
no previous study has examined this nutrient-nutrient interaction in a pediatric population
suffering from anemia and dietary calcium deficiency in a developing country. This makes our
findings especially novel given the magnitude and growing prevalence of IDA and calcium
deficiency in South Asia. Further research would advance our understanding of the long-term
effects of calcium on iron absorption in anemic and calcium deficient children and to understand
the mechanisms involved before an unequivocal public health message on calcium and iron joint
home-fortification can be made.
5.2. Future Considerations
Clearly, safety issues must be a top priority for any future calcium and iron interaction
studies in children with IDA and deficient in calcium. Research on long-term impacts on Hb and
calcium status, infant bone mass, and later growth and development will be useful to verify
whether the improvements seen are being sustained. Determining the range of safe levels of
intake between minimum and upper tolerance levels for children with IDA and suffering from
calcium deficiency and the public health significance of marginal deficiencies for iron and
calcium should also be investigated.
For bioavailability, nutrient-nutrient interaction mechanism, and nutrition status
monitoring studies, the use of stable non-radioactive isotopes provide a convenient and precise
tool. This technology is non-invasive and has been demonstrated to work effectively in field
studies conducted in both developed and developing countries (Solomons, Janghorbani et al.
1982; Hambidge, Krebs et al. 1998; Ribaya-Mercado, Mazariegos et al. 1999; Tang, Qin et al.
2000; Zlotkin, Schauer et al. 2006). To the best of our knowledge, no study has used isotopes to
examine the bioavailability of or interaction between iron and calcium in a pediatric population
deficient in both nutrients.

89
New non-invasive, low-cost, and rapid techniques also need to be developed for assessing
the prevalence of iron and calcium deficiency in developing countries. This, in turn, could
provide more accurate diagnoses, prevent under or over-reporting, and promote interventions
that better target populations deficient in these micronutrients.
Finally, as Gross and Solomons suggested, there needs to be a paradigm shift with regard
to nutrition research in developing countries. This requires support for interventions that not
only protect against micronutrient deficiencies, but also encourage longer-term health promotion
(Gross and Solomons 2003). However, to achieve this, large scale pediatric studies are needed to
test the effectiveness of Sprinkles MNP with calcium in the treatment and prevention of anemia
and calcium deficiency before they are scaled up to community health programs.

90
References Abrams, S. A. (2005). "Calcium supplementation during childhood: long-term effects on bone
mineralization." Nutr Rev 63(7): 251-5. Abrams, S. A. and S. A. Atkinson (2003). "Calcium, magnesium, phosphorus and vitamin D
fortification of complementary foods." J Nutr 133(9): 2994S-9S. Abrams, S. A., N. V. Esteban, et al. (1991). "Dual tracer stable isotopic assessment of calcium
absorption and endogenous fecal excretion in low birth weight infants." Pediatr Res 29(6): 615-8.
Abrams, S. A., I. J. Griffin, et al. (2001). "Calcium fortification of breakfast cereal enhances
calcium absorption in children without affecting iron absorption." J Pediatr 139(4): 522-6.
Aggett, P. J., C. Agostoni, et al. (2002). "Iron metabolism and requirements in early childhood:
do we know enough?: a commentary by the ESPGHAN Committee on Nutrition." J Pediatr Gastroenterol Nutr 34(4): 337-45.
Ahluwalia, N. (1998). "Diagnostic utility of serum transferrin receptors measurement in
assessing iron status." Nutr Rev 56(5 Pt 1): 133-41. Ahmed, F. (2000). "Anaemia in Bangladesh: a review of prevalence and aetiology." Public
Health Nutr 3(4): 385-93. Ahmed, F. and M. A. I. Khandker (1997). "Dietary pattern and nutritional status of Bangladeshi
manual workers (rickshaw pullers)." International Journal of Food Sciences and Nutrition 48: 285-91.
Allen, L. H., J. L. Rosado, et al. (2000). "Lack of hemoglobin response to iron supplementation
in anemic mexican preschoolers with multiple micronutrient deficiencies." Am J Clin Nutr 71(6): 1485-94.
Ames, S. K., B. M. Gorham, et al. (1999). "Effects of high compared with low calcium intake on
calcium absorption and incorporation of iron by red blood cells in small children." Am J Clin Nutr 70(1): 44-8.
Amine, E. K. and D. M. Hegsted (1971). "Effect of diet on iron absorption in iron-deficient rats."
J Nutr 101(7): 927-35. Andrews, N. C. (2004). "Molecular control of iron metabolism." Best Practice & Research
Clinical Hematology 18(2): 159-169. Appel, L. J., T. J. Moore, et al. (1997). "A clinical trial of the effects of dietary patterns on blood
pressure. DASH Collaborative Research Group." N Engl J Med 336(16): 1117-24.

91
Arnaud, J., J. M. Pettifor, et al. (2007). "Clinical and radiographic improvement of rickets in Bangladeshi children as a result of nutritional advice." Ann Trop Paediatr 27(3): 185-91.
Asobayire, F. S., P. Adou, et al. (2001). "Prevalence of iron deficiency with and without
concurrent anemia in population groups with high prevalences of malaria and other infections: a study in Cote d'Ivoire." Am J Clin Nutr 74(6): 776-82.
Ayoya, M. A., M. A. Bendech, et al. (2007). "Determinants of high vitamin A supplementation
coverage among pre-school children in Mali: the National Nutrition Weeks experience." Public Health Nutr 10(11): 1241-6.
Baker, S. S., W. J. Cochran, et al. (1999). "American Academy of Pediatrics. Committee on
Nutrition. Calcium requirements of infants, children, and adolescents." Pediatrics 104(5 Pt 1): 1152-7.
Baltussen, R., C. Knai, et al. (2004). "Iron fortification and iron supplementation are cost-
effective interventions to reduce iron deficiency in four subregions of the world." J Nutr 134(10): 2678-84.
Barton, J. C., M. E. Conrad, et al. (1983). "Calcium inhibition of inorganic iron absorption in
rats." Gastroenterology 84(1): 90-101. Bass, J. K. and G. M. Chan (2006). "Calcium nutrition and metabolism during infancy."
Nutrition 22(10): 1057-66. Beard, J. L. (2008). "Why iron deficiency is important in infant development." J Nutr 138(12):
2534-6. Bendich, A. (2001). "Calcium supplementation and iron status of females." Nutrition 17(1): 46-
51. Beutler, E. and C. West (2005). "Hematologic differences between African-Americans and
whites: the roles of iron deficiency and alpha-thalassemia on hemoglobin levels and mean corpuscular volume." Blood 106(2): 740-5.
Bhargava, A., H. E. Bouis, et al. (2001). "Dietary intakes and socioeconomic factors are
associated with the hemoglobin concentration of Bangladeshi women." J Nutr 131(3): 758-64.
Black, M. M., A. H. Baqui, et al. (2004). "Iron and zinc supplementation promote motor
development and exploratory behavior among Bangladeshi infants." Am J Clin Nutr 80(4): 903-10.
Boccio, J. R. and V. Iyengar (2003). "Iron deficiency: causes, consequences, and strategies to
overcome this nutritional problem." Biol Trace Elem Res 94(1): 1-32.

92
Bogen, D. L., J. P. Krause, et al. (2001). "Outcome of children identified as anemic by routine screening in an inner-city clinic." Arch Pediatr Adolesc Med 155(3): 366-71.
Borgna-Pignatti, C. and M. Marsella (2008). "Iron deficiency in infancy and childhood." Pediatr
Ann 37(5): 329-37. Borwankar, R., T. Sanghvi, et al. (2007). "What is the extent of vitamin and mineral
deficiencies? Magnitude of the problem." Food and Nutrition Bulletin 28(1, Supplement 2).
BRAC. (2010). "Who We Are & What We Do." Retrieved August 2, 2010, from
http://www.brac.net/. Brittenham, G. M. (2007). "Iron metabolism in children: confounding factors." Food Nutr Bull
28(4 Suppl): S510-4. Brown, K., K. Dewey, et al. (1998). Complementary Feeding of Young Children in Developing
Countries: A Review of Current Scientific Knowledge (WHO/Nut/98.1). Geneva, WHO. Carley, A. (2003). "Anemia: when is it iron deficiency?" Pediatr Nurs 29(2): 127-33. Cashman, K. D. (2002). "Calcium intake, calcium bioavailability and bone health." Br J Nutr 87
Suppl 2: S169-77. Cashman, K. D. and A. Flynn (1999). "Optimal nutrition: calcium, magnesium and phosphorus."
Proc Nutr Soc 58(2): 477-87. Chan, G. M., K. McElligott, et al. (2006). "Effects of dietary calcium intervention on adolescent
mothers and newborns: A randomized controlled trial." Obstet Gynecol 108(3 Pt 1): 565-71.
Chang, S., S. El Arifeen, et al. "Supplementing iron and zinc: double blind, randomized
evaluation of separate or combined delivery." Eur J Clin Nutr 64(2): 153-60. Chaparro, C. M. (2008). "Setting the stage for child health and development: prevention of iron
deficiency in early infancy." J Nutr 138(12): 2529-33. Christofides, A., K. P. Asante, et al. (2006). "Multi-micronutrient Sprinkles including a low dose
of iron provided as microencapsulated ferrous fumarate improves haematologic indices in anaemic children: a randomized clinical trial." Matern Child Nutr 2(3): 169-80.
Cohen, A. R. and J. Seidl-Friedman (1988). "HemoCue system for hemoglobin measurement.
Evaluation in anemic and nonanemic children." Am J Clin Pathol 90(3): 302-5. Cole, C. R., F. K. Grant, et al. "Zinc and iron deficiency and their interrelations in low-income
African American and Hispanic children in Atlanta." Am J Clin Nutr 91(4): 1027-34.

93
Collard, K. J. (2009). "Iron homeostasis in the neonate." Pediatrics 123(4): 1208-16. Combs, G. F. and N. Hassan (2005). "The Chakaria food system study: household-level, case-
control study to identify risk factor for rickets in Bangladesh." Eur J Clin Nutr 59(11): 1291-301.
Combs, G. F., Jr., N. Hassan, et al. (2008). "Apparent efficacy of food-based calcium
supplementation in preventing rickets in Bangladesh." Biol Trace Elem Res 121(3): 193-204.
Consensus, C. (2004). Retrieved July 12, 2010, from
http://www.copenhagenconsensus.com/Default.aspx?ID=158. Consensus, C. (2008). Copenhagen Consensus 2008 - Results, Copenhagen Consensus Center:
1-6. Consultation, J. F. W. E. (2002). Vitamin and mineral requirements in human nutrition. Geneva,
WHO. Cook, J. D. (2005). "Diagnosis and management of iron-deficiency anaemia." Best Pract Res
Clin Haematol 18(2): 319-32. Cook, J. D., S. A. Dassenko, et al. (1991). "Assessment of the role of nonheme-iron availability
in iron balance." Am J Clin Nutr 54(4): 717-22. Cook, J. D., S. A. Dassenko, et al. (1991). "Calcium supplementation: effect on iron absorption."
Am J Clin Nutr 53(1): 106-11. Craviari, T., J. M. Pettifor, et al. (2008). "Rickets: an overview and future directions, with special
reference to Bangladesh. A summary of the Rickets Convergence Group meeting, Dhaka, 26-27 January 2006." J Health Popul Nutr 26(1): 112-21.
Cumming, R. G. and M. C. Nevitt (1997). "Calcium for prevention of osteoporotic fractures in
postmenopausal women." J Bone Miner Res 12(9): 1321-9. Dallman, P. R., G. D. Barr, et al. (1978). "Hemoglobin concentration in white, black, and
Oriental children: is there a need for separate criteria in screening for anemia?" Am J Clin Nutr 31(3): 377-80.
Dalton, M. A., J. D. Sargent, et al. (1997). "Calcium and phosphorus supplementation of iron-
fortified infant formula: no effect on iron status of healthy full-term infants." Am J Clin Nutr 65(4): 921-6.
Dawson-Hughes, B., F. H. Seligson, et al. (1986). "Effects of calcium carbonate and
hydroxyapatite on zinc and iron retention in postmenopausal women." Am J Clin Nutr 44(1): 83-8.

94
Deehr, M. S., G. E. Dallal, et al. (1990). "Effects of different calcium sources on iron absorption in postmenopausal women." Am J Clin Nutr 51(1): 95-9.
Dewey, K. G. (2007). "Increasing iron intake of children through complementary foods." Food
Nutr Bull 28(4 Suppl): S595-609. Dibba, B., A. Prentice, et al. (2000). "Effect of calcium supplementation on bone mineral
accretion in gambian children accustomed to a low-calcium diet." Am J Clin Nutr 71(2): 544-9.
Domellof, M. (2007). "Iron requirements, absorption and metabolism in infancy and childhood."
Curr Opin Clin Nutr Metab Care 10(3): 329-35. Domellof, M., R. J. Cohen, et al. (2001). "Iron supplementation of breast-fed Honduran and
Swedish infants from 4 to 9 months of age." J Pediatr 138(5): 679-87. Domellof, M., K. G. Dewey, et al. (2002). "The diagnostic criteria for iron deficiency in infants
should be reevaluated." J Nutr 132(12): 3680-6. Duncan, B., R. B. Schifman, et al. (1985). "Iron and the exclusively breast-fed infant from birth
to six months." J Pediatr Gastroenterol Nutr 4(3): 421-5. Fischer Walker, C., K. Kordas, et al. (2005). "Interactive effects of iron and zinc on biochemical
and functional outcomes in supplementation trials." Am J Clin Nutr 82(1): 5-12. Florea, A. M., E. N. Yamoah, et al. (2005). "Intracellular calcium disturbances induced by
arsenic and its methylated derivatives in relation to genomic damage and apoptosis induction." Environ Health Perspect 113(6): 659-64.
Flynn, A. (2003). "The role of dietary calcium in bone health." Proc Nutr Soc 62(4): 851-8. Fuhr, I. and H. Steenbock (1943). "The effect of dietary calcium, phosphorus, and vitamin D on
the utilization of iron III. The relation of rickets to anemia." Journal of Biological Chemistry 147(2): 71-75.
Galan, P., F. Cherouvrier, et al. (1991). "Effects of the increasing consumption of dairy products
upon iron absorption." Eur J Clin Nutr 45(11): 553-9. Galan, P., S. Hercberg, et al. (1985). "Factors affecting iron stores in French female students."
Hum Nutr Clin Nutr 39(4): 279-87. Geltman, P. L., L. K. Hironaka, et al. (2009). "Iron supplementation of low-income infants: a
randomized clinical trial of adherence with ferrous fumarate sprinkles versus ferrous sulfate drops." J Pediatr 154(5): 738-43.

95
Gera, T., H. P. Sachdev, et al. (2007). "Effect of iron supplementation on haemoglobin response in children: systematic review of randomised controlled trials." J Pediatr Gastroenterol Nutr 44(4): 468-86.
Gibson, R. S., E. L. Ferguson, et al. (1998). "Complementary foods for infant feeding in
developing countries: their nutrient adequacy and improvement." Eur J Clin Nutr 52(10): 764-70.
Gibson, R. S. and C. Hotz (2001). "Dietary diversification/modification strategies to enhance
micronutrient content and bioavailability of diets in developing countries." Br J Nutr 85 Suppl 2: S159-66.
Giovannini, M., D. Sala, et al. (2006). "Double-blind, placebo-controlled trial comparing effects
of supplementation with two different combinations of micronutrients delivered as sprinkles on growth, anemia, and iron deficiency in cambodian infants." J Pediatr Gastroenterol Nutr 42(3): 306-12.
Gleason, G. and N. S. Scrimshaw (2007). An overview of the functional significance of iron
deficiency. Nutritional Anemia. K. Kraemer and M. B. Zimmermann. Basel, Sight and Life Press.
Gleerup, A., L. Rossander-Hulthen, et al. (1995). "Iron absorption from the whole diet:
comparison of the effect of two different distributions of daily calcium intake." Am J Clin Nutr 61(1): 97-104.
Grantham-McGregor, S. and C. Ani (2001). "A review of studies on the effect of iron deficiency
on cognitive development in children." J Nutr 131(2S-2): 649S-666S; discussion 666S-668S.
Greenberger, N. J., S. P. Balcerzak, et al. (1969). "Iron uptake by isolated intestinal brush
borders: changes induced by alterations in iron stores." J Lab Clin Med 73(5): 711-21. Greer, F. R. and N. F. Krebs (2006). "Optimizing bone health and calcium intakes of infants,
children, and adolescents." Pediatrics 117(2): 578-85. Greig, W. A. (1952). "The effects of additions of calcium carbonate to the diet of breeding mice.
2. Haematology and histopathology." Br J Nutr 6(3): 280-94. Gross, R. and N. W. Solomons (2003). "Multiple micronutrient deficiencies: future research
needs." Food Nutr Bull 24(3 Suppl): S42-53. Gross, U., M. M. Diaz, et al. (2006). "Effectiveness of the communication program on
compliance in a weekly multimicronutrient supplementation program in Chiclayo, Peru." Food Nutr Bull 27(4 Suppl Peru): S130-42.

96
Haas, J. D. and T. t. Brownlie (2001). "Iron deficiency and reduced work capacity: a critical review of the research to determine a causal relationship." J Nutr 131(2S-2): 676S-688S; discussion 688S-690S.
Hallberg, L. (1998). "Does calcium interfere with iron absorption?" Am J Clin Nutr 68(1): 3-4. Hallberg, L., M. Brune, et al. (1991). "Calcium: effect of different amounts on nonheme- and
heme-iron absorption in humans." Am J Clin Nutr 53(1): 112-9. Hallberg, L., L. Hulten, et al. (1997). "Iron absorption from the whole diet in men: how effective
is the regulation of iron absorption?" Am J Clin Nutr 66(2): 347-56. Hallberg, L. and L. Rossander-Hulten (1999). "The interaction between calcium and iron. Are
there explanations for conflicting results?" Scandinavian Journal of Nutrition 43: 77. Hallberg, L., L. Rossander-Hulten, et al. (1992). "Inhibition of haem-iron absorption by
calcium." British Journal of Nutrition 69: 533-540. Hambidge, K. M., N. F. Krebs, et al. (1998). "Evaluation of zinc metabolism with use of stable-
isotope techniques: implications for the assessment of zinc status." Am J Clin Nutr 68(2 Suppl): 410S-413S.
Heaney, R. P. (1997). "The roles of calcium and vitamin D in skeletal health: an evolutionary
perspective." Food, Nutrition, and Agriculture 20: 4-12. Heaney, R. P. (2000). "Calcium, dairy products and osteoporosis." J Am Coll Nutr 19(2 Suppl):
83S-99S. Hels, O., U. Kidmose, et al. (2003). "Estimated nutrient intakes and adequacies in Bangladesh
change when newer values for vitamin A, iron and calcium in commonly consumed foods are applied." Int J Food Sci Nutr 54(6): 457-65.
Hettiarachchi, M., C. Liyanage, et al. (2008). "The efficacy of micronutrient supplementation in
reducing the prevalence of anaemia and deficiencies of zinc and iron among adolescents in Sri Lanka." Eur J Clin Nutr 62(7): 856-65.
Hillman, L. S., L. S. Johnson, et al. (1993). "Measurement of true absorption, endogenous fecal
excretion, urinary excretion, and retention of calcium in term infants by using a dual-tracer, stable-isotope method." J Pediatr 123(3): 444-56.
Horton, S. and J. Ross (2003). "The economics of iron deficiency." Food Policy 28: 51-75. Hurrell, R. (2002). "How to ensure adequate iron absorption from iron-fortified food." Nutr Rev
60(7 Pt 2): S7-15; discussion S43. Hurrell, R. F. (1997). "Preventing iron deficiency through food fortification." Nutr Rev 55(6):
210-22.

97
Hurrell, R. F., S. Lynch, et al. (2004). "Enhancing the absorption of fortification iron. A
SUSTAIN Task Force report." Int J Vitam Nutr Res 74(6): 387-401. Hutton, E. K. and E. S. Hassan (2007). "Late vs early clamping of the umbilical cord in full-term
neonates: systematic review and meta-analysis of controlled trials." Jama 297(11): 1241-52.
Hyder, S. M. Z., F. Haseen, et al. (2007). "Effect of daily versus once-weekly home fortification
with micronutrient Sprinkles on hemoglobin and iron status among young children in rural Bangladesh." Food and Nutrition Bulletin 28(2): 156-164.
Iannotti, L. L., J. M. Tielsch, et al. (2006). "Iron supplementation in early childhood: health
benefits and risks." Am J Clin Nutr 84(6): 1261-76. Idjradinata, P. and E. Pollitt (1993). "Reversal of developmental delays in iron-deficient anaemic
infants treated with iron." Lancet 341(8836): 1-4. INACG, WHO, et al. (1998). Guidelines for the use of iron supplements to prevent and treat iron
deficiency anemia. R. J. Stoltzfus and M. L. Dreyfuss. Washington, International Life Sciences Institute Press: 39.
International, H. K. (2006). The Burden of Anemia in Rural Bangladesh: The Need for Urgent
Action. Nutritional Surveillance Project Bulletin. Dhaka, Hellen Keller International, Bangladesh. 16.
International., H. K. and W. F. Programme. (1988). Table of Nutrient Composition of
Bangladeshi Foods: English version with particular emphasis on vitamin A content. I. Darnton-Hill, N. Hassan, R. Karim and M. R. Duthie. Dhaka, Hellen Keller International: 1-24.
Ip, H., S. M. Hyder, et al. (2009). "Improved adherence and anaemia cure rates with flexible
administration of micronutrient Sprinkles: a new public health approach to anaemia control." Eur J Clin Nutr 63(2): 165-72.
Irwin, J. J. and J. T. Kirchner (2001). "Anemia in children." Am Fam Physician 64(8): 1379-86. Islam, M. Z., C. Lamberg-Allardt, et al. (2003). "Dietary calcium intake in premenopausal
Bangladeshi women: do socio-economic or physiological factors play a role?" Eur J Clin Nutr 57(5): 674-80.
Jain, A., R. Agarwal, et al. (2008). "Hypocalcemia in the newborn." Indian J Pediatr 75(2): 165-
9. Jamil, K. M., A. S. Rahman, et al. (2008). "Micronutrients and anaemia." J Health Popul Nutr
26(3): 340-55.

98
Johnson-Spear, M. A. and R. Yip (1994). "Hemoglobin difference between black and white women with comparable iron status: justification for race-specific anemia criteria." Am J Clin Nutr 60(1): 117-21.
Khan, M. R. and F. Ahmed (2005). "Physical status, nutrient intake and dietary pattern of
adolescent female factory workers in urban Bangladesh." Asia Pac J Clin Nutr 14(1): 19-26.
Kimmons, J. E., K. G. Dewey, et al. (2005). "Low nutrient intakes among infants in rural
Bangladesh are attributable to low intake and micronutrient density of complementary foods." J Nutr 135(3): 444-51.
Kletzein, S. W. (1935). "The influence of iron assimilation of some of the elements in groups 1
and 2 of the periodic system." Journal of Nutrition 9 (Supplement 9). Kletzein, S. W. (1938). "The influence of calcium and phosphorus on iron assimilation." Journal
of Nutrition 15 (Supplement 16). Lanham-New, S. A. (2008). "Importance of calcium, vitamin D and vitamin K for osteoporosis
prevention and treatment." Proc Nutr Soc 67(2): 163-76. Lara, A. M., C. Mundy, et al. (2005). "Evaluation and costs of different haemoglobin methods
for use in district hospitals in Malawi." Journal of Clinical Pathology 58: 56-60. Latham, M. C., D. M. Ash, et al. (2003). "Efficacy trials of a micronutrient dietary supplement in
schoolchildren and pregnant women in Tanzania." Food Nutr Bull 24(4 Suppl): S120-8. Lechtig, A., R. Gross, et al. (2006). "Costs of the multimicronutrient supplementation program in
Chiclayo, Peru." Food Nutr Bull 27(4 Suppl Peru): S151-9. Lind, T., B. Lonnerdal, et al. (2003). "Effects of weaning cereals with different phytate contents
on hemoglobin, iron stores, and serum zinc: a randomized intervention in infants from 6 to 12 mo of age." Am J Clin Nutr 78(1): 168-75.
Lozoff, B. (2007). "Iron deficiency and child development." Food Nutr Bull 28(4 Suppl): S560-
71. Lozoff, B., J. Beard, et al. (2006). "Long-lasting neural and behavioral effects of iron deficiency
in infancy." Nutr Rev 64(5 Pt 2): S34-43; discussion S72-91. Lozoff, B., I. De Andraca, et al. (2003). "Behavioral and developmental effects of preventing
iron-deficiency anemia in healthy full-term infants." Pediatrics 112(4): 846-54. Lozoff, B., E. Jimenez, et al. (2000). "Poorer behavioral and developmental outcome more than
10 years after treatment for iron deficiency in infancy." Pediatrics 105(4): E51.

99
Lozoff, B., E. Jimenez, et al. (2006). "Double burden of iron deficiency in infancy and low socioeconomic status: a longitudinal analysis of cognitive test scores to age 19 years." Arch Pediatr Adolesc Med 160(11): 1108-13.
Lozoff, B., N. K. Klein, et al. (1998). "Behavior of infants with iron-deficiency anemia." Child
Dev 69(1): 24-36. Lutter, C. K. (2003). "Macrolevel approaches to improve the availability of complementary
foods." Food Nutr Bull 24(1): 83-103. Lutter, C. K. (2008). "Iron deficiency in young children in low-income countries and new
approaches for its prevention." J Nutr 138(12): 2523-8. Lutter, C. K. and K. G. Dewey (2003). "Proposed nutrient composition for fortified
complementary foods." J Nutr 133(9): 3011S-20S. Lynch, S. R. (2000). "The effect of calcium on iron absorption." Nutr Res Rev 13(2): 141-58. Mahoney, D. H., Jr. (2008). "Anemia in at-risk populations--what should be our focus?" Am J
Clin Nutr 88(6): 1457-8. Manis, J. G. and D. Schachter (1962). "Active transport of iron by intestine: effects of oral iron
and pregnancy." Am J Physiol 203: 81-6. Mannar, M. G. and R. Sankar (2004). "Micronutrient fortification of foods--rationale, application
and impact." Indian J Pediatr 71(11): 997-1002. McCann, J. C. and B. N. Ames (2007). "An overview of evidence for a causal relation between
iron deficiency during development and deficits in cognitive or behavioral function." Am J Clin Nutr 85(4): 931-45.
Mei, Z., I. Parvanta, et al. (2003). "Erythrocyte protoporphyrin or hemoglobin: which is a better
screening test for iron deficiency in children and women?" Am J Clin Nutr 77(5): 1229-33.
Mensah, P. and A. Tomkins (2003). "Household-level technologies to improve the availability
and preparation of adequate and safe complementary foods." Food Nutr Bull 24(1): 104-25.
Miller, G. D., J. K. Jarvis, et al. (2001). "The importance of meeting calcium needs with foods."
J Am Coll Nutr 20(2 Suppl): 168S-185S. Miller, J. Z., D. L. Smith, et al. (1988). "Calcium absorption from calcium carbonate and a new
form of calcium (CCM) in healthy male and female adolescents." Am J Clin Nutr 48(5): 1291-4.

100
Minihane, A. M. and S. J. Fairweather-Tait (1998). "Effect of calcium supplementation on daily nonheme-iron absorption and long-term iron status." Am J Clin Nutr 68(1): 96-102.
Moe, S. M. (2008). "Disorders involving calcium, phosphorus, and magnesium." Prim Care
35(2): 215-37, v-vi. Mora, J. O. (2002). "Iron supplementation: overcoming technical and practical barriers." J Nutr
132(4 Suppl): 853S-5S. Mungen, E. (2003). "Iron supplementation in pregnancy." J Perinat Med 31(5): 420-6. Munoz, M., A. Romero, et al. (2005). "Utility of point-of-care haemoglobin measurement in the
HemoCue-B haemoglobin for the initial diagnosis of anaemia." Clin Lab Haematol 27(2): 99-104.
Nair, K. M. and V. Iyengar (2009). "Iron content, bioavailability & factors affecting iron status
of Indians." Indian J Med Res 130(5): 634-45. Nicklas, T. A. (2003). "Calcium intake trends and health consequences from childhood through
adulthood." J Am Coll Nutr 22(5): 340-56. Nordin, B. E. C. (1997). "Calcium in health and disease." Food, Nutrition, and Agriculture 20:
13-26. Obarzanek, E. and T. J. Moore (1999). "Using feeding studies to test the efficacy of dietary
interventions: lessons from the Dietary Approaches to Stop Hypertension trial." J Am Diet Assoc 99(8 Suppl): S9-11.
Oginni, L. M., C. A. Sharp, et al. (1999). "Healing of rickets after calcium supplementation."
Lancet 353(9149): 296-7. Olivares, M., T. Walter, et al. (1999). "Anaemia and iron deficiency disease in children." Br Med
Bull 55(3): 534-43. Oliveira, M. A. and M. M. Osorio (2005). "[Cow's milk consumption and iron deficiency anemia
in children]." J Pediatr (Rio J) 81(5): 361-7. Oramasionwu, G. E., T. D. Thacher, et al. (2008). "Adaptation of calcium absorption during
treatment of nutritional rickets in Nigerian children." Br J Nutr 100(2): 387-92. Panagiotou, J. P. and K. Douros (2004). "Clinicolaboratory findings and treatment of iron-
deficiency anemia in childhood." Pediatr Hematol Oncol 21(6): 521-34. Perry, G. S., T. Byers, et al. (1992). "Iron nutrition does not account for the hemoglobin
differences between blacks and whites." J Nutr 122(7): 1417-24.
101
Pettifor, J. M. (2004). "Nutritional rickets: deficiency of vitamin D, calcium, or both?" Am J Clin Nutr 80(6 Suppl): 1725S-9S.
Pettifor, J. M. (2008). "Vitamin D &/or calcium deficiency rickets in infants & children: a global
perspective." Indian J Med Res 127(3): 245-9. Prentice, A., J. P. Bonjour, et al. (2003). "PASSCLAIM - Bone health and osteoporosis." Eur J
Nutr 42 Suppl 1: I28-49. Preziosi, P., S. Hercberg, et al. (1994). "Iron status of a healthy French population: factors
determining biochemical markers." Ann Nutr Metab 38(4): 192-202. Qu, X. H., X. L. Huang, et al. "Does Helicobacter pylori infection play a role in iron deficiency
anemia? A meta-analysis." World J Gastroenterol 16(7): 886-96. Reddy, M. B. and J. D. Cook (1997). "Effect of calcium intake on nonheme-iron absorption from
a complete diet." Am J Clin Nutr 65(6): 1820-5. Ribaya-Mercado, J. D., M. Mazariegos, et al. (1999). "Assessment of total body stores of vitamin
A in Guatemalan elderly by the deuterated-retinol-dilution method." Am J Clin Nutr 69(2): 278-84.
Rush, D. (2000). "Nutrition and maternal mortality in the developing world." Am J Clin Nutr
72(1 Suppl): 212S-240S. Sachdev, H., T. Gera, et al. (2005). "Effect of iron supplementation on mental and motor
development in children: systematic review of randomised controlled trials." Public Health Nutr 8(2): 117-32.
Salgueiro, M. J., M. Zubillaga, et al. (2002). "Fortification strategies to combat zinc and iron
deficiency." Nutr Rev 60(2): 52-8. Sandstrom, B. (2001). "Micronutrient interactions: effects on absorption and bioavailability." Br
J Nutr 85 Suppl 2: S181-5. Sanghvi, T., M. V. Ameringen, et al. (2007). "Vitamin and mineral deficiencies technical
situation analysis: a report for the Ten Year Strategy for the Reduction of Vitamin and Mineral Deficiencies Summary." Food and
Nutrition Bulletin 28(1, Supplement 2). Sanghvi, T., O. Dary, et al. (2007). "How canvitamin and mineral deficiencies be reduced?
Implementing proven interventions at scale." Food and Nutrition Bulletin 28(1 (Supplement)): S182-S196.

102
Sanghvi, T., J. Ross, et al. (2007). "Why is reducing vitamin and mineral deficiencies critical for development? The links between VMDs and survival, health, education, and productivity." Food and Nutrition Bulletin 28(1, Supplement 2).
Santika, O., U. Fahmida, et al. (2009). "Development of food-based complementary feeding
recommendations for 9- to 11-month-old peri-urban Indonesian infants using linear programming." J Nutr 139(1): 135-41.
Sari, M., S. de Pee, et al. (2001). "Estimating the prevalence of anaemia: a comparison of three
methods." Bull World Health Organ 79(6): 506-11. Sarker, S. A., H. Mahmud, et al. (2008). "Causal relationship of Helicobacter pylori with iron-
deficiency anemia or failure of iron supplementation in children." Gastroenterology 135(5): 1534-42.
Schauer, C. and S. Zlotkin (2003). "Home fortification with micronutrient sprinkles - A new
approach for the prevention and treatment of nutritional anemias." Paediatr Child Health 8(2): 87-90.
Scholl, T. O. (2005). "Iron status during pregnancy: setting the stage for mother and infant." Am
J Clin Nutr 81(5): 1218S-1222S. Shakur, Y. A., N. Choudhury, et al. "Unexpectedly high early prevalence of anaemia in 6-month-
old breast-fed infants in rural Bangladesh." Public Health Nutr 13(1): 4-11. Shamah, T. and S. Villalpando (2006). "The role of enriched foods in infant and child nutrition."
Br J Nutr 96 Suppl 1: S73-7. Sharieff, W., S. E. Horton, et al. (2006). "Economic gains of a home fortification program:
evaluation of "Sprinkles" from the provider's perspective." Can J Public Health 97(1): 20-3.
Shea, B., G. Wells, et al. (2002). "Meta-analyses of therapies for postmenopausal osteoporosis.
VII. Meta-analysis of calcium supplementation for the prevention of postmenopausal osteoporosis." Endocr Rev 23(4): 552-9.
Sherriff, A., A. Emond, et al. (2001). "Should infants be screened for anaemia? A prospective
study investigating the relation between haemoglobin at 8, 12, and 18 months and development at 18 months." Arch Dis Child 84(6): 480-5.
Solomons, N. W., M. Janghorbani, et al. (1982). "Bioavailability of zinc from a diet based on
isolated soy protein: application in young men of the stable isotope tracer, 70Zn." J Nutr 112(10): 1809-21.
Solon, F. S., J. N. Sarol, Jr., et al. (2003). "Effect of a multiple-micronutrient-fortified fruit
powder beverage on the nutrition status, physical fitness, and cognitive performance of schoolchildren in the Philippines." Food Nutr Bull 24(4 Suppl): S129-40.

103
Stoltzfus, R. (2001). "Defining iron-deficiency anemia in public health terms: a time for reflection." J Nutr 131(2S-2): 565S-567S.
Stoltzfus, R. J. (2001). "Iron-deficiency anemia: reexamining the nature and magnitude of the
public health problem. Summary: implications for research and programs." J Nutr 131(2S-2): 697S-700S; discussion 700S-701S.
Stoltzfus, R. J. (2008). "Research needed to strengthen science and programs for the control of
iron deficiency and its consequences in young children." J Nutr 138(12): 2542-6. Stoltzfus, R. J., H. M. Chwaya, et al. (1997). "Serum ferritin, erythrocyte protoporphyrin and
hemoglobin are valid indicators of iron status of school children in a malaria-holoendemic population." J Nutr 127(2): 293-8.
Stoltzfus, R. J., H. M. Chwaya, et al. (2000). "Malaria, hookworms and recent fever are related
to anemia and iron status indicators in 0- to 5-y old Zanzibari children and these relationships change with age." J Nutr 130(7): 1724-33.
Stoltzfus, R. J. and M. L. Dreyfuss (1998). Guidelines for the use of iron supplements to prevent
and treat iron deficiency anemia. Stoltzfus, R. J., M. L. Dreyfuss, et al. (1997). "Hookworm control as a strategy to prevent iron
deficiency." Nutr Rev 55(6): 223-32. Stoltzfus, R. J., J. D. Kvalsvig, et al. (2001). "Effects of iron supplementation and anthelmintic
treatment on motor and language development of preschool children in Zanzibar: double blind, placebo controlled study." Bmj 323(7326): 1389-93.
Subar, A. F., S. M. Krebs-Smith, et al. (1998). "Dietary sources of nutrients among US children,
1989-1991." Pediatrics 102(4 Pt 1): 913-23. Sullivan, K. M., Z. Mei, et al. (2008). "Haemoglobin adjustments to define anaemia." Trop Med
Int Health 13(10): 1267-71. Surico, G., P. Muggeo, et al. (2002). "Parenteral iron supplementation for the treatment of iron
deficiency anemia in children." Ann Hematol 81(3): 154-7. Tang, G., J. Qin, et al. (2000). "Protection of vitamin A status in Chinese children by a dietary
intervention with vegetables." Food and Nutrition Bulletin 21: 161-4. Teotia, M., S. P. Teotia, et al. (1998). "Endemic chronic fluoride toxicity and dietary calcium
deficiency interaction syndromes of metabolic bone disease and deformities in India: year 2000." Indian J Pediatr 65(3): 371-81.
Thacher, T. D., P. R. Fischer, et al. (1999). "A comparison of calcium, vitamin D, or both for
nutritional rickets in Nigerian children." N Engl J Med 341(8): 563-8.

104
Thacher, T. D., P. R. Fischer, et al. (2006). "Nutritional rickets around the world: causes and future directions." Ann Trop Paediatr 26(1): 1-16.
Tontisirin, K., G. Nantel, et al. (2002). "Food-based strategies to meet the challenges of
micronutrient malnutrition in the developing world." Proc Nutr Soc 61(2): 243-50. Turnlund, J. R., R. G. Smith, et al. (1990). "Milk's effect on the bioavailability of iron from
cereal-based diets in young women by use of in vitro and in vivo methods." Am J Clin Nutr 52(2): 373-8.
UNICEF (2001). The state of the world children 2001. New York, UNICEF. UNICEF and S. A. R. P. V. (SARPV) (2009). Childhood Rickets in Cox`s Bazar. Dhaka,
SARPV. UNICEF, M. I. (2004). Vitamin & Mineral Deficiency: A Global Progress Report. Ottawa Verrall, T. and K. Gray-Donald (2005). "Impact of a food-based approach to improve iron
nutrition of at-risk infants in northern Canada." Prev Med 40(6): 896-903. Viteri, F. E. (1997). "Iron supplementation for the control of iron deficiency in populations at
risk." Nutr Rev 55(6): 195-209. Walker, S. P., T. D. Wachs, et al. (2007). "Child development: risk factors for adverse outcomes
in developing countries." Lancet 369(9556): 145-57. Wauben, I. P. and S. A. Atkinson (1999). "Calcium does not inhibit iron absorption or alter iron
status in infant piglets adapted to a high calcium diet." J Nutr 129(3): 707-11. West, K. P., Jr. (2002). "Extent of vitamin A deficiency among preschool children and women of
reproductive age." J Nutr 132(9 Suppl): 2857S-2866S. Whiting, S. J. (1995). "The inhibitory effect of dietary calcium on iron bioavailability: a cause
for concern?" Nutr Rev 53(3): 77-80. WHO (2002). The optimal duration of exclusive breastfeeding. Report of an expert consultation.
Geneva, WHO. WHO (2002). Recommended Nutrient Intakes. Joint FAO/WHO expert consultation. Vitamin
and mineral requirements in human nutrition. VItamin and mineral requirements in human nutrition Geneva, WHO.
WHO. (2004). "Iron deficiency anaemia." Retrieved July 12, 2010, from
http://www.who.int/nutrition/topics/ida/en/index.html. WHO. (2007) "Report of the World Health Organization Technical Consultation on Prevention
and Control of Iron Deficiency in Infants and Young Children in Malaria-Endemic Areas, Lyon, France, 12-14 June 2006." Food Nutr Bull Volume, S489-631 DOI:

105
WHO, UNICEF, et al. (2001). Iron Deficiency Anaemia: assessment, prevention and control. A
guide for programme managers. Williford, A. L., L. M. Pare, et al. (2008). "Bone mineral metabolism in the neonate: calcium,
phosphorus, magnesium, and alkaline phosphatase." Neonatal Netw 27(1): 57-63. Yip, R. (1994). "Iron deficiency: contemporary scientific issues and international programmatic
approaches." J Nutr 124(8 Suppl): 1479S-1490S. Yip, R. (2002). "Iron supplementation: country level experiences and lessons learned." J Nutr
132(4 Suppl): 859S-61S. Yip, R. (2002). "Prevention and control of iron deficiency: policy and strategy issues." J Nutr
132(4 Suppl): 802S-5S. Yip, R. and P. R. Dallman (1996). Iron:Present Knowledge in Nutrition. Chicago, ILI Press. Yip, R. and U. Ramakrishnan (2002). "Experiences and challenges in developing countries." J
Nutr 132(4 Suppl): 827S-30S. Yurdakok, K., F. Temiz, et al. (2004). "Efficacy of daily and weekly iron supplementation on
iron status in exclusively breast-fed infants." J Pediatr Hematol Oncol 26(5): 284-8. Zhu, Y. I. and J. D. Haas (1997). "Iron depletion without anemia and physical performance in
young women." Am J Clin Nutr 66(2): 334-41. Zimmermann, M. B., N. Chaouki, et al. (2005). "Iron deficiency due to consumption of a
habitual diet low in bioavailable iron: a longitudinal cohort study in Moroccan children." Am J Clin Nutr 81(1): 115-21.
Zimmermann, M. B. and R. F. Hurrell (2007). "Nutritional iron deficiency." Lancet 370(9586):
511-20. Zlotkin, S. (2003). "Clinical nutrition: 8. The role of nutrition in the prevention of iron deficiency
anemia in infants, children and adolescents." Cmaj 168(1): 59-63. Zlotkin, S. (2004). "A new approach to control of anemia in "at risk" infants and children around
the world. 2004 Ryley-Jeffs memorial lecture." Can J Diet Pract Res 65(3): 136-8. Zlotkin, S., K. Y. Antwi, et al. (2003). "Use of microencapsulated iron(II) fumarate sprinkles to
prevent recurrence of anaemia in infants and young children at high risk." Bull World Health Organ 81(2): 108-15.
Zlotkin, S., P. Arthur, et al. (2001). "Treatment of anemia with microencapsulated ferrous
fumarate plus ascorbic acid supplied as sprinkles to complementary (weaning) foods." Am J Clin Nutr 74(6): 791-5.

106
Zlotkin, S., P. Arthur, et al. (2003). "Home-fortification with iron and zinc sprinkles or iron
sprinkles alone successfully treats anemia in infants and young children." J Nutr 133(4): 1075-80.
Zlotkin, S. H., A. L. Christofides, et al. (2004). "Controlling iron deficiency anemia through the
use of home-fortified complementary foods." Indian J Pediatr 71(11): 1015-9. Zlotkin, S. H., C. Schauer, et al. (2005). "Micronutrient sprinkles to control childhood anaemia."
PLoS Med 2(1): e1. Zlotkin, S. H., C. Schauer, et al. (2006). "Demonstrating zinc and iron bioavailability from
intrinsically labeled microencapsulated ferrous fumarate and zinc gluconate Sprinkles in young children." J Nutr 136(4): 920-5.
Zlotkin, S. H. and M. Tondeur (2007). Successful approaches: Sprinkles. Basel, Sight and Lifes
Press.

Appendix A
Baseline Questionnaires
107

Restricted: Only for research purpose
Research and Evaluation Division, BRAC Sprinkles with/without Calcium Intervention Study
Form A-1: CONSENT FORM
INFORMED CONSENT
Assallamo Alikum/Adab, I am .....................................................................a staff of BRAC. At the present moment, BRAC is conducting an intervention study in your locality to treat infants who are suffering from both iron deficiency anemia and calcium deficiency. It is known that the number of infants (between the ages of 6-11 months) suffering from iron deficiency anemia and calcium deficiency is very high in Bangladesh when compared to other countries. These disorders can cause mortality and problems with bone growth if not treated. To reduce these problems, BRAC has taken the initiative to help solve them through our Sprinkles with and without calcium study. With your permission, we will need some information on your family’s social, deomgraphic, and economic conditions. We will also place your infant in one of two study groups that will be receiving nutrient packets with or without calcium for 2 months. Both nutrient packets will contain iron, which is believed to compete for absorption with calcium. However, we believe this interaction will not occur in children who are deficient in both nutrients. The risk of any negative nutrient-nutrient interaction is very small and we will be conducting weekly health visits to check on your child’s wellbeing. If any problem is noticed, the child will immediately be taken out of the study and treated at a health care facility. Lastly, we will be giving your child a finger prick to collect a small amount of his/her blood. This is a safe and hygenic procedure that uses a Hemocue machine. At the end of the study, each infant involved in the study will receive an additional one month supply of Sprinkles micronutrient packets without calcium. Sprinkles contains many essential nutrients for healthy infant growth that are often missing in Bangladeshi diets. These nutrients include: vitamin A, vitamin C, iron zinc, and folic acid. I assure you that what you say will be kept confidential, anonymization will be employed, and it’s up to you whether you would like to take part in our study. If at any moment you wish to withdraw from the study you are free to do so without any reprucussions. I hope you will participate in this study, if you do agree then I will start.
Do you have any question/enquiry about our study? May I start interviewing? Mother’s Name (Printed) ____________________________________________ Has agreed Has not agreed Signature or Thumb Print of Mother: _________________________ Please contact Dr. Jalal from BRAC if you have any questions or concerns: Contact Phone Number: 01714091488
2 1
Form A-1: Consent Form 108

Form A-2: Recruitment 109
Restricted: Only for research purpose
Research and Evaluation Division, BRAC
Sprinkles with/without Calcium Intervention Study
Form A-2: RECRUITMENT Section A: Identification Column 1: Question Column 2: Data Entry A1. Infant ID number Number:
Boy
A2. Infant gender
Girl
A3. Infant date of birth
(dd/mm/yy): / /
A4. Mother’s name: ______________ . A5. Husband’s name: _______________. A6. Date of survey:
(dd/mm/yy): / /
A7. Start time of survey (24 hours time)
Hr: Minute:
A8. Interviewer name and code:__________________________
Code
A9. Signature of supervisor (sign if this questionnaire is correctly fulfilled)
Section B. Physical Examination Column 1: Question Column 2: Data Entry B1. Measure and record the weight of the mother in kilograms (First Measurement) Weight . kg
B2. Measure and record the weight of the mother in kilograms (Second Measurement) Weight . kg
B3. Measure and record the height of the mother in centimeters (First Measurement) Height . cm
B4. Measure and record the height of the mother in centimeters (Second Measurement) Height . cm
Form A-2: Recruitment 110
Restricted: Only for research purpose
B5. Measure and record the weight of the mother and infant in kilograms (First Measurement) Weight . kg
B6. Measure and record the weight of the mother and infant in kilograms (Second Measurement) Weight . kg
B7. Measure and record the height of the infant in centimeters (First Measurement) Height . cm
B8. Measure and record the height of the infant in centimeters (Second Measurement) Height . cm
B9. Record the machine number on the Hemocue instrument
Number: B10. Record the infant’s Hemoglobin (Hb) concentration in g/L
Hb: g/L
Yes Include the infant as an eligble child
B11. Is the infant’s Hemoglobin (Hb) >70g/L?
No Exclude the infants, refer to local health centre
Yes Exclude the infant, stop the survey
B12. Is the Infants Hemoglobin (Hb) >100g/L?
No Include the infant as an eligble child
Section C: Inclusion Criteria
Please go over the attached informed consent form with the infant’s mother. Explain the study objectives, all the activities she needs to be engaged in, benefits and potential harmful effects as described on the form to understand if she has consented to take part in the study. If she consents, ask her to put her thumbprint and/or to sign the attached consent form.
Column 1: Question Column 2: Data Entry
Yes 1 C1. Did the mother sign and/or give her thumbprint on the consent form (see Form A-2)? If “Yes”, include the infant, if No, then stop the interview No 2
Yes 1 C2. Is your child between the ages of 6-11 months? If “No”, exclude the infant and stop the interview
No 2
Yes 1 C3. Does your child currently receive any medical treatment or have any hospital visits for any major or chronic illness? Please see Section D, Page 3 for a list of chronic illness criteria. If “Yes”, exclude the infant and stop the interview
No 2
Yes 1 C4. Has your child had any iron or calcium supplements within the past 2 weeks? If “Yes”, exclude the infant and stop the interview No 2

Form A-2: Recruitment 111
Restricted: Only for research purpose
Yes 1 C5. Does your child receive at least one complementary food in addition to breast milk? If “No”, exclude the infant and stop the interview No 2
Yes 1 C6. Do you and your family currently live in this area? If “No”, exclude the infant and stop the interview
No 2 Section D: List of Chronic Illnesses
Yes 1 D1. Has your child been coughing frequently and aggressively for 3 or more weeks? If “Yes”, exclude the infant and stop the interview No 2
Yes 1 D2. Has your child had chronic diarrhea for the past 7 or more days? If “Yes”, exclude the infant and stop the interview
No 2
Yes 1 D3. Does your child have mucous or blood in his/her stool? If “Yes”, exclude the infant and stop the interview
No 2
Yes 1 D4. Has your child had a fever for 10 or more days? If “Yes”, exclude the infant and stop the interview
No 2
Yes 1 D5. Has your child had fever with convulsions 3 or more times from birth until the present day? If “Yes”, exclude the infant and stop the interview No 2
Yes 1 D6. Does your child have any skin infections such as itching, white spots, blisters that have been present for 15 or more days? If “Yes”, exclude the infant and stop the interview No 2
Yes 1 D7 Does the child have a puffy face or eyes, or increased abdominal size? If “Yes”, exclude the infant and stop the interview No 2
Yes 1 D8. Has your child lost his/her appetite for 7 or more days? If “Yes”, exclude the infant and stop the interview
No 2
End the interview – Please thank the respondent

Form B-1: Sociodemographic and Economic Conditions 112
Restricted: Only for research purpose
Research and Evaluation Division, BRAC
Sprinkles with/without Calcium Intervention Study
Form B-1: Sociodemographic and Economic Conditions Section A: Identification Column 1: Question Column 2: Data Entry A1. Infant ID number Number:
A2. Mother’s name: ______________ . A3. Husband’s name: _______________. A4. Date of survey:
(dd/mm/yy): / /
A5. Start time of survey (24 hours time)
Hr: Minute:
A6. Interviewer name and code:__________________________
Code:
A7. Signature of supervisor (Sign if this questionnaire is correctly fulfilled)
Section B: Social and Economic Condition
Column 1: Question Column 2: Data Entry
B1. How many live children do you have?
B2. What is the birth order of this child?
B3. How many people including all children share food from your kitchen regularly?
B4. In what year were you born?
(if date is not available then ask for closest year estimate)
(dd/mm/yy): / /
B5. According to the date of birth, determine and record current age
Age (years):
B6. What is your level of education?
Cannot sign name (1)

Form B-1: Sociodemographic and Economic Conditions 113
Restricted: Only for research purpose
Can only sign name (2)
Completed academic year of schooling (in years)
Years:
B7. How many regular members have you had in your household in the past 6 months?
Number:
B8. Among them, how many earning members do you have? Number:
Agriculture 1
Business 2
Unskilled day labour 3
Skilled day labour 4
Fishing/Pottery/Weaving 5
B9. What is the main source of income for the household?
Other 6
Always deficit 1
Occasional deficit 2
Balanced 3
Better 4
B10. How would you describe the relationship between income and expenditure in your household in the last one year?
Surplus 5
Less than half 1
About half 2
More than half 3
Almost all 4
B11. How much of your household expenditures go toward spending on food?
Don’t know 5
Yes 1 B12. Do you own a house? No 2
B13. What is the area of your house (in feet)? Length _________ Width _______ B14. How much does your household own in cultivable land?
(In decimal) No land=0000
Yes 1 B15. Does your house have electricity?
No 2 B16. Does your household own any of the following? Can be Radio 1

Form B-1: Sociodemographic and Economic Conditions 114
Restricted: Only for research purpose
TV 2
Telephone 3
Mobile phone 4
Khat/chawki 5
Almirah 6
Table/chair 7
Watch 8
Bicycle 9
Motorcycle/scooter/tempo 10
Animal drawn cart 11
Car/truck 12
Boat with motor 13
multiple answers
Rickshaw/van 14
Piped into dwelling 1
Piped to yard/plot 2
Public tap/stand pipe 3
Tube well or borehole 4
Protected spring water 5
Unprotected spring water 6
Rain water, tanker truck 7
Rain water, small tank 8
Surface water 9
Bottled water 10
B17. What is the main source of drinking water for members of your household?
Other 11
Yes 1
No 2
B18. Do you do anything to the water to make it safe to drink? If “No” or “Don’t know,” skip question B19
Don’t know 3
Boil 1
Add bleach/chlorine/use purify tablet
2
Strain through a cloth 3
B19. What do you usually do to make the water safer to drink? Can be multiple answers
Use water filter 4

Form B-1: Sociodemographic and Economic Conditions 115
Restricted: Only for research purpose
Let it stand and settle 5
Other 6
Don’t know 7
End the interview – Please thank the respondent

Restricted: Only for research purpose
Research and Evaluation Division, BRAC Sprinkles with/without Calcium Intervention Study
Form B-2: 24-Hour Recall Questionnaire Section A: Identification Column 1: Question Column 2: Data Entry A1. Infant ID number Number:
A2. Mother’s name: ______________ A3. Husband’s name: ________________________ A4. Date of survey:
(dd/mm/yy): / /
A5. Start time of survey (24 hours time)
Hr: Minute:
A6. Interviewer name and code : __________________________
Code:
A7. Signature of supervisor (Sign if this questionnaire is correctly fulfilled)
Section B: 24-Hour Dietary Recall
Last 24 hour
Sl no
Time
Types of food (Cooked/ Raw)
Ingredients
Family Measurement/
weight
Amount (gm)
Food code
1 Morning =
1
2
3
4
5
Form B-2: 24-Hour Recall Questionnaire
116

Restricted: Only for research purpose
6
7
8
9
10 11 Mid
morning =
2
12
13 14
15
16
17
18
19
20 21 Lunch = 3 22
23
24
25
26
27
Form B-2: 24-Hour Recall Questionnaire
117

Restricted: Only for research purpose
28 29 30
31 Evening =
4
32 33 34
35
36 37 38 39 40 41 Night = 5 42
43
44
45
46 47 48 49 50
Supplemental Questions 51. Does your child take any supplements? Yes or No
Form B-2: 24-Hour Recall Questionnaire
118

Form B-2: 24-Hour Recall Questionnaire
119
Restricted: Only for research purpose
52. If yes, list the supplements taken by the child? ______________________________________________________________________________ Babiz = 1, Codlivit (100 ml) = 2, Filwel Kids = 3, Babycare = 4 53. Was this a usual day? Yes or No
End the interview – Please thank the respondent

Form B-3: Food Frequency Questionnaire 120
Restricted: Only for research purpose
Research and Evaluation Division, BRAC Sprinkles with/without Calcium Intervention Study
Form B-3: Food Frequency Questionnaire
Section A: Identification Column 1: Question Column 2: Data Entry A1. Infant ID number Number:
A2. Mother’s name: ______________ A3. Husband’s name: __________________________ A4. Date of survey:
(dd/mm/yy): / /
A5. Start time of survey (24 hours time)
Hr: Minute:
A6. Interviewer name and code: ____________________________
Code
A7. Signature of supervisor (Sign if this questionnaire is correctly fulfilled)
Section B: Food Frequency Questionnaire For each food item indicate with a checkmark the category that best describes the frequency with which you usually eat that particular food item Food code
Types of food / variety
Food item Never = 1
Twice per month or less = 2
Once or twice per week = 3
3-4 times per week = 4
More than five times per week = 5
Once per day = 6
More than once per day = 7
Barley (Whole)
Maize (Mature)
Maize (Immature)
Starch (Staple food)/ Cereal = 1
Rice (Fried paddy)

Form B-3: Food Frequency Questionnaire 121
Restricted: Only for research purpose
Rice Parboiled (Husked)
Rice Parboiled (Milled)
Rice Sunned (Husked)
Rice Sunned (Milled)-
Rice (Flattened)
Rice (Puffed)
Semolina Sago
Vermicelli Wheat
(Whole)
Wheat Flour (Coarse)
Wheat Flour (Refined)
Other (Please Specify)
Bean(Field) Bengal
Gram (Whole)
Bengal Gram (Split)
Bengal Gram (Fried)
Black Gram (Split)
Green Gram (Whole)
Green Gram (Split)
Khesari dal
Bean or peas and nut/ Pulses = 2
Lentils

Form B-3: Food Frequency Questionnaire 122
Restricted: Only for research purpose
Peas Dried/split
Peas Fried Red Gram 213 Soya bean 1411 Jack fruit
seed
Others (Please specify)
Agathi Amaranth
(Data) leaves
Amaranth leaves (Tender)
Amaranth (Red leaf var.)
Amaranth (Spiney)
Bathua leaves
Beet leaves Bottle gourd
leaves
Cabbage Carrot
leaves
Cauliflower leaves
Celery leaves
Chukai leaves
Coriander leaves
Cowpea leaves
Drumstick leaves
Fenugreek leaves
Deep colored leafy vegetables = 3
Folwal leaves

Form B-3: Food Frequency Questionnaire 123
Restricted: Only for research purpose
Gram leaves Helencha
leaves
Indian spinach
Jute plant tops
Kheshari leaves
Kolmeee leaves
Lettuce Mesta
leaves
Mustard leaves
Neem leaves (Green)
Potato leaves
Mint leaves Pumpkin
leaves
Punornova leaves
Radish leaves
Safflower leaves
Soyabean leaves
Spinach Sweet
potato leaves
Tamarind leaves
Taro/Black arum leaves
Taro/ Green arum leaves
Thankuni leaves
Turnip leaves
Others (Please
Form B-3: Food Frequency Questionnaire 124
Restricted: Only for research purpose
specify) Beet root Carrot Garlic Ole Kopi Onion Potato Radish Sweet
potato
Taro /Arum Taro/ Arum
tubers
Turnip Yam
(Elephant)
Others (Please specify)
Roots & Tubers = 4
Amaranth
(Data) stem
Aubergine/Eggplant
Bean Bean
(Immature)
Bean (Red) Cabbage
Cauliflower Chili
(Green)
Cowpea Cucumber
Drumstick
Other vegetables = 5
Drumstick flower
Fig (Red)
Folwal

Form B-3: Food Frequency Questionnaire 125
Restricted: Only for research purpose
Gourd (Ash)
Gourd (Bitter)
Gourd (Bottle)
Gourd (Ridge)
Gourd (Small bitter)
Gourd (Snake)
Gourd (Sweet) / Pumpkin)
Gram (Red, unripe)
Jack fruit (Immature)
Kakrol Kolmee Lady’s
finger
Green mango
Marrow Onion &
garlic stalk
Papaya (Green Immature)
Peas (Green)
Plantain Plantain
flower
Plantain stem
Pumpkin flower
Spinach stalks
Tomato (Green)
Water lily stem (Red)
Water lily stem

Form B-3: Food Frequency Questionnaire 126
Restricted: Only for research purpose
(White) Yam stem Others
(Please specify)
Ground
nut/Pea nut
Ground nut /Pea nut (Fried)
Mustard Sunflower
seeds
Sesame
Dried Coconut
Wet Coconut
Others (Please specify)
Oil seeds = 6
Chili, Red
(Dry)
Coriander seed
Ginger Mixed
spices (Hot)
Turmeric Others
(Please specify)
Spices & condiments = 7
Hog plum Apple Bakul
Flower
Banana
Fruits = 8
Blackberry (Indian)

Form B-3: Food Frequency Questionnaire 127
Restricted: Only for research purpose
Boroi (Bitter plum)
Custard apple
Coconut milk
Dates Dates (Dry) Fig (Ripe) Guava Grapes Jackfruit
(Ripe)
Kheera Kodobele
(Ripe)
Lemon Lichis Lime Lime
(Sweet)
Mango (Ripe)
Melon Olive
(Wild)
Orange Orange Palm
(Green)
Palm (Ripe) Papaya
(Ripe)
Pears Pineapple Pomegranat
e juice
Pomegranate
Pommelo (Red)
Rose apple Tamarind
(Immature)
Tamarind (Pulp)
Tomato

Form B-3: Food Frequency Questionnaire 128
Restricted: Only for research purpose
(Ripe) Wood apple Watermelon Others
(Please specify)
Aire Bacha Bata Bele Betrongi Bhangon
(Fresh)
Bhangon (Dried)
Bhetki (Fresh)
Bhetki (Dried)
Boal Black fish Boicha Bream (Sea,
fresh)
Bream (Dried)
Butter fish Carp Cat fish Chapila
(Fresh)
Chapila (Dried)
Climbing fish
Crabs Dragon fish Eel fish Fesha
(Fresh)
Fish = 9
Fesha (Dried)

Form B-3: Food Frequency Questionnaire 129
Restricted: Only for research purpose
Fishmeal Flat fish Folui Fry Gura fish Hilsha fish Hilsha
(Salted)
Khalshe fish Lota fish Magur Mola fish Mrigal Pata fish Pomfret
(Black)
Pomfret (White)
Pomfret (Small)
Prawns Whole (Dried)
Ribon fish Ribon fish
(Dried)
Rohu Salmon fish Sarputi Scorpion
fish
Shrimp Silver fish Sole Tapse
(Dried)
Tengra (Fresh)
Tengra (Dried)
Others (Please

Form B-3: Food Frequency Questionnaire 130
Restricted: Only for research purpose
specify) Beef Beef
(Buffalo)
Chicken Duck
Meat = 10
Goat Liver (Goat)
Liver (Mutton)
Mutton (Lamb)
Pigeon Pork Turtle Others
(Please specify)
Duck egg Hen egg
Egg = 11
Buffalo
milk solids
Butter milk Cheese Cows milk
solids
Curd Human
Breast Milk
Milk (Condensed)
Powdered milk (Skim, cow)
Dairy = 12
Powdered milk (Whole,

Form B-3: Food Frequency Questionnaire 131
Restricted: Only for research purpose
cow) Skim milk
(Liquid)
Whole milk (Cow)
Whole milk (Goat)
Whole milk (Buffalo)
Yogurt (Cow)
Yogurt (Buffalo)
Others (Please specify)
Bread
(Brown)
Bread (Loaf)
Date juice
Other miscellaneous item = 13
Pappadom Pickles Pumpkin
seed
Molasses (Date)
Others (Please specify)
Artificial
fruit Juice
Artificial flavored drinks (Vitamin C enrich)
Chocó milk Chocolate Fruit juice
Liquid/ Fluid = 14
Sweet syrup

Form B-3: Food Frequency Questionnaire 132
Restricted: Only for research purpose
Sugar water Soft drink
(Cola)
Soft drink (Lemonade)
Tea Others
(Please specify)
Cerelac
Commercial-ly produced Cereals, Infant formulas, or Drinks =15
Biomil, Infamil, etc…
Complan Horlics Moltova or
Boost
Enter other food item that are usually consumed by your child:
Food code
Food item
Never Twice per month or less
Once or twice per week
3-4 times per week
More than five times per week
Once per day
More than once per day
1.
2.
3.
4.
5.
Never [1]; Twice per month or less [2]; Once or twice per week [3]; 3-4 times per week [4]; More than five times per week [5]; Once per day [6]; More than once per day [7];
End the interview – Please thank the respondent

Form B-4: Breastfeeding Practices 133
Restricted: Only for research purpose
Research and Evaluation Division, BRAC Sprinkles with/without Calcium Intervention Study
Form B-4: Breastfeeding Practices
Section A: Identification Column 1: Question Column 2: Data Entry A1. Infant ID number Number:
A2. Mother’s name: ______________ A3. Husband’s name: _______________ A4. Date of survey:
(dd/mm/yy): / /
A5. Start time of survey (24 hours time)
Hr: Minute:
A6. Interviewer name and code:__________________________
Code
A7. Signature of supervisor (Sign if this questionnaire is correctly fulfilled)
Section B: Breastfeeding Practices
Column 1: Question Column 2: Data Entry
Yes 1 B1. Has your child ever been breastfed?
No 2
Instantly 1
Hours
Days
B2. How long after birth did you first put your child to the
breast?
Months
Yes 1 B3. Did you give colostrum to your child?
No 2

Form B-4: Breastfeeding Practices 134
Restricted: Only for research purpose
Yes
1
B4. Did you give any food/drink to your child before the first breastmilk/colostrum?
No 2 B5. How many months did you exclusively breastfeed your child? I mean not giving him/her anything else, not even plain water, other than breastmilk
B6. At what age (in months) did you first give your child rice, wheat, meat, fish, or eggs?
B7. At what age (in months) did you give your child any other thing in addition to breastmilk?
Yes 1
No 2
B8. Was your child breastfed yesterday (either during the day or night)?
Don’t know 3
B9. How many times have you given your child complementary food yesterday?
Yes 1 B10. Is your child currently breastfeeding? If “No,” skip to question B12
No 2 B11. How often do you breastfeed your child per day?
B12. How many months did you give breastmilk? Enter 00 if still breastfeeding.
End the interview – Please thank the respondent

Appendix B
Morbidity, Monitoring, and Compliance Forms
135

Restricted: Only for research purpose
Form C-1: Monitoring, Compliance, and Morbidity 136
Research and Evaluation Division, BRAC Sprinkles with/without Calcium Intervention Study
Form C-1: MONITORING, MOBRIDITY, & COMPLIANCE
Section A: Identification Column 1: Question Column 2: Data Entry A1. Infant ID Number Number:
A2. Visit week (1, 2, 3, 4, 5, 6, 7, 8)
A3. Date of Survey:
(dd/mm/yy): / /
A4. Interviewer Name and code:__________________________
Code:
A5. Signature of Supervisor (Sign if this questionnaire is correctly fulfilled)
Section B. Infant Morbidity Column 1: Question Column 2: Data Entry
Yes 1 B1. Since last the 7 days has your child been suffering from any health problem? No 2
B2. If the answer to B1 is “Yes”, fill out the information below, otherwise go to Section D.
None: 0 episodes per week 1
Mild: two or less episodes per week 2
Moderate: 3-4 episodes per week 3
Severe: 5 or more episodes per week 4 None 1
Mild 2
Moderate 3
B3a. Fever
Severe 4
None 1 Mild 2 Moderate 3
B3b. Illness with cough
Severe 4

Form C-1: Monitoring, Compliance, and Morbidity 137
Restricted: Only for research purpose
None
1
Mild 2 Moderate 3
B3c. Difficulty breathing
Severe 4 None 1 Mild 2 Moderate 3
B3d. Nausea
Severe 4 None 1 Mild 2 Moderate 3
B3e. Vomiting
Severe 4 None 1 Mild 2 Moderate 3
B3f. Loose motion
Severe 4 None 1 Mild 2 Moderate 3
B3g. Constipation
Severe 4 None 1 Mild 2 Moderate 3
B3h. Black stool
Severe 4 None 1 Mild 2 Moderate 3
B3i. Lack of appetite
Severe 4 Section C. Side Effects Column 1: Question Column 2: Data Entry
Not at all 1
1 Hour or less 2
2 to 3 hours 3
4 to 6 hours 4
C1. In the last 12 hours, how long has your child felt nauseated or sick to his/her stomach?
7 hours or more 5
Did not throw up 1
1-2 times 2
3-4 times 3
C2. In the last 12 hours, how many times has your infant vomited?
5-6 times 4

Form C-1: Monitoring, Compliance, and Morbidity 138
Restricted: Only for research purpose
7 hours or more 5
No times 1
1-2 times 2
3-4 times 3
5-6 times 4
C3. In the last 12 hours, how many times has your infant had retching or dry heaves without bringing anything up?
7 hours or more 5
Liquid stools 1
Partly liquid 2
Normal 3
Partly constipated 4
Constipated 5
C4. In the last 12 hours, what was the consistency of your child’s stools?
Not applicable 6
Normal 1
Somewhat dark 2
Light brown 3
Dark brown 4
Black 5
C5. In the last 12 hours, what was the color of your child’s stool?
Not applicable 6
Section D. Compliance
Yes 1 D1. Is the infant’s family still residing in the village?
No 2
Yes 1 D2. Have you been feeding your child Sprinkles with their food? If the answer was “Yes,” then skip question D3. No 2
Child developed Fever
1
Child would vomit/nausea
2
Child developed loose bowel movement
3
Child developed loss of appetite
4
D3. Why did you not give your child Sprinkles with their food?
Other health reason
5

Restricted: Only for research purpose
Form C-1: Monitoring, Compliance, and Morbidity 139
Other non-health reason
6
D4. Count the number of unused “Sprinkles” sachets and record
Number:
D5. How many “Sprinkles” sachets has your infant consumed since the last visit?
Number:
Yes 1 D6. Have you shared or given away any “Sprinkles” sachets?
No 2 D7. If the answer to D3 was “Yes,” then record how many were given away or shared
Number:
D8. Today how many sachets have you given your infant? (As a total it should be 1 in number)
End the interview – Please thank the respondent

Appendix C
Self-Coaching Material
140

141

: p
i. m :
k
p 1
p 2
p 3
p 4
142

143
:
d
i. m :
k
p 5
p 6
p 7
p 8

144
Appendix D
End-line Questionnaires

Restricted: Only for research purpose
Research and Evaluation Division, BRAC Sprinkles with/without Calcium Intervention Study
Form D-1: Hemoglobin Measurement
Section A: Identification Column 1: Question Column 2: Data Entry
A1. Infant ID number Number:
A2. Mother’s name: ______________ A3. Husband’s name: __________ A4. Date of survey:
(dd/mm/yy): / /
A5. Start time of survey (24 hours time)
Hr: Minute:
A6. Interviewer name and code: ______________________________
Code:
A7. Signature of supervisor (Sign if this questionnaire is correctly fulfilled)
Section B. BLOOD SAMPLE
Finger prick the child Put one drop of blood on a glass slide Measure Hemoglobin by HemoCue Fill in the information below
B1. Record the machine number on the Hemocue instrument
Number:
B2. Record the infant’s Hemoglobin (Hb) concentration in g/L
Hb: g/L
End the interview – Please thank the respondent
Form D-1: Hemoglobin Measurement
145

Form D-2: Endline 146
Restricted: Only for research purpose
Research and Evaluation Division, BRAC
Sprinkles with/without Calcium Intervention Study
Form D-2: ENDLINE Section A: Identification Column 1: Question Column 2: Data Entry A1. Infant ID number Number:
Boy = 1 A2. Infant gender
Girl = 2 A3. Infant date of birth:
(dd/mm/yy): / /
A4. Mother’s Name: ______________ . A5. Husband’s Name: _______________. A6. Date of Survey:
(dd/mm/yy): / /
A7. Start Time of Survey (24 hours time)
Hr: Minute:
A8. Interviewer Name and code:__________________________
Code
A9. Signature of Supervisor (Sign if this questionnaire is correctly fulfilled)
Section B. Physical Examination
Column 1: Question Column 2: Data Entry B1. Measure and record the weight of the mother in kilograms (First Measurement) Weight . kg
B2. Measure and record the weight of the mother in kilograms (Second Measurement) Weight . kg
B3. Measure and record the weight of the mother and infant in kilograms (First Measurement) Weight . kg
B4. Measure and record the weight of the mother and infant in kilograms (Second Measurement) Weight . kg
B5. Measure and record the height of the infant in centimeters (First Measurement) Height . cm
B6. Measure and record the height of the infant in centimeters (Second Measurement) Height . cm