controller design for gating traffic control in presence
TRANSCRIPT

Transportation Research Procedia 7 ( 2015 ) 651 – 668
2352-1465 © 2015 The Authors. Published by Elsevier B.V. This is an open access article under the CC BY-NC-ND license (http://creativecommons.org/licenses/by-nc-nd/4.0/).Selection and peer-review under responsibility of Kobe Universitydoi: 10.1016/j.trpro.2015.06.034
Available online at www.sciencedirect.com
ScienceDirect
21st International Symposium on Transportation and Traffic Theory, ISTTT21 2015, 5-7 August 2015, Kobe, Japan
Controller Design for Gating Traffic Control in Presence of Time-Delay in Urban Road Networks
Mehdi Keyvan-Ekbatania0F0F0F0F*, Markos Papageorgioub, Victor L. Knoopa
a Department of Transport and Planning, Faculty of Civil Engineering and Geosciences, Delft University of Technology, Delft, 2600 GA, The Netherlands
bDynamic Systems and Simulation Laboratory, School of Production Engineering and Management, Technical University of Crete, Technical University Campus, Chania, 73100, Greece
Abstract
Recent studies demonstrated the efficiency of feedback-based gating control in mitigating congestion in urban networks by exploiting the notion of macroscopic or network fundamental diagram (MFD or NFD). The employed feedback regulator of proportional-integral(PI)-type targets an operating NFD point of maximum throughput to enhance the mobility in the urban road network during the peak period, under saturated traffic conditions. In previous studies, gating was applied directly at the border of the protected network (PN), i.e. the network part to be protected from over-saturation. In this work, the recently developed feedback-based gating concept is applied at junctions located further upstream of the PN. This induces a time-delay, which corresponds to the travel time needed for gated vehicles to approach the PN. The resulting extended feedback control problem can be also tackled by use of a PI-type regulator, albeit with different gain values compared to the case without time-delay. Detailed procedures regarding the appropriate design of related feedback regulators are provided. In addition, the developed concepts are also exploited to test and compare (for the first time in the related technical literature) the impact of increased sample times on the gating performance. A large part of the Chania, Greece, urban network, modelled in a microscopic simulation environment under realistic traffic conditions, is used as test-bed in this study. The reported results demonstrate a stable and efficient behaviour and improved mobility of the overall network in terms of mean speed and travel time. © 2015 The Authors. Published by Elsevier B.V. Peer-review under responsibility of the Scientific Committee of ISTTT21.
Keywords: Over-saturated urban networks; network fundamental diagram (NFD); time-delayed feedback gating control
* Corresponding author. Tel: +31 (15) 27 86302.
E-mail address: [email protected]
© 2015 The Authors. Published by Elsevier B.V. This is an open access article under the CC BY-NC-ND license (http://creativecommons.org/licenses/by-nc-nd/4.0/).Selection and peer-review under responsibility of Kobe University

652 Mehdi Keyvan-Ekbatani et al. / Transportation Research Procedia 7 ( 2015 ) 651 – 668
1. Introduction
The notoriously increasing economic and social activity and increasing number of vehicles in metropolitan areas result, on a daily basis, in over-saturated and highly congested traffic conditions at some network parts during the peak periods. The network service quality is deteriorated drastically, and the average travel times are raised accordingly. Provision of new infrastructure is not deemed to be a sustainable solution. Thus, the efficient utilization of the existing infrastructure is a crucial ingredient towards sustainable urban mobility. Traffic management is an efficient tool for enhanced capacity and improved mobility network-wide. Up to now, numerous valuable studies have been carried out in the field of urban traffic control (UTC). However, despite a number of achievements, the negative effects of congested traffic networks, such as excessive delays, environmental impact and reduced safety, persist or even increase; hence, introducing improved traffic signal control methods and techniques continues to be a vital issue.
Many different real-time UTC strategies have been proposed up to now, but due to the reduced efficiency of the strategies (e.g. SCOOT (Hunt et al., 1982) and SCATS (Lowrie, 1982)) in saturated traffic conditions, there is still space for further developments. Some other recently proposed UTC concepts employ computationally expensive algorithms, which might render the network-wide implementation of these optimization-based approaches difficult in terms of real-time feasibility; see e.g. Lo et al., 2001, for genetic algorithm application; and Putha et al., 2010, for colony optimization applications. TUC (Diakaki et al., 2002) is a noteworthy and practicable UTC strategy for saturated traffic conditions; see also (Aboudolas et al., 2010). Chang and Sun (2004) used a bang-bang like concept for control of an urban network with oversaturated intersections. However, these methods may allow the traffic to enter into the network part to be protected from over-saturation and act after the congestion starts occurring; hence, the methods should be specifically tested for highly congested urban road network parts.
Gating or metering is a practical tool, frequently employed against over-saturation of significant or sensitive links, arterials or urban network parts (Wood et al., 2002; Bretherton et al., 2003; Luk and Green, 2010). The idea is to hold traffic back (via prolonged red phases at traffic signals) upstream of the links to be protected from over-saturation, whereby the level or duration of gating may depend on real-time measurements from the protected links. Gal-Tzur et al. (1993) proposed a strategy which employs the concept of metering for small congested networks with one critical intersection. Gating is usually employed in an ad hoc way (based on engineering judgment) regarding the specific gating policy and quantitative details, which may lead to insufficient or unnecessarily strong gating actions.
Recently, the reproducible relationship between flow and density occurring at the network level under certain conditions (e.g. homogeneous spatial distribution of the congestion), known as network fundamental diagram (NFD), has gained increased popularity. The notion had been initially proposed by Godfrey (1969); see (Gartner and Wagner, 2004) for simulation-based experiments; (Geroliminis and Daganzo, 2008) for real data based investigations; (Daganzo and Geroliminis, 2008; Farhi, 2008; Helbing, 2009) for analytical treatments. Other interesting studies related to network level relations for simulated and real networks can be found in (Buisson and Ladier, 2009; Ji et al., 2010; Gayah and Daganzo, 2011; Knoop et al., 2013). Keyvan-Ekbatani et al. (2015) showed that production and variance of accumulation in the network are inversely correlated. This means a smart demand distribution may address the variability of link densities to keep the network production at a higher level. Gayah and Gao (2014) showed that in an extremely congested network adaptive traffic signals might have little to no effect on the network or NFD due to downstream congestion and queue spillbacks. Hence, under this traffic conditions, other strategies should be used to mitigate the instability, such as gating (or perimeter) control or adaptively re-routing drivers to avoid locally congested regions. Although the NFD notion is still under investigation in various aspects, it can be exploited as a fruitful basis for derivation of urban signal control approaches. In particular, NFD is useful to introduce elegant perimeter traffic signal control strategies, as details of individual links are not needed to describe the congestion level and its evolution.
Daganzo (2007) used the NFD concept to propose a control rule that maximizes the network outflow; however, the proposed rule cannot be directly employed for practical use in urban networks. Based on the NFD, Zhang et al. (2010) developed a bang-bang control strategy to optimize the accumulated vehicular number. Other works (Strating, 2010; Geroliminis et al., 2012) pursued a model-predictive control (MPC) approach. However, MPC calls for sufficiently accurate model and external disturbance predictions, which may be a serious impediment for practicable control. Lia et al. (2012) introduced a fixed-time signal timing perimeter control by exploiting the NFD, albeit

653 Mehdi Keyvan-Ekbatani et al. / Transportation Research Procedia 7 ( 2015 ) 651 – 668
without adaptation to the prevailing real-time traffic conditions. Keyvan-Ekbatani et al. (2012) proposed a generic real-time feedback-based gating concept, which exploits the urban NFD for smooth and efficient traffic control operations, with an application to the network of Chania, Greece. Knoop et al. (2012) and Yildirimoglu et al. (2015) exploited the NFD notion for route guidance. Keyvan-Ekbatani et al. (2013a) demonstrated that efficient feedback-based gating is actually possible with much less real-time measurements, i.e. at much lower implementation cost, than in full network instrumentation. Given that in large metropolitan urban networks the congestion spreads mostly heterogeneously over the network, in which case a homogenous gating strategy may not be the optimal solution, Keyvan-Ekbatani et al. (2013b) proposed a multiple concentric-boundary gating strategy, which implements the aforementioned feedback-based gating strategy, along with considering the heterogeneity of a large-scale urban network. Aboudolas and Geroliminis (2013) extended the basic feedback approach for application to multiple sub-networks with separate individual NFDs in a heterogeneous urban network. Geroliminis et al. (2014) introduced a three-dimensional NFD relating the accumulation of cars and buses with the total circulating flow in the network. They addressed that this finding may be applied for a perimeter flow control concept which maximizes the network capacity of vehicles or the passenger capacity in bi-modal urban networks. Aboudolas et al. (2014) proposed a proportional controller for a perimeter control strategy by exploiting the 3D-NFD concept. This control strategy might be beneficial by combining the 3D-NFD with the idea of reduced NFD (i.e. using few real-time measurements) which is thoroughly discussed in (Keyvan-Ekbatani et al., 2013a). Haddad and Shraiber (2014) designed a robust perimeter control considering uncertainties in NFD-based dynamics (e.g. the NFD scatter) systematically.
In all of the aforementioned gating strategies, metering is applied at the border of the protected network (PN). Due to restrictions which might be faced for implementing gating control at the perimeter of the PN in different urban networks, such as unavailability of proper links to store the gated vehicles (queuing) or sufficient number of signalized junctions and geometric characteristics of the protected network, the traffic flow bound for the PN may have to be (also) metered at some junctions which are remote from the border of the PN. The crucial issue which may arise due to remote gating control is that the traffic system may experience a time-delay because of the travel time needed for gated vehicles to approach the PN (since the gating link is not directly at the PN perimeter).
In this work, we provide explicit rules for the design of a robust proportional-integral(PI)-type feedback controller which tackles the time-delay imposed on the traffic system, attributable to the remote gating location(s). The SISO linear control theory is applied to solve the time-delayed gating control problem resulting in novel, easily applicable and fairly general design rules for practical applications. Detailed procedures regarding the appropriate design of related feedback regulator are provided. Moreover, the developed feedback concept is shown to work properly with very long time-steps as well. A large part of the Chania, Greece, urban network, modeled in a microscopic simulation environment under realistic traffic conditions, is used as test-bed in this study. Significant improvements in terms of overall mean speed and average delay are shown to be achievable.
The specific contributions of this paper are as follows: 1. A data-based approach is proposed, which leads to the identification of a SISO (single-input-single-output)
linear first-order time-delay (ersatz-)model, even in cases with different gating locations, each with a different time-delay.
2. Novel, simple design rules are theoretically and generically derived for ready design of a PI-type regulator for the feedback gating problem (with or without time delays). Note that, to the best of our knowledge, no design rules of this kind are available in the Control Engineering literature.
3. The developed concepts are successfully tested with microscopic simulation. 4. The developed concepts are also exploited to test and compare (for the first time in the related technical
literature) the impact of increased sample times on the gating performance. These contributions open the way for immediate practical applications of the feedback gating concept, without the
need for cumbersome modelling and tuning tasks. The remainder of this paper is organized as follows: Section 2 presents a brief review of the operational NFD and
the gating traffic control strategy. Section 3 discusses the novel procedure of PI controller design for the time-delayed gating strategy. Section 4 describes the test-bed geometry and demand characteristics. The estimated NFD along with the simulation results for the two different control scenarios are demonstrated in section 5. Finally, summary and conclusions are included in the last section.

654 Mehdi Keyvan-Ekbatani et al. / Transportation Research Procedia 7 ( 2015 ) 651 – 668
2. A brief review of NFD and gating concept
2.1. Network fundamental diagram
The reproducible relationship between the number of vehicles inside the network (accumulation or average density) on one hand, and the link-length weighted total traffic flow of the network on the other hand, forms an asymmetric inverse-U shaped diagram (see Fig. 1) that is often called macroscopic fundamental diagram (MFD) (Geroliminis and Daganzo, 2008). For a better distinction of the MFD of highways from the (fundamentally different) MFD of an urban network, we call the latter a network fundamental diagram (NFD). According to the definitions introduced in (Keyvan-Ekbatani et al., 2012), we have: (a) an ideal NFD, if based on exact knowledge of the displayed quantities (this is practically only possible in analytic or simulation-based studies) for all links z , where is the set of all network links; or (b) an operational NFD, if based on available (more or less accurate) measurements and estimates at a subset of all links, i.e. .
In this paper we will only deal with operational NFD. The NFD’s y-axis reflects the Total Travelled Distance (TTD in veh·km per h), while the x-axis reflects the Total Time Spent (TTS in veh·h per h) by all monitored vehicles in the PN. The TTD and TTS are obtained from the (emulated) loop measurements via the following equations:
ˆˆ ˆz
zz z
T N kTTS k N k N k
T (1)
z zz z
z z
T q k LTTD k q k L
T (2)
where z is the link where a measurement is collected; is the set of measurement links; 0,1,2,...k is a discrete time index reflecting corresponding cycles; T is the cycle time; zq is the measured flow in link z during cycle k; zL is the length of link z; N̂ k is the estimated number of vehicles within the links in the set of . TTS is the estimated total time spent, which turns out to equal the estimated number of vehicles in the subset of the links and
ˆzN k is the estimated number of vehicles in link z during cycle k, which is derived from occupancy measurements
via the following equation
ˆ 1100
zz z zN k L o k (3)
Fig. 1 Network Fundamental Diagram (network total weighted flow vs. average density)

655 Mehdi Keyvan-Ekbatani et al. / Transportation Research Procedia 7 ( 2015 ) 651 – 668
where zo k is the measured time-occupancy (in %) in link z during cycle k; z is the number of lanes of link z ; and is the average vehicle length. Eq. (3) is reasonably accurate, particularly if the detector is located around the middle of the link (Vigos and Papageorgiou, 2010).
2.2. Gating concept
The general scheme of gating, including the protected network (PN), is sketched in Fig. 2. To implement gating, the usual traffic lights settings must be modified at (one or more) upstream junctions, which may be located at the border or a bit further of the problematic area. The gating location is shown by double line, upstream of which vehicle queues may grow temporarily faster than without gating; gq is the gated flow, a part of which ( bq ) may not be bound for the protected network (PN); while inq is the part of the gated flow that enters the protected network;
dq represents other (non-gated or internal) inflows to the PN (disturbances); finally outq and N stand for the PN exit flow (both internal and external) and the number of vehicles included in the PN, respectively.
2.3. Gating procedure at the gated junctions
According to Fig. 3, the gating procedure at the gated signalized junctions can be listed as follows: The controller runs in background all the time; is fed with real-time measurements of PN (TTS), averaged
over the last signal cycle; targets a set-point ˆTTS (selected to be inside the critical range of NFD, see the yellow zone in Fig. 1) for maximum throughput; and produces an ordered gated flow gq to be applied in the next signal cycle.
Fig. 3 General gating procedure of a gated junction
Fig. 2 General scheme of gating

656 Mehdi Keyvan-Ekbatani et al. / Transportation Research Procedia 7 ( 2015 ) 651 – 668
A switch-on/off logic decides for the implementation of the ordered flow gq by the controller; Typically, gating is applied only if the measured TTS is in a neighborhood of the set-point ˆTTS .
During the switch-on period, the ordered flow gq is distributed among the gated junctions ( 1,..., nq q ) where n is the number of gated junctions.
The distributed flows are converted into green phases ( g,1 g,,..., ng g ) where g,ig , i=1,…,n, are the gated green times.
During the switch-off period, the ordinary fixed-time plan is implemented ( 1,..., ng g ) where ig are the corresponding green times; and iq are the flows which can be served during these fixed green times.
The traffic state in the protected network (i.e. TTS) is estimated on-line during the whole procedure (real-time monitoring).
3. Feedback-based gating in presence of time- delay
Detailed procedures regarding the appropriate design of feedback regulators for time-delayed traffic systems (e.g. remote gating) are provided in this section as the principle contribution of this paper. The single gating location in Fig. 2 may be an ersatz for multiple gating locations, as in Fig. 5 later on, where only four out of the seven gated junctions are actually remote from the defined protected network. The gated vehicles at remote locations require a travel time to approach the PN. This travel time, imposes a time-delay ( ) in the action of the controller; therefore, this term should be considered in the design of the controller. How to obtain an ersatz model with one single gating location and one corresponding time-delay in cases of multiple real gating locations and corresponding different travel times, also designing a controller in the presence of time-delay are discussed following.
3.1. Model identification
In (Keyvan-Ekbatani et al., 2012), a nonlinear continuous-time control design model of the protected network was developed based on physical considerations (using the travel time of gated flow, the conservation equation and the NFD). Eventually, the model was linearized around the nominal operation point (corresponding to ˆTTS ), resulting in a first-order time-delay dynamic system as follows:
g d dTTS t A TTS t B q t B q t (4)
where -quantities reflect corresponding deviations from nominal values; 1cT A is a time constant; B and B are the model gains; and and d are time-delays. Model (4) can be converted in discrete time (with sample time T) by use of standard formulas (Seborg, et al., 1989) as follows:
g d d1TTS k TTS k q k m q k m (5)
where we have ln 1 ;A T T B T and B T ; and mT , d dm T , with m , dm integers. According to well-known Control Engineering principles, the derived model structure in (5) is sufficient for
selecting an appropriate feedback controller structure (in this case, a PI-type regulator, see Section 3.2), even without knowledge of the involved parameter values. The choice of the regulator parameters could then be effectuated manually, via trial and error. In contrast, if the parameter values of model (5) are known for a specific application, then the regulator parameters could be specified immediately, based on appropriately derived regulator design rules (Table 1). This Section 3.1 describes how to obtain the values of the model parameters in (5) for a specific application; while Section 3.2 develops and presents the design rules.
The derivation of an appropriate model for the control design purpose is called model identification. In Control Engineering, the field of System Identification uses statistical methods to build mathematical models of dynamic systems or to estimate the parameter values of available model structures from measured data (see, e.g. Ljung, 1987). System Identification also includes the optimal design of experiments for efficiently generating informative data for fitting such models as well as model reduction and other relevant tasks.

657 Mehdi Keyvan-Ekbatani et al. / Transportation Research Procedia 7 ( 2015 ) 651 – 668
In the present context, we need to develop an estimation procedure for the parameters of model (5) by use of measurements of the involved quantities, so as to enable a ready design of the gating feedback regulator. Measured values for TTS k and gq k for a number of cycles k=1,…, K, may be assumed to be available, since they are needed for the operation of the feedback regulator. Note that, due to model linearization, the measured values should be collected so as to be in a neighborhood of the nominal conditions. Since the desired set-point ˆTTS is also given, we may obtain corresponding values for ˆTTS k TTS k TTS , k=1,…, K; on the other hand, the exact corresponding nominal values for gq and dq are not known. A reasonable assumption is to calculate these values as averages, i.e.,
g g1
1 K
k
q q kK
(6)
d d1
1 K
k
q q kK
(7)
Using gq from eq. (6), we may derive values for g g gq k q k q , k=1,…, K. However, there are no measurements available for the uncontrolled inflows dq . Hence, as an approximation, we may use a constant term in place of dq k in eq. (5); this constant term could be taken equal to the average of dq k ; which, in view of eq. (7), turns out to be zero. In other words, we are assuming that the uncontrollable inflows reflected in dq k do not exhibit strong variations near the nominal operation state; model inaccuracies resulting from this assumption act as disturbances to be rejected by the feedback regulator.
In conclusion, the parameter estimation procedure is carried out to specify appropriate values for and for the system
in1TTS k TTS k q k (8)
based on available data for TTS k and inq k as explained above. These data may be field data, in case of a field application, or simulation-based data, as in this paper. The pursued parameter estimation procedure is essentially a regression or curve fitting one, using least squares.
Generally, the method of least squares assumes that the best-fit curve of a given type is the curve that has the minimal sum of the deviations squared (least-square error) from a given set of data. Suppose that the data points are
1 1 1, y ,x z , 2 2 2, ,x y z , …, , ,K K Kx y z where x and y are the independent variables and z is the dependent variable. In our case, the fitting curve is linear in the parameters and has the deviation (error) e from each data point, i.e., 1 1 1 1e z R x S y , 2 2 2 2e z R x S y , …, K K K Ke z R x S y . According to the method of least squares, the best fitting curve has the property that:
22 2 2 21 2
1 1
Min...
,
K K
K i i i ii i
e e e e z R x S yR S
(9)
To derive R and S (i.e. the model parameters) we have to solve the system of equations
2 2
1 1 1 1 1 1 1 12 2
2 2 2 2
1 1 1 1 1 1
K K K K K K K K
i i i i i i i i i i i i i ii i i i i i i i
K K K K K K
i i i i i i ii i i i i i
x y y z y x z x y z x y x zR S
x y x y x y x y (10)
In the case of our time-delay system (5), we have 1z TTS k , x TTS k and gy q k m where mis the time-delay. Since the least-squares procedure does not deliver best values for the time-delay m, the parameter

658 Mehdi Keyvan-Ekbatani et al. / Transportation Research Procedia 7 ( 2015 ) 651 – 668
estimation problem (for R and S ) should be solved multiple times, for 1,2,...m ; the best obtained value for leads to the desired parameters. Consequently, , and m may be derived and be used for the control design problem which is presented in the next section.
3.2. Controller design
The control objective in this study is to regulate the TTS (number of vehicles) in the PN, so as to maintain it around a selected set-point ˆTTS , via appropriate manipulation of the gated flow gq in real time. The targeted set-point ˆTTS should be selected within the range of critical values (i.e. yellow region in Fig. 1), in order to avoid throughput degradation. As mentioned earlier, Keyvan-Ekbatani et al. (2012) developed a control design model and an appropriate feedback controller for the described gating task. Given the derived model structure (5), the following proportional-integral-type (PI) feedback controller is appropriate
g g P Iˆ1 1q k q k K TTS k TTS k K TTS TTS k (11)
where gq is the gated flow ordered by the controller, PK and IK are the proportional and integral gains, respectively. In case gating is applied at multiple junctions (as in this work), the flow ordered by (11) must be distributed among the gating positions (as illustrated in Fig. 3) via one, out of several possible, pre-specified policies (e.g. according to the respective saturation flows in this work). The regulator is constrained between maximum and minimum values. Beside this, upper and lower flow bounds are specified also for every individual gated link. If the regulator flow distribution is found to violate some of these individual bounds, then the surplus flows are re-distributed among the rest of the gated links. Note that gating is activated only within specific time windows (e.g. at the peak periods) or if some real-time measurement-based conditions are satisfied. Finally, the distributed flow to the gated links must be converted to appropriate green times, and the usual traffic signal settings in the corresponding junctions must be modified accordingly.
Generally, for good regulator gain values, either manual fine-tuning or some appropriate design rules may be utilized. It should be emphasized that feedback regulators are quite robust to moderate model parameter value changes. There are several practical design rules available to specify appropriate regulator gains for representative linear design models in a continuous-time setting. Such rules, however, seem to be lacking in the case of discrete-time systems; hence, we have developed a set of practical rules for the present general problem, which are summarized in Table 1. Specifically, for any real or simulated gating control problem, one needs first to gather measurements and estimate the model parameters , and m , as detailed in Section 3.1. Based on these values, Table 1 delivers appropriate regulator gains PK and IK for the PI regulator (11). With this understanding, readers who are not familiar or not interested in the derivation of the entries of Table 1, may proceed directly to the next section.
The z-transform function (i.e. a function which converts a discrete-time signal into a frequency domain representation; It can be considered as a discrete-time equivalent of the Laplace transform) of the process (5) is
mP zz z
(12)
Table 1 Different values for KP and KI according to different time-delays (m)
m KP KI 0 / (1- )/
1 /(3 ) (1- )/(3 )
2 /(5 ) (1- )/(5 )
3 /(6 ) (1- )/(6 )
>3 /(2m ) (1- )/(2m )

659 Mehdi Keyvan-Ekbatani et al. / Transportation Research Procedia 7 ( 2015 ) 651 – 668
while the PI regulator (11) z-transform function is
P
P I P ''1 1
Kzz K K K KC z Kz z
(13)
where P I'K K K . By closing the loop with C (controller) from (13) and P (process transfer function) from (12) we have the
following z-transform function for the closed-loop system:
P
P
''1
1'1 '
1
m
C
m
KzKK
z z zC z P z
F zKC z P z zKK
z z z
(14)
For 0m , the corresponding values of Table 1 lead to 1CF z z , i.e. to the fastest possible (dead-beat) control design, as also stated in (Keyvan-Ekbatani et al, 2012). Considering the time-delayed case ( 0m ), a usual control design step, which reduces the complexity (polynomial) of the closed-loop transfer function ( CF ), is to specify the zero of the controller to be equal to the pole of the process, i.e. to set P 'K K , which consumes a first degree of freedom in the control design. With this choice, the closed-loop transfer function (14) simplifies to
'1 'C m
KF zz z K
(15)
The closed-loop transfer function (15) is identical with the one considered in Section 3.3 of (Papageorgiou and Messmer, 1985), and hence, we can use the design rules of (Papageorgiou and Messmer, 1985) to specify the second degree of freedom for our PI regulator for 0m . Specifically, Figure 5 of (Papageorgiou and Messmer, 1985) delivers the value of a parameter as a function of DT T . The correspondence between these quantities and our notation is Dm T T and 'K m . Thus, for any 0m , we can use Figure 5 of (Papageorgiou and Messmer, 1985) to obtain the corresponding value of and hence of 'K . This value, combined with our above choice
P 'K K , deliver the regulator parameter values displayed in Table 1. For sufficiently long time-delays (i.e. 4m ), an alternative control design procedure for our discrete-time
regulator is to consider a PI regulator design for the continuous-time system (4). Then, applying the well-known Chien et al. (1952) rules to this system, we obtain very similar values for PK and IK as in Table 1. This confirms the pertinence of the previously derived rules, by use of a different design approach, for the cases with 3m . Conducted simulations with different time delays m also confirmed the pertinence of the derived general rules of Table 1, which can be used as a black-box procedure in any related practical application.
4. Test-bed description
Chania, located at the north-western part of Crete, Greece, is the capital of the prefecture of Chania and covers 12.5km2. Chania is the second biggest prefecture of Crete in size, population and development. Fig. 4 displays a

660 Mehdi Keyvan-Ekbatani et al. / Transportation Research Procedia 7 ( 2015 ) 651 – 668
satellite view of the trial Chania urban road network which consists of 27 and 29 signalized junctions for the green-colored and (green + dashed blue)-colored networks, respectively. Many links in that network consist of only one lane, which means that unexpected events (accidents, double-parking, etc.) may block the link and therefore deteriorate the traffic conditions, even if their duration is only a few minutes. Heavy congestion problems are emerging on the entire network during the rainy days when there is an excessive inner and outer demand, that cannot be sustained by the network’s infrastructure. Heavy congestion problems are emerging, also, during the tourist summer season.
The region indicated by (green + dashed blue) in Fig. 4, is modelled in the AIMSUN microscopic simulation environment (TSS, 2008) according to Fig. 5. The central business district (CBD) of the Chania urban road network, where the congestion usually starts during the peak period, is considered as the protected network (PN) (specified by red bold line in Fig. 5), i.e. the urban network part to be protected from degradation due to over-saturation via appropriate gating actions at upstream links. Specifically, seven gating links are indicated by arrows in Fig. 5, three of them located at the border of the protected network (i.e. gated junctions 4, 6 and 7); and the four other located further upstream of the PN (i.e. junctions 1, 2, 3 and 5). This is an extended part of the Chania urban road network compared to (Keyvan-Ekbatani et al. 2012; 2013), the extension essentially consisting of the dashed blue network in Fig. 4 and Fig. 5. In the middle of every link inside the red border line (Fig. 5), a (emulated) loop detector has been installed, and the related measurements are collected at every cycle T (in this case 90 s). To reduce the risk of obstructing the upstream junctions, the gated links are selected to provide sufficient space for potential queuing.
Multiple origins and destinations (O-D) are introduced at the network boundaries and at internal network locations, including the PN area, and are indicated by small circles in Fig. 5. The internal O-Ds mimic various corresponding in- and outflows, including on-street and off-street parking arrivals and departures, that may partially affect the PN area. When running the simulation with an O/D Matrix, a route choice system distributes the vehicles over the different paths from each origin to each destination. The distribution per path depends on the cost of each link that is part of the path. The cost of each link depends on the cost function associated to it. The default cost function in AIMSUN is travel time (selected also in this paper), but other cost functions for specific situations like tolls or, for instance, cost functions that take into account other factors, like the psychological weight of low speeds, can be selected. A time step of 30 s is chosen as the route choice period in this study. This means that the route choice distribution is updated every 30 s while AIMSUN is running. In summary, AIMSUN’s embedded real-time
Fig. 4 Satellite view of Chania urban network and the territory modeled in AIMSUN (shown by green + dashed blue); dashed blue: extendedcompared to (Keyvan-Ekbatani et al., 2012).

661 Mehdi Keyvan-Ekbatani et al. / Transportation Research Procedia 7 ( 2015 ) 651 – 668
dynamic traffic assignment (routing) option is activated, as this is deemed to lead to a more realistic distribution of the demand within the network. AIMSUN offers several different route choice models. Logit type models are among the most popular route choice models. Based on discrete choice theory, Logit models assign a probability to each alternative path between each origin-destination. In this study, C-Logit model is chosen, which is able to take the network topology into account and allows for alternative routes with little overlapping. The C-logit parameters are 0.15 and 1 for and , respectively.
In particular, if gating measures create long queues and delays at the gated links, alternative routes (if available) may be selected by the drivers towards their respective destinations; clearly, this reflects the medium-term routing behaviour of drivers to any introduced gating measures. Note that this diversion may jeopardize to some extent the intended gating impact if drivers divert and enter the PN via non-gated links; therefore, the choice of gating links should also consider the availability and potential attractiveness of alternative routes that bypass the gating location.
The real peak-hour fixed-time signal plan of the Chania urban road network is applied in the simulations without gating. This plan is modified at the gating junctions when real-time gating actions are present, by modifying accordingly the involved signal stage durations. Specifically, the gating strategy determines the duration of one (gated) signal stage (within pre-specified bounds) in real-time; any (positive or negative) deviation of this stage duration from its fixed-time value is assigned to other stages of the same junction.
5. Simulation results
Due to the stochasticity of the microscopic simulator AIMSUN, different simulation runs (replications) with different random seeds may lead to different results. Considering the stochastic and chaotic behavior in real traffic networks, small changes in initial or intermediary conditions may lead also to different outcomes. Here, 18 replications (with different random seeds) for each investigated scenario (8 to 12 repetitions might be enough for a high level of confidence; see Dowling et al., 2004) have been carried out and then the average value of the 18 runs for each performance index is calculated (see Table 2). Three performance indexes are used here (as provided by AIMSUN): the average vehicle delay per km, the mean speed and the total number of vehicles that exit the network. Note that these indexes are provided for the entire Chania urban network (not only the PN), thus the delays at the gated links are actually included in the performance indexes.
5.1. NFD of simulated PN
Fig. 6(a) and (b) display the complete operational NFD (90 s cycle-based measurement points) obtained for the PN of Fig. 5 for the loading (first 2 hours) and the whole (i.e. 4-hour) AIMSUN simulation period (including the network recovery period, indicated by +), respectively. As pointed out in Section 4, the DTA-based routing is
Fig. 5 Chania urban network modelled in AIMSUN, blue dashed line extended compared to (Keyvan-Ekbatani et al., 2012)

662 Mehdi Keyvan-Ekbatani et al. / Transportation Research Procedia 7 ( 2015 ) 651 – 668
activated during the simulation runs; different replications (each with different random seed in AIMSUN) of the 4-hour scenario were carried out and are included (the bold pink NFD represents the fitted curve to measurements of simulation runs for the loading period) in Fig. 6. A trapezoidal traffic demand profile, starting from very low values and increasing gradually to levels that result in congestion within PN (as under typical real traffic conditions at the peak periods) is introduced to the network; ultimately, the demand is gradually reduced, until the network is virtually emptied at the end of the simulation (see Fig. 6(b)). Fig. 6(a) demonstrates that a fundamental diagram (asymmetric inverse-U shape) is indeed occurring during the 2-h network filling period, with low scatter even across different replications; Fig. 6(b) indicates that the inverse-U shape appears also during the decreasing demand period of 2 h, albeit with a visible hysteresis compared to the filling 2-h period. The maximum TTD values in the diagram occur in a TTS region of 500 to 800 veh·h per h. These phenomena may be exploited for gating control by maintaining the TTS in the aforementioned range, so as to maximize the throughput in the PN. An uncontrolled TTS is seen to lead to the decrease of TTD (and hence of the PN throughput), if the optimal range of TTS is exceeded.
5.2. Non-gating case
As pointed out before, the traffic signal plan in the non-gating case is set according to the fixed-time signal settings utilized in the real Chania network during the peak period. Table 2 presents the average and standard deviation (S.D.) of the 18 simulations runs for each index. The standard deviation is considered as an index of reliability of the traffic conditions over different runs of simulation. It is observed that the non-gating scenario leads to high S.D. for both delay and mean speed, i.e. 80 (s/km) and 2.0 (km/h), respectively.
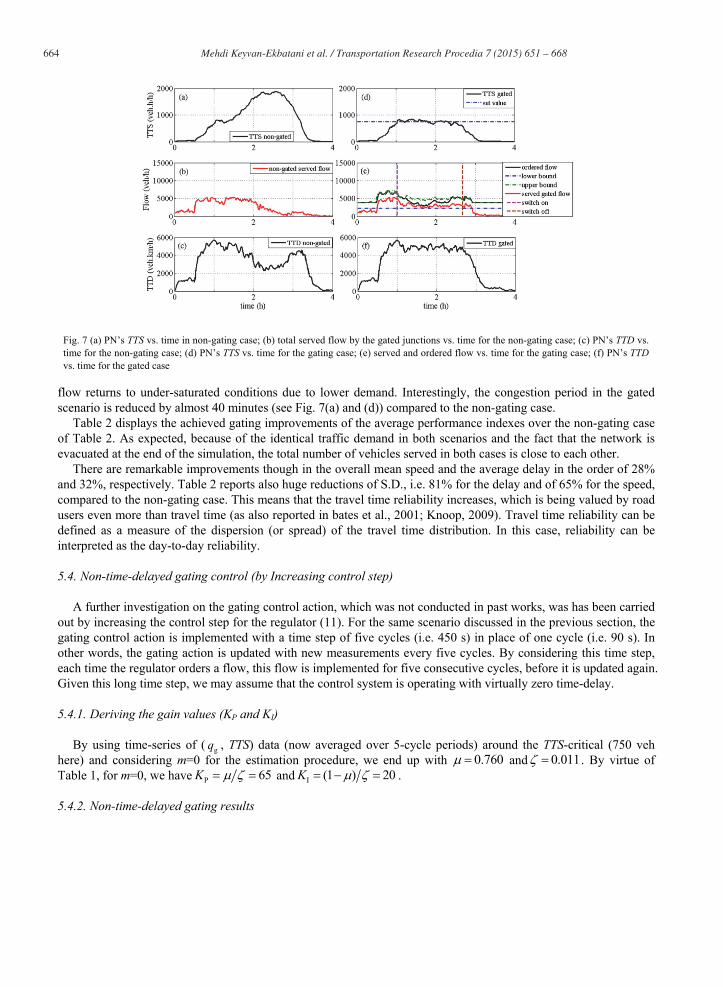
The detailed results of one specific replication are displayed in Fig. 7, for an illustrative comparison of the non-gating versus gating cases. Fig. 7(a) and (d) display the PN’s TTS; while the total flow served by the gated junctions (from the 7 gated links) gq and the PN’s TTD are shown in (Fig. 7(b) and (e)) and (Fig. 7 (c) and (f)), respectively. Focusing on the left column of Fig. 7 (i.e. (a), (b), (c)), with increasing demand, all three displayed quantities are gradually increasing, as typical in under-saturated conditions. At time = 0.6t h, the increased demand leads to the observed surge of TTS and TTD, the latter reaching soon capacity values according to Fig. 6 (a), while the former is traversing the aforementioned critical region of [500, 800]. As the demand keeps increasing, TTS continues to increase and reaches very high values (2000 veh·h per h); as a consequence, link over-spilling and gridlock phenomena appear in the PN and lead to a sudden drop in TTD values (see Fig. 7 (c)), that are persisting until about
2.6t h; eventually, in the period [2.6h,3.3h]t , TTD increases again thanks to the reduced congestion due to the decreasing demand at the end-stage of simulation.
5.3. Time-delayed gating control
In this section, the simulation results while applying the gating control strategy to the same Chania network as for the non-gating case are presented. The set-point for the regulator may be taken from the NFD displayed on Fig. 6.
Fig. 6(a) NFD for loading PN for all replications; (b) NFD for loading and unloading for all replications (the pink bold line is the fitted curve to the scatterplot in (a)

663 Mehdi Keyvan-Ekbatani et al. / Transportation Research Procedia 7 ( 2015 ) 651 – 668
Specifically, the utilized ˆTTS value is 750 veh h per h. The utilized regulator parameters PK and IK were derived as in section 5.3.1.
5.3.1. Deriving the gain values (KP and KI)
The applied regulator parameters PK and IK were first obtained by following the least-square estimation procedure of Section 3.1 with time-series of ( gq , TTS)-data around the TTS-critical (750 veh.h/h) and considering
3m . To specify m , the longest path from the remote gating positions (i.e. junctions 1, 2, 3 and 5 in Fig. 5) to the PN was found. The distance from junction 5 to the PN border is about 900 m which, by considering an average speed of 12 km/h (including waiting times at three signalized junctions in-between and the congestion occurring in this path during the peak period) for the vehicles traveling to the PN, leads to a value of 270 s as the travel time of a vehicle to reach the PN. Consequently, the gating action may face a delay of up to 270 s, or three signal cycles, to reach the PN. This time-delay of m=3 was considered first in the least-squares procedure. Thus, in the first step, the model (5) parameters were estimated to 0.769 and 0.012 ; and by applying Table 1 for 3m we derive
P 10K h-1and I 3K h-1. In cases where the gating positions are located at different distances from the PN (as in this study), the aforementioned procedure might turn out to be conservative, because, the longest travel time to the PN is considered as the time-delay of the system. Moreover, the farthest gating junction may not be the most influential among the other gating positions, since this depends highly on the demand profile and the flow which is served in that gated junction. Thus, one may use the full method discussed in Section 3.1, and carry out the estimation procedure for different values of m; then we obtain for 1m : 0.812 , 0.023 and 29429 ; for
2m : 0.781, 0.027 and 33704 ; for 3m : 23674 and the aforementioned values for and . Consequently, the minimum value for is derived indeed from the parameter estimation with 3m .
5.3.2. Time-delayed gating results
Fig. 7 (second column) displays the results for the gated case (same replication as for non-gating), which can be directly compared to the non-gating results displayed in the first column of the same figure. Up to around 1.1t h, the traffic conditions are identical as in the non-gating case. When gating is activated (shown by the dashed violet vertical line in Fig. 7(e)), as TTS approaches its set-point ( ˆ 750TTS ), the gating regulator orders lower gating flow values to maintain TTS around its set point, and, as a consequence, TTD is maintained at high levels (see Fig. 7(f)), avoiding the discussed drop of TTD in time period [1.8h,2.6h]t in the non-gating scenario (see Fig. 7 (c)). It is visible in Fig. 7(e) that the served gated flow, shown by the red line, deviates at times from the values ordered by the regulator (shown by the black line). A thorough inspection of the total served gated flow (not shown here) revealed that this gap is mainly due to some specific gated links, whose demands are not always sufficient to create the respective inflows assigned to them. As it was expected, thanks to the chosen feedback structure of the controller, this deviation has virtually no influence on the regulator’s performance for keeping PN’s TTS close to the pre-specified set-point. As we reach the end period of the simulation, TTS is returning to lower values, and the relative difference between the actual and ordered gated flows grows higher, hence gating is switched off, and the traffic
Table 2 Average and standard deviation (S. D.) of performance indexes for non-gated, gated (with time-delay) and gated (without time-delay) along with the improvement results after applying gating for the two control scenarios
Non-gated Gated (Delayed) Gated (Non-delayed)
Indexes Ave. S. D Ave. S. D Ave. S. D
Delay (s/km) 300 80 205 15.1 191.7 13.4
Speed (km/h) 9.9 2 12.6 0.7 13.2 0.6
Vehicles out 12800 - 12800 - 12800 -
Changes (in %)
after
Gating
Delay (s/km) - - -31.7 -81.1 -36.8 -83.2
Speed (km/h) - - 28.3 -65.0 34.8 -70.0
664 Mehdi Keyvan-Ekbatani et al. / Transportation Research Procedia 7 ( 2015 ) 651 – 668
flow returns to under-saturated conditions due to lower demand. Interestingly, the congestion period in the gated scenario is reduced by almost 40 minutes (see Fig. 7(a) and (d)) compared to the non-gating case.
Table 2 displays the achieved gating improvements of the average performance indexes over the non-gating case of Table 2. As expected, because of the identical traffic demand in both scenarios and the fact that the network is evacuated at the end of the simulation, the total number of vehicles served in both cases is close to each other.
There are remarkable improvements though in the overall mean speed and the average delay in the order of 28% and 32%, respectively. Table 2 reports also huge reductions of S.D., i.e. 81% for the delay and of 65% for the speed, compared to the non-gating case. This means that the travel time reliability increases, which is being valued by road users even more than travel time (as also reported in bates et al., 2001; Knoop, 2009). Travel time reliability can be defined as a measure of the dispersion (or spread) of the travel time distribution. In this case, reliability can be interpreted as the day-to-day reliability.
5.4. Non-time-delayed gating control (by Increasing control step)
A further investigation on the gating control action, which was not conducted in past works, was has been carried out by increasing the control step for the regulator (11). For the same scenario discussed in the previous section, the gating control action is implemented with a time step of five cycles (i.e. 450 s) in place of one cycle (i.e. 90 s). In other words, the gating action is updated with new measurements every five cycles. By considering this time step, each time the regulator orders a flow, this flow is implemented for five consecutive cycles, before it is updated again. Given this long time step, we may assume that the control system is operating with virtually zero time-delay.
5.4.1. Deriving the gain values (KP and KI)
By using time-series of ( gq , TTS) data (now averaged over 5-cycle periods) around the TTS-critical (750 veh here) and considering m=0 for the estimation procedure, we end up with 0.760 and 0.011. By virtue of Table 1, for m=0, we have P 65K and I (1 ) 20K .
5.4.2. Non-time-delayed gating results
Fig. 7 (a) PN’s TTS vs. time in non-gating case; (b) total served flow by the gated junctions vs. time for the non-gating case; (c) PN’s TTD vs. time for the non-gating case; (d) PN’s TTS vs. time for the gating case; (e) served and ordered flow vs. time for the gating case; (f) PN’s TTD vs. time for the gated case

665 Mehdi Keyvan-Ekbatani et al. / Transportation Research Procedia 7 ( 2015 ) 651 – 668
Table 2 displays the average simulation results for the non-time-delayed gating. Interestingly, the results indicate similar efficiency compared to the simulation results in the previous section. It should be emphasized that this is an important finding, especially for the case of real-field implementation; as it demonstrates that, for efficient gating control, the control action can be executed even with a bigger time step. According to Table 2, significant improvements in the overall mean speed and the average delay in order of 35% and 37%, respectively, have been achieved.
The results of the non-gated (first column) and gated scenario (second column) are demonstrated in Fig. 8 for the same replication as in sections 5.2 and 5.3. The first column was discussed in detail in the previous section. The second column displays the results for the 5-cycle gated case (same replication as for non-gating), by considering the aforementioned parameters in the regulator’s equation. As expected, the regulator attempts to maintain the TTS of the PN (see Fig. 8(d)), close to the pre-specified set-value (i.e. 750 veh.). After activation of gating control (shown by the dashed violet vertical line in Fig. 8(e)), as TTS approaches its set-point, the gating regulator orders lower gating flow values (2200 veh./h) to keep TTS around its set point, and, as a consequence, TTD is maintained at high levels (see Fig. 8(f)). Since the control step is five cycles in this case, the activation of the gating strategy starts slightly later than in Fig. 7. However, the controller acts perfectly and keeps the TTS pretty close to the critical value.
5.5. Discussion
The main objective of this research is designing a feedback controller for a time-delayed traffic system. Perimeter control in the existing literature has been applied only at the border of PN. Due to the restrictions mentioned before, gating may not be always possible to be deployed at the border of the PN. In other words, remote gating may be a necessity (not a deliberate choice), and this article proposes a comprehensive theory for successfully addressing it.
To demonstrate that the designed controller works efficiently even in the most complex scenario, in the case study, we have chosen 7 gating positions with different distances from the PN. In other words, the gated vehicles experience different values of delay (i.e. from 0 to 3 time steps), since there is combination of at the boundary and further upstream gated junctions. For deriving the gain values of the controller, two different methods are proposed in the paper. One is completely independent of the different time-delays at gating points and is based on the procedure discussed in section 3.1. The second method takes the link with the longest distance into account (for more details see section 5.3.1). The term m can be indeed dependent on the traffic state upstream of the border of PN. For example, if the junctions at the perimeter of the PN experience spillback, the gated flow arrived at the PN border may be served with an extra delay caused by the spill-over. This may indeed temporarily change the actual time delay, but, if the
Fig.8 Results of gating with bigger control steps: (a) PN’s TTS vs. time in non-gating case; (b) total served flow by the gated junctions vs. time for the non-gating case; (c) PN’s TTD vs. time for the non-gating case; (d) PN’s TTS vs. time for the gating case; (e) served and ordered flow vs. time for the gating case; (f) PN’s TTD vs. time for the gated case

666 Mehdi Keyvan-Ekbatani et al. / Transportation Research Procedia 7 ( 2015 ) 651 – 668
changes are not excessive, the control results will not change dramatically thanks to the inherent robustness of the regulator.
As discussed earlier, the NFD experiences some scatter due to the special distribution of vehicle density in the network and generally because of heterogeneously distributed congestion. Implementing the gating control strategy may reduce the scatter and hysteresis slightly, since the PN will be at the capacity level and possible gridlocks are avoided. But considering the fact that the PN operates under fixed-time signal control, the network may still experience heterogeneity in distribution of congestion (see Fig. 9). In an ongoing research we are working on a hybrid traffic control strategy (i.e. perimeter control along with a traffic-responsive signal control within the PN) which may lead to a more homogeneous traffic condition within the PN. Stability and convergence issues related to NFD modelling and control are discussed in (Gayah and Daganzo, 2011 and Haddad and Geroliminis, 2012).
To shed more light on the performance of the network, we applied the Total Time Spent (TTS) as a performance index and compared the TTS of the PN and the overall network after applying the gating strategy (time-delayed) with the non-gating scenario. As expected, the improvement of TTS in the PN was significantly higher than the TTS of the overall network (i.e. 36% and 24% respectively).
The results in the previous sections indicate that using longer sampling times in the feedback gating concept leads to similarly good results as for the one-cycle time steps. As a matter of fact, the achieved results with a longer sampling time were even found slightly better in average in the present investigation. It is quite difficult, given the complexity of the traffic network, the multiple gating points and multiple replications, to identify any possible systematic (non-random) reasons for this slight average improvement in the specific experiment. More experiments with different networks, traffic conditions and gating locations may lead to a better understanding of the implications of longer time steps in the gating actions, but the present results indicate that no sensible deterioration of the control quality should be expected in case of longer sample times, despite the associated lower frequency of real-time information provision to the gating regulator.
6. Conclusion
This study demonstrated that efficient feedback-based gating control may be applied not only at the boundary, but also further upstream of the PN. Based on restrictions which might be faced for implementing gating control at the perimeter of the PN in different urban networks, such as unavailability of proper links to store the gated vehicles (queuing) or sufficient number of signalized junctions, the traffic may be also metered at some junctions remote from the border of the PN. For the gating procedure in this study, the recently proposed feedback gating concept (Keyvan-Ekbatani et al., 2012) is employed by exploiting the operational NFD of the PN.
General procedures are proposed for deriving a control design model and estimate its parameters based on measured data; and for selecting proper regulator parameters, without the need for manual testing and fine-tuning.
Fig. 9 NFD after applying remote gating (for time-delayed scenario)

667 Mehdi Keyvan-Ekbatani et al. / Transportation Research Procedia 7 ( 2015 ) 651 – 668
This enables the easy application of the feedback gating concept for a large variety of problem settings and infrastructures. The concept is demonstrated in a realistic simulation environment and significant improvements in terms of mean speed and average delay are achieved by applying the gating strategy.
This paper also demonstrates that the real-time gating action can be executed at a slower pace. In other words, this finding shows that even with a bigger control step (bigger than one signal cycle as in all previous studies), the gating strategy acts efficiently and leads to significant improvements in mean speed and delay at the overall network level. This may be very interesting for the urban traffic management authorities; because it shows that the signal plan can be modified less frequently during the gating action.
Further research directions include queue balancing and management at the gating links, comparison with more comprehensive traffic-responsive signal control strategies and field implementation of the concept.
Acknowledgments
The research leading to these results has been partly funded by the European Commission FP7 program NEARCTIS (Network of Excellence for Advanced Road Cooperative Traffic management in the Information Society) and the Netherlands organization for scientific research (NWO) in the grant "there is plenty of room in the other lane".
References
Aboudolas, K., Papageorgiou, M., Kouvelas, A., Kosmatopoulos, E., 2010. A rolling-horizon quadratic-programming approach to the signal control problem in large-scale congested urban road networks. Transportation Research Part C 18, 680-694.
Aboudolas, K., Geroliminis, N., 2013. Perimeter and boundary flow control in multi-region heterogeneous networks. Transportation Research Part B 55, 265–281.
Aboudolas, K., Zheng, N., and Geroliminis, N., 2014. Perimeter flow control for bi-modal urban road networks. 93th TRB Annual Meeting, Washington, DC, USA.
Bates, J., Polak, J., Jones, P., and Cook, A., 2001. The valuation of reliability for personal travel. Transportation Research Part E 37, 191–229. Bretherton, D., Bowen, G., Wood, K., 2003. Effective urban traffic management and control: Recent developments in SCOOT. 82nd TRB
Annual Meeting, Washington, DC, USA. Buisson, C. and Ladier, C., 2009. Exploring the impact of homogeneity of traffic measurements on the existence of macroscopic fundamental
diagrams. Transportation Research Record 2124, 127–136. Chien, K. L., Hrones, J. A., Reswick, J. B., 1952. On the Automatic Control of Generalized Passive Systems. Transactions of the American
Society of Mechanical Engineers 74, 175-185. Chang, T.H., and Sun, G.Y., 2004. Modeling and optimization of an oversaturated signalized network. Transportation Research Part B, 687-707. Daganzo C. F., 2007. Urban gridlock: Macroscopic modeling and mitigation approaches. Transportation Research Part B 41, 49-62. Daganzo C. F., Geroliminis, N., 2008. An analytical approximation for macroscopic fundamental diagram of urban traffic. Transportation
Research Part B 42, 771-781. Diakaki, C., Papageorgiou, M., Aboudolas, K., 2002. A multivariable regulator approach to traffic-responsive network-wide signal control.
Control Engineering Practice, vol. 10, pp. 183–195, 2002. Dowling, R., Skabardonis, A., Alexiadis, V., 2004. Traffic analysis toolbox volume III: guidelines for applying traffic microsimulation modeling
software. US Departement of Transportation, FHWA report. Farhi, N., 2008. Modélisation minplus et commande du trafic de villes régulières (Ph.D. Thesis). Université de Paris I-Panthéon-Sorbonne, Paris,
France. Gal-Tzur, A., Mahalel, D., and Prashker, J. N., 1993. Signal design for congested networks based on metering. Transportation Research Record
1398, 111-118. Gartner, N.H., Wagner, P., 2004. Analysis of traffic flow characteristics on signalized arterials. Transportation Research Record 1883, 94–100. Gayah, V.V. and Daganzo, C.F., 2011. Clockwise hysteresis loops in the macroscopic fundamental diagram: An effect of network instability.
Transportation Research Part B 45, 643-655. Gayah, V.V., Gao, X., 2014. The effect of adaptive green duration control on the Macroscopic Fundamental Diagram. 93rd TRB Annual Meeting,
Washington, DC, USA. Geroliminis, N., Daganzo, C.F., 2008. Existance of urban-scale macroscopic fundamental diagrams: Some experimental findings. Transportation
Research Part B 42, 756-770. Geroliminis, N., Sun, J., 2011. Properties of a well-defined macroscopic fundamental diagram for urban traffic, Transportation Research part B
45, 605-617.

668 Mehdi Keyvan-Ekbatani et al. / Transportation Research Procedia 7 ( 2015 ) 651 – 668
Geroliminis, N., Haddad, J., Ramezani, M., 2012. Optimal perimeter control for two urban regions with macroscopic fundamental diagrams: A model predictive approach. IEEE Transaction on Intelligent Transportation Systems. vol. 14, num. 1, 348-359.
Geroliminis, N., Zheng, N., Ampountolas, K., 2014. A three-dimensional macroscopic fundamental diagram for mixed bi-modal urban networks. Transportation Research Part C 42, 168-181.
Godfrey, J. W., 1969. The mechanism of a road network. Traffic Engineering. Control 11, 323–327. Haddad, J., Geroliminis, N., 2012. On the stability of traffic perimeter control in two-region urban cities. Transportation Research Part B,46,
1159-1176. Haddad, J., Shraiber, A., 2014. Robust Perimeter Control Design for an Urban Region. Transportation Research Part B 68, 315–332. Helbing, D., 2009. Derivation of a fundamental diagram for urban traffic flow. The European Physical Journal B 70, 229-241. Hunt, P.B., Robertson, D.I, Bretherton, R.D., Royle, M.C., 1982. The SCOOT on-line traffic signal optimization technique. Traffic Engineering
and Control 23, 190-192. Ji, Y., W. Daamen, Hoogendoorn, S., Hoogendoorn-Lanser, S., Qian, X., 2010. Macroscopic fundamental diagram: Investigating its shape using
simulation data. Transportation Research Record 2161, 42–48. Keyvan-Ekbatani, M., Kouvelas, A., Papamichail, I., Papageorgiou, M., 2012. Exploiting the fundamnetal diagram of urban networks for
feedback-based gating. Transportation Research Part B 46 (10), 1393–1403. Keyvan-Ekbatani, M., Papageorgiou, M., Papamichail, I., 2013a. Urban congestion gating control based on reduced operational network
fundamental diagrams . Transportation Research Part C 33, 74-87. Keyvan-Ekbatani, M., Yildirimoglu, M., Geroliminis, N., Papageorgiou, M., 2013b. Traffic Signal Perimeter Control with Multiple Boundaries
for Large Urban Networks, Proc. 16th IEEE Conference on Intelligent Transportation Systems (ITSC 2013), The Hague, The Netherlands. Keyvan-Ekbatani, M., Yildirimoglu, M., Geroliminis, N., Papageorgiou, M., 2015. Multipple Concentric Gating Traffic Control in Large-Scale
Urban Networks. IEEE Transations on Intelligent Transportation Systems, DOI: 10.1109/TITS.2015.2399303. Knoop, V. L., 2009. Road Incidents and Network Dynamics: Effects on driving behaviour and traffic congestion (PhD. Thesis). TRAIL Research
School, Netherlands. Knoop, V.L., Van Lint, J.W.C., Hoogendoorn, S.P., 2012. Routing strategies based on the macroscopic fundamntal diagram. Transportation
Research Records 2315, 1-10. Knoop, V.L., Hoogendoorn, S.P. and Van Lint, J.W.C., 2013. Impact of traffic dynamics on macroscopic fundamental diagram. Presented at the
92nd Annual Meeting of the Transportation Research Board. Lia, Y., Xua, J., and Shena, L., 2012. A Perimeter Control Strategy for Oversaturated Network Preventing Queue Spillback. Procedia-Social and
Behavioral Sciences 43, 418-427. Ljung, L., 1987. System Identification: Theory for the User. Prentice Hall. Lo, H.K., Chang, E., Chan, Y.C., 2001. Dynamic network traffic control. Transportation Research Part A 35, 721–744. Lowrie, P.R., 1982. SCATS: the sydney co-ordinated adaptive traffic system-priciples, methodology, algorithms. IEEE International Conference
on Road Traffic Signalling (67-70), London, England. Luk, J., Green, D., 2010. Balancing traffic density in a signalized network. Austroads Research Report AP-R369/10, Sydney, Australia. Vigos, G., Papageorgiou, M., 2010. A simplified estimation scheme for the number of vehicles in signalized links. IEEE Transactions on
Intelligent Transportation Systems 11, 312-321. Papageorgiou, M., and Messmer, A., 1985. Continious-time and discrete-time design of water flow and water level regulators. Automatica 21(6),
649-661. Putha, R., Quadrifoglio, L., Zechman, E., 2010. Using ant optimization for solving traffic signal coordination in oversaturated networks. 89th
TRB Annual Meeting, Washington, DC, USA. Seborg, D., Edgar, T.F., Mellichamp D.A., 1989. Process Dynamics and Control. New York: Wiley. Strating, M., 2010. Coordinated signal control for urban networks by using MFD (M.Sc. Thesis). Delft University of Technology, Delft, the
Netherlands. TSS transport simulation systems, 2008. AIMSUN User Manual Version 6, Barcelona, Spain. Wang, Y., Papageorgiou, M., Gaffney, J., Papamichail, I., Rose, G., Young, W., 2010. Local ramp metering in random-location bottlenecks
downstream of a metered on-ramp. Transportation Research Record 2178, 90-100. Wood, K., Bretherton, D., Maxwell, A., Smith, K., Bowen, G., 2002. Improved traffic management and bus priority with SCOOT (TRL Staff
Paper PA 3860/02). London, UK: Transport Research Laboratory. Yildirimoglu, M., Ramezani, M., Geroliminis, N., 2015. A rolling horizon approach for route guidance in large-scale networks. 94th TRB Annual
Meeting, Washington, DC, USA.. Zhang, Y., Bai, Y. and Yang, X.G., 2010. Strategy of traffic gridlock control for urban road network. China Journal of Highway Transportation,
23, 96-102.